CATCH 22. Comparison of Trading Methods and Management. Presented to the Market Technicians Association at the CME Club 4/23/03.
|
|
|
- Randolf Daniel
- 8 years ago
- Views:
Transcription
1 CATCH 22 Comparison of Trading Methods and Management Presented to the Market Technicians Association at the CME Club 4/23/03 John Jonelis Copyright 2002 John Jonelis Revised 1/6/04

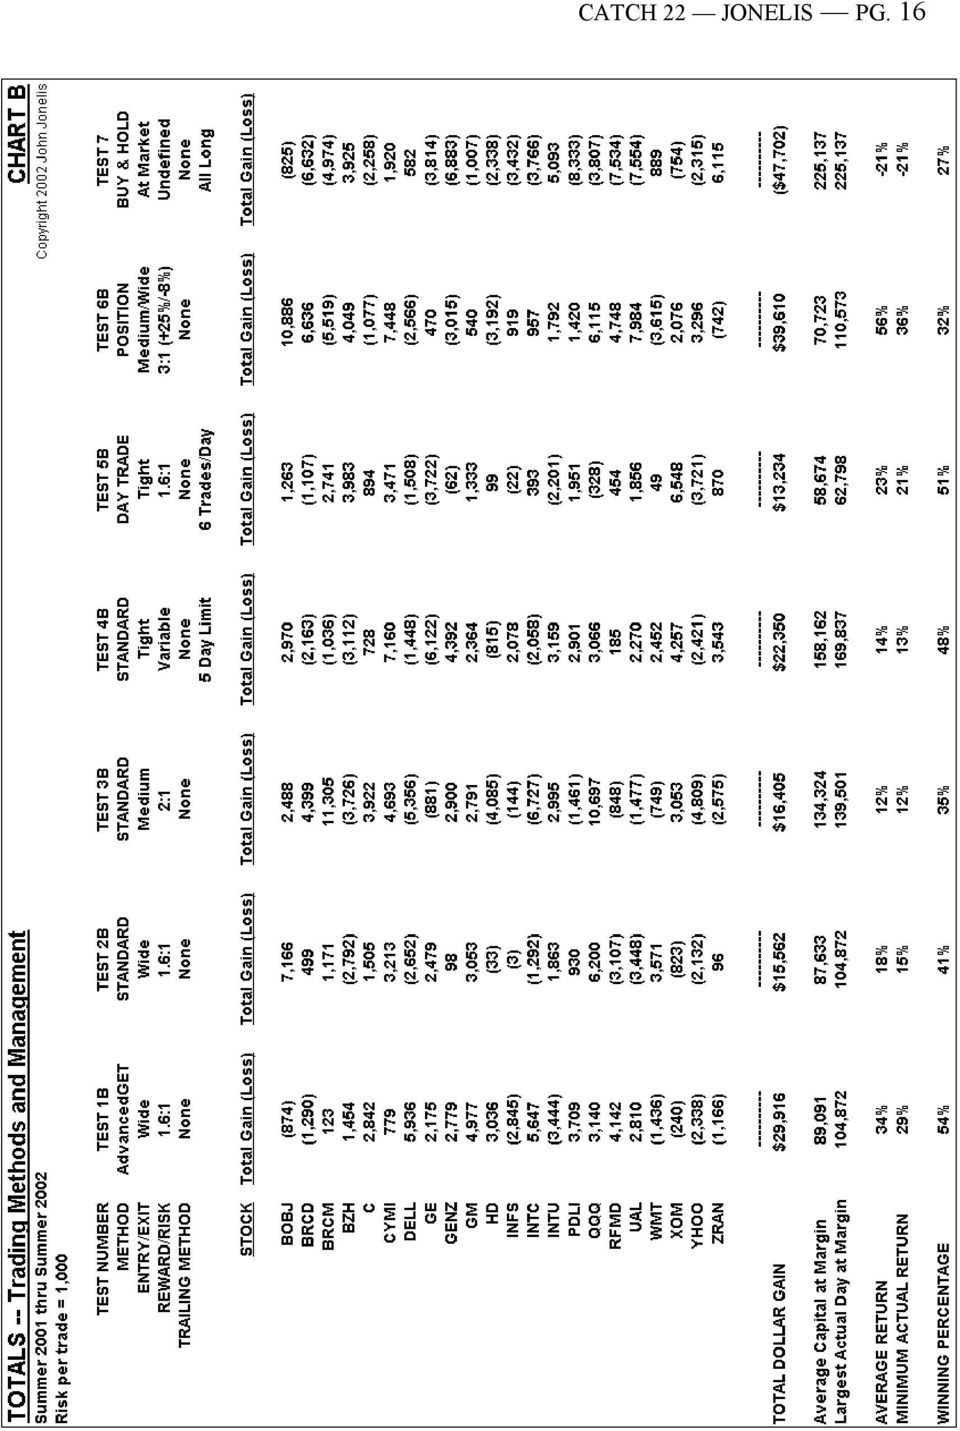
2 CATCH 22 JONELIS PG. 2 SUMMARY The goal of this study is to identify a practical trading system with a reasonable expectation of positive returns year after year, in both up markets and down, executed by the average trader, using end-of-day data. This update is provided in an attempt to answer questions that have cropped up since the report was first released. The same 22 randomly selected stocks were traded over and over, using a number of models, across the same period of time between the summers of 2001 and Many involved in the market will remember this as a dismal period. Most mutual funds showed negative returns. Long-term investors in common stock suffered significant losses. Position traders, medium to short-term swing traders and day traders were cut to pieces by a market that frequently confirmed an entry signal then failed to follow through. Contrary to the general gloom overshadowing the market, twelve of the trading methods tested here proved profitable this, despite the simple, mechanics of the models, all of which were trend following in nature. Each was designed to be systematic rather than intuitive so that results, as far as possible, would depend on the characteristics of the model rather than the skill of the trader, and in the hopes that the experiment could be repeated by others. When comparing results, winning percentage was given greater weight than return on investment, and models were sought that provided a winning percentage of 50% or more and a return on investment of 20% or better. Only four of the twelve successful tests met that standard. Below is an abbreviated table of results. Please refer to Charts A thru D for more detail. MODEL METHOD VARIATION WINNING % AVG. ROI TEST 1A Advanced GET Trailing 54% 46% TEST 1B Advanced GET No trailing 54% 34% TEST 5A Day Trading Trailing 51% 23% TEST 5B Day Trading No trailing 51% 23% TEST 4A Standard Trailing 48% 15% TEST 4B Standard No trailing 48% 14% TEST 2A Standard Trailing 41% 30% TEST 2B Standard No trailing 41% 18% TEST 3A Standard Trailing 35% 17% TEST 3B Standard No trailing 35% 12% TEST 6A Position Trailing 32% 57% TEST 6B Position No trailing 32% 56% TEST 7 Buy-and-Hold n/a (21%) (27%) Each stock was viewed as existing in its own separate world, as if the trader were blind to market, industry conditions, events of the day, and time of year. Better results could no doubt have been achieved by a talented trader, by use of more indicators, by consideration of market swings, or during a less challenging market cycle. However, the goal was to identify a system that would work well in a poor environment, executed by the average trader. To that end, the test year proved an opportune period.

3 CATCH 22 JONELIS PG. 3 The trials were conducted completely independent of any company or organization. They do not rely on computer back testing, but rather, log the results of one trader attempting to meticulously follow a series of mechanical systems. It is hoped that the human element lends richness to the study. Trades were simulated one at a time, using historical stock charts with all future data masked from the trader. To a surprising degree, common emotions, and the pressures of time and uncertainty cropped up just as they would during actual trading. Before examining the details, a few comments are in order: Advanced GET (Test 1A) was the clear standout among the tests in this study. With a winning percentage of 54% and an average return of 46%, it met the goal of consistency and exceeded the target ROI. This result was achieved after one week of familiarization with the software and a hurried week to complete the simulations, during which an entire year s trades were replicated. Several trades failed due to outright errors by the author, and one may ask what results could have been achieved by a more seasoned hand. This was the first model tested and all others were devised in an attempt to beat it. None beat it. Day Trading (Tests 5A and B) yielded a winning percentage of 51%, and a return of 23%. This model represents a most rudimentary form of day trading, since intra-day data was not used. The assumed advantage of day trading is the turnover-rate-of-capital, which theoretically boosts opportunity and therefore ROI. It is possible for a skilled trader to achieve a return similar to that shown in these trials in a week or a month. However, proof of concept and an exploration into the high failure rate among day traders is outside the scope of this report. Standard Swing Trading (Test 4A) required a reasonable understanding of support and resistance to execute. This test yielded a 48% win ratio, third best, but just short of the goal. The return may have proven better given a more complex model, but as it stands, 15% is positive, but unspectacular. Position Trading (Test 6A) gave the highest average return of all models, but proved to be a home run strategy, with only 3 wins out of every 10 trades. It may be worth examining one s psychological stamina and the depth of one s pockets before setting out to implement such a system. The probability of a major account draw down during the working life of a trader appears uncomfortably high. Buy-and-Hold Investing (Test 7) was included in the report, even though it yielded a negative return for the test period. This is a prevalent strategy and any report would be incomplete without the comparison it provides. The inherent assumption in buy-and-hold is that a net positive return will be achieved if a stock is held for a number of years. Because there is no expectation of a positive return every year, the method does not fulfill the objective of consistency, as defined in this report. Though it is true that many have achieved success over the long haul, particularly with time horizons of five years or greater, recent market conditions have shown the risks to be higher than many investors previously supposed. This report is front-loaded so that the reader can absorb the gist of the study in a few pages, then dig deeper when more information is sought. Following this summary, elements of the study are discussed, definitions presented, models described, and trade data laid out.

4 CATCH 22 JONELIS PG. 4 DISCUSSION Common Invalid Assumptions Because the trials were performed by hand, a number of valuable lessons were learned. Several assumptions, which seemed reasonable in the heat of trading, proved not to be true when the data was tallied. One example is the comparison between the A and B series tests. During trading, much opportunity seemed to be lost when half-positions were closed at the target price. Often the remaining half-position reversed at that point and stopped out at break-even. It seemed obvious that closing the entire position at the target would generate more profit. However, once the final results were summed up, the opposite proved to be true. Another example is Test 3A and B, which used a 2:1 reward/risk ratio. Because many positions fell short of target, a trial was made using the same trades, but with a 1.6:1 r/r. The results proved disappointing and are not shown. One test clearly outperformed the others half way through its trial only to fall behind once complete. The conclusion reached is that it is folly to change proven methodology without first testing the validity of one s assumptions. Yet random change is exactly the behavior common among traders. There exist a few talented traders who rely on intuition. For the rest, there remains experimentation, statistical support, and strict adherence to a pre-defined and tested mechanical system. (For more on this topic, see Trading in the Zone by Mark Douglas.) Objectivity On any given day, a trade was taken whenever the stock chart matched the parameters of the model, regardless of the perceived outcome even in the case of an obviously poor decision. All entry and exit decisions were based exclusively on technical indicators selected for the particular model (see Details.) It is believed that sufficient repetitions exist to achieve statistical significance for each data set (see Charts C and D). Stock Selection The 22 stocks were selected by random call. Various individuals were asked to name companies. Those companies were used without prejudice. This method of selection tended, for the most part, to produce a bias toward well-known names with large market capitalization and good liquidity. The following stocks were selected: BRCD, GE, C, RFMD, DELL, WMT, CYMI, UAL, ZRAN, BRCM, GENZ, BZH, HD, YHOO, GM, BOBJ, INTU, INTC, INFS, XOM, PDLI, QQQ. Money Management With few exceptions, trades were allowed to either cross their target price or stop out. The target price and stop loss price were set at a specific reward/risk ratio for each test. Each position was sized in round lots to maintain approximately $1,000 at risk if stopped out. Trailing, or scaling out of winning trades, was employed in the A series tests while in the B series the entire position was closed at the target price (see Definitions.) Other valid money management methods exist, but the comparison of these two distinct methods proved instructive.

5 CATCH 22 JONELIS PG. 5 Data and Software All daily price and volume data as well as standard indicators were from TC-2000 end-of-day version software (Worden Brothers, Inc.) Tests of Advanced GET end-of-day version software (Trading Techniques, Inc.) used their proprietary indicators. (Note Hourly charts and Futures data are also available for end-of-day GET. Subsequent to these tests, Advanced GET has become available from esignal in both end-of-day and intra-day versions.) Order Entry All information was taken from daily not intra-day stock charts, even for day trades. Entries were made using simulated stop-limit orders, as if placed on the evening prior to market-open, and filled or not filled during the regular trading session. Once a setup occurred, entry would be attempted each day, either until the order was filled, or until the setup no longer matched the model. A conditional stop loss order accompanied each entry order so that a trade could stop out on the day of entry. For the purpose of this report, it was also assumed that trades could be executed market-at-open and market-at-close. Positions were opened from 6/1/01 to 6/28/02, and trailed no later than 7/31/02. Commissions and Slippage Commissions and slippage were not factored into the results. Penny-per-share commissions are available at time of writing, and slippage is variable, depending on order execution and liquidity. Stocks chosen for this test trade in large volume and all positions were taken in round lots. Position size, by-and-large, ranged below 1000 shares. A high quality direct access broker was assumed. Therefore, liquidity was not considered a significant factor. Traders dealing in larger lots or in odd lots should adjust the results as appropriate. Frequency of trades is recorded so that an appropriate number can be calculated for the individual situation. (See Charts C and D) Percent Return In order to calculate ROI, it was necessary to make assumptions regarding the size of the portfolio one would need to trade each model. ROI was presented in two ways Average Return and Minimum Return. Raw data is provided so that the reader can determine this in other ways than shown. Average Return (ROI) is the ratio of dollar gain to average total capital outlay, expressed as a percentage. This is probably the better of the two methods used. Average Return represents an estimate of the potential return, because a trader s activities are not confined to the same 22 stocks traded at the same times as in this report. In tests 1, 2, 3, 4, and 6, it was assumed that only half of the entire portfolio was committed at all times. The day trading tests assumed 35% committed. Buy-and-hold, by definition, is 100% invested. Minimum Return (ROI) is the ratio of dollar gain to the largest total capital outlay (largest single daily outlay of the year) expressed as a percentage (see calendars). This yielded the smallest return that could be calculated for each data set. Minimum Return was shown because market conditions tend to favor entries on certain dates. This number represents a conservative trader who stays in cash much of the time. In determining the capital required to execute each strategy, margin appropriate to the method was used as follows: 4:1 for day trade, 2:1 for all multi-day models, and 1:1 for buy-and-hold.
 Order Entry All information was taken from daily not intra-day stock charts, even for day trades.")
6 CATCH 22 JONELIS PG. 6 Comments on Advanced GET Since the software is complex and not widely known or understood, extra space is devoted to it. This study began with an opportunity to preview Daily Advanced GET software, leading to one week learning the system and another week running the simulation. The returns were generated by a somewhat overwhelmed trader, attempting for the first time to use a new system, one hand on the instructions, the other on the keyboard. Simple XTL Breakouts comprised the bulk of the trades. Many of the available features, such as MOB and Ellipse, were not explored at all, and outright errors were made using Type 1 and Type 2 setups. However, with only a rudimentary understanding of the system, it outperformed all subsequent tests. It seems reasonable to assume that a trader more familiar with GET would score higher in all categories. Even so, the return and consistency achieved were remarkable (see Charts A and B.) A number of tests were set up in an attempt to beat the Advanced GET results. To that end, the study has failed. That, however, need not be viewed as a negative result. Daily GET provides a substantial array of technical tools, and may be fairly described as a Ferrari of technical analysis. It plots Elliott Waves directly on the stock chart. The package is elegant and visual. A description of all the available tools is beyond the scope of this report. GET, and anagram for Gann- Elliott-Trader is designed to scan for unique opportunities based on Elliott, and other high-level tools, and provides a concise x-ray of individual charts with specific price projections. The program can be applied as a highly sophisticated companion to the easy-to-use TC TC-2000 is a rapid sorting tool, which quickly organizes thousands of stocks, using basic technical indicators and fundamentals, combined with user-written sub-routines (PCFs). Rapid visual screening can be performed in either program, flipping through hundreds of issues at a sitting. Each package has capabilities not found in the other and they compliment each other well. At time of testing, watchlists and scans created in TC-2000 could be accessed seamlessly in GET. Both ran well on an old laptop computer. Limitations The simulations were conducted by hand, and therefore contain errors and inconsistencies, as one might experience during actual trading. It should be noted that price data becomes stale over time due to splits and other events. For example, shortly after testing was complete, the vendor adjusted the data for Citigroup to reflect the spin-off of Travelers. The subsequent chart looked identical, but the numerical data had changed. This, of course, did not alter the final results of the test. Caution is needed when making predictions based on test results since all that can be known with any degree of certainty is what actually happened to a specific security at a specific time in the past. Though one seeks to glean general insight into the behavior of other securities in other time periods, the limitations of such comparisons must always be respected and all traders should be prepared for the unexpected. There are no guarantees. Ultimately, all analysis is based on assumptions. In this case the assumptions are those of the author at time of testing. This material is not intended as investment advice, but rather as an expression of the experiences of the author, and it is anticipated that others will test these materials for themselves. That said, this report is presented in good faith, in the hope of providing meaningful information.

7 CATCH 22 JONELIS PG. 7 DEFINITIONS Signal Candle All tests were performed using daily candle charts. For those not accustomed to Japanese candles, one candle graphically displays the day s opening, high, low, and closing price. The signal candle (or breakout bar) is the most recent candle (today s history) at the point at which the stock has set up for entry on the following day. In this study, entry, initial stop, and target price as well as position size were calculated, by-and-large, from the signal candle. Entry/Exit Entry/Exit (Stop) is described as wide, medium, or tight, and refers to the confirmation required prior to entry and the wiggle room allowed for the stop. For the purposes of this report, Wide is +50% of the range of the signal candle. Medium is generally an entry >$0.13 away from the high or low of the signal candle. Tight is an entry <$0.05 away from the signal candle. The initial stop is typically referenced to the signal candle, but occasionally set at the nearest fractal when appropriate. Specific numbers are noted for each test. (See Details) Reward/Risk and Target Reward/Risk (r/r) is the ratio between the potential dollar reward should the trade prove successful, and the dollar amount at risk should the trade fail. Most tests used a target, of 1.6:1 (160% of risk) corresponding to a common Fibonocci number, 162%, which is significant, probably because of its wide use by futures traders. Exceptions were Tests 3A and B, which used 2:1 r/r, and Tests 6A and B, which used 3:1 r/r. Each position was sized to maintain approximately a $1,000 total risk per trade, using the formula (presented by Sammy Chua): [Q = 1000/(p-s)] where Q is share quantity, p is entry price, s is the stop price. The actual position size was then adjusted to the nearest round lot using standard rounding methods. Trailing at Fractal Trailing is a disciplined method of scaling out of a winning position in defined portions. A fractal, as defined in this report, is meant as a pullback in price to form minor support followed by a breakout through minor resistance. (The opposite applies for a Short.) For example, in a winning Long position, ½ of the position was closed at the target and the stop price moved to break even. When a new minor support level was established and a breakout occurred (a fractal) the stop was moved near the new support level. Please note the stop was moved only after the fractal was fully formed by a new high. Trailing Tight Test 3A used a tighter trailing method trailing by candle. For example, in a winning Long position, ½ of the position was closed at the target and the stop was placed near the low of the prior day s candle. A certain degree of variation was allowed using this method. EMA Trend Long or Short entry points (in Tests 2 thru 6) were defined by exponential moving averages of price (EMA). Entry was allowed only if the EMAs were positioned as follows (from Sammy Chua): [LONG ENTRY] IF [10 EMA > 20 EMA > 50 EMA] ELSE [NO ENTRY] [SHORT ENTRY] IF [50 EMA > 20 EMA > 10 EMA] ELSE [NO ENTRY]

8 CATCH 22 JONELIS PG. 8 Pullback or Bounce Entry (for Tests 2 thru 6) was by trend pullback. This is an orderly price reversal, setting up a continuation-of-trend. Pullback is defined as lower highs following a bull run. Bounce is defined as higher lows following a bear run. The following price action was required: [LONG ENTRY] IF [MINIMUM 3 DAYS OF PULLBACK] [SHORT ENTRY] IF [MINIMUM 2 DAYS OF BOUNCE] Stochastic Oscillator A widely used oscillator to determine an overbought or oversold condition. Normally, price reversal occurs when the oscillator crosses the 20% or 80% line, then changes direction, or when the %K line crosses the %D line (fast crossing slow). But these were trend-following models and an oscillator, while useful in defining pullbacks, is best applied when trading a range. For the purposes of these trials, anticipatory entries were taken opposite the direction of the oscillator if and only if both lines had pulled back 50% (reversal imminent). By this method, the oscillator was used, not to confirm the merit of an entry, but rather, to restrict entry and create objectivity for each test. This was important because the same stocks were traded over and over. Parameters were set to industry norms [8-3-3]. False Bar Stochastic (In Advanced GET) A Stochastic oscillator with the addition of a Bar which alerts the trader to ignore the overbought/oversold indication. This tool allows entry into strong trends which otherwise would have been disallowed by the common use of the oscillator. FB Stochastics can be used in an XTL continuation trade to confirm entry when a False Bar appears in the direction of major trend with subsequent pullback of the oscillator to the opposite extreme. The algorithm is proprietary. OB/OS lines were 75/25. Parameters were set to Advanced GET recommendations [12-3-3]. Elliott Wave Theory (in Advanced GET) An alternate way of viewing the price cycle. The cycle is seen in 5 saw-tooth price runs (waves) after which the major trend reverses. Elliott waves are automatically plotted directly on the stock chart, once a Wave 3 is detected. Advanced GET wave counts may differ from theoretical Elliott methods. Elliot Oscillator (In Advanced GET) The oscillator is the difference between two moving averages, displayed as a histogram referenced by a zero point (much like MACD), and is used to confirm Type 1 and Type 2 entries. Parameters are set to [5,17], [5,35], and [10,70] to identify the action of short, medium and long term players. [5,35] is considered standard. Regression Channel (In Advanced GET) A linear regression line with an Envelope Channel set at +2 Standard Deviations. The regression automatically calculates off the lows in an uptrend and the highs in a downtrend. The channel is drawn through a Wave 4 or 5, and price closing outside the channel is used as confirmation for Type 1 and Type 2 entries. PTI (In Advanced GET) The Profit Taking Index is a number displayed when a Wave 4 is identified. A number of 35 or greater indicates the likelihood that the subsequent Wave 5 will culminate in a higher high or lower low.
![The following price action was required: [LONG ENTRY] IF [MINIMUM 3 DAYS OF PULLBACK] [SHORT ENTRY] IF [MINIMUM 2 DAYS OF BOUNCE] Stochastic Oscillator A widely used oscillator to determine an](/docs-images/43/6214190/images/page_8.jpg "overbought or oversold condition. Normally, price reversal occurs when the oscillator crosses the 20% or 80% line, then changes direction, or when the %K line crosses the %D line (fast crossing slow).")
9 CATCH 22 JONELIS PG. 9 MOB (In Advanced GET) The Make or Break predicts support/resistance based on the momentum of a previous swing in the Elliott cycle, and is useful to project the culmination of a Wave 5. As such, MOB can be used to set an initial target in a Type 1 trade, or as confirmation for entry into a Type 2 trade. The indicator is proprietary. At time of testing, the author had not yet explored this tool. Ellipse (In Advanced GET) The Ellipse projects Fibonacci price and time in one indicator, and is useful in confirming the end of a Wave 4 (for Type 1 entries). At time of testing, the author had not yet explored this tool. Type 1 Trade (In Advanced GET) A continuation-of-major-trend play. Type 1 is an entry into the beginning of Wave 5. Pullback of the Elliott Oscillator to zero, a PTI >35, and Ellipse resistance are used as confirmation. Clean setups are sought and the trade is skipped if price has pulled back beyond a level defined by automatically optimized moving averages (commonly called railroad tracks ). The trigger is price closing outside the regression channel drawn through the Wave 4 run, and the trade is taken when the high/low of that bar is taken out. MOB is used to project the initial target. Type 1 is a complex and powerful setup, yet visually obvious once mastered. Due to the short time for familiarization of the software, few Type 1 trades were taken during these tests. Type 2 Trade (In Advanced GET) A reversal play, entering opposite the trend at the end of the Elliott cycle (end of Wave 5). Divergence between the Elliott Oscillator and price, as well as MOB resistance, is used to confirm entry. The trigger is price closing outside the regression channel drawn through the Wave 5 run. A Type 2 trade is an entry after a major bottom or top, which is, by definition, high risk and high reward. Due to the short time for familiarization of the software, few Type 2 trades were taken during these tests. XTL (In Advanced Get) Wave 3 is typically the longest price run in the Elliott cycle. XTL is an entry method, which catches the early stages of a Wave 3 using a statistical algorithm to detect a potentially strong trend. The indicator also helps one stay in the trade over a long run, by preventing shakeouts during pullbacks. The color of the candle (red, blue, black) is used as a simple flag for potential entry and to define trend. XTL Breakout entries are taken when price exceeds 50% of the range of the signal candle (or breakout bar). Continuation entries are taken at the break of a regression channel, and confirmed by False Bar Stochastic. The algorithm is proprietary. Most of the trades in Test 1A and 1B were taken as XTL Breakouts.

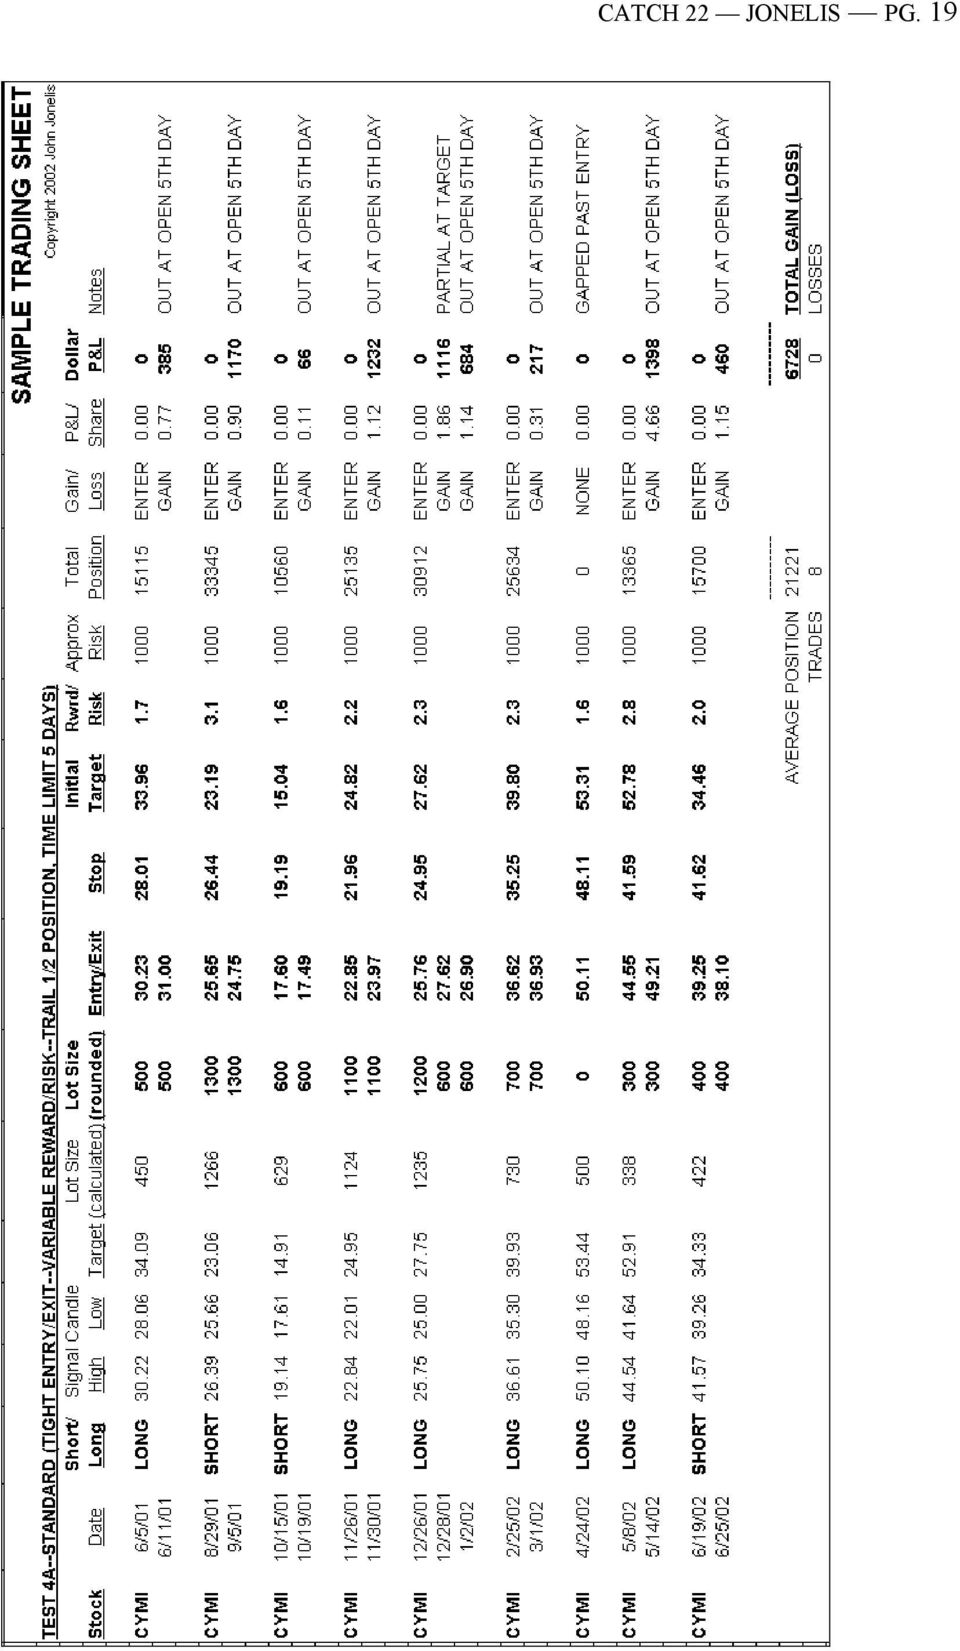
10 CATCH 22 JONELIS PG. 10 DETAILS TEST 1, Advanced GET Three basic entries were used: XTL (with False Bar Stochastic optional), Elliott Type 1, and Elliott Type 2. Of these, XTL provided the majority of profitable trades. Since each security was traded from beginning date to end date, most XTL entries were treated as breakouts, not continuation trades. Because of time constraints, many of the tools and studies available in the software were not explored at all. At time of testing, the author had not explored the MOB and Ellipse studies, and Type 1 and Type 2 setups were not performed as taught, yielding mixed results. Few such trades were taken and further testing is warranted. For the purposes of this report, if XTL had been used exclusively, ROI would have been higher. Entries and Stops were 50% away from the signal candle. Margin was 2:1. The GET trials were the first to be run, and at that time, a run-off was not anticipated. To paraphrase Joseph Heller in Catch 22, You don t know what you are trying to create until you have created it. (The Catch 22 of Creativity, 10/31/02, author unknown, Each GET trade was recorded by trade number, not date. Average Return was calculated in the usual manner, but to determine Minimum Return, the largest capital outlay of the year was borrowed from the Test 2 calendar (which used identical money management). Also, it was unnecessary to record signal candle data when testing GET, because target and stop price could be plotted directly on the chart, using the Fibonacci expansion tool. Since recording of these numbers was necessary to execute Tests 2 thru 6, the GET data sheets show a calculation of what the high and low or each signal candle might have been. Due to slight variations in the drawing of Fibonacci lines, these are not hard numbers and are shown merely for the sake of consistency. Test 1A 1.) Entry after Signal Candle if any one of the following conditions: a. XTL [blue = long; red = short] (most trades) and False Bar Stochastic with pullback to OB/OS 75/25 (optional), or b. Type 1 - price closing outside regression channel, or c. Type 2 - price closing outside regression channel 2.) Position size adjusted to maintain $1,000 risk per trade. 3.) Entry 50% ahead of signal candle. 4.) Stop 50% behind signal candle. 5.) Target at 162% Fib level (1.6:1 r/r) a. ½ position closed at Target b. Stop moved to break even. c. Trailing stops at Fractal. Test 1B Test 1B was exactly the same as 1A, but without trailing of partial positions. The entire position was closed at 1.6:1 r/r.

11 CATCH 22 JONELIS PG. 11 TEST 2, Standard (Wide) This test was set up to isolate the Advanced GET money management system from the GET indicators. Money management was exactly the same as Test 1, but GET indicators were removed. Margin was 2:1. Again, everything was the same as in Test 1, except the indicators, and then only the listed indicators were used. Test 2A 1.) Entry after Signal Candle if all of the following conditions: a. EMA Trend [10>20>50 or 50>20>10] and b. Minimum 3 day pullback or 2 day bounce, and c. Stochastic pullback past 50% (anticipating overbought/oversold) 2.) Position size adjusted to maintain $1,000 risk per trade. 3.) Entry 50% ahead of signal candle. [ Wide ] 4.) Stop 50% behind signal candle. [ Wide ] 5.) Target price at 1.6:1 r/r. a. ½ position closed at Target b. Stop moved to break even. c. Trailing stops at fractal. Test 2B Test 2B was exactly the same as 2A, but without trailing of partial positions. The entire position was closed at 1.6:1 r/r TEST 3, Standard (Medium) This was the first test performed after the GET trials, and took place several weeks after their completion. As a result, the individual price swings had faded from memory and no artificial method was needed to force objectivity. Discretion was permitted in use of Stochastics and other indicators could be referenced at will. Entry and Stop were tightened in this test. The reward to risk ratio was expanded to 2:1. The trailing method was very tight, defined by the previous candle, and discretionary. Margin was 2:1. Test 3A 1.) Entry after Signal Candle if all of the following conditions: a. EMA Trend [10>20>50 or 50>20>10] and b. Minimum 3 day pullback or 2 day bounce c. (Stochastics and other indicators at trader s discretion.) 2.) Position size adjusted to maintain $1,000 risk per trade. 3.) Entry $0.13 ahead of signal candle. [ Medium ] 4.) Stop $0.13 behind signal candle. [ Medium ] 5.) Target price at 2:1 r/r. a. ½ position closed at Target. b. Stop moved to break even. c. Trailing stops by candle at trader s discretion. [Trailing Tight] Test 3B Test 3B was exactly the same as 3A, but without trailing of partial positions. The entire position was closed at 2:1 r/r.
 2.")
12 CATCH 22 JONELIS PG. 12 TEST 4, Standard (Tight) This test represents classic swing trading as understood by the author. Most significantly, the initial target was set just short of minor support/resistance and pre-screened for a minimum 1.6:1 r/r or the trade was skipped. The stop was set at the nearest fractal. Entries and Stops were tight. The entire position was closed at market-open on day five. Margin was 2:1. Test 4A 1.) Entry after Signal Candle if all of the following conditions: a. EMA Trend [10>20>50 or 50>20>10] and b. Minimum 3 day pullback or 2 day bounce, and c. Stochastic pullback past 50% (anticipating overbought/oversold) 2.) Position size adjusted to maintain $1,000 risk per trade. 3.) Entry $0.01 ahead of signal candle. [ Tight ] 4.) Stop $0.05 behind signal candle or fractal [ Tight ] 5.) Target $0.13 short of the first support/resistance (minimum 1.6:1 r/r) a. ½ position closed at Target b. Stop moved to break even. c. Trailing stops at fractal. d. Position closed at the opening bell on day 5. Test 4B Test 4B was exactly the same as 4A, but without trailing of partial positions. The entire position was closed at the target or at the opening bell on day 5. TEST 5, Day Trading This is a rudimentary form of Day Trading, using only end-of-day data. The return was probably depressed by the bare-bones nature of the model and the small number of trade entries relative to day trading norms (206 entries borrowed from Test 4). Stop price and position size were calculated strictly using the daily signal candle. Entries were tight. Reward to risk ratio was pre-screened to a minimum of 1.6:1, just prior to minor support/resistance. Half positions were closed at 1.6:1 r/r then trailed (rare) or closed at end-of-day (common.) No more than six trades per day. Margin 4:1. (After trials, it was noted that the six-trade per day limit was exceeded once. Intra-day charts were referenced to determine which trades had fired first and the remainder executed the following day.) Test 5A 1.) Entry after Signal Candle if all of the following (same entries as Test 4): a. EMA Trend [10>20>50 or 50>20>10] and b. Minimum 3 day pullback or 2 day bounce, and c. Stochastics past 50% (anticipating overbought/oversold) 2.) Position size adjusted to maintain $1,000 risk per trade. 3.) Entry $0.01 ahead of signal candle. [ Tight ] 4.) Stop $0.05 behind signal candle. [ Tight ] 5.) Target $0.13 short of the first support/resistance (minimum 1.6:1 r/r) a. ½ position closed at Target b. Stop moved to break even. c. Remainder of position closed at end-of-day 6.) Six trades per day limit. Test 5B Test 5B was exactly the same as 5A, but without trailing of partial positions. The entire position was closed at 1.6:1 r/r, or at end-of-day (typical.)
 2.")
13 CATCH 22 JONELIS PG. 13 TEST 6, Position Entry was loosened to $0.25 past the signal candle. The range of the signal candle was ignored. The stop loss was set at 8% behind the entry price (stops as described by William O Neil.) The target was 25% beyond the entry price (common practice), resulting in a 3:1 reward to risk ratio. Margin was 2:1. The result was that positions were held longer than in other tests and that return and the risk were both higher. Test 6A 1.) Entry after Signal Candle off ALL of the following: a. EMA Trend [10>20>50 or 50>20>10] and b. Minimum 3 day pullback or 2 day bounce, and c. Stochastic pullback past 50% (anticipating overbought/oversold) 2.) Position size adjusted to maintain $1,000 risk per trade. 3.) Entry $0.25 ahead of signal candle. [ Medium ] 4.) Stop 8% behind entry price. [ Wide ] 5.) Target price 25% beyond entry price (3:1 r/r) a. ½ position closed at Target b. Stop moved to break even. c. Trailing stops at fractal. Test 6B Test 6B was exactly the same as 6A, but without trailing of partial positions. The entire position was closed 25% beyond entry price (3:1 r/r) TEST 7, Buy-and-Hold All 22 stocks were entered at the start of the test period and closed for reference at the end of the test period. (The last price was for comparison purposes, since during actual investing, the positions would not necessarily have been closed at that time.) All positions were Long. No entry parameters, money management techniques or stop losses were used. No margin was used. The result was a 21% loss. Though negative, this outperformed the Nasdaq Market for that period, as referenced by the QQQ position, which lost a net 42%. 1.) Entry at the mean of the daily price range on 6/1/02. 2.) All positions Long. 3.) No stop loss. 4.) Closing reference price at the mean of the daily price range on 6/28/02. The various models are compared and contrasted in the attached Charts.
 2.")
14 CATCH 22 JONELIS PG. 14 ATTACHMENTS Standard Version CHART A & B, TOTALS (2 pgs.) CHART C & D, POSITION SIZES (2 pg.) Sample Trading Sheet (1 pg.) Sample Calendar (1 pg.) Expanded Version CHART A & B, TOTALS (2 pgs.) CHART C & D, POSITION SIZES (2 pgs.) TRADING SHEETS, TEST 1A 6B; 2B 6B; 7 (265 pgs.) CALENDARS, TEST 2A 6A; 2B 6B (63 pgs.) Web Version CHART A & B, TOTALS (2 pgs.) CHART C & D, POSITION SIZES (2 pgs.) Sample Trading Sheet (1 pg.) Sample Calendar (1 pg.) STOCK CHART ILLUSTRATIONS (5 pgs.) Advanced GET XTL Example Advanced GET Type 1 Example Advanced GET Type 2 Example Test 2A Swing Trade Example Standard Swing Trade Example
 Sample Calendar (1 pg.) STOCK CHART ILLUSTRATIONS (5 pgs.")
15 CATCH 22 JONELIS PG. 15

16 CATCH 22 JONELIS PG. 16
17 CATCH 22 JONELIS PG. 17

18 CATCH 22 JONELIS PG. 18

19 CATCH 22 JONELIS PG. 19
20 CATCH 22 JONELIS PG. 20

21 CATCH 22 JONELIS PG. 21
22 CATCH 22 JONELIS PG. 22
23 CATCH 22 JONELIS PG. 23
24 CATCH 22 JONELIS PG. 24
25 CATCH 22 JONELIS PG. 25
Advanced Trading Systems Collection MACD DIVERGENCE TRADING SYSTEM
 MACD DIVERGENCE TRADING SYSTEM 1 This system will cover the MACD divergence. With this trading system you can trade any currency pair (I suggest EUR/USD and GBD/USD when you start), and you will always
A.R.T Core Portfolio Trading Plan June 2015
 A.R.T Core Portfolio Trading Plan June 2015 ABSOLUTE RETURN TRADING PTY LTD ACN 603 186 634 Trading ASX Equities Long/Short using CFDS CFDs are a very powerful and effective tool if used correctly. Using
New York Traders Expo 2012
 New York Traders Expo 2012 with JAMES CHEN, CTA, CMT Director of Technical Research and Education All rights reserved, FXDD Inc. 2010 Today s Topic: High Probability Strategies for Trading Forex www.fxdd.com
Disclaimer: The authors of the articles in this guide are simply offering their interpretation of the concepts. Information, charts or examples
 Disclaimer: The authors of the articles in this guide are simply offering their interpretation of the concepts. Information, charts or examples contained in this lesson are for illustration and educational
FreeStockCharts.com Workbook
 FreeStockCharts.com Workbook Updated March 2010 FREESTOCKCHARTS.COM WORKBOOK Worden Brothers, Inc. www.worden.com Five Oaks Office Park 4905 Pine Cone Drive Durham, NC 27707 0 FREESTOCKCHARTS.COM WORKBOOK
TOMORROW'S TRADING TECHNOLOGY. 100% automated Fibonacci support and resistance levels that you can count on every single trading day in an instant.
 TOMORROW'S TRADING TECHNOLOGY 100% automated Fibonacci support and resistance levels that you can count on every single trading day in an instant. ProTrader Table of Contents 1. Areas A. Fibonacci Confluence
How to see the market context using CCI Written by Buzz
 How to see the market context using CCI Written by Buzz Towards the end of September 2003, I decided to stop trading the S&P e-mini for a while and focus on the Russell 2000 e-mini. The swings seemed to
Methods to Trade Forex Successfully for Quick Profits
 Methods to Trade Forex Successfully for Quick Profits This article is devoted to the techniques that are used to trade Forex on an intraday basis for quick profits. The aim is to make the trading a successful
Trading the Daniel Code Numbers
 Trading the Daniel Code Numbers INTRODUCTION... 2 ABOUT THE DC NUMBERS... 2 BEFORE YOU START... 2 GETTING STARTED... 2 Set-Up Bars... 3 DC Number Sequences... 4 Reversal Signals... 4 DC TRADING METHODOLOGY...
BULLS ON WALL ST. 60 DAY TRADING BOOTCAMP
 BULLS ON WALL ST. 60 DAY TRADING BOOTCAMP Lead Instructor Kunal Desai Assistant Instructors Maribeth Willoughby Dr. Andrew Menaker Course Description This 60 day course teaches a setup based system to
JOURNAL THE BASIC GANN SWING PLAN FOR STOCKS QUESTIONS ROBERT KRAUSZ'S. Volume 1, Issue 4
 ROBERT KRAUSZ'S JOURNAL Volume 1, Issue 4 THE BASIC GANN SWING PLAN FOR STOCKS T his issue of the Fibonacci Trader Journal will focus on trading stocks. Some traders, those who focus on just stocks, have
Chapter 2.3. Technical Analysis: Technical Indicators
 Chapter 2.3 Technical Analysis: Technical Indicators 0 TECHNICAL ANALYSIS: TECHNICAL INDICATORS Charts always have a story to tell. However, from time to time those charts may be speaking a language you
The Jim Berg Entry and Exit System. 1.
 The Jim Berg Entry and Exit System. 1. Note. The description below is given for educational purposes only in order to show how this may be used with AmiBroker charting software. As described here it is
One of the primary challenges traders deal with is
 TRADING Strategies Momentum trading: Using pre-market trading and range breakouts Focusing on days the market breaks out of the prior day s range and moves in the same direction as the pre-market trend
Simpler Options. Indicator guide. An informative reference for John Carter s commonly used trading indicators. www.simpleroptions.
 Simpler Options Indicator guide An informative reference for John Carter s commonly used trading indicators At Simpler Options you will see a handful of proprietary indicators on John Carter s charts.
Alerts & Filters in Power E*TRADE Pro Strategy Scanner
 Alerts & Filters in Power E*TRADE Pro Strategy Scanner Power E*TRADE Pro Strategy Scanner provides real-time technical screening and backtesting based on predefined and custom strategies. With custom strategies,
Trading Lessons from the Intraday Frame (study)
") 1 Daily "Idealized Trades" Report Trading Lessons from the Intraday Frame (study) 1 2 SPY's 1-min Power Trend Chart (Additional Trades) 2 3 Lessons to Learn from Today's Trading Day Let's start as usual
1 Daily "Idealized Trades" Report Trading Lessons from the Intraday Frame (study) 1 2 SPY's 1-min Power Trend Chart (Additional Trades) 2 3 Lessons to Learn from Today's Trading Day Let's start as usual
Elder-disk for TeleChart (TC2005 / TC2007) Version 2.01
 Version 2.01") Elder-disk for TeleChart (TC2005 / TC2007) Version 2.01 Thank you for purchasing this Elder-disk. It was developed by Dr. Alexander Elder, the author of TRADING FOR A LIVING, COME INTO MY TRADING ROOM,
Elder-disk for TeleChart (TC2005 / TC2007) Version 2.01 Thank you for purchasing this Elder-disk. It was developed by Dr. Alexander Elder, the author of TRADING FOR A LIVING, COME INTO MY TRADING ROOM,
Forex Volatility Patterns
 Spotting Early Breakouts Forex Volatility Patterns BRUCE WALDMAN Want to catch 40 to 00 pips in each trade? Here s how you can find those entry and exit signals to make your forex trading a success. C
Chapter 1 Introduction Disclaimer: Forex Involves risk. So if you lose money you can't blame us we told you trading involves risk.
 By Casey Stubbs -Winners Edge Trading.com Table of Contents Chapter 1. Introduction Chapter 2.. Trading Plan Chapter 3.. Money Management Chapter 4. Moving Average Strategy Chapter 5. Stochastic Strategy
Intra-Day Trading Techniques
 Pristine.com Presents Intra-Day Trading Techniques With Greg Capra Co-Founder of Pristine.com, and Co-Author of the best selling book, Tools and Tactics for the Master Day Trader Copyright 2001, Pristine
Intra-Day Trading Techniques. Pristine.com Presents. Greg Capra. book, Tools and Tactics for the Master Day Trader
 Pristine.com Presents Intra-Day Trading Techniques With Greg Capra Co-Founder of Pristine.com, and Co-Author of the best selling book, Tools and Tactics for the Master Day Trader Copyright 2001, Pristine
How to use Hamzei Analytics CI and DCI Indicators By Fari Hamzei
 How to use Hamzei Analytics CI and DCI Indicators By Fari Hamzei A key element of your success in trading is early detection of the trend before the next big move occurs. Seeing the next trend in prices,
CHART TRADING GUIDE 1
 CHART TRADING GUIDE 1 How to understand chart trading This guide is designed to teach you the basics of chart trading- the chart patterns that are covered in this booklet can be used for short and medium
Neural Network Stock Trading Systems Donn S. Fishbein, MD, PhD Neuroquant.com
 Neural Network Stock Trading Systems Donn S. Fishbein, MD, PhD Neuroquant.com There are at least as many ways to trade stocks and other financial instruments as there are traders. Remarkably, most people
Trend Determination - a Quick, Accurate, & Effective Methodology
 Trend Determination - a Quick, Accurate, & Effective Methodology By; John Hayden Over the years, friends who are traders have often asked me how I can quickly determine a trend when looking at a chart.
Stock Breakout Profits Strategy
 Stock Breakout Profits Strategy Introduction Welcome and thank you for downloading the Stock Breakout Profits system. The Stock Breakout Profits is a complete trading strategy for trading not only the
Trade Forex with Support and Resistance Strategies. By Walter Peters, Phd. BestMetatraderBroker.com
 Trade Forex with Support and Resistance Strategies By Walter Peters, Phd. BestMetatraderBroker.com 1 Important Risk Disclaimer ALL INFORMATION CONTAINED IN THIS COURSE IS FOR EDUCATIONAL PURPOSES ONLY
Technical Analysis SAmple InveSTIng plans 1
 Technical Analysis Sample Investing Plans 1 Important Information All investing plans and rules are provided for informational purposes only, and should not be considered a recommendation of any security,
How I Trade Profitably Every Single Month without Fail
 How I Trade Profitably Every Single Month without Fail First of all, let me take some time to introduce myself to you. I am Kelvin and I am a full time currency trader. I have a passion for trading and
Technical Analysis. Technical Analysis. Schools of Thought. Discussion Points. Discussion Points. Schools of thought. Schools of thought
 The Academy of Financial Markets Schools of Thought Random Walk Theory Can t beat market Analysis adds nothing markets adjust quickly (efficient) & all info is already in the share price Price lies in
Table of Contents. Preface. Chapter 1: TRADING BASICS. Chapter 2: BASIC TOOLS. Chapter 3: ADX. Chapter 4: ACCUMULATION LINE
 Table of Contents Preface Chapter 1: TRADING BASICS Chapter 2: BASIC TOOLS Chapter 3: ADX Chapter 4: ACCUMULATION LINE Chapter 5: AVERAGE TRUE RANGE Chapter 6: CANDLESTICKS Chapter 7: MACD Chapter 8: MOVING
Chapter 6 - Rahul Mohindar Oscillator System
 Chapter 6 - Rahul Mohindar Oscillator System The Rahul Mohindar Oscillator and its associated tools and indicators were developed by Mr. Rahul Mohindar of VIRATECH (viratechindia.com). In addition to being
Sunil Mangwani www.fibforex123.com
 The 123 chart pattern. The 123 pattern is a reversal chart pattern which occurs very frequently and has a very high success ratio. 123 s occur at the end of trends and swings, and they are an indication
High Probability Trading Triggers for Gold & Silver
 Welcome to a CBOT Online Seminar High Probability Trading Triggers for Gold & Silver Presented by: John Person Sponsored by Interactive Brokers Live Presentation Starts at 3:30 PM Chicago Time NOTE: Futures
This tutorial was originally titled "Secrets to Successful Short-Term Trading" and was recorded at the Online Trading Expo
 This tutorial was originally titled "Secrets to Successful Short-Term Trading" and was recorded at the Online Trading Expo Day Trading Wizard Using High Probability Support and Resistance Levels with Tony
FOREIGN EXCHANGE CYCLES:
 January 1999 FOREIGN EXCHANGE CYCLES: Get Ready to Sell the Upcoming Cycle Top in the Dollar versus the Deutschemark Trade Sell the Dollar-Mark on a break below last week's low of 1.6625 and look for 5
FUTURES STRATEGY: Short-term CCI p. 10. ADJUSTING TO stock index futures shift p. 14. STRADDLES, STRANGLES, and volatility p. 16
 May 2009 Volume 3, No. 5 FUTURES STRATEGY: Short-term CCI p. 10 ADJUSTING TO stock index futures shift p. 14 STRADDLES, STRANGLES, and volatility p. 16 FEAR AND LOATHING in the options market p. 20 TRADING
Leon Wilson Trading Success
 Leon Wilson Trading Success A talk given by Mary de la Lande to the BullCharts User Group Meeting on 13 February 2008 1. Who is Leon Wilson? His Books and where to get them. 2. Book 1: The Business of
The 5 Exit Heroes. Exiting Your Forex Trades For Maximum Profits
 The 5 Exit Heroes Exiting Your Forex Trades For Maximum Profits IMPORTANT : As an added bonus for downloading this report, you also received additional free training videos. To access your bonuses, go
Chapter 2.3. Technical Indicators
 1 Chapter 2.3 Technical Indicators 0 TECHNICAL ANALYSIS: TECHNICAL INDICATORS Charts always have a story to tell. However, sometimes those charts may be speaking a language you do not understand and you
Technical Indicators Tutorial - Forex Trading, Currency Forecast, FX Trading Signal, Forex Training Cour...
 Page 1 Technical Indicators Tutorial Technical Analysis Articles Written by TradingEducation.com Technical Indicators Tutorial Price is the primary tool of technical analysis because it reflects every
Yes, and this is the approach most successful professional traders take.
 Page 1 Introduction to MTPredictor By: Steve Griffiths, MTPredictor developer April 2012 Welcome to this introduction to MTPredictor, where I would like to take a look at the automatic routines and advanced
Simple & Consistent Fibonacci Method Prepared by: Simone Guy. {Free learning resource: NOT FOR RESALE}
 Simple & Consistent Fibonacci Method Prepared by: Simone Guy {Free learning resource: NOT FOR RESALE} 3/13/2010 Overview This is a mechanical trading method that is based on Support and Resistance. The
Professional Trader Series: Moving Average Formula & Strategy Guide. by John Person
 Professional Trader Series: Moving Average Formula & Strategy Guide by John Person MOVING AVERAGE FORMULAS & STRATEGY GUIDE In an online seminar conducted for the Chicago Board of Trade, I shared how to
Guidelines to use with Fibonacciqueen trade setups!!!
 Guidelines to use with Fibonacciqueen trade setups!!! Updated January 2014 As far as the price analysis that I run every day in the markets, there are three different types of Fibonacci price relationships
THE CYCLE TRADING PATTERN MANUAL
 TIMING IS EVERYTHING And the use of time cycles can greatly improve the accuracy and success of your trading and/or system. THE CYCLE TRADING PATTERN MANUAL By Walter Bressert There is no magic oscillator
EUR/USD Trading Strategy
 EUR/USD Trading Strategy TRADING SIGNALS TRADING EDUCATION TRADING STRATEGIES Kathy Lien & Boris Schlossberg www.bkforex.com TRADING SIGNALS & TRADING EDUCATION Risk Disclosure BKForex LLC is a registered
Copyright 2010 by Kelvin Lee
 All rights reserved. No part of this publication may be reproduced, stored in a retrieval system, or transmitted, in any form or by any means, electronic, mechanical, photocopying, recording or otherwise,
Emini Trading Strategy
 Emini Trading Strategy The following comments are meant as a starting point for developing an emini trading strategy. I m sure things will be added over time. But this is what I have so far. I begin with
Trading Technical Analysis Signals With Option Spreads. By Steve Lentz Director of Education, DiscoverOptions Mentoring
 Trading Technical Analysis Signals With Option Spreads By Steve Lentz Director of Education, DiscoverOptions Mentoring Disclaimer The views of third party speakers and their materials are their own and
CONTROLLING. Your TRADES, MONEY& EMOTIONS. By Chris Vermeulen
 CONTROLLING Your TRADES, MONEY& EMOTIONS By Chris Vermeulen INTRODUCTION In this condensed guide I have put together some key points which I think should be read a few times in order for these critical
ValueCharts TradeStation
 ValueCharts TradeStation ValueCharts TradeStation indicator suite can be located in the TradeStation Strategy Network under MicroQuantSM products. Free trial subscription periods are available for all
The 15 50 Trading System
 Main Premise: This is considered to be one of the most straight forward systems for a live trading style for day- and/or intraday trading. The 50 SMA is one of the most commonly used moving average numbers
8 Day Intensive Course Lesson 3
 8 Day Intensive Course Lesson 3 A) What are Fibonacci Retracements? Fibonacci Retracements What are Fibonacci retracements? Levels at which the market is expected to retrace to after a strong trend. Based
Day Trading the Dow Jones, DJI
 Day Trading the Dow Jones, DJI Enter a trade on a confirmation of a break of the 100EMA, which is when the price pulls back towards the 100MA and then continues in the direction of the breakout. Stay in
GMMA 2.0 User Guide. August 2010 Edition PF-30-01-02
 GMMA 2.0 User Guide GMMA 2.0 User Guide August 2010 Edition PF-30-01-02 Support Worldwide Technical Support and Product Information www.nirvanasystems.com Nirvana Systems Corporate Headquarters 7000 N.
The Definitive Guide to Swing Trading Stocks
 The Definitive Guide to Swing Trading Stocks 1 DISCLAIMER The information provided is not to be considered as a recommendation to buy certain stocks and is provided solely as an information resource to
 Swing Trade Warrior Chapter 2. Introduction to swing trading strategies and classic swing trade patterns Options gap fill strategy We look for stocks that have made extreme moves up or down (gappers) We
This library is included for Platinum Club members, and may be purchased separately for the Gold version of Trade Navigator.
 Planetary 2 Library I C H I M O K U C L O U D L I B R A R Y Introduction: In 1969, Goichi Hosada, a journalist in Tokyo, developed a very versatile indicator that has withstood the test of time. The Ichimoku
International Academy of Exchange Trading. Lesson 9: A Simple Trading System
 Contents Lesson 1: All you need is... Lesson 2: Forex lowdown Lesson 3: Leverage (a little help from your friends) Lesson 4: Orders Lesson 5: A beginner s guide to technical analysis Lesson 6: Technical
Pivot Point Trading. If you would rather work the pivot points out by yourself, the formula I use is below:
 Pivot Point Trading You are going to love this lesson. Using pivot points as a trading strategy has been around for a long time and was originally used by floor traders. This was a nice simple way for
I Day. article. In. you but. I just. Entry. Trend. I risk. 2.5% per. equity. a "runner" trading
 Emini Day Trading How I Day Trade for a Living I wish I had a simple answer for you but I don't. Trading is hard, very hard probably the hardest thing you' 'll ever try to do in your life and that's why
CREATING A TRADING PLAN
 Guide to: CREATING A TRADING PLAN with trader Tim Racette www.eminimind.com DISCLAIMER Trading carries a high level of risk. You are subject to lose all or more of your original investment. Don t trade
Advanced Trading Systems Collection FOREX TREND BREAK OUT SYSTEM
 FOREX TREND BREAK OUT SYSTEM 1 If you are a part time trader, this is one system that is for you. Imagine being able to take 20 minutes each day to trade. A little time at night to plan your trades and
Active Trend Trading System
 Active Trend Trading System Candle Light Trader: Dennis W. Wilborn A Trend Should Be Assumed to Continue in Effect Until Such Time as Its Reversal Has Been Definitely Signaled Edwards & Magee Disclaimer
Definitions to Basic Technical Analysis Terms. www.recognia.com
 Definitions to Basic Technical Analysis Terms www.recognia.com A Alert An alert is a notification sent when a significant event occurs in one or more investments of importance to a trader. Recognia sends
Take it E.A.S.Y.! Dean Malone 4X Los Angeles Group - HotComm January 2007
 Take it E.A.S.Y.! Dean Malone 4X Los Angeles Group - HotComm January 2007 Dean Malone Partner of Compass Foreign Exchange, LLC. Co-Founder of Forex Signal Service.com. Previous Senior National for 4X Made
THE TRADE-OR-FADE METHOD:
 THE TRADE-OR-FADE METHOD: How to Trade Short-Term Using the Technical Analysis Spreadsheets and the Intra-day Support & Resistance by Scott Hoffman 1.800.800.3840 The Trade or Fade Advisory The Trade or
6. Get Top Trading Signals with the RSI
 INTERMEDIATE 6. Get Top Trading Signals with the RSI The Relative Strength Index, or RSI, is one of the most popular momentum indicators in technical analysis. The RSI is an oscillator that moves between
I Really Trade. Trading Patterns for Stocks & Commodities. Introducing The False Break Buy and Sell Pattern
 2008 Trading Patterns for Stocks & Commodities It doesn t matter if you are a longterm investor, short swing trader or day trader, you are always looking for an advantageous spot to enter your position.
By Wayne McDonell wayne@fxbootcamp.com Forex Trading Expo Las Vegas September 12 & 13 2008
 STRATEGIC & tactical forex TRADING: By Wayne McDonell wayne@fxbootcamp.com Risk Warning This is an educational presentation. There are no trade recommendations. Trading and Investing is risky business.
Ideas for improving your trading in 2010. Trader_Dante
 Ideas for improving your trading in 2010 Trader_Dante Copyright Trader_Dante 2010 Page 1 of 18 Disclaimer All reasonable steps and due diligence have been taking in preparing this document. However, it
The Awesome Trading System (2 nd Edition)
") The Awesome Trading System (2 nd Edition) By Victor Chan Wai-To Note: You may freely distribute this ebook as long as you do not alter the content of it. All materials are copyright Victor Chan Wai-To
The Awesome Trading System (2 nd Edition) By Victor Chan Wai-To Note: You may freely distribute this ebook as long as you do not alter the content of it. All materials are copyright Victor Chan Wai-To
Fine-Tuning Your Money Management System
 Avoid The Risk Of Ruin Fine-Tuning Your Money Management System Acknowledge the risks in trading the markets by making sure your money management system is sound. hen you hear of someone making a huge
Using Historical Probabilities to Trade the Opening Gap
 Using Historical Probabilities to Trade the Opening Gap Scott Andrews Hosted by Hamzei Analytics November 10, 2010 Disclaimer This material is intended for educational purposes only and is believed to
Futures Trading Using the 14-day Stochastic Signal as Defined and Published by Robert McHugh, Ph.D.,
 Futures Trading Using the 14-day Stochastic Signal as Defined and Published by Robert McHugh, Ph.D., by David Zaitzeff, futures broker at PFG West (Camarillo, CA) 800-656-0443 (office) Robert McHugh, Ph.D.,
THE LAW OF CHARTS WITH INFORMATION NOT SHOWN IN OUR PREVIOUS COURSE MANUALS
 THE LAW OF CHARTS WITH INFORMATION NOT SHOWN IN OUR PREVIOUS COURSE MANUALS 1-2-3 HIGHS AND LOWS A typical 1-2-3 high is formed at the end of an uptrending market. Typically, prices will make a final high
Understanding the market
 Understanding the market Technical Analysis Approach: part I Xiaoguang Wang President, Purdue Quantitative Finance Club PhD Candidate, Department of Statistics Purdue University wang913@purdue.edu Outline
FXQUICK TOOLS. FQ Master Fractals. degrees of time the right way. chart without it. For inquiries, you can reach us at: info@fxquickroute.
 FQ Master Fractals Simple but powerful tool that helps you analyze the market in different degrees of time the right way. As soon as you discover the potential of this tool, you will never open a chart
Ed Heath s Guerilla Swing Trading Plan (as of 1/22/13)
") Ed Heath s Guerilla Swing Trading Plan (as of 1/22/13) Synopsis: I call my trading style Guerilla Swing Trading. I trade upward momentum stocks that have pulled back for a buying opportunity and my goal
Ed Heath s Guerilla Swing Trading Plan (as of 1/22/13) Synopsis: I call my trading style Guerilla Swing Trading. I trade upward momentum stocks that have pulled back for a buying opportunity and my goal
MAGIC BREAKOUT Forex Trading Strategy
 Tim Trush & Julie Lavrin Introducing MAGIC BREAKOUT Forex Trading Strategy Your guide to financial freedom. Tim Trush, Julie Lavrin, T&J Profit Club, 2007 2015, All rights reserved www.magicbreakout.com
The True Strength Index (TSI)
") DVND trategies The TRU TRNGTH I n d e x Y THOM HRT Momentum-based indicators lead the market and moving average-based indicators lag it. oth types of tools have advantages and disadvantages. H e r e s
DVND trategies The TRU TRNGTH I n d e x Y THOM HRT Momentum-based indicators lead the market and moving average-based indicators lag it. oth types of tools have advantages and disadvantages. H e r e s
Using ADX to Trade Breakouts, Pullbacks, and Reversal Patterns. By Puneet Jain CFTe
 Using ADX to Trade Breakouts, Pullbacks, and Reversal Patterns By Puneet Jain CFTe (with DMI) ADX (Average Directional Index) is an indicator that measures trend strength shows trend direction. ADX tells
Trading Pivot Points Forex-Breakout-System
 Trading Pivot Points Forex-Breakout-System Pivot points are rarely understood, and they are rarely used by the Forex trader. The first chapter explores the question, What are Pivot Points? and the reasoning
128 THE THREE M S OF SUCCESSFUL TRADING
 128 THE THREE M S OF SUCCESSFUL TRADING If you can download your data at the end of each day, do your homework, write down your orders for the day ahead, watch the opening and record your entries, and
ForexIndicator.org. Presents. Written By Kelvin Lee
 ForexIndicator.org Presents Written By Kelvin Lee All rights reserved. No part of this publication may be reproduced, stored in a retrieval system, or transmitted, in any form or by any means, electronic,
4 Hour MACD Forex Strategy
 4 Hour MACD Forex Strategy Welcome to the 4 Hour MACD Forex Strategy. This strategy is aimed at simplicity as well as high probability trades. I have been in the equity market for almost ten years now
THE MACD: A COMBO OF INDICATORS FOR THE BEST OF BOTH WORLDS
 THE MACD: A COMBO OF INDICATORS FOR THE BEST OF BOTH WORLDS By Wayne A. Thorp Moving averages are trend-following indicators that don t work well in choppy markets. Oscillators tend to be more responsive
BROKER SERVICES AND PLATFORM
 BROKER SERVICES AND PLATFORM A broker is an individual who executes buy and sell orders and get commission in the form of SPREAD (I will talk about SPREAD in the subsequent lessons). You trade through
An Objective Leading Indicator Fibonacci Retracements
 An Objective Leading Indicator Fibonacci Retracements This article explains how to use Fibonacci as a leading indicator, combining it with other technical analysis tools to provide precise, objective entry
The Ultimate Fibonacci Guide By Fawad Razaqzada, technical analyst at FOREX.com
 The Ultimate Fibonacci Guide By Fawad Razaqzada, technical analyst at FOREX.com Who is Fibonacci? Leonardo Bonacci also known as Leonardo Fibonacci was an Italian mathematician in the 12 th century. He
Stop Investing and Start Trading. How I Trade Technical Strategies Over Fundamental Strategies
 Stop Investing and Start Trading How I Trade Technical Strategies Over Fundamental Strategies PREPARATION PRIOR TO OPENING MARKET 1. On Daily Log Sheet record NAV [Net Asset Value] of portfolio. 2. Note
Pivot Trading the FOREX Markets
 Pivot Trading the FOREX Markets A report by Jim White April, 2004 Pivot Research & Trading Co. 3203 Provence Place Thousand Oaks, Ca. 91362 Phone: 805-493-4221 FAX: 805-493-4349 Email: Jwhite43@adelphia.net
NEXGEN DEMO TRADING & EDUCATIONAL PLAN SIMPLIFIED
 NEXGEN DEMO TRADING & EDUCATIONAL PLAN SIMPLIFIED Please watch the intro Video so you understand Nexgen's expectations for your demo time and what you should expect from us during your demo. CLICK TO WATCH
WATTS TRADING GROUP. A Smarter Way To Trade. A Simple Way to Trade the 2-minute S&P
 WATTS TRADING GROUP A Smarter Way To Trade A Simple Way to Trade the 2-minute S&P Copyright 2004, Watts Investment Company, LLC All rights reserved. No part of this work may be reproduced or transmitted,
HOW I TRIPLED MY ACCOUNT IN 4 MONTHS WITH FXJAKE.COM
 HOW I TRIPLED MY ACCOUNT IN 4 MONTHS WITH FXJAKE.COM By Nicola McLaughlin IMPORTANT While we make every effort to ensure that we accurately represent all the products and services reviewed on this website
A Basic Guide to RBI Support and Resistance Trading
 A Basic Guide to RBI Support and Resistance Trading All material contained in this document is protected by Copyright 2008 TradeStalker.com and Mike Reed. This document should not be reproduced or distributed,
Advisor Perspectives welcomes guest contributions. The views presented here do not necessarily represent those of Advisor Perspectives.
 What Matters More When Investing: A Good Company or Good Price? What to Expect When P/E Multiples Compress By John Alberg and Michael Seckler December 3, 2013 Advisor Perspectives welcomes guest contributions.
Indicators. Applications and Pitfalls. Adam Grimes
 Indicators Applications and Pitfalls Adam Grimes CIO, Waverly Advisors, LLC October 6, 2015 Outline A little history lesson What indicators are and what they can do even more important what they can not