DIGITAL ELEVATION MODELS PRINCIPLES, SOURCES AND ANALYSIS
|
|
|
- Elisabeth Lambert
- 7 years ago
- Views:
Transcription
1 PRINCIPLES, SOURCES AND ANALYSIS
2 INTRODUCTION Relief is an important component of any project dealing with the territory (hydrology, land resources,...). It is therefore necessary to find ways to introduce the elevation information in GIS projects. One mean is the digital elevation model. It considers the altitude as continuous variable over the space. TERMINOLOGY I Digital Digital Digital Digital Elevation Model (DEM): generic term for altitude grid Terrain Model (DTM): ground elevation model Surface Model (DSM): ground + cover elevation model Height Model (DHM): cover elevation model

3 TERMINOLOGY II DEM DTM DSM DHM
4 REGULAR GRID The digital elevation model corresponds to a regular grid of elevation. Each node of the grid shows an altitude value. The resolution of the grid corresponds to the distance between to neighbor nodes.
5 DEM SOURCES 1 Several DEM sources are available, showing various acquisition modes and resolution SCALE NAME RESOLUTION GLOBAL GTOPO30 SRTM30 ~900 m ~900 m REGIONAL SRTM 3 arc'' SRTM 1 arc'' ASTER DEM ~90 m ~30 m ~30 m LOCAL PHOTOGRAM. LASER DEM ~1 m ~1 m

6 DEM SOURCES 2 GTOPO30 & SRTM30 The GTOPO30 DEM was created based on heterogeneous topographical maps. The quality of the elevation data varies consequently over space. The SRTM30 DEM was acquired through space shuttle radar interferometry. This new source of elevation data overcome the major quality problems of the GTOPO30. They both present a resolution of 30 arc seconds (~900 m) and are freely available for the Earth surface.
 respectively 1 arc seconds (~30 m) and are available for the Earth surface.")
7 DEM SOURCES 3 SRTM 90 m & SRTM 30 m The SRTM 90 & 30 m DEM were acquired through space shuttle radar interferometry. They present a resolution of 3 arc seconds (~90 m) respectively 1 arc seconds (~30 m) and are available for the Earth surface. The SRTM 90 m is freely available The SRTM 30 m costs being of 0.5 $ per square kilometer. 30 m vs 90 m
. Both terrain (ground) and surface (objects) are captured in the same time.")

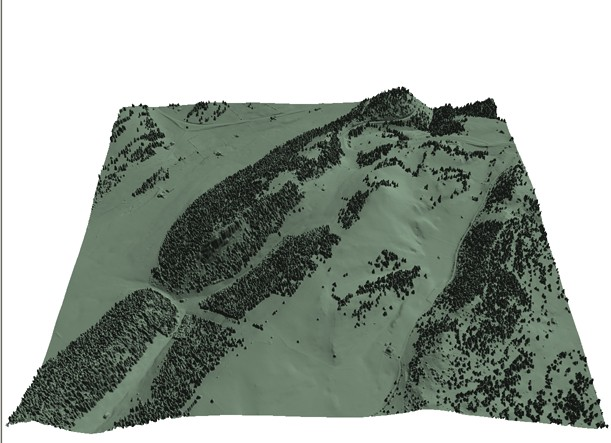
8 DEM SOURCES 3 LASER DEM This new acquisition technology allows the capture of very high resolution DEM (~1 m). Both terrain (ground) and surface (objects) are captured in the same time. Such detailed digital elevation model offers good potential for local relief analysis in applications such as hydrology, hazard mapping,... The cost of acquisition are relatively high ( $ per square kilometer)


9 DEM SOURCES 3 LASER DEM
10 DEM ANALYSIS Several analysis are available on digital elevation models - global indicators - local indicators - transforms - map algebra & treatment model
11 DEM ANALYSIS: Global indicators The global indicators corresponds to statistical variables calculated over the whole DEM extent The main variables are - the the the the the altitude distribution mean elevation median elevation min and max values altitude range

12 DEM ANALYSIS: Local Indicators Various local indicator can be calculated using GIS tools. They are based on the local context analysis for each pixel, considering a moving window as neighborhood Window can vary in - size - form - content


13 DEM ANALYSIS: Local Indicators Window shifting follows the illustrated principles Side effects are created in DEM limits according to the given example

14 DEM ANALYSIS: Slope and Orientation Indicators Slope and orientation calculation corresponds to the first order derivative of the surface.

15 DEM ANALYSIS: Curvature Indicators Profile and Plan Curvature calculation corresponds to the second order derivative of the surface.
16 DEM ANALYSIS: Scale Management Scale can be managed using different methods, though some of them are not recommended.

17 DEM ANALYSIS: Visibility analysis The visibility analysis, or Viewshed analysis, considers one central point of view and determines the extent of the visible area over the DEM.

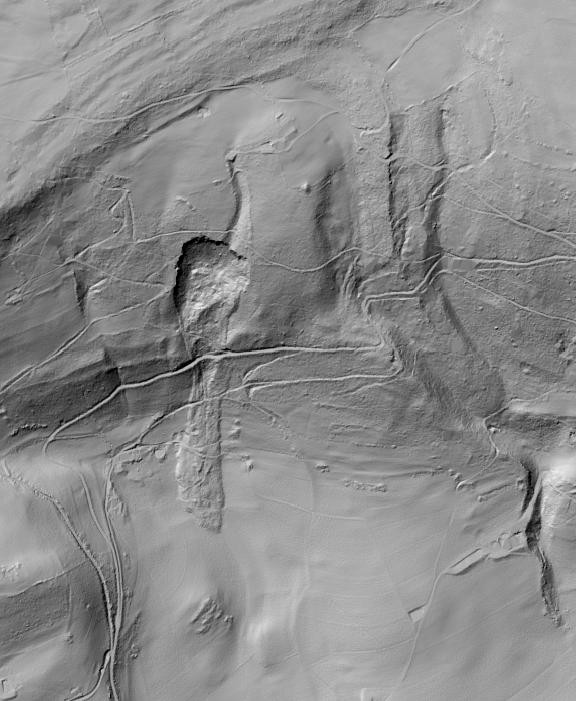
18 DEM ANALYSIS: Hillshade The hillshade corresponds to a shaded representation of the elevation. It allows a better interpretation of the relief morphology. The common practice for shading is place the light source at 315
19 DEM ANALYSIS: Radiation The radiation corresponds to a representation of the cumulated energy received over the DEM.
20 DEM ANALYSIS: Contours extraction Isoline of elevation, contours, can be created based on a DEM. The elevation interval to be chosen is determined by the DEM resolution and its vertical accuracy.

21 DEM ANALYSIS: Profile extraction Profile can be created based on a polyline and a DEM.
22 DEM ANALYSIS: Hydrology features extraction Watershed and riverbed can be created based on a DEM analysis. Upstream area detection Streams detection Watershed delineation

23 DEM VISUALIZATION: 3D Representation of Relief
Notable near-global DEMs include
 Visualisation Developing a very high resolution DEM of South Africa by Adriaan van Niekerk, Stellenbosch University DEMs are used in many applications, including hydrology [1, 2], terrain analysis [3],
Working with Digital Elevation Models and Digital Terrain Models in ArcMap 9
 Working with Digital Elevation Models and Digital Terrain Models in ArcMap 9 1 TABLE OF CONTENTS INTRODUCTION...3 WORKING WITH DIGITAL TERRAIN MODEL (DTM) DATA FROM NRVIS, CITY OF KITCHENER, AND CITY OF
ANALYSIS 3 - RASTER What kinds of analysis can we do with GIS?
 ANALYSIS 3 - RASTER What kinds of analysis can we do with GIS? 1. Measurements 2. Layer statistics 3. Queries 4. Buffering (vector); Proximity (raster) 5. Filtering (raster) 6. Map overlay (layer on layer
GEOENGINE MSc in Geomatics Engineering (Master Thesis) Anamelechi, Falasy Ebere
 Anamelechi, Falasy Ebere") Master s Thesis: ANAMELECHI, FALASY EBERE Analysis of a Raster DEM Creation for a Farm Management Information System based on GNSS and Total Station Coordinates Duration of the Thesis: 6 Months Completion
Master s Thesis: ANAMELECHI, FALASY EBERE Analysis of a Raster DEM Creation for a Farm Management Information System based on GNSS and Total Station Coordinates Duration of the Thesis: 6 Months Completion
LIDAR and Digital Elevation Data
 LIDAR and Digital Elevation Data Light Detection and Ranging (LIDAR) is being used by the North Carolina Floodplain Mapping Program to generate digital elevation data. These highly accurate topographic
DATA VISUALIZATION GABRIEL PARODI STUDY MATERIAL: PRINCIPLES OF GEOGRAPHIC INFORMATION SYSTEMS AN INTRODUCTORY TEXTBOOK CHAPTER 7
 DATA VISUALIZATION GABRIEL PARODI STUDY MATERIAL: PRINCIPLES OF GEOGRAPHIC INFORMATION SYSTEMS AN INTRODUCTORY TEXTBOOK CHAPTER 7 Contents GIS and maps The visualization process Visualization and strategies
Evaluation of surface runoff conditions. scanner in an intensive apple orchard
 Evaluation of surface runoff conditions by high resolution terrestrial laser scanner in an intensive apple orchard János Tamás 1, Péter Riczu 1, Attila Nagy 1, Éva Lehoczky 2 1 Faculty of Agricultural
First Steps. Setup, data import, visualization and basic terrain analysis. Volker Wichmann
 SAGA First Steps Setup, data import, visualization and basic terrain analysis Volker Wichmann SAGA Setup on Windows Download of SAGA 2.0.8 binaries (1) www.saga-gis.org (2) >> Downloads (@ SourceForge)
5. GIS, Cartography and Visualization of Glacier Terrain
 5. GIS, Cartography and Visualization of Glacier Terrain 5.1. Garhwal Himalayan Glaciers 5.1.1. Introduction GIS is the computer system for capturing, storing, analyzing and visualization of spatial and
3D Model of the City Using LiDAR and Visualization of Flood in Three-Dimension
 3D Model of the City Using LiDAR and Visualization of Flood in Three-Dimension R.Queen Suraajini, Department of Civil Engineering, College of Engineering Guindy, Anna University, India, suraa12@gmail.com
COMPARISON OF SRTM AND 25K TOPOGRAPHIC MAPS IN TURKEY
 COMPARISON OF SRTM AND 25K TOPOGRAPHIC MAPS IN TURKEY Oztug Bildirici 1, Aydin Ustun, Necla Ulugtekin 2, H. Zahit Selvi 1, Alpay Abbak 1, Ilkay Bugdayci 1, A. Ozgur Dogru 2 1 Selcuk University, Faculty
A Method Using ArcMap to Create a Hydrologically conditioned Digital Elevation Model
 A Method Using ArcMap to Create a Hydrologically conditioned Digital Elevation Model High resolution topography derived from LiDAR data is becoming more readily available. This new data source of topography
Earth Data Science in The Era of Big Data and Compute
 Earth Data Science in The Era of Big Data and Compute E. Lynn Usery U.S. Geological Survey usery@usgs.gov http://cegis.usgs.gov U.S. Department of the Interior U.S. Geological Survey Board on Earth Sciences
Data source, type, and file naming convention
 Exercise 1: Basic visualization of LiDAR Digital Elevation Models using ArcGIS Introduction This exercise covers activities associated with basic visualization of LiDAR Digital Elevation Models using ArcGIS.
Tutorial 8 Raster Data Analysis
 Objectives Tutorial 8 Raster Data Analysis This tutorial is designed to introduce you to a basic set of raster-based analyses including: 1. Displaying Digital Elevation Model (DEM) 2. Slope calculations
White Paper. PlanetDEM 30. PlanetObserver 25/11/2014 - Update
 White Paper PlanetDEM 30 PlanetObserver 25/11/2014 - Update PlanetObserver France www.planetobserver.com msat@planetobserver.com Tel. +33 4 73 44 19 00 1. Introduction PlanetObserver presents PlanetDEM
NEW DIGITAL TERRAIN MODELING (DTM) TOOLS FOR CABLE ROUTE PLANNING by Dr. Jose M. Andres Makai Ocean Engineering Inc.
 TOOLS FOR CABLE ROUTE PLANNING by Dr. Jose M. Andres Makai Ocean Engineering Inc.") NEW DIGITAL TERRAIN MODELING (DTM) TOOLS FOR CABLE ROUTE PLANNING by Dr. Jose M. Andres Makai Ocean Engineering Inc. EXISTING CABLE ROUTE PLANNING TOOLS In recent years, methods used for submarine cable
NEW DIGITAL TERRAIN MODELING (DTM) TOOLS FOR CABLE ROUTE PLANNING by Dr. Jose M. Andres Makai Ocean Engineering Inc. EXISTING CABLE ROUTE PLANNING TOOLS In recent years, methods used for submarine cable
Enhanced DEM-based flow path delineation algorithms for urban drainage modelling
 Enhanced DEM-based flow path delineation algorithms for urban drainage modelling João Paulo Leitão, S. Boonya-aroonnet, D. Prodanović and Č. Maksimović Belo Horizonte, Brasil October, 2009 Outline Urban
3D Building Roof Extraction From LiDAR Data
 3D Building Roof Extraction From LiDAR Data Amit A. Kokje Susan Jones NSG- NZ Outline LiDAR: Basics LiDAR Feature Extraction (Features and Limitations) LiDAR Roof extraction (Workflow, parameters, results)
3D VISUALIZATION OF GEOTHERMAL WELLS DIRECTIONAL SURVEYS AND INTEGRATION WITH DIGITAL ELEVATION MODEL (DEM)
") Presented at Short Course VII on Exploration for Geothermal Resources, organized by UNU-GTP, GDC and KenGen, at Lake Bogoria and Lake Naivasha, Kenya, Oct. 27 Nov. 18, 2012. GEOTHERMAL TRAINING PROGRAMME
Presented at Short Course VII on Exploration for Geothermal Resources, organized by UNU-GTP, GDC and KenGen, at Lake Bogoria and Lake Naivasha, Kenya, Oct. 27 Nov. 18, 2012. GEOTHERMAL TRAINING PROGRAMME
APPLY EXCEL VBA TO TERRAIN VISUALIZATION
 APPLY EXCEL VBA TO TERRAIN VISUALIZATION 1 2 Chih-Chung Lin( ), Yen-Ling Lin ( ) 1 Secretariat, National Changhua University of Education. General Education Center, Chienkuo Technology University 2 Dept.
Create a folder on your network drive called DEM. This is where data for the first part of this lesson will be stored.
 In this lesson you will create a Digital Elevation Model (DEM). A DEM is a gridded array of elevations. In its raw form it is an ASCII, or text, file. First, you will interpolate elevations on a topographic
GIS: Geographic Information Systems A short introduction
 GIS: Geographic Information Systems A short introduction Outline The Center for Digital Scholarship What is GIS? Data types GIS software and analysis Campus GIS resources Center for Digital Scholarship
Managing Lidar (and other point cloud) Data. Lindsay Weitz Cody Benkelman
 Data. Lindsay Weitz Cody Benkelman") (and other point cloud) Data Lindsay Weitz Cody Benkelman Presentation Context What is lidar, and how does it work? Not this presentation! What can you do with lidar in ArcGIS? What does Esri recommend
(and other point cloud) Data Lindsay Weitz Cody Benkelman Presentation Context What is lidar, and how does it work? Not this presentation! What can you do with lidar in ArcGIS? What does Esri recommend
Digital Terrain Model Grid Width 10 m DGM10
 Digital Terrain Model Grid Width 10 m Status of documentation: 23.02.2015 Seite 1 Contents page 1 Overview of dataset 3 2 Description of the dataset contents 4 3 Data volume 4 4 Description of the data
OBJECTIVES. Identify the means by which latitude and longitude were created and the science upon which they are based.
 Name: Key OBJECTIVES Correctly define: isolines, gradient, topographic map, contour interval, hachured lines, profile, latitude, longitude, hydrosphere, lithosphere, atmosphere, elevation, model EARTH
Introduction to GIS. http://libguides.mit.edu/gis
 Introduction to GIS http://libguides.mit.edu/gis 1 Overview What is GIS? Types of Data and Projections What can I do with GIS? Data Sources and Formats Software Data Management Tips 2 What is GIS? 3 Characteristics
SLOPE, REFLECTANCE, AND VIEWSHEDS ALGORITHMS FOR ARC-SECOND DIGITAL ELEVATION MODELS INTRODUCTION
 SLOPE, REFLECTANCE, AND VIEWSHEDS ALGORITHMS FOR ARC-SECOND DIGITAL ELEVATION MODELS Peter L. Guth, Professor Department of Oceanography United States Naval Academy 572C Holloway Road Annapolis, Maryland
FOREST PARAMETER ESTIMATION BY LIDAR DATA PROCESSING
 P.-F. Mursa Forest parameter estimation by LIDAR data processing FOREST PARAMETER ESTIMATION BY LIDAR DATA PROCESSING Paula-Florina MURSA, Master Student Military Technical Academy, paula.mursa@gmail.com
Opportunities for the generation of high resolution digital elevation models based on small format aerial photography
 Opportunities for the generation of high resolution digital elevation models based on small format aerial photography Boudewijn van Leeuwen 1, József Szatmári 1, Zalán Tobak 1, Csaba Németh 1, Gábor Hauberger
Raster: The Other GIS Data
 04-Raster_Tutorial_Arcgis_93.Doc Page 1 of 11 Raster: The Other GIS Data Objectives Understand the raster format and how it is used to model continuous geographic phenomena Understand how projections &
Creating Slope-Enhanced Shaded-Relief Using Global Mapper
 Creating Slope-Enhanced Shaded-Relief Using Global Mapper Kent D. Brown Utah Geological Survey Introduction The purpose of this document is to demonstrate that slope-enhanced hillshade, or shaded-relief
Planning Terrestrial Radio Networks
 Planning Terrestrial Radio Networks Lab Exercise Manual IK2500 - Radio Communication, Basic Course September 23, 2008 Short Summary The scope of this lab is to help students to develop basic skills in
Chapter 5: Working with contours
 Introduction Contoured topographic maps contain a vast amount of information about the three-dimensional geometry of the land surface and the purpose of this chapter is to consider some of the ways in
American-Eurasian Journal of Sustainable Agriculture
 Copyright 2015, American-Eurasian Network for Scientific Information publisher American-Eurasian Journal of Sustainable Agriculture ISSN: 1995-0748 JOURNAL home page: http://www.aensiweb.com/aejsa 2015
Information Contents of High Resolution Satellite Images
 Information Contents of High Resolution Satellite Images H. Topan, G. Büyüksalih Zonguldak Karelmas University K. Jacobsen University of Hannover, Germany Keywords: satellite images, mapping, resolution,
This satellite photo was taken on October 29th, 2011 and locates the project neighborhood and site for the project.
 Page 1 of 6 N This satellite photo was taken on October 29th, 2011 and locates the project neighborhood and site for the project. The following page is the Assessor s Parcel Map which was used in coordination
Whitebox Geospatial Analysis Tools Tutorial Series. Tutorial 3: Streams and Watershed Extraction
 1 Whitebox Geospatial Analysis Tools Tutorial Series Tutorial 3: Streams and Watershed Extraction 2 Tutorial version 1.0, March, 2010 Written by John Lindsay, Whitebox Geospatial Analysis Tools Project
3D Capabilities of SPOT 6
 3D Capabilities of SPOT 6 P. Nonin, D. Decluseau, L. Gabet, M. Bernard* ASTRIUM GEO-Information Services, France Abstract. On September 9th, 2012 a new optical satellite, SPOT 6, was successfully launched
Introduction to GIS (Basics, Data, Analysis) & Case Studies. 13 th May 2004. Content. What is GIS?
 & Case Studies. 13 th May 2004. Content. What is GIS?") Introduction to GIS (Basics, Data, Analysis) & Case Studies 13 th May 2004 Content Introduction to GIS Data concepts Data input Analysis Applications selected examples What is GIS? Geographic Information
Introduction to GIS (Basics, Data, Analysis) & Case Studies 13 th May 2004 Content Introduction to GIS Data concepts Data input Analysis Applications selected examples What is GIS? Geographic Information
Image Analysis CHAPTER 16 16.1 ANALYSIS PROCEDURES
 CHAPTER 16 Image Analysis 16.1 ANALYSIS PROCEDURES Studies for various disciplines require different technical approaches, but there is a generalized pattern for geology, soils, range, wetlands, archeology,
The Production of Orienteering Maps in Austria
 The Production of Orienteering Maps in Austria Ditz Robert Institute for Military Geography, Federal Ministry of Defence and Sports, Austria Abstract. Due to changing technologies in collecting data, the
Applying GIS Analysis to Archaeological Research in Canada
 Applying GIS Analysis to Archaeological Research in Canada T A L K B Y D R. K I S H A S U P E R N A N T P R E S E N T E D A T G E O A L B E R T A 2 0 1 3 S E P T E M B E R 2 3, 2 0 1 3 Overview Review
Application of Google Earth for flood disaster monitoring in 3D-GIS
 Disaster Management and Human Health Risk II 271 Application of Google Earth for flood disaster monitoring in 3D-GIS M. Mori & Y. L. Chan Department of Information and Computer Science, Kinki University,
2D Modeling of Urban Flood Vulnerable Areas
 2D Modeling of Urban Flood Vulnerable Areas Sameer Dhalla, P.Eng. Dilnesaw Chekol, Ph.D. A.D. Latornell Conservation Symposium November 22, 2013 Outline 1. Toronto and Region 2. Evolution of Flood Management
This is Geospatial Analysis II: Raster Data, chapter 8 from the book Geographic Information System Basics (index.html) (v. 1.0).
 (v. 1.0).") This is Geospatial Analysis II: Raster Data, chapter 8 from the book Geographic Information System Basics (index.html) (v. 1.0). This book is licensed under a Creative Commons by-nc-sa 3.0 (http://creativecommons.org/licenses/by-nc-sa/
This is Geospatial Analysis II: Raster Data, chapter 8 from the book Geographic Information System Basics (index.html) (v. 1.0). This book is licensed under a Creative Commons by-nc-sa 3.0 (http://creativecommons.org/licenses/by-nc-sa/
Global environmental information Examples of EIS Data sets and applications
 METIER Graduate Training Course n 2 Montpellier - february 2007 Information Management in Environmental Sciences Global environmental information Examples of EIS Data sets and applications Global datasets
This high level land planning and design system will replace the land
 Performance Planning System () The following is a v1.3 feature analysis, which clarifies differences, between and American Planning Association (APA) Land Based Classification Standards (LBCS) for color
TOPOGRAPHICAL SURVEY REPORT - PART OF L.R No. 7413/11 Done on February 2015 at International Union for Conservation of Nature (IUCN) Eastern African
 Eastern African") TOPOGRAPHICAL SURVEY REPORT - PART OF L.R No. 7413/11 Done on February 2015 at International Union for Conservation of Nature (IUCN) Eastern African Regional Office 01 CHAPTER ONE Checklist Page 2 of 8
TOPOGRAPHICAL SURVEY REPORT - PART OF L.R No. 7413/11 Done on February 2015 at International Union for Conservation of Nature (IUCN) Eastern African Regional Office 01 CHAPTER ONE Checklist Page 2 of 8
Files Used in this Tutorial
 Generate Point Clouds Tutorial This tutorial shows how to generate point clouds from IKONOS satellite stereo imagery. You will view the point clouds in the ENVI LiDAR Viewer. The estimated time to complete
GIS Data assessment for Region II of Chile Implications for international Water Resource Databases
 GIS Data assessment for Region II of Chile Implications for international Water Resource Databases GIS in Water Resources (CE 394K) Term Paper Benjamin Bass December 2 nd, 2011 Wikimedia Commons SITHA
LiDAR Point Cloud Processing with
 LiDAR Research Group, Uni Innsbruck LiDAR Point Cloud Processing with SAGA Volker Wichmann Wichmann, V.; Conrad, O.; Jochem, A.: GIS. In: Hamburger Beiträge zur Physischen Geographie und Landschaftsökologie
Topographic Survey. Topographic Survey. Topographic Survey. Topographic Survey. CIVL 1101 Surveying - Introduction to Topographic Modeling 1/8
 IVL 1 Surveying - Introduction to Topographic Modeling 1/8 Introduction Topography - defined as the shape or configuration or relief or three dimensional quality of a surface Topography maps are very useful
Page 1 of 7 (document version 1)
") Lecture 2 - Data exploration This lecture will cover: Attribute queries Spatial queries Basic spatial analyses: Buffering Voronoi tessellation Cost paths / surfaces Viewsheds Hydrological modelling Autocorrelation
Lecture 2 - Data exploration This lecture will cover: Attribute queries Spatial queries Basic spatial analyses: Buffering Voronoi tessellation Cost paths / surfaces Viewsheds Hydrological modelling Autocorrelation
Raster Data Structures
 Raster Data Structures Tessellation of Geographical Space Geographical space can be tessellated into sets of connected discrete units, which completely cover a flat surface. The units can be in any reasonable
On the CyberShARE site you will find this interpolated version (labeled SRTMv4_90m)
") SRTM Data on Cyber-ShARE The Shuttle Radar Topography Mission (SRTM) data collected by NASA represents the most up-to-date, globally collected topography data set of the Earth. It makes up the first globally
SRTM Data on Cyber-ShARE The Shuttle Radar Topography Mission (SRTM) data collected by NASA represents the most up-to-date, globally collected topography data set of the Earth. It makes up the first globally
ESSENTIAL COMPONENTS OF WATER-LEVEL MONITORING PROGRAMS. Selection of Observation Wells
 ESSENTIAL COMPONENTS OF WATER-LEVEL MONITORING PROGRAMS Before discussing the uses and importance of long-term water-level data, it is useful to review essential components of a water-level monitoring
Chapter Contents Page No
 Chapter Contents Page No Preface Acknowledgement 1 Basics of Remote Sensing 1 1.1. Introduction 1 1.2. Definition of Remote Sensing 1 1.3. Principles of Remote Sensing 1 1.4. Various Stages in Remote Sensing
Request for Proposals for Topographic Mapping. Issued by: Teton County GIS and Teton County Engineering Teton County, Wyoming
 Request for Proposals for Topographic Mapping Issued by: Teton County GIS and Teton County Engineering Teton County, Wyoming Proposals due: 2:00PM MDT July 1, 2015 Proposals may be delivered to: Teton
Understanding Raster Data
 Introduction The following document is intended to provide a basic understanding of raster data. Raster data layers (commonly referred to as grids) are the essential data layers used in all tools developed
Impact of water harvesting dam on the Wadi s morphology using digital elevation model Study case: Wadi Al-kanger, Sudan
 Impact of water harvesting dam on the Wadi s morphology using digital elevation model Study case: Wadi Al-kanger, Sudan H. S. M. Hilmi 1, M.Y. Mohamed 2, E. S. Ganawa 3 1 Faculty of agriculture, Alzaiem
3D Analysis and Surface Modeling
 3D Analysis and Surface Modeling Dr. Fang Qiu Surface Analysis and 3D Visualization Surface Model Data Set Grid vs. TIN 2D vs. 3D shape Creating Surface Model Creating TIN Creating 3D features Surface
Remote Sensing an Introduction
 Remote Sensing an Introduction Seminar: Space is the Place Referenten: Anica Huck & Michael Schlund Remote Sensing means the observation of, or gathering information about, a target by a device separated
Compilation of Digital Elevation Model for Turkey in 3-Arc-Second Resolution by Using SRTM Data Supported with Local Elevation Data
 Chapter 10 Compilation of Digital Elevation Model for Turkey in 3-Arc-Second Resolution by Using SRTM Data Supported with Local Elevation Data I. Oztug Bildirici 1, Aydin Ustun 1, Necla Ulugtekin 2, H.
SHADOW Calculation of Flickering from WTGs
 Function Calculation and documentation of flickering effects in terms of hours per year during which a neighbor or an area would be exposed to flickering from nearby WTG rotors. Also maximum minutes per
Selection of Drainage Network Using Raster GIS A Case Study
 International Journal of Engineering Science Invention ISSN (Online): 2319 6734, ISSN (Print): 2319 6726 Volume 2 Issue 8 ǁ August. 2013 ǁ PP.35-40 Selection of Drainage Network Using Raster GIS A Case
A HYDROLOGIC NETWORK SUPPORTING SPATIALLY REFERENCED REGRESSION MODELING IN THE CHESAPEAKE BAY WATERSHED
 A HYDROLOGIC NETWORK SUPPORTING SPATIALLY REFERENCED REGRESSION MODELING IN THE CHESAPEAKE BAY WATERSHED JOHN W. BRAKEBILL 1* AND STEPHEN D. PRESTON 2 1 U.S. Geological Survey, Baltimore, MD, USA; 2 U.S.
CASE STUDY LANDSLIDE MONITORING
 Introduction Monitoring of terrain movements (unstable slopes, landslides, glaciers, ) is an increasingly important task for today s geotechnical people asked to prevent or forecast natural disaster that
Liberia Forest Mapping. World Bank January 2012
 Liberia Forest Mapping World Bank January 2012 Scope of presentation 1. Overview (5 min) 2. Service presentation (20 min) 3. Operational scenario (10min) 4. Service Utility Review (45 min) 5. Wrap-up and
Current status of image matching for Earth observation
 Current status of image matching for Earth observation Christian Heipke IPI - Institute for Photogrammetry and GeoInformation Leibniz Universität Hannover Secretary General, ISPRS Content Introduction
What is GIS? Geographic Information Systems. Introduction to ArcGIS. GIS Maps Contain Layers. What Can You Do With GIS? Layers Can Contain Features
 What is GIS? Geographic Information Systems Introduction to ArcGIS A database system in which the organizing principle is explicitly SPATIAL For CPSC 178 Visualization: Data, Pixels, and Ideas. What Can
Appendix C - Risk Assessment: Technical Details. Appendix C - Risk Assessment: Technical Details
 Appendix C - Risk Assessment: Technical Details Page C1 C1 Surface Water Modelling 1. Introduction 1.1 BACKGROUND URS Scott Wilson has constructed 13 TUFLOW hydraulic models across the London Boroughs
John F. Cotton College of Architecture & Environmental Design California Polytechnic State University San Luis Obispo, California JOHN F.
 SO L I DMO D E L I N GAS A TO O LFO RCO N S T RU C T I N SO G LA REN V E LO PE S by John F. Cotton College of Architecture & Environmental Design California Polytechnic State University San Luis Obispo,
The Wind Integration National Dataset (WIND) toolkit
 toolkit") The Wind Integration National Dataset (WIND) toolkit EWEA Wind Power Forecasting Workshop, Rotterdam December 3, 2013 Caroline Draxl NREL/PR-5000-60977 NREL is a national laboratory of the U.S. Department
The Wind Integration National Dataset (WIND) toolkit EWEA Wind Power Forecasting Workshop, Rotterdam December 3, 2013 Caroline Draxl NREL/PR-5000-60977 NREL is a national laboratory of the U.S. Department
Description of Simandou Archaeological Potential Model. 13A.1 Overview
 13A Description of Simandou Archaeological Potential Model 13A.1 Overview The most accurate and reliable way of establishing archaeological baseline conditions in an area is by conventional methods of
Geography 3251: Mountain Geography Assignment III: Natural hazards A Case Study of the 1980s Mt. St. Helens Eruption
 Name: Geography 3251: Mountain Geography Assignment III: Natural hazards A Case Study of the 1980s Mt. St. Helens Eruption Learning Objectives: Assigned: May 30, 2012 Due: June 1, 2012 @ 9 AM 1. Learn
Fort Dodge Stormwater Master Planning. Prepared By: Ralph C. Stark, Jr., P.E., C.F.M. Joel N. Krause, P.E., C.F.M.
 Fort Dodge Stormwater Master Planning Prepared By: Ralph C. Stark, Jr., P.E., C.F.M. Joel N. Krause, P.E., C.F.M. Project Location Project Background Flooding History Localized flooding and storm sewer
METHODOLOGY FOR LANDSLIDE SUSCEPTIBILITY AND HAZARD MAPPING USING GIS AND SDI
 The 8th International Conference on Geo-information for Disaster Management Intelligent Systems for Crisis Management METHODOLOGY FOR LANDSLIDE SUSCEPTIBILITY AND HAZARD MAPPING USING GIS AND SDI T. Fernández
3-D Object recognition from point clouds
 3-D Object recognition from point clouds Dr. Bingcai Zhang, Engineering Fellow William Smith, Principal Engineer Dr. Stewart Walker, Director BAE Systems Geospatial exploitation Products 10920 Technology
MIKE 21 FLOW MODEL HINTS AND RECOMMENDATIONS IN APPLICATIONS WITH SIGNIFICANT FLOODING AND DRYING
 1 MIKE 21 FLOW MODEL HINTS AND RECOMMENDATIONS IN APPLICATIONS WITH SIGNIFICANT FLOODING AND DRYING This note is intended as a general guideline to setting up a standard MIKE 21 model for applications
FUNDAMENTALS OF LANDSCAPE TECHNOLOGY GSD Harvard University Graduate School of Design Department of Landscape Architecture Fall 2006
 FUNDAMENTALS OF LANDSCAPE TECHNOLOGY GSD Harvard University Graduate School of Design Department of Landscape Architecture Fall 2006 6106/ M2 BASICS OF GRADING AND SURVEYING Laura Solano, Lecturer Name
WHAT IS GIS - AN INRODUCTION
 WHAT IS GIS - AN INRODUCTION GIS DEFINITION GIS is an acronym for: Geographic Information Systems Geographic This term is used because GIS tend to deal primarily with geographic or spatial features. Information
DEVELOPMENT OF REAL-TIME VISUALIZATION TOOLS FOR THE QUALITY CONTROL OF DIGITAL TERRAIN MODELS AND ORTHOIMAGES
 DEVELOPMENT OF REAL-TIME VISUALIZATION TOOLS FOR THE QUALITY CONTROL OF DIGITAL TERRAIN MODELS AND ORTHOIMAGES Dr.-Ing. Manfred Wiggenhagen University of Hanover, Germany Institute for Photogrammetry and
AUTOMATION OF FLOOD HAZARD MAPPING BY THE FEDERAL EMERGENCY MANAGEMENT AGENCY ABSTRACT INTRODUCTION
 AUTOMATION OF FLOOD HAZARD MAPPING BY THE FEDERAL EMERGENCY MANAGEMENT AGENCY Daniel M. Cotter Federal Emergency Management Agency Federal Insurance Administration Office of Risk Assessment 500 C Street,
Pima Regional Remote Sensing Program
 Pima Regional Remote Sensing Program Activity Orthophoto GIS Mapping and Analysis Implementing Agency Pima Association of Governments (Tucson, Arizona area Metropolitan Planning Organization) Summary Through
CHAPTER 9 SURVEYING TERMS AND ABBREVIATIONS
 CHAPTER 9 SURVEYING TERMS AND ABBREVIATIONS Surveying Terms 9-2 Standard Abbreviations 9-6 9-1 A) SURVEYING TERMS Accuracy - The degree of conformity with a standard, or the degree of perfection attained
TerraSAR-X Applications Guide
 TerraSAR-X Applications Guide Extract: Maritime Monitoring: Oil Spill Detection April 2015 Airbus Defence and Space Geo-Intelligence Programme Line Maritime Monitoring: Oil Spill Detection Issue As the
Plan Plus Volume 1 No 1 2002 (117-123)
") Plan Plus Volume 1 No 1 2002 (117-123) APPLICATION OF GIS (GEOGRAPHIC INFORMATION SYSTEM) FOR LANDSLIDE HAZARD ZONATION AND MAPPING DISASTER PRONE AREA: A STUDY OF KULEKHANI WATERSHED, NEPAL Purna Chandra
Plan Plus Volume 1 No 1 2002 (117-123) APPLICATION OF GIS (GEOGRAPHIC INFORMATION SYSTEM) FOR LANDSLIDE HAZARD ZONATION AND MAPPING DISASTER PRONE AREA: A STUDY OF KULEKHANI WATERSHED, NEPAL Purna Chandra
ArcGIS Spatial Analyst: Advanced GIS Spatial Analysis Using Raster and Vector Data
 ArcGIS Spatial Analyst: Advanced GIS Spatial Analysis Using Raster and Vector Data An ESRI White Paper December 2001 ESRI 380 New York St., Redlands, CA 92373-8100, USA TEL 909-793-2853 FAX 909-793-5953
Test Results Using the DTM Software of PCI
 M. Schlüter, B.-S. Schulz, C. Wende Test Results Using the DTM Software of PCI Bundesamt für Kartographie und Geodäsie Richard-Strauss-Allee 11 60598-Frankfurt (Main) Internet: Email: http://www.ifag.de
Lezione 19 Introduzione a Radio Mobile Freeware
 Corso di A.A. 2007-2008 Lezione 19 Introduzione a Radio Mobile Freeware Ing. Marco GALEAZZI 1 Che cos è? (1) Radio Mobile is freeware by Roger Coudé (VE2DBE). This freeware package is a terrain elevationmapping
An Introduction to Point Pattern Analysis using CrimeStat
 Introduction An Introduction to Point Pattern Analysis using CrimeStat Luc Anselin Spatial Analysis Laboratory Department of Agricultural and Consumer Economics University of Illinois, Urbana-Champaign
Interactive comment on A simple 2-D inundation model for incorporating flood damage in urban drainage planning by A. Pathirana et al.
 Hydrol. Earth Syst. Sci. Discuss., 5, C2756 C2764, 2010 www.hydrol-earth-syst-sci-discuss.net/5/c2756/2010/ Author(s) 2010. This work is distributed under the Creative Commons Attribute 3.0 License. Hydrology
ELEVATION CONTOUR ANALYSIS AND WATER BODY EXTRACTION FOR FINDING WATER SCARCITY LOCATIONS USING DEM
 World Journal of Science and Technology 2011, 1(12): 29-34 ISSN: 2231 2587 www.worldjournalofscience.com ELEVATION CONTOUR ANALYSIS AND WATER BODY EXTRACTION FOR FINDING WATER SCARCITY LOCATIONS USING
High Resolution RF Analysis: The Benefits of Lidar Terrain & Clutter Datasets
 0 High Resolution RF Analysis: The Benefits of Lidar Terrain & Clutter Datasets January 15, 2014 Martin Rais 1 High Resolution Terrain & Clutter Datasets: Why Lidar? There are myriad methods, techniques
Application of Remote Sensing and GIS in Solid Waste Management: A Case Study of Surroundings of River Yamuna, India
 International Journal of Environmental Engineering and Management. ISSN 2231-1319, Volume 4, Number 6 (2013), pp. 593-604 Research India Publications http://www.ripublication.com/ ijeem.htm Application
Creating Maps from SRTM Data Tutorial
 Creating Maps from SRTM Data Tutorial By Drunkrussian 10 Mar 06 Creating Maps from SRTM Data - Tutorial Shuttle Radar Topography Mission (SRTM) data is digital elevation data available for 80% of the world.
MEASURES OF VARIATION
 NORMAL DISTRIBTIONS MEASURES OF VARIATION In statistics, it is important to measure the spread of data. A simple way to measure spread is to find the range. But statisticians want to know if the data are
BIG DATA POSSIBILITIES AND CHALLENGES
 BIG DATA POSSIBILITIES AND CHALLENGES PROFESSOR AND CENTER DIRECTOR WHY BIG DATA? In God we trust - all others must bring data W. Edwards Deming (US engineer and statistician, 1900-1993) WHAT IS BIG DATA?
Kirkland Zoning Code 113.25
 Kirkland Zoning Code 113.25 Chapter 113 COTTAGE, CARRIAGE AND TWO/THREE-UNIT HOMES Sections: 113.05 User Guide 113.10 Voluntary Provisions and Intent 113.15 Housing Types Defined 113.20 Applicable Use