The role of daily precipitation
|
|
|
- Todd Reynard Reeves
- 7 years ago
- Views:
Transcription

1 The role of daily precipitation interpolation for the SWAT model performance across different spatial and temporal scales MATEUSZ SZCZEŚNIAK MIKOŁAJ PINIEWSKI TOMASZ BEREZOWSKI WARSAW UNIVERSITY OF LIFE SCIENCES WULS SGGW


2 Default SWAT method Based on the Nearest Neighbour For each subbasin the amount of precipitation is taken from the nearest station Missing values replaced by SWAT built in Weather Generator (WXGEN)
3 Objectives Do selected spatial interpolation techniques can improve the performance of the SWAT model in predicting flows in differrent spatial and temporal scales?
4 Case studies Case one: 11 meso scale (119 to 3935 km 2 ) sub catchments lying in the Sulejów reservoir catchment finished and published* Case two: 80 catchments (500 to 3000 km 2 ) Vistula and Odra Basins ongoing study * Szcześniak, M., & Piniewski, M. (2015). Improvement of Hydrological Simulations by Applying Daily Precipitation Interpolation Schemes in Meso Scale Catchments. Water, 7(2),


5 Sulejów reservoir catchment Part of the Pilica River catchment, located in the central Poland Total area 4,928 km 2


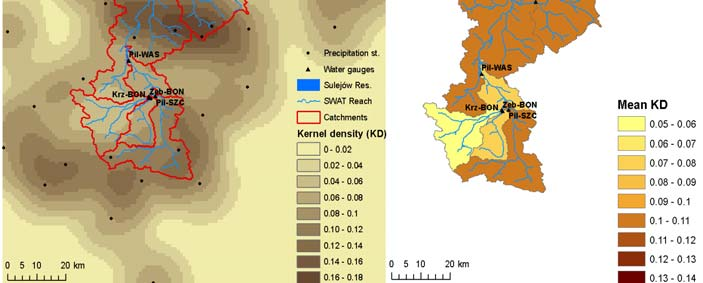
6 Meteo inputs 49 stations, mainly precipitation 30 years of daily data
7 Used methods of spatial interpolation Aside of the default SWAT method (Def), three methods were used: Thiessen Polygons (TP) Inverse Distance Weighted (IDW) Ordinary Kriging (OK) SWAT CUP SUFI 2 algorithm was used as a tool for evaluation of the results
 a Def b TP c IDW d OK Example daily")
8 Ten slajd z różnicami w interpolacji? Mean yearly precipitation (30y) a Def b TP c IDW d OK Example daily precipitation a Def b TP c IDW d OK
9 SUFI 2 calibration parameters Name Lower limit Upper limit Definition ESCO.hru Soil evaporation compensation factor EPCO.hru Plant uptake compensation factor SOL_Z().sol Depth from soil surface to the bottom of layer SOL_AWC().sol Available water capacity of the soil layer SOL_BD().sol Moist bulk density SOL_K().sol Saturated hydraulic conductivity HRU_SLP.hru Average slope steepness ALPHA_BF.gw Baseflow alpha factor GW_DELAY.gw Groundwater delay time GWQMN.gw Threshold depth of water in the shallow aquifer required for return flow to occur GW_REVAP.gw Groundwater "revap" coefficient RCHRG_DP.gw Deep aquifer percolation fraction CN2.mgt Initial SCS runoff curve nr for moisture condition II SURLAG.bsn Surface runoff lag coefficient SLSUBBSN.hru Average slope length (m) CH_N2.rte Manning's "n" value for the main channel CH_N1.sub Manning's "n" value for the tributary channel ( ) SMTMP.bsn Snow melt base temperature TIMP.bsn Snow pack temperature lag factor SNOCOVMX.bsn Minimum snow water content that corresponds to 100% snow cover Note :1 parameter multiplied by 1+r, where r is a number between lower and upper limits, 2 parameter replaced by the new value from the range.
10 Results Box plots of PBIAS across all 11 flow gauging stations for different interpolation methods (Def Default version, TP Thiessen Polygons, IDW Inverse Distance Weighted, OK Ordinary Kriging) and different objective function / temporal aggregation combinations (A, B, C, D ). Box plots of selected objective functions across all 11 flow gauging stations for different interpolation methods (Def Default version, TP Thiessen Polygons, IDW Inverse Distance Weighted, OK Ordinary Kriging)
11 Box plots of percent changes in RMSE across all 11 flow gauging stations for different interpolation methods (Def Default version, TP Thiessen Polygons, IDW Inverse Distance Weighted, OK Ordinary Kriging) and different objective function / temporal aggregation combinations (A, B,, C, D ). Scatter plots of changes in different obbjective functions and various catchment descriptors for relationships with significant correlation (at significance level 0.05
12 Conclusions from Sulejów Case the most complex OK method outperformed other methods in terms of NSE, whereas OK, IDW and TP outperformed Def in terms of br 2, regardless of temporal aggregation The difference between TP, IDW, OK and Def was spatially variable. Part of this variability was attributed to catchment properties. Spatial interpolation can improve the model simulations however various methods should be tested as the results tend to be catchment specific.


13 Vistula and Odra Basins Part of the ongoing CHASE PL project Vistula River basin area km 2 Odra River basin area km 2 Vistula the 2nd largest river basin in EU, Odra the 5th

14 Vistula and Odra: 2nd and 5th largest river basins in EU 1
15 Development of gridded temperature and precipitation datasets for modelling overview Item Minimum and maximum temperature Precipitation Domain Poland + Vistula and Odra basins Data sources IMGW PIB Polish stations DWD German and Czech stations ECAD, NOAA NCDC Slovak, Ukrainian and Belarusian stations Preprocessing Quality assessment Quality assessment Richter correction for precipitation undercatch Interpolation method Kriging with elevation as external drift Library R gstat Time frame Resolution 5 km grid in the projected coordinate system PUWG1992 Output format.tiff files (one file per variable per day) Cross validation All stations, for each day. Both temporal and spatial scale SWAT input Aggregation at subbasin level Combination of Universal Kriging and Indicator Kriging (for wet day probability estimation)
16 Temperature and precipitation stations network
17 Annual variability of available data Cross validation results: standardized RMSE Precipitation Median range , with more than 85% of RMSE values not exceeding one standard deviation Range: Negative correlation with the numer of available stations Errors depend on the density of the observation network

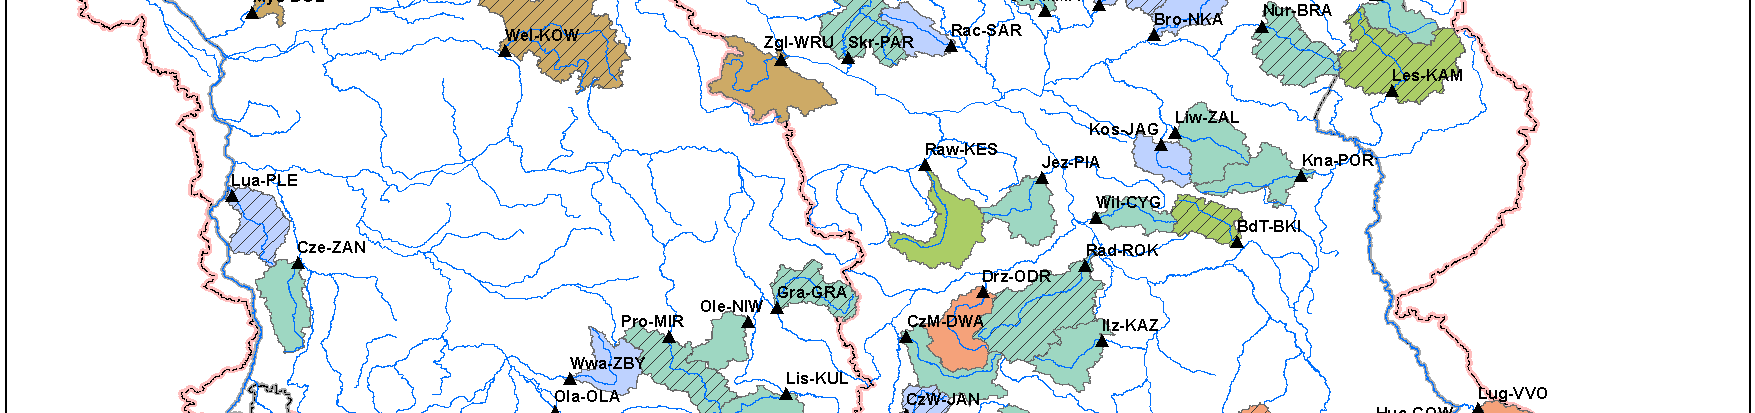

18 Catchments used in study Odra outlet Vistula outlet
19 Mean yearly precipitation, years
20 Results Daily KGE Daily KGE Def Kriging Def Kriging Box plot of KGE objective function across all 80 flow gauging stations for Default method Def and Universal Kriging Box plot of KGE objective function across all flow gauging stations (except Lug VVO) for Default method Def and Universal Kriging
21 Default KD R² = KGE objective function for whole Vistula and Odra catchments Gauge Vistula outlet KGE Default KGE Kriging KGE Kriging Odra outlet KD R² = KGE Scatter plots of KGE and Kernel Density
22 Conclusions from Vistula and Odra case Further investigation of the used interpolation method is needed
Figure 1.1 The Sandveld area and the Verlorenvlei Catchment - 2 -
 Figure 1.1 The Sandveld area and the Verlorenvlei Catchment - 2 - Figure 1.2 Homogenous farming areas in the Verlorenvlei catchment - 3 - - 18 - CHAPTER 3: METHODS 3.1. STUDY AREA The study area, namely
Climate change impact assessment for selected sectors in Poland
 Climate change impact assessment for selected sectors in Poland Tomasz Okruszko (WULS) on behalf of CHASE_PL consortium 9 November 2015 - Met Office data for 2015 so far shows that, for the first time,
SWAT INPUT DATA:.GW CHAPTER 24
 CHAPTER 24 SWAT INPUT DATA:.GW SWAT partitions groundwater into two aquifer systems: a shallow, unconfined aquifer which contributes return flow to streams within the watershed and a deep, confined aquifer
Lars-Göran Gustafsson, DHI Water and Environment, Box 3287, S-350 53 Växjö, Sweden
 Alternative Drainage Schemes for Reduction of Inflow/Infiltration - Prediction and Follow-Up of Effects with the Aid of an Integrated Sewer/Aquifer Model Introduction Lars-Göran Gustafsson, DHI Water and
Abaya-Chamo Lakes Physical and Water Resources Characteristics, including Scenarios and Impacts
 LARS 2007 Catchment and Lake Research Abaya-Chamo Lakes Physical and Water Resources Characteristics, including Scenarios and Impacts Seleshi Bekele Awulachew International Water Management Institute Introduction
Hydrologic Modeling using HEC-HMS
 Hydrologic Modeling using HEC-HMS Prepared by Venkatesh Merwade School of Civil Engineering, Purdue University vmerwade@purdue.edu April 2012 Introduction The intent of this exercise is to introduce you
AZ EGER-PATAK HIDROLÓGIAI VIZSGÁLATA, A FELSZÍNI VÍZKÉSZLETEK VÁRHATÓ VÁLTOZÁSÁBÓL ADÓDÓ MÓDOSULÁSOK AZ ÉGHAJLATVÁLTOZÁS HATÁSÁRA
 AZ EGER-PATAK HIDROLÓGIAI VIZSGÁLATA, A FELSZÍNI VÍZKÉSZLETEK VÁRHATÓ VÁLTOZÁSÁBÓL ADÓDÓ MÓDOSULÁSOK AZ ÉGHAJLATVÁLTOZÁS HATÁSÁRA GÁBOR KEVE 1, GÉZA HAJNAL 2, KATALIN BENE 3, PÉTER TORMA 4 EXTRAPOLATING
Flash Flood Science. Chapter 2. What Is in This Chapter? Flash Flood Processes
 Chapter 2 Flash Flood Science A flash flood is generally defined as a rapid onset flood of short duration with a relatively high peak discharge (World Meteorological Organization). The American Meteorological
Module 6 : Quantity Estimation of Storm Water. Lecture 6 : Quantity Estimation of Storm Water
 1 P age Module 6 : Quantity Estimation of Storm Water Lecture 6 : Quantity Estimation of Storm Water 2 P age 6.1 Factors Affecting the Quantity of Stormwater The surface run-off resulting after precipitation
Hydrologic Modeling System HEC-HMS
 Hydrologic Engineering Center Hydrologic Modeling System HEC-HMS Release Notes Version 4.0 December 2013 Approved for Public Release Distribution Unlimited Hydrologic Modeling System HEC-HMS, Release Notes
Training session for the. Firm Yield Estimator. Version 1.0. Prepared for the Massachusetts Department of Environmental Protection
 Training session for the Firm Yield Estimator Version 1.0 Prepared for the Massachusetts Department of Environmental Protection June 6, 2000 Firm Yield Estimator - Introduction Software tool for estimating
Titelmasterformat durch Klicken. bearbeiten
 Evaluation of a Fully Coupled Atmospheric Hydrological Modeling System for the Sissili Watershed in the West African Sudanian Savannah Titelmasterformat durch Klicken June, 11, 2014 1 st European Fully
 1 2 A very short description of the functional center network: regarding the Hydraulic and Hydrogeological risk, the national alert system is ensured by the National Civil Protection Department (DPCN),
Basin-Scale Stream-Aquifer Modeling of the Lower Arkansas River, Colorado
 Hydrology Days Basin-Scale Stream-Aquifer Modeling of the Lower Arkansas River, Colorado Enrique Triana 1 Graduate Research Assistant and PhD candidate, Civil Engineering Department, Colorado State University,
Drought in the Czech Republic in 2015 A preliminary summary
 Drought in the Czech Republic in 2015 A preliminary summary October 2015, Prague DISCLAIMER All data used in this preliminary report are operational and might be a subject of change during quality control.
Impact of water harvesting dam on the Wadi s morphology using digital elevation model Study case: Wadi Al-kanger, Sudan
 Impact of water harvesting dam on the Wadi s morphology using digital elevation model Study case: Wadi Al-kanger, Sudan H. S. M. Hilmi 1, M.Y. Mohamed 2, E. S. Ganawa 3 1 Faculty of agriculture, Alzaiem
Estimating Potential Reduction Flood Benefits of Restored Wetlands
 Estimating Potential Reduction Flood Benefits of Restored Wetlands Kenneth W. Potter University of Wisconsin Introduction Throughout the summer of 1993 a recurring question was the impact of wetland drainage
Hydrologic Data Report
 Hydrologic Data Report Introduction This installment reports on the hydrologic conditions for the week of 4-16-2015, presenting hydrologic information about the American River Basin in California. The
Watershed Modeling System
 Watershed Modeling System WMS v8.0 MARICOPA COUNTY TUTORIALS TABLE OF CONTENTS 1 MARICOPA COUNTY: NFF AND HEC-1... 1-1 1.1 OBJECTIVES... 1-1 1.2 DELINEATING THE WATERSHED... 1-1 1.3 BUILDING THE NFF SIMULATION...
Geoprocessing Tools for Surface and Basement Flooding Analysis in SWMM
 3 Geoprocessing Tools for Surface and Basement Flooding Analysis in SWMM Eric White, James Knighton, Gary Martens, Matthew Plourde and Rajesh Rajan A geoprocessing routine was used for the development
A HYDROLOGIC NETWORK SUPPORTING SPATIALLY REFERENCED REGRESSION MODELING IN THE CHESAPEAKE BAY WATERSHED
 A HYDROLOGIC NETWORK SUPPORTING SPATIALLY REFERENCED REGRESSION MODELING IN THE CHESAPEAKE BAY WATERSHED JOHN W. BRAKEBILL 1* AND STEPHEN D. PRESTON 2 1 U.S. Geological Survey, Baltimore, MD, USA; 2 U.S.
Tutorial - PEST. Visual MODFLOW Flex. Integrated Conceptual & Numerical Groundwater Modeling
 Tutorial - PEST Visual MODFLOW Flex Integrated Conceptual & Numerical Groundwater Modeling PEST with Pilot Points Tutorial This exercise demonstrates some of the advanced and exiting opportunities for
Applying MIKE SHE to define the influence of rewetting on floods in Flanders
 Applying MIKE SHE to define the influence of rewetting on floods in Flanders MARK HENRY RUBARENZYA 1, PATRICK WILLEMS 2, JEAN BERLAMONT 3, & JAN FEYEN 4 1,2,3 Hydraulics Laboratory, Department of Civil
Appendix C - Risk Assessment: Technical Details. Appendix C - Risk Assessment: Technical Details
 Appendix C - Risk Assessment: Technical Details Page C1 C1 Surface Water Modelling 1. Introduction 1.1 BACKGROUND URS Scott Wilson has constructed 13 TUFLOW hydraulic models across the London Boroughs
Use of numerical weather forecast predictions in soil moisture modelling
 Use of numerical weather forecast predictions in soil moisture modelling Ari Venäläinen Finnish Meteorological Institute Meteorological research ari.venalainen@fmi.fi OBJECTIVE The weather forecast models
Environmental Data Management Programs
 Hydrologic Engineering Centre (HEC) Software CD Collection of programs, developed by the U.S. Army Corps of Engineers Environmental Data Management Programs Name: HEC-DSS Package Purpose: Data Storage
Water Supply. Simulation of Water Distribution Networks. Mohammad N. Almasri. Optimal Design of Water Distribution Networks Mohammad N.
 Water Supply Simulation of Water Distribution Networks The Use of EPANET Mohammad N. Almasri 1 Introduction This presentation focuses on two issues: The simulation of water distribution networks (WDNs)
P02 Calibration of Density Driven Flow Model for the Freshwater Lens beneath the North Sea Island Borkum by Geophysical Data
 P02 Calibration of Density Driven Flow Model for the Freshwater Lens beneath the North Sea Island Borkum by Geophysical Data H. Sulzbacher (LIAG), H. Wiederhold* (LIAG), M. Grinat (LIAG), J. Igel (LIAG),
Application of Numerical Weather Prediction Models for Drought Monitoring. Gregor Gregorič Jožef Roškar Environmental Agency of Slovenia
 Application of Numerical Weather Prediction Models for Drought Monitoring Gregor Gregorič Jožef Roškar Environmental Agency of Slovenia Contents 1. Introduction 2. Numerical Weather Prediction Models -
ANALYSIS OF RAINFALL AND ITS INFLOW INTO MOBILE, ALABAMA S, ESLAVA SEWER SHED SYSTEM
 ANALYSIS OF RAINFALL AND ITS INFLOW INTO MOBILE, ALABAMA S, ESLAVA SEWER SHED SYSTEM Jerrod Frederking, Department of Earth Sciences, University of South Alabama, Mobile, AL 36688. E-mail: twisterj@gmail.com.
Global Water Resources
 Global Water Resources Highlights from assessment activities over the past two decades, which are used to establish present and future water trends, reveal that: 1. Freshwater resources are unevenly distributed,
PLUSK the common Polish Slovak web portal of international system of information exchange
 PLUSK the common Polish Slovak web portal of international system of information exchange Regionalny Zarząd Gospodarki Wodnej w Krakowie www.krakow.rzgw.gov.pl EUROPE-INBO 2011 PORTO, 27-30 September 2011
Flash Flood Guidance Systems
 Flash Flood Guidance Systems Introduction The Flash Flood Guidance System (FFGS) was designed and developed by the Hydrologic Research Center a non-profit public benefit corporation located in of San Diego,
APPENDIX B DESIGN GUIDELINES FOR APPROVED TREATMENT METHODS
 APPENDIX B DESIGN GUIDELINES FOR APPROVED TREATMENT METHODS PLANTER BOXES 1. Determine the impervious area contributing flow to the planter box (see Chapter 4.2). 2. Assumption: Typical soil infiltration
Latin American and Caribbean Flood and Drought Monitor Tutorial Last Updated: November 2014
 Latin American and Caribbean Flood and Drought Monitor Tutorial Last Updated: November 2014 Introduction: This tutorial examines the main features of the Latin American and Caribbean Flood and Drought
Cloud Model Verification at the Air Force Weather Agency
 2d Weather Group Cloud Model Verification at the Air Force Weather Agency Matthew Sittel UCAR Visiting Scientist Air Force Weather Agency Offutt AFB, NE Template: 28 Feb 06 Overview Cloud Models Ground
SWMM-CAT User s Guide
 EPA/600/R-14/428 September 2014 www.epa.gov/research n t SWMM-CAT User s Guide photo photo Office of Research and Development Water Supply and Water Resources Division EPA 600-R-14-428 September 2014 SWMM-CAT
Lesson 15 - Fill Cells Plugin
 15.1 Lesson 15 - Fill Cells Plugin This lesson presents the functionalities of the Fill Cells plugin. Fill Cells plugin allows the calculation of attribute values of tables associated with cell type layers.
Performing a Steady Flow Analysis
 C H A P T E R 7 Performing a Steady Flow Analysis This chapter discusses how to calculate steady flow water surface profiles. The chapter is divided into two parts. The first part discusses how to enter
National Weather Service Flash Flood Modeling and Warning Services
 National Weather Service Flash Flood Modeling and Warning Services Seann Reed, Middle Atlantic River Forecast Center Peter Ahnert, Middle Atlantic River Forecast Center August 23, 2012 USACE Flood Risk
Impact of Warming on Outflows from Selected Upper Watersheds in California
 Impact of Warming on Outflows from Selected Upper Watersheds in California Guobiao Huang (CA DWR), Tariq Kadir (CA DWR) and Francis Chung (CA DWR) California Water and Environmental Modeling Forum Pacific
Application of global 1-degree data sets to simulate runoff from MOPEX experimental river basins
 18 Large Sample Basin Experiments for Hydrological Model Parameterization: Results of the Model Parameter Experiment. IAHS Publ. 37, 26. Application of global 1-degree data sets to simulate from experimental
APPLICATION OF SATELLITE DATA FOR IMPROVED FLOOD FORECASTING AND MAPPING
 4 th International Symposium on Flood Defence: Managing Flood Risk, Reliability and Vulnerability Toronto, Ontario, Canada, May 6-8, 2008 APPLICATION OF SATELLITE DATA FOR IMPROVED FLOOD FORECASTING AND
Integrated Water Management System for Training of Main Components of Crisis Management
 Integrated Water Management System for Training of Main Components of Crisis Management Jakub Krejčí 1, Jan Daňhelka 2, Jiří Zezulák 3 1,3 Department of Applied Geoinformatics and Spatial Planning CULS
Damage Assessment in a large River Basin The Mekong Experience. Phan Nguyen& Anthony Green Mekong River Commission
 Damage Assessment in a large River Basin The Mekong Experience Phan Nguyen& Anthony Green Mekong River Commission Contents 1. Features and vulnerabilities 2. Influence of Changing Climate 3. Damage Assessment
FLOODPLAIN DELINEATION IN MUGLA-DALAMAN PLAIN USING GIS BASED RIVER ANALYSIS SYSTEM
 FLOODPLAIN DELINEATION IN MUGLA-DALAMAN PLAIN USING GIS BASED RIVER ANALYSIS SYSTEM Dr. Murat Ali HATİPOĞLU Fatih KESKİN Kemal SEYREK State Hydraulics Works (DSI), Investigation and Planning Department
Havnepromenade 9, DK-9000 Aalborg, Denmark. Denmark. Sohngaardsholmsvej 57, DK-9000 Aalborg, Denmark
 Urban run-off volumes dependency on rainfall measurement method - Scaling properties of precipitation within a 2x2 km radar pixel L. Pedersen 1 *, N. E. Jensen 2, M. R. Rasmussen 3 and M. G. Nicolajsen
Nowcasting: analysis and up to 6 hours forecast
 Nowcasting: analysis and up to 6 hours forecast Very high resoultion in time and space Better than NWP Rapid update Application oriented NWP problems for 0 6 forecast: Incomplete physics Resolution space
Hydrologic Modeling System HEC-HMS
 Hydrologic Engineering Center Hydrologic Modeling System HEC-HMS Quick Start Guide Version 4.0 December 2013 Approved for Public Release Distribution Unlimited CPD-74D REPORT DOCUMENTATION PAGE Form Approved
Fort Cobb Basin - Modeling and Land Cover Classification DRAFT. Submitted to. Oklahoma Department of Environmental Quality.
 Fort Cobb Basin - Modeling and Land Cover Classification DRAFT Submitted to Oklahoma Department of Environmental Quality Submitted by Dr. Daniel E. Storm Mr. Phillip R. Busteed Mr. Michael J. White Biosystems
MODELING SPATIAL DIFFERENCES IN SNOWMELT RUNOFF TIMING. Frederic C. Lott and Jessica D. Lundquist 1 ABSTRACT INTRODUCTION
 MODELING SPATIAL DIFFERENCES IN SNOWMELT RUNOFF TIMING Frederic C. Lott and Jessica D. Lundquist 1 ABSTRACT Discharge in small, tributary streams affects water table heights, riparian vegetation, and habitat
GEOENGINE MSc in Geomatics Engineering (Master Thesis) Anamelechi, Falasy Ebere
 Anamelechi, Falasy Ebere") Master s Thesis: ANAMELECHI, FALASY EBERE Analysis of a Raster DEM Creation for a Farm Management Information System based on GNSS and Total Station Coordinates Duration of the Thesis: 6 Months Completion
Master s Thesis: ANAMELECHI, FALASY EBERE Analysis of a Raster DEM Creation for a Farm Management Information System based on GNSS and Total Station Coordinates Duration of the Thesis: 6 Months Completion
National Dam Safety Program Technical Seminar #22. When is Flood Inundation Mapping Not Applicable for Forecasting
 National Dam Safety Program Technical Seminar #22 Thursday February 19 th 2015 Emmittsburg, MD When is Flood Inundation Mapping Not Applicable for Forecasting Victor Hom Hydrologic Services Division National
How To Assess The Vulnerability Of The Neman River To Climate Change
 Management of the Neman River basin with account of adaptation to climate change Progress of the pilot project since February, 2011 Vladimir Korneev, Central Research Institute for Complex Use of Water
The Rational Method. David B. Thompson Civil Engineering Deptartment Texas Tech University. Draft: 20 September 2006
 The David B. Thompson Civil Engineering Deptartment Texas Tech University Draft: 20 September 2006 1. Introduction For hydraulic designs on very small watersheds, a complete hydrograph of runoff is not
CHAPTER 2 HYDRAULICS OF SEWERS
 CHAPTER 2 HYDRAULICS OF SEWERS SANITARY SEWERS The hydraulic design procedure for sewers requires: 1. Determination of Sewer System Type 2. Determination of Design Flow 3. Selection of Pipe Size 4. Determination
Cloud/Hydrometeor Initialization in the 20-km RUC Using GOES Data
 WORLD METEOROLOGICAL ORGANIZATION COMMISSION FOR BASIC SYSTEMS OPEN PROGRAMMME AREA GROUP ON INTEGRATED OBSERVING SYSTEMS EXPERT TEAM ON OBSERVATIONAL DATA REQUIREMENTS AND REDESIGN OF THE GLOBAL OBSERVING
Rational Method Hydrologic Calculations with Excel. Rational Method Hydrologic Calculations with Excel, Course #508. Presented by:
 Rational Method Hydrologic Calculations with Excel, Course #508 Presented by: PDH Enterprises, LLC PO Box 942 Morrisville, NC 27560 www.pdhsite.com Calculation of peak storm water runoff rate from a drainage
How To Calculate Flood Damage Potential In European Landscape
 Background/Introduction RISK ANALYSIS MODULE 3, CASE STUDY 2 Flood Damage Potential at European Scale By Dr. Peter Burek There is good reason to be concerned about the growth of flood losses in Europe.
Operational methodology to assess flood damages in Europe
 IIASA-DPRI 2008 Operational methodology to assess flood damages in Europe Contributors: Nicola Lugeri, Carlo Lavalle, Elisabetta Genovese 1 Focus of ADAM work on extremes Types Floods, Heat-wave, Drought
Satellite derived Groundwater Storage Es4mates and Opportuni4es for Expanding Research in Arid Environments
 Satellite derived Groundwater Storage Es4mates and Opportuni4es for Expanding Research in Arid Environments NASA Ames DEVELOP Program Summer 2011 Amber Kuss, San Francisco State University William Brandt,
Risk and vulnerability assessment of the build environment in a dynamic changing society
 Risk and vulnerability assessment of the build environment in a dynamic changing society Limnei Nie SINTEF Building and infrastructure, P.O.Box 124 Blindern, NO-0314 Oslo, Norway. linmei.nie@sintef.no
DESWAT project (Destructive Water Abatement and Control of Water Disasters)
") A new national hydrological forecast and warning system is now in advanced implementation phase, within the Romanian Waters National Administration, in the framework of DESWAT project. The main objectives
A new national hydrological forecast and warning system is now in advanced implementation phase, within the Romanian Waters National Administration, in the framework of DESWAT project. The main objectives
Italy - Porto Tolle: storage in offshore saline aquifer
 Italy - Porto Tolle: storage in offshore saline aquifer Monia Politi Enel - Engineering & Innovation Division - Research CO2GeoNet Open Forum 9-11 May 2011, San Servolo Island, Venice High level overview
Real-time hazard impact modelling for surface water flooding: some UK developments
 Real-time hazard impact modelling for surface water flooding: some UK developments Steven Cole 1, Bob Moore 1, Timothy Aldridge 2, Andy Lane 3,4 and Stefan Laeger 4 International Conference on Flood Resilience,
Quality Assurance Reviews of Hydraulic Models Developed for the Central Valley Floodplain Evaluation and Delineation Program
 Quality Assurance Reviews of Hydraulic Models Developed for the Central Valley Floodplain Evaluation and Delineation Program Techniques Applied and Lessons Learned Seth Ahrens, P.E., CFM Selena Forman,
CHAPTER 3 STORM DRAINAGE SYSTEMS
 CHAPTER 3 STORM DRAINAGE SYSTEMS 3.7 Storm Drains 3.7.1 Introduction After the tentative locations of inlets, drain pipes, and outfalls with tail-waters have been determined and the inlets sized, the next
Application of TREECS to Strontium 90 for Borschi Watershed near Chernobyl, Ukraine
 Application of TREECS to Strontium 90 for Borschi Watershed near Chernobyl, Ukraine by Mark S. Dortch PURPOSE: The Training Range Environmental Evaluation and Characterization System (TREECS ) (http://el.erdc.usace.army.mil/treecs/)
An Investigation of Potential Hydrologic and Management Impacts on the Bull Run System
 The Impacts of Climate Change on Portland's Water Supply: An Investigation of Potential Hydrologic and Management Impacts on the Bull Run System Dr. Richard N. Palmer and Margaret Hahn Department of Civil
Standardized Runoff Index (SRI)
") Standardized Runoff Index (SRI) Adolfo Mérida Abril Javier Gras Treviño Contents 1. About the SRI SRI in the world Methodology 2. Comments made in Athens on SRI factsheet 3. Last modifications of the factsheet
Standardized Runoff Index (SRI) Adolfo Mérida Abril Javier Gras Treviño Contents 1. About the SRI SRI in the world Methodology 2. Comments made in Athens on SRI factsheet 3. Last modifications of the factsheet
Climate and Weather. This document explains where we obtain weather and climate data and how we incorporate it into metrics:
 OVERVIEW Climate and Weather The climate of the area where your property is located and the annual fluctuations you experience in weather conditions can affect how much energy you need to operate your
An innovative approach to Floods and Fire Risk Assessment and Management: the FLIRE Project
 8 th International Conference of EWRA Water Resources Management in an Interdisciplinary and Changing Context 26-29 June 2013, Porto, Portugal An innovative approach to Floods and Fire Risk Assessment
Barometric Effects on Transducer Data and Groundwater Levels in Monitoring Wells D.A. Wardwell, October 2007
 Barometric Effects on Transducer Data and Groundwater Levels in Monitoring Wells D.A. Wardwell, October 2007 Barometric Effects on Transducer Data Barometric Fluctuations can Severely Alter Water Level
Ruissellement du Bassin Précipitation Abstractions Hydrogramme Flux de Base. Superposition Routage
 HEC-1 Leçon 11 This lesson will focus on how WMS can be used to develop HEC-1 modeling parameters and not on the fundamental hydrologic principles simulated by HEC-1. 1 Vue D Emsemble Utilisés Couramment
Evaluation of Open Channel Flow Equations. Introduction :
 Evaluation of Open Channel Flow Equations Introduction : Most common hydraulic equations for open channels relate the section averaged mean velocity (V) to hydraulic radius (R) and hydraulic gradient (S).
Use of Geographic Information Systems in late blight warning service in Germany. Kleinhenz, Zeuner, Jung, Martin, Röhrig, Endler
 Use of Geographic Information Systems in late blight warning service in Germany Kleinhenz, Zeuner, Jung, Martin, Röhrig, Endler Structure of ZEPP 14 Crop Protection Services of the German Federal States
Review of Soil Moisture Calculation Method. 2. Conceptual Model of Soil Moisture Over a Shallow Water Table
 1 Review of Soil Moisture Calculation Method 1. Introduction In accordance with the Habitats Directive, the Environment Agency is required to carry out an appropriate assessment when considering applications
The Water Cycle Now You See It, Now You Don t
 The Water Cycle Now You See It, Now You Don t Unit: Salinity Patterns & the Water Cycle l Grade Level: Elementary l Time Required: Introduction - 30 min. - Activity as groups 45min Wrap Up 20 min l Content
HYDROLOGICAL IMPACTS DUE TO LAND-USE AND LAND-COVER CHANGES OF KETAR WATERSHED, LAKE ZIWAY CATCHMENT, ETHIOPIA
 International Journal of Civil Engineering and Technology (IJCIET) Volume 6, Issue 10, Oct 2015, pp. 36-45, Article ID: IJCIET_06_10_004 Available online at http://www.iaeme.com/ijciet/issues.asp?jtype=ijciet&vtype=6&itype=10
EXPLORING SPATIAL PATTERNS IN YOUR DATA
 EXPLORING SPATIAL PATTERNS IN YOUR DATA OBJECTIVES Learn how to examine your data using the Geostatistical Analysis tools in ArcMap. Learn how to use descriptive statistics in ArcMap and Geoda to analyze
06 - NATIONAL PLUVIAL FLOOD MAPPING FOR ALL IRELAND THE MODELLING APPROACH
 06 - NATIONAL PLUVIAL FLOOD MAPPING FOR ALL IRELAND THE MODELLING APPROACH Richard Kellagher 1, Mike Panzeri 1, Julien L Homme 1, Yannick Cesses 1, Ben Gouldby 1 John Martin 2, Oliver Nicholson 2, Mark
Real-time modelling of surface water flooding hazard and impact at countrywide scales
 Real-time modelling of surface water flooding hazard and impact at countrywide scales Steven Cole 1, Robert Moore 1, Paul Mattingley 1,Timothy Aldridge 2, Jon Millard 3,4 and Stefan Laeger 5 BHS National
Christine E. Hatch University of Nevada, Reno
 Christine E. Hatch University of Nevada, Reno Roadmap What is DTS? How Does it Work? What Can DTS Measure? Applications What is Distributed Temperature Sensing (DTS)? Temperature measurement using only
CORRELATIONS BETWEEN RAINFALL DATA AND INSURANCE DAMAGE DATA ON PLUVIAL FLOODING IN THE NETHERLANDS
 10 th International Conference on Hydroinformatics HIC 2012, Hamburg, GERMANY CORRELATIONS BETWEEN RAINFALL DATA AND INSURANCE DAMAGE DATA ON PLUVIAL FLOODING IN THE NETHERLANDS SPEKKERS, M.H. (1), TEN
Lake Monitoring in Wisconsin using Satellite Remote Sensing
 Lake Monitoring in Wisconsin using Satellite Remote Sensing D. Gurlin and S. Greb Wisconsin Department of Natural Resources 2015 Wisconsin Lakes Partnership Convention April 23 25, 2105 Holiday Inn Convention
GROUNDWATER FLOW NETS Graphical Solutions to the Flow Equations. One family of curves are flow lines Another family of curves are equipotential lines
 GROUNDWTER FLOW NETS Graphical Solutions to the Flow Equations One family of curves are flow lines nother family of curves are equipotential lines B C D E Boundary Conditions B and DE - constant head BC
WILLOCHRA BASIN GROUNDWATER STATUS REPORT 2009-10
 WILLOCHRA BASIN GROUNDWATER STATUS REPORT 2009-10 SUMMARY 2009-10 The Willochra Basin is situated in the southern Flinders Ranges in the Mid-North of South Australia, approximately 50 km east of Port Augusta
Fort Dodge Stormwater Master Planning. Prepared By: Ralph C. Stark, Jr., P.E., C.F.M. Joel N. Krause, P.E., C.F.M.
 Fort Dodge Stormwater Master Planning Prepared By: Ralph C. Stark, Jr., P.E., C.F.M. Joel N. Krause, P.E., C.F.M. Project Location Project Background Flooding History Localized flooding and storm sewer
CSO Modelling Considering Moving Storms and Tipping Bucket Gauge Failures M. Hochedlinger 1 *, W. Sprung 2,3, H. Kainz 3 and K.
 CSO Modelling Considering Moving Storms and Tipping Bucket Gauge Failures M. Hochedlinger 1 *, W. Sprung,, H. Kainz and K. König 1 Linz AG Wastewater, Wiener Straße 151, A-41 Linz, Austria Municipality
An Online School for Weather. www.srh.noaa.gov/jetstream/atmos/ll_whatacycle_aquifers.pdf
 JetStream An Online School for Weather Aquifers Aquifers Aquifers 1 3 5 Aquifers Aquifers Aquifers 2 4 6 /atmos/ll_whatacycle_aquifers.pdf There are over 35 lesson plans in the National Weather Service
Working with Digital Elevation Models and Digital Terrain Models in ArcMap 9
 Working with Digital Elevation Models and Digital Terrain Models in ArcMap 9 1 TABLE OF CONTENTS INTRODUCTION...3 WORKING WITH DIGITAL TERRAIN MODEL (DTM) DATA FROM NRVIS, CITY OF KITCHENER, AND CITY OF
Using GIS Data With HEC-RAS
 C H A P T E R 14 Using GIS Data With HEC-RAS HEC-RAS has the ability to import three-dimensional (3D) river schematic and cross section data created in a GIS or CADD system. While the HEC- RAS software
5.3.1 Arithmetic Average Method:
 Computation of Average Rainfall over a Basin: To compute the average rainfall over a catchment area or basin, rainfall is measured at a number of gauges by suitable type of measuring devices. A rough idea
TENNESSEE GAS PIPELINE COMPANY, L.L.C.
 TENNESSEE GAS PIPELINE COMPANY, L.L.C. HYDROLOGIC & HYDRAULIC CALCULATIONS FOR WATERBODIES CROSSED BY CONNECTICUT PIPELINE EXPANSION PROJECT CONNECTICUT LOOP Submitted by: Tennessee Gas Pipeline Company,
National Weather Service River Forecast System (NWSRFS) Reservoir Tools Enhancement
 Reservoir Tools Enhancement") NATIONAL WEATHER SERVICE OFFICE of HYDROLOGIC DEVELOPMENT CONCEPT OF OPERATIONS And REQUIREMENTS DOCUMENT National Weather Service River Forecast System (NWSRFS) Reservoir Tools Enhancement Revision History
NATIONAL WEATHER SERVICE OFFICE of HYDROLOGIC DEVELOPMENT CONCEPT OF OPERATIONS And REQUIREMENTS DOCUMENT National Weather Service River Forecast System (NWSRFS) Reservoir Tools Enhancement Revision History
CE394K GIS IN WATER RESOURCES TERM PROJECT REPORT
 CE394K GIS IN WATER RESOURCES TERM PROJECT REPORT Soil Water Balance in Southern California Cheng-Wei Yu Environmental and Water Resources Engineering Program Introduction Historical Drought Condition
Assessment of Groundwater Vulnerability to Landfill Leachate Induced Arsenic Contamination in Maine, US - Intro GIS Term Project Final Report
 Assessment of Groundwater Vulnerability to Landfill Leachate Induced Arsenic Contamination in Maine, US - Intro GIS Term Project Final Report Introduction Li Wang Dept. of Civil & Environmental Engineering
How To Understand And Understand The Flood Risk Of Hoang Long River In Phuon Vietnam
 FLOOD HAZARD AND RISK ASSESSMENT OF HOANG LONG RIVER BASIN, VIETNAM VU Thanh Tu 1, Tawatchai TINGSANCHALI 2 1 Water Resources University, Assistant Professor, 175 Tay Son Street, Dong Da District, Hanoi,
Online Site-Specific Degree-Day Predictions Using GIS and Climate Map Technologies
 This newsletter is provided as a printable pdf file at http://oregonipm.ippc.orst.edu Online Site-Specific Degree-Day Predictions Using GIS and Climate Map Technologies Leonard Coop and Paul Jepson Integrated
Chapter 12 - HYDROLOGICAL MEASUREMENTS
 Water Quality Monitoring - A Practical Guide to the Design and Implementation of Freshwater Quality Studies and Monitoring Programmes Edited by Jamie Bartram and Richard Ballance Published on behalf of