Some elements of photo. interpretation
|
|
|
- Beverly Hodges
- 10 years ago
- Views:
Transcription
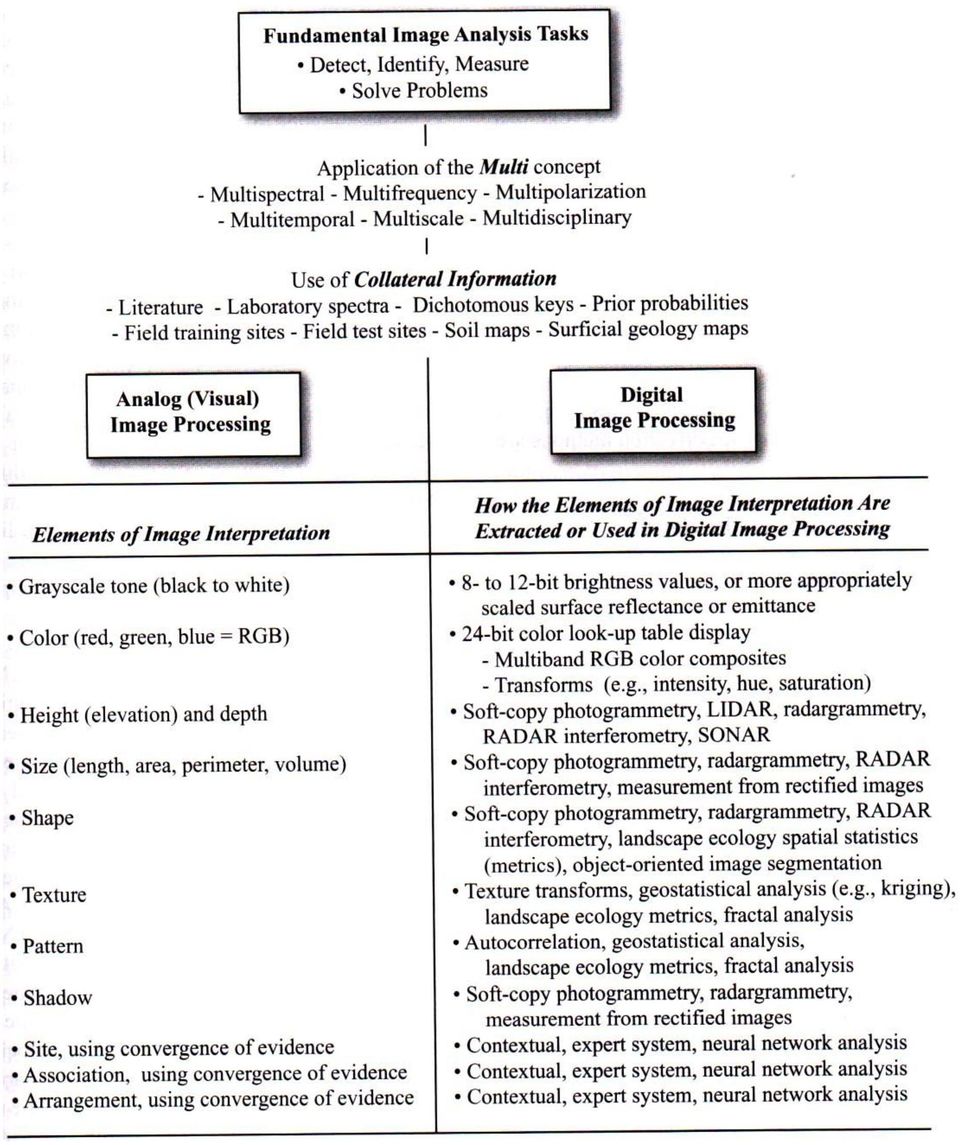
1 Some elements of photo Shape Size Pattern Color (tone, hue) Texture Shadows Site Association interpretation Olson, C. E., Jr Elements of photographic interpretation common to several sensors. Photogrammetric Engineering, Vol. 26(4):

2 Tone Tone refers to the relative brightness or color of objects in an image. Generally, tone is the fundamental element for distinguishing between different targets or features. Variations in tone also allows the elements of shape, texture, and pattern of objects to be distinguished.

3 Shape Shape refers to the general form, structure, or outline of individual objects. Shape can be a very distinctive clue for interpretation. Straight edge shapes typically represent urban or agricultural (field) targets, while natural features, such as forest edges, are generally more irregular in shape, except where man has created a road or clear cuts. Farm or crop land irrigated by rotating sprinkler systems would appear as circular shapes.

4 Size Size of objects in an image is a function of scale. It is important to assess the size of a target relative to other objects in a scene, as well as the absolute size, to aid in the interpretation of that target. A quick approximation of target size can direct interpretation to an appropriate result more quickly. For example, if an interpreter had to distinguish zones of land use, and had identified an area with a number of buildings in it, large buildings such as factories or warehouses would suggest commercial property, whereas small buildings would indicate residential use.

5 Pattern Pattern refers to the spatial arrangement of visibly discernible objects. Typically an orderly repetition of similar tones and textures will produce a distinctive and ultimately recognizable pattern. Orchards with evenly spaced trees, and urban streets with regularly spaced houses are good examples of pattern.

6 Texture Texture refers to the arrangement and frequency of tonal variation in particular areas of an image. Rough textures would consist of a mottled tone where the grey levels change abruptly in a small area, whereas smooth textures would have very little tonal variation. Smooth textures are most often the result of uniform, even surfaces, such as fields, asphalt, or grasslands. A target with a rough surface and irregular structure, such as a forest canopy, results in a rough textured appearance. Texture is one of the most important elements for distinguishing features in radar imagery.

7 Shadow Shadow is also helpful in interpretation as it may provide an idea of the profile and relative height of a target or targets which may make identification easier. However, shadows can also reduce or eliminate interpretation in their area of influence, since targets within shadows are much less (or not at all) discernible from their surroundings. Shadow is also useful for enhancing or identifying topography and landforms, particularly in radar imagery.
 discernible from their surroundings.")
8 Association Association takes into account the relationship between other recognizable objects or features in proximity to the target of interest. The identification of features that one would expect to associate with other features may provide information to facilitate identification. In the example given above, commercial properties may be associated with proximity to major transportation routes, whereas residential areas would be associated with schools, playgrounds, and sports fields. In our example, a lake is associated with boats, a marina, and adjacent recreational land.

9
10 Digital Image Analysis Digital vs. analog Digital number (DN), brightness value (BV) Pixels Bands (channels) Resolution Platform and sensors GIS
 Resolution Platform and")
11 Measuring EMR Sources of Noise Scattering Absorption Refraction T = transmission of atmosphere


12 EMR Color Spectrum

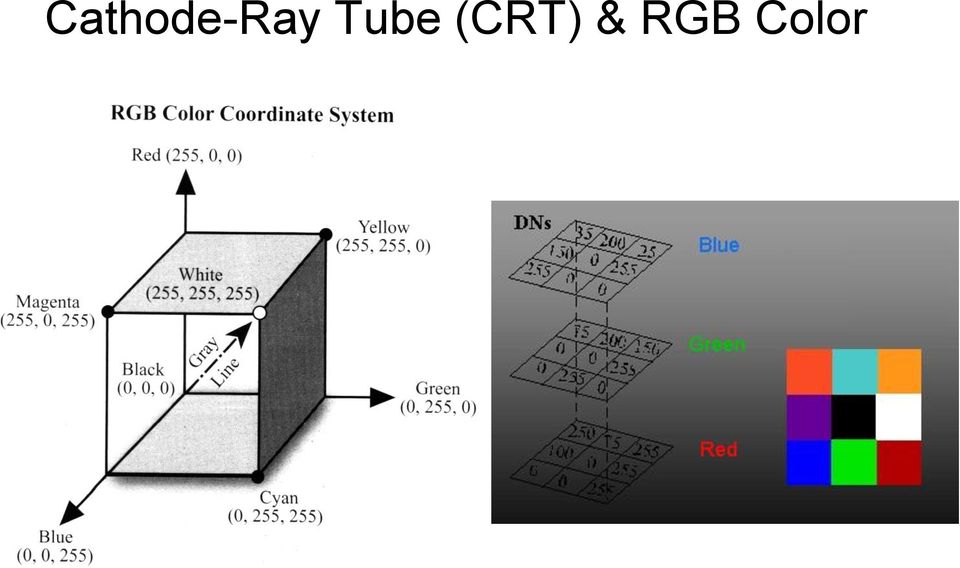
13 Cathode-Ray Tube (CRT) & RGB Color
14 Why do plants appear green?

15 TM/ETM+ bands B G R

16
17 Pre-processing Preprocessing functions involve those operations that are normally required prior to the main data analysis and extraction of information, and are generally grouped as radiometric or geometric corrections. Radiometric corrections include correcting the data for sensor irregularities and unwanted sensor or atmospheric noise, and converting the data so they accurately represent the reflected or emitted radiation measured by the sensor. Geometric corrections include correcting for geometric distortions due to sensor-earth geometry variations, and conversion of the data to real world coordinates (e.g. latitude and longitude) on the Earth's surface.

18 Pre-processing operations, sometimes referred to as image restoration and rectification, are intended to correct for sensor- and platform-specific radiometric and geometric distortions of data. Stripping Dropped lines Radiometric corrections may be necessary due to variations in scene illumination and viewing geometry, atmospheric conditions, and sensor noise and response. Each of these will vary depending on the specific sensor and platform used to acquire the data and the conditions during data acquisition. Also, it may be desirable to convert and/or calibrate the data to known (absolute) radiation or reflectance units to facilitate comparison between data.


19 Geometric registration and correction via resampling Geometric registration Bilinear interpolation Nearest neighbor resampling Cubic convolation

20 Image enhancement The simplest type of enhancement is a linear contrast stretch. This involves identifying lower and upper bounds from the histogram (usually the minimum and maximum brightness values in the image) and applying a transformation to stretch this range to fill the full range. A linear stretch uniformly expands this small range to cover the full range of values from 0 to 255. This enhances the contrast in the image with light toned areas appearing lighter and dark areas appearing darker, making visual interpretation much easier. This graphic illustrates the increase in contrast in an image before (top) and after (bottom) a linear contrast stretch.

21 Spatial filtering Low pass filter Spatial filtering encompasses another set of digital processing functions which are used to enhance the appearance of an image. Spatial filters are designed to highlight or suppress specific features in an image based on their spatial frequency. Spatial frequency refers to the frequency of the variations in tone that appear in an image. "Rough" textured areas of an image, where the changes in tone are abrupt over a small area, have high spatial frequencies, while "smooth" areas with little variation in tone over several pixels, have low spatial frequencies. A common filtering procedure involves moving a 'window' of a few pixels in dimension (e.g. 3x3, 5x5, etc.) over each pixel in the image, applying a mathematical calculation using the pixel values under that window, and replacing the central pixel with the new value. A low-pass filter is designed to emphasize larger, homogeneous areas of similar tone and reduce the smaller detail in an image. Thus, low-pass filters generally serve to smooth the appearance of an image. Average and median filters, often used for radar imagery (and described in Chapter 3), are examples of low-pass filters. High-pass filters do the opposite and serve to sharpen the appearance of fine detail in an image. One implementation of a high-pass filter first applies a low-pass filter to an image and then subtracts the result from the original, leaving behind only the high spatial frequency information.
22 Directional or edge detection filter Directional, or edge detection filters are designed to highlight linear features, such as roads or field boundaries. These filters can also be designed to enhance features which are oriented in specific directions. These filters are useful in applications such as geology, for the detection of linear geologic structures.
23 Image Transformation Image division or spectral ratioing is one of the most common transforms applied to image data. Image ratioing serves to highlight subtle variations in the spectral responses of various surface covers. By ratioing the data from two different spectral bands, the resultant image enhances variations in the slopes of the spectral reflectance curves between the two different spectral ranges that may otherwise be masked by the pixel brightness variations in each of the bands. One widely used image transform is the Normalized Difference Vegetation Index (NDVI) which has been used to monitor vegetation conditions on continental and global scales using the Advanced Very High Resolution Radiometer (AVHRR) sensor onboard the NOAA series of satellites
24
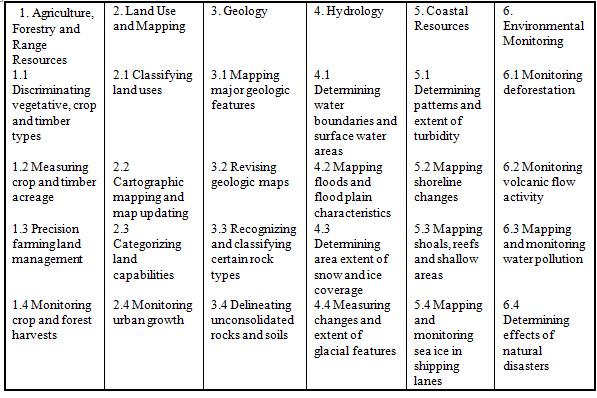
25 1 Coastal water mapping, soil/vegetation discrimination, forest classification, man-made feature identification 2 Vegetation discrimination and health monitoring, man-made feature identification 3 Plant species identification, man-made feature identification 4 Soil moisture monitoring, vegetation monitoring, water body discrimination 5 Vegetation moisture content monitoring 6 Surface temperature, vegetation stress monitoring, soil moisture monitoring, cloud differentiation, volcanic monitoring 7 Mineral and rock discrimination, vegetation moisture content
26

27
28
29
30
31
32
33
34
35 TM R,G,B = 3,2,1
36


37 ETM+: CIR False Color Composite Image
38 TM R,G,B = 4,3,2
39
40 TM R,G,B = 4,5,3
41
42 TM R,G,B = 7,4,2
43 Tasseled Cap: Brightness
44 TC: Greenness
45 TC: Wetness

46 TC: Haziness
47
48 Classification Classification scheme Class signatures Unsupervised classification (ISODATA) Supervised classification Training sites Classification rules (classifiers)
49 Classification Approaches Unsupervised: self organizing Supervised: training Hybrid: self organization by categories Spectral Mixture Analysis: sub-pixel variations.
50 Clustering / Classification Clustering or Training Stage: Through actions of either the analyst s supervision or an unsupervised algorithm, a numeric description of the spectral attribute of each class is determined (a multi-spectral cluster mean signature). Classification Stage: By comparing the spectral signature to of a pixel (the measure signature) to the each cluster signature a pixel is assigned to a category or class.
51 terms Parametric = based upon statistical parameters normal distribution (mean & standard deviation) Non-Parametric = based upon objects (polygons) in feature space Decision Rules = rules for sorting pixels into classes
52 Resolution and Spectral Mixing
53
54 Clustering Minimum Spectral Distance - unsupervised ISODATA I - iterative S - self O - organizing D - data A - analysis T - technique A - (application) Band B Band A Band B Band A 1st iteration cluster mean 2nd iteration cluster mean
55 ISODATA clusters
56 Unsupervised Classification ISODATA - Iterative Self- Organizing Data Analysis Technique
57 Supervised Classification
58 Classification Decision Rules If the non-parametric test results in one unique class, the pixel will be assigned to that class. if the non-parametric test results in zero classes (outside the decision boundaries) the the unclassified rule applies either left unclassified or classified by the parametric rule if the pixel falls into more than one class the overlap rule applies left unclassified, use the parametric rule, or processing order Useful fact: we aren t limited to using only raw DNs, radiance, or reflectance in our classifier. We can use ratio or difference indices, LSU fractions, spatial data (distance from some target) or any other data transformation we might think would be appropriate in the classifier. Non-Parametric parallelepiped feature space Unclassified Options parametric rule unclassified Overlap Options parametric rule by order unclassified Parametric minimum distance Mahalanobis distance maximum likelihood
59 Parallelepiped Band B B Maximum likelihood (bayesian) probability Bayesian, a prior (weights) A Band A Minimum Distance n SDxyc ci X xyi i 1 c class X xyi ci value of pixel x, y in i class mean of values in i for sample for class 2 c Band B Band A cluster mean Candidate pixel
60 Parallelepiped Classifier The minimum and maximum DNs for each class are determined and are used as thresholds for classifying the image. Benefits: simple to train and use, computationally fast Drawbacks: pixels in the gaps between the parallelepipes can not be classified; pixels in the region of overlapping parallelepipes can not be classified.
61 How it works... Parallelepiped Classifier
62 Parametric classifiers
63 How it works... Minimum Distance Classifier A centroid for each class is determined from the data by calculating the mean value by band for each class. For each image pixel, the distance in n-dimensional distance to each of these centroids is calculated, and the closest centroid determines the class. Benefits: mathematically simple and computationally efficient Drawback: insensitive to different degrees of variance in spectral response data.
64 How it works... Maximum Likelihood Classifier Max likelihood uses the variance and covariance in class spectra to determine classification scheme. It often, but not always, assumes that the spectral responses for a given class are normally distributed.
65 How it works... Maximum Likelihood Classifier We can then determine a probability that a given DN is a member of each class. The pixel is classified by using the most likely class or Other if the probability isn t over some threshold. Benefits: takes variation in spectral response into consideration. Drawbacks: computationally intensive; multimodal or non-normally distributed classes require extra care when training the classifier, if high accuracy is to be achieved.
66 Classification Systems USGS - U.S. Geological Survey Land Cover Classification Scheme for Remote Sensor Data USFW - U.S. Fish & Wildlife Wetland Classification System NOAA CCAP - C-CAP Landcover Classification System, and Definitions NOAA CCAP - C-CAP Wetland Classification Scheme Definitions PRISM - PRISM General Landcover King Co. - King County General Landcover (specific use, by Chris Pyle) Level 1 Urban or Built-Up Land 11 Residential 12 Commercial and Services 13 Industrial 14 Transportation, Communications and Utilities 15 Industrial and Commercial Complexes 16 Mixed Urban or Built-Up 17 Other Urban or Built-up Land 2 Agricultural Land 21 Cropland and Pasture 22 Orchards, Groves, Vineyards, Nurseries and Ornamental Horticultural Areas 23 Confined Feeding Operations 24 Other Agricultural Land
67 Hybrid Classification
68 Hybrid - superblocks
69 Feature Space
70 Accuracy assessment Classified map Reference (ground trued) sample points Error matrix (contingency table) PCC
71 Ground Truth
72 Classified Product
73 Lab 2. Decision (Classification) Tree Represented as a set of hierarchically-arranged decision rules (i.e., tree-branch-leaf) Could be generated by knowledge engineering, neural network, or statistic methods. S-Plus: Tree Models: successively splitting the data to form homogeneous subsets.
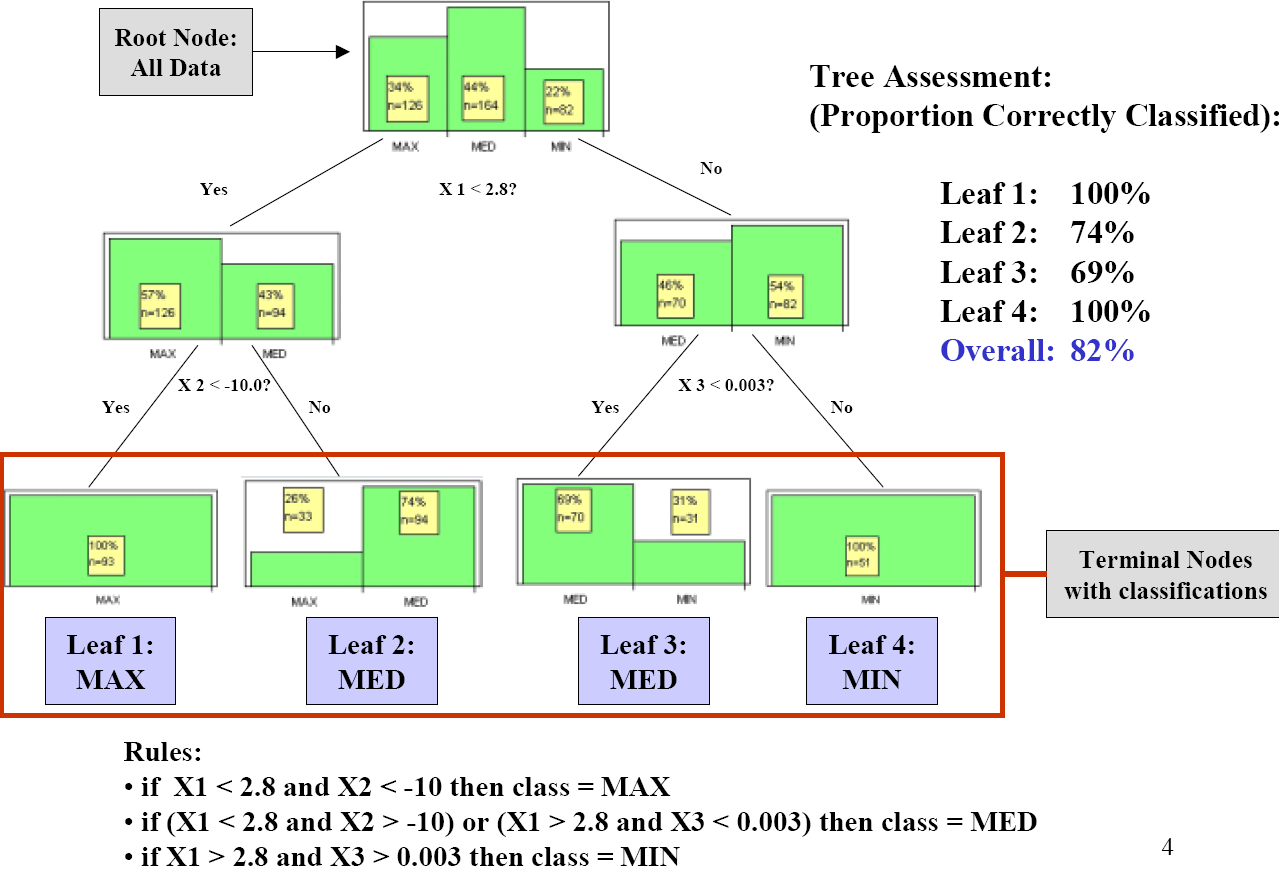
74 Classification Example
Digital image processing
 746A27 Remote Sensing and GIS Lecture 4 Digital image processing Chandan Roy Guest Lecturer Department of Computer and Information Science Linköping University Digital Image Processing Most of the common
Environmental Remote Sensing GEOG 2021
 Environmental Remote Sensing GEOG 2021 Lecture 4 Image classification 2 Purpose categorising data data abstraction / simplification data interpretation mapping for land cover mapping use land cover class
Calculation of Minimum Distances. Minimum Distance to Means. Σi i = 1
 Minimum Distance to Means Similar to Parallelepiped classifier, but instead of bounding areas, the user supplies spectral class means in n-dimensional space and the algorithm calculates the distance between
SAMPLE MIDTERM QUESTIONS
 Geography 309 Sample MidTerm Questions Page 1 SAMPLE MIDTERM QUESTIONS Textbook Questions Chapter 1 Questions 4, 5, 6, Chapter 2 Questions 4, 7, 10 Chapter 4 Questions 8, 9 Chapter 10 Questions 1, 4, 7
Land Use/Land Cover Map of the Central Facility of ARM in the Southern Great Plains Site Using DOE s Multi-Spectral Thermal Imager Satellite Images
 Land Use/Land Cover Map of the Central Facility of ARM in the Southern Great Plains Site Using DOE s Multi-Spectral Thermal Imager Satellite Images S. E. Báez Cazull Pre-Service Teacher Program University
TerraColor White Paper
 TerraColor White Paper TerraColor is a simulated true color digital earth imagery product developed by Earthstar Geographics LLC. This product was built from imagery captured by the US Landsat 7 (ETM+)
2.3 Spatial Resolution, Pixel Size, and Scale
 Section 2.3 Spatial Resolution, Pixel Size, and Scale Page 39 2.3 Spatial Resolution, Pixel Size, and Scale For some remote sensing instruments, the distance between the target being imaged and the platform,
The Role of SPOT Satellite Images in Mapping Air Pollution Caused by Cement Factories
 The Role of SPOT Satellite Images in Mapping Air Pollution Caused by Cement Factories Dr. Farrag Ali FARRAG Assistant Prof. at Civil Engineering Dept. Faculty of Engineering Assiut University Assiut, Egypt.
Analysis of Landsat ETM+ Image Enhancement for Lithological Classification Improvement in Eagle Plain Area, Northern Yukon
 Analysis of Landsat ETM+ Image Enhancement for Lithological Classification Improvement in Eagle Plain Area, Northern Yukon Shihua Zhao, Department of Geology, University of Calgary, [email protected],
WATER BODY EXTRACTION FROM MULTI SPECTRAL IMAGE BY SPECTRAL PATTERN ANALYSIS
 WATER BODY EXTRACTION FROM MULTI SPECTRAL IMAGE BY SPECTRAL PATTERN ANALYSIS Nguyen Dinh Duong Department of Environmental Information Study and Analysis, Institute of Geography, 18 Hoang Quoc Viet Rd.,
Remote Sensing and Land Use Classification: Supervised vs. Unsupervised Classification Glen Busch
 Remote Sensing and Land Use Classification: Supervised vs. Unsupervised Classification Glen Busch Introduction In this time of large-scale planning and land management on public lands, managers are increasingly
Digital Remote Sensing Data Processing Digital Remote Sensing Data Processing and Analysis: An Introduction and Analysis: An Introduction
 Digital Remote Sensing Data Processing Digital Remote Sensing Data Processing and Analysis: An Introduction and Analysis: An Introduction Content Remote sensing data Spatial, spectral, radiometric and
COMPARISON OF OBJECT BASED AND PIXEL BASED CLASSIFICATION OF HIGH RESOLUTION SATELLITE IMAGES USING ARTIFICIAL NEURAL NETWORKS
 COMPARISON OF OBJECT BASED AND PIXEL BASED CLASSIFICATION OF HIGH RESOLUTION SATELLITE IMAGES USING ARTIFICIAL NEURAL NETWORKS B.K. Mohan and S. N. Ladha Centre for Studies in Resources Engineering IIT
Selecting the appropriate band combination for an RGB image using Landsat imagery
 Selecting the appropriate band combination for an RGB image using Landsat imagery Ned Horning Version: 1.0 Creation Date: 2004-01-01 Revision Date: 2004-01-01 License: This document is licensed under a
Supervised Classification workflow in ENVI 4.8 using WorldView-2 imagery
 Supervised Classification workflow in ENVI 4.8 using WorldView-2 imagery WorldView-2 is the first commercial high-resolution satellite to provide eight spectral sensors in the visible to near-infrared
Review for Introduction to Remote Sensing: Science Concepts and Technology
 Review for Introduction to Remote Sensing: Science Concepts and Technology Ann Johnson Associate Director [email protected] Funded by National Science Foundation Advanced Technological Education program [DUE
RESOLUTION MERGE OF 1:35.000 SCALE AERIAL PHOTOGRAPHS WITH LANDSAT 7 ETM IMAGERY
 RESOLUTION MERGE OF 1:35.000 SCALE AERIAL PHOTOGRAPHS WITH LANDSAT 7 ETM IMAGERY M. Erdogan, H.H. Maras, A. Yilmaz, Ö.T. Özerbil General Command of Mapping 06100 Dikimevi, Ankara, TURKEY - (mustafa.erdogan;
VCS REDD Methodology Module. Methods for monitoring forest cover changes in REDD project activities
 1 VCS REDD Methodology Module Methods for monitoring forest cover changes in REDD project activities Version 1.0 May 2009 I. SCOPE, APPLICABILITY, DATA REQUIREMENT AND OUTPUT PARAMETERS Scope This module
Information Contents of High Resolution Satellite Images
 Information Contents of High Resolution Satellite Images H. Topan, G. Büyüksalih Zonguldak Karelmas University K. Jacobsen University of Hannover, Germany Keywords: satellite images, mapping, resolution,
ENVI Classic Tutorial: Classification Methods
 ENVI Classic Tutorial: Classification Methods Classification Methods 2 Files Used in this Tutorial 2 Examining a Landsat TM Color Image 3 Reviewing Image Colors 3 Using the Cursor Location/Value 4 Examining
Image Analysis CHAPTER 16 16.1 ANALYSIS PROCEDURES
 CHAPTER 16 Image Analysis 16.1 ANALYSIS PROCEDURES Studies for various disciplines require different technical approaches, but there is a generalized pattern for geology, soils, range, wetlands, archeology,
APPLICATION OF MULTITEMPORAL LANDSAT DATA TO MAP AND MONITOR LAND COVER AND LAND USE CHANGE IN THE CHESAPEAKE BAY WATERSHED
 APPLICATION OF MULTITEMPORAL LANDSAT DATA TO MAP AND MONITOR LAND COVER AND LAND USE CHANGE IN THE CHESAPEAKE BAY WATERSHED S. J. GOETZ Woods Hole Research Center Woods Hole, Massachusetts 054-096 USA
Remote Sensing in Natural Resources Mapping
 Remote Sensing in Natural Resources Mapping NRS 516, Spring 2016 Overview of Remote Sensing in Natural Resources Mapping What is remote sensing? Why remote sensing? Examples of remote sensing in natural
Remote sensing is the collection of data without directly measuring the object it relies on the
 Chapter 8 Remote Sensing Chapter Overview Remote sensing is the collection of data without directly measuring the object it relies on the reflectance of natural or emitted electromagnetic radiation (EMR).
Resolutions of Remote Sensing
 Resolutions of Remote Sensing 1. Spatial (what area and how detailed) 2. Spectral (what colors bands) 3. Temporal (time of day/season/year) 4. Radiometric (color depth) Spatial Resolution describes how
ANALYSIS OF FOREST CHANGE IN FIRE DAMAGE AREA USING SATELLITE IMAGES
 ANALYSIS OF FOREST CHANGE IN FIRE DAMAGE AREA USING SATELLITE IMAGES Joon Mook Kang, Professor Joon Kyu Park, Ph.D Min Gyu Kim, Ph.D._Candidate Dept of Civil Engineering, Chungnam National University 220
ENVI Classic Tutorial: Atmospherically Correcting Multispectral Data Using FLAASH 2
 ENVI Classic Tutorial: Atmospherically Correcting Multispectral Data Using FLAASH Atmospherically Correcting Multispectral Data Using FLAASH 2 Files Used in this Tutorial 2 Opening the Raw Landsat Image
Preface. Ko Ko Lwin Division of Spatial Information Science University of Tsukuba 2008
 1 Preface Remote Sensing data is one of the primary data sources in GIS analysis. The objective of this material is to provide fundamentals of Remote Sensing technology and its applications in Geographical
Chapter Contents Page No
 Chapter Contents Page No Preface Acknowledgement 1 Basics of Remote Sensing 1 1.1. Introduction 1 1.2. Definition of Remote Sensing 1 1.3. Principles of Remote Sensing 1 1.4. Various Stages in Remote Sensing
3D Model of the City Using LiDAR and Visualization of Flood in Three-Dimension
 3D Model of the City Using LiDAR and Visualization of Flood in Three-Dimension R.Queen Suraajini, Department of Civil Engineering, College of Engineering Guindy, Anna University, India, [email protected]
Extraction of Satellite Image using Particle Swarm Optimization
 Extraction of Satellite Image using Particle Swarm Optimization Er.Harish Kundra Assistant Professor & Head Rayat Institute of Engineering & IT, Railmajra, Punjab,India. Dr. V.K.Panchal Director, DTRL,DRDO,
CROP CLASSIFICATION WITH HYPERSPECTRAL DATA OF THE HYMAP SENSOR USING DIFFERENT FEATURE EXTRACTION TECHNIQUES
 Proceedings of the 2 nd Workshop of the EARSeL SIG on Land Use and Land Cover CROP CLASSIFICATION WITH HYPERSPECTRAL DATA OF THE HYMAP SENSOR USING DIFFERENT FEATURE EXTRACTION TECHNIQUES Sebastian Mader
Resolution Enhancement of Photogrammetric Digital Images
 DICTA2002: Digital Image Computing Techniques and Applications, 21--22 January 2002, Melbourne, Australia 1 Resolution Enhancement of Photogrammetric Digital Images John G. FRYER and Gabriele SCARMANA
Myths and misconceptions about remote sensing
 Myths and misconceptions about remote sensing Ned Horning (graphics support - Nicholas DuBroff) Version: 1.0 Creation Date: 2004-01-01 Revision Date: 2004-01-01 License: This document is licensed under
Galaxy Morphological Classification
 Galaxy Morphological Classification Jordan Duprey and James Kolano Abstract To solve the issue of galaxy morphological classification according to a classification scheme modelled off of the Hubble Sequence,
Remote Sensing Method in Implementing REDD+
 Remote Sensing Method in Implementing REDD+ FRIM-FFPRI Research on Development of Carbon Monitoring Methodology for REDD+ in Malaysia Remote Sensing Component Mohd Azahari Faidi, Hamdan Omar, Khali Aziz
Imagery. 1:50,000 Basemap Generation From Satellite. 1 Introduction. 2 Input Data
 1:50,000 Basemap Generation From Satellite Imagery Lisbeth Heuse, Product Engineer, Image Applications Dave Hawkins, Product Manager, Image Applications MacDonald Dettwiler, 3751 Shell Road, Richmond B.C.
A KNOWLEDGE-BASED APPROACH FOR REDUCING CLOUD AND SHADOW ABSTRACT
 A KNOWLEDGE-BASED APPROACH FOR REDUCING CLOUD AND SHADOW Mingjun Song, Graduate Research Assistant Daniel L. Civco, Director Laboratory for Earth Resources Information Systems Department of Natural Resources
Introduction to GIS (Basics, Data, Analysis) & Case Studies. 13 th May 2004. Content. What is GIS?
 & Case Studies. 13 th May 2004. Content. What is GIS?") Introduction to GIS (Basics, Data, Analysis) & Case Studies 13 th May 2004 Content Introduction to GIS Data concepts Data input Analysis Applications selected examples What is GIS? Geographic Information
Introduction to GIS (Basics, Data, Analysis) & Case Studies 13 th May 2004 Content Introduction to GIS Data concepts Data input Analysis Applications selected examples What is GIS? Geographic Information
Hyperspectral Satellite Imaging Planning a Mission
 Hyperspectral Satellite Imaging Planning a Mission Victor Gardner University of Maryland 2007 AIAA Region 1 Mid-Atlantic Student Conference National Institute of Aerospace, Langley, VA Outline Objective
Adaptive HSI Data Processing for Near-Real-time Analysis and Spectral Recovery *
 Adaptive HSI Data Processing for Near-Real-time Analysis and Spectral Recovery * Su May Hsu, 1 Hsiao-hua Burke and Michael Griffin MIT Lincoln Laboratory, Lexington, Massachusetts 1. INTRODUCTION Hyperspectral
Topographic Change Detection Using CloudCompare Version 1.0
 Topographic Change Detection Using CloudCompare Version 1.0 Emily Kleber, Arizona State University Edwin Nissen, Colorado School of Mines J Ramón Arrowsmith, Arizona State University Introduction CloudCompare
How Landsat Images are Made
 How Landsat Images are Made Presentation by: NASA s Landsat Education and Public Outreach team June 2006 1 More than just a pretty picture Landsat makes pretty weird looking maps, and it isn t always easy
APPLICATION OF TERRA/ASTER DATA ON AGRICULTURE LAND MAPPING. Genya SAITO*, Naoki ISHITSUKA*, Yoneharu MATANO**, and Masatane KATO***
 APPLICATION OF TERRA/ASTER DATA ON AGRICULTURE LAND MAPPING Genya SAITO*, Naoki ISHITSUKA*, Yoneharu MATANO**, and Masatane KATO*** *National Institute for Agro-Environmental Sciences 3-1-3 Kannondai Tsukuba
MODIS IMAGES RESTORATION FOR VNIR BANDS ON FIRE SMOKE AFFECTED AREA
 MODIS IMAGES RESTORATION FOR VNIR BANDS ON FIRE SMOKE AFFECTED AREA Li-Yu Chang and Chi-Farn Chen Center for Space and Remote Sensing Research, National Central University, No. 300, Zhongda Rd., Zhongli
Multiscale Object-Based Classification of Satellite Images Merging Multispectral Information with Panchromatic Textural Features
 Remote Sensing and Geoinformation Lena Halounová, Editor not only for Scientific Cooperation EARSeL, 2011 Multiscale Object-Based Classification of Satellite Images Merging Multispectral Information with
Generation of Cloud-free Imagery Using Landsat-8
 Generation of Cloud-free Imagery Using Landsat-8 Byeonghee Kim 1, Youkyung Han 2, Yonghyun Kim 3, Yongil Kim 4 Department of Civil and Environmental Engineering, Seoul National University (SNU), Seoul,
Modelling, Extraction and Description of Intrinsic Cues of High Resolution Satellite Images: Independent Component Analysis based approaches
 Modelling, Extraction and Description of Intrinsic Cues of High Resolution Satellite Images: Independent Component Analysis based approaches PhD Thesis by Payam Birjandi Director: Prof. Mihai Datcu Problematic
A remote sensing instrument collects information about an object or phenomenon within the
 Satellite Remote Sensing GE 4150- Natural Hazards Some slides taken from Ann Maclean: Introduction to Digital Image Processing Remote Sensing the art, science, and technology of obtaining reliable information
RIEGL VZ-400 NEW. Laser Scanners. Latest News March 2009
 Latest News March 2009 NEW RIEGL VZ-400 Laser Scanners The following document details some of the excellent results acquired with the new RIEGL VZ-400 scanners, including: Time-optimised fine-scans The
Assessing Hurricane Katrina Damage to the Mississippi Gulf Coast Using IKONOS Imagery
 Assessing Hurricane Katrina Damage to the Mississippi Gulf Coast Using IKONOS Imagery Joseph P. Spruce Science Systems and Applications, Inc. John C., MS 39529 Rodney McKellip NASA Project Integration
Land Use/ Land Cover Mapping Initiative for Kansas and the Kansas River Watershed
 Land Use/ Land Cover Mapping Initiative for Kansas and the Kansas River Watershed Kansas Biological Survey Kansas Applied Remote Sensing Program April 2008 Previous Kansas LULC Projects Kansas LULC Map
Face detection is a process of localizing and extracting the face region from the
 Chapter 4 FACE NORMALIZATION 4.1 INTRODUCTION Face detection is a process of localizing and extracting the face region from the background. The detected face varies in rotation, brightness, size, etc.
y = Xβ + ε B. Sub-pixel Classification
 Sub-pixel Mapping of Sahelian Wetlands using Multi-temporal SPOT VEGETATION Images Jan Verhoeye and Robert De Wulf Laboratory of Forest Management and Spatial Information Techniques Faculty of Agricultural
U.S. Geological Survey Earth Resources Operation Systems (EROS) Data Center
 Data Center") U.S. Geological Survey Earth Resources Operation Systems (EROS) Data Center World Data Center for Remotely Sensed Land Data USGS EROS DATA CENTER Land Remote Sensing from Space: Acquisition to Applications
U.S. Geological Survey Earth Resources Operation Systems (EROS) Data Center World Data Center for Remotely Sensed Land Data USGS EROS DATA CENTER Land Remote Sensing from Space: Acquisition to Applications
An Assessment of the Effectiveness of Segmentation Methods on Classification Performance
 An Assessment of the Effectiveness of Segmentation Methods on Classification Performance Merve Yildiz 1, Taskin Kavzoglu 2, Ismail Colkesen 3, Emrehan K. Sahin Gebze Institute of Technology, Department
SEMI-AUTOMATED CLOUD/SHADOW REMOVAL AND LAND COVER CHANGE DETECTION USING SATELLITE IMAGERY
 SEMI-AUTOMATED CLOUD/SHADOW REMOVAL AND LAND COVER CHANGE DETECTION USING SATELLITE IMAGERY A. K. Sah a, *, B. P. Sah a, K. Honji a, N. Kubo a, S. Senthil a a PASCO Corporation, 1-1-2 Higashiyama, Meguro-ku,
Bildverarbeitung und Mustererkennung Image Processing and Pattern Recognition
 Bildverarbeitung und Mustererkennung Image Processing and Pattern Recognition 1. Image Pre-Processing - Pixel Brightness Transformation - Geometric Transformation - Image Denoising 1 1. Image Pre-Processing
A PHOTOGRAMMETRIC APPRAOCH FOR AUTOMATIC TRAFFIC ASSESSMENT USING CONVENTIONAL CCTV CAMERA
 A PHOTOGRAMMETRIC APPRAOCH FOR AUTOMATIC TRAFFIC ASSESSMENT USING CONVENTIONAL CCTV CAMERA N. Zarrinpanjeh a, F. Dadrassjavan b, H. Fattahi c * a Islamic Azad University of Qazvin - [email protected]
The Idiots Guide to GIS and Remote Sensing
 The Idiots Guide to GIS and Remote Sensing 1. Picking the right imagery 1 2. Accessing imagery 1 3. Processing steps 1 a. Geocorrection 2 b. Processing Landsat images layerstacking 4 4. Landcover classification
Introduction to Pattern Recognition
 Introduction to Pattern Recognition Selim Aksoy Department of Computer Engineering Bilkent University [email protected] CS 551, Spring 2009 CS 551, Spring 2009 c 2009, Selim Aksoy (Bilkent University)
Global environmental information Examples of EIS Data sets and applications
 METIER Graduate Training Course n 2 Montpellier - february 2007 Information Management in Environmental Sciences Global environmental information Examples of EIS Data sets and applications Global datasets
Introduction to Imagery and Raster Data in ArcGIS
 Esri International User Conference San Diego, California Technical Workshops July 25, 2012 Introduction to Imagery and Raster Data in ArcGIS Simon Woo slides Cody Benkelman - demos Overview of Presentation
Overview. What is EMR? Electromagnetic Radiation (EMR) LA502 Special Studies Remote Sensing
 LA502 Special Studies Remote Sensing") LA502 Special Studies Remote Sensing Electromagnetic Radiation (EMR) Dr. Ragab Khalil Department of Landscape Architecture Faculty of Environmental Design King AbdulAziz University Room 103 Overview What
LA502 Special Studies Remote Sensing Electromagnetic Radiation (EMR) Dr. Ragab Khalil Department of Landscape Architecture Faculty of Environmental Design King AbdulAziz University Room 103 Overview What
IMPERVIOUS SURFACE MAPPING UTILIZING HIGH RESOLUTION IMAGERIES. Authors: B. Acharya, K. Pomper, B. Gyawali, K. Bhattarai, T.
 IMPERVIOUS SURFACE MAPPING UTILIZING HIGH RESOLUTION IMAGERIES Authors: B. Acharya, K. Pomper, B. Gyawali, K. Bhattarai, T. Tsegaye ABSTRACT Accurate mapping of artificial or natural impervious surfaces
III THE CLASSIFICATION OF URBAN LAND COVER USING REMOTE SENSING
 The Dynamics of Global Urban Expansion 31 III THE CLASSIFICATION OF URBAN LAND COVER USING REMOTE SENSING 1. Overview and Rationale The systematic study of global urban expansion requires good data that
Understanding Raster Data
 Introduction The following document is intended to provide a basic understanding of raster data. Raster data layers (commonly referred to as grids) are the essential data layers used in all tools developed
SLC-off Gap-Filled Products Gap-Fill Algorithm Methodology
 SLC-off Gap-illed roducts Gap-ill Algorithm Methodology Background The U.S. Geological Survey (USGS) Earth Resources Observation Systems (EROS) Data Center (EDC) has developed multi-scene (same path/row)
KEYWORDS: image classification, multispectral data, panchromatic data, data accuracy, remote sensing, archival data
 Improving the Accuracy of Historic Satellite Image Classification by Combining Low-Resolution Multispectral Data with High-Resolution Panchromatic Data Daniel J. Getman 1, Jonathan M. Harbor 2, Chris J.
Object-Oriented Approach of Information Extraction from High Resolution Satellite Imagery
 IOSR Journal of Computer Engineering (IOSR-JCE) e-issn: 2278-0661,p-ISSN: 2278-8727, Volume 17, Issue 3, Ver. IV (May Jun. 2015), PP 47-52 www.iosrjournals.org Object-Oriented Approach of Information Extraction
High Resolution Information from Seven Years of ASTER Data
 High Resolution Information from Seven Years of ASTER Data Anna Colvin Michigan Technological University Department of Geological and Mining Engineering and Sciences Outline Part I ASTER mission Terra
Remote Sensing and GIS Application In Change Detection Study In Urban Zone Using Multi Temporal Satellite
 Remote Sensing and GIS Application In Change Detection Study In Urban Zone Using Multi Temporal Satellite R.Manonmani, G.Mary Divya Suganya Institute of Remote Sensing, Anna University, Chennai 600 025
Automatic land-cover map production of agricultural areas using supervised classification of SPOT4(Take5) and Landsat-8 image time series.
 and Landsat-8 image time series.") Automatic land-cover map production of agricultural areas using supervised classification of SPOT4(Take5) and Landsat-8 image time series. Jordi Inglada 2014/11/18 SPOT4/Take5 User Workshop 2014/11/18
Automatic land-cover map production of agricultural areas using supervised classification of SPOT4(Take5) and Landsat-8 image time series. Jordi Inglada 2014/11/18 SPOT4/Take5 User Workshop 2014/11/18
2002 URBAN FOREST CANOPY & LAND USE IN PORTLAND S HOLLYWOOD DISTRICT. Final Report. Michael Lackner, B.A. Geography, 2003
 2002 URBAN FOREST CANOPY & LAND USE IN PORTLAND S HOLLYWOOD DISTRICT Final Report by Michael Lackner, B.A. Geography, 2003 February 2004 - page 1 of 17 - TABLE OF CONTENTS Abstract 3 Introduction 4 Study
Assessment. Presenter: Yupu Zhang, Guoliang Jin, Tuo Wang Computer Vision 2008 Fall
 Automatic Photo Quality Assessment Presenter: Yupu Zhang, Guoliang Jin, Tuo Wang Computer Vision 2008 Fall Estimating i the photorealism of images: Distinguishing i i paintings from photographs h Florin
SESSION 8: GEOGRAPHIC INFORMATION SYSTEMS AND MAP PROJECTIONS
 SESSION 8: GEOGRAPHIC INFORMATION SYSTEMS AND MAP PROJECTIONS KEY CONCEPTS: In this session we will look at: Geographic information systems and Map projections. Content that needs to be covered for examination
16 th IOCCG Committee annual meeting. Plymouth, UK 15 17 February 2011. mission: Present status and near future
 16 th IOCCG Committee annual meeting Plymouth, UK 15 17 February 2011 The Meteor 3M Mt satellite mission: Present status and near future plans MISSION AIMS Satellites of the series METEOR M M are purposed
Partitioning the Conterminous United States into Mapping Zones for Landsat TM Land Cover Mapping
 Partitioning the Conterminous United States into Mapping Zones for Landsat TM Land Cover Mapping Collin Homer Raytheon, EROS Data Center, Sioux Falls, South Dakota 605-594-2714 [email protected] Alisa Gallant
Field Techniques Manual: GIS, GPS and Remote Sensing
 Field Techniques Manual: GIS, GPS and Remote Sensing Section A: Introduction Chapter 1: GIS, GPS, Remote Sensing and Fieldwork 1 GIS, GPS, Remote Sensing and Fieldwork The widespread use of computers
DETECTING LANDUSE/LANDCOVER CHANGES ALONG THE RING ROAD IN PESHAWAR CITY USING SATELLITE REMOTE SENSING AND GIS TECHNIQUES
 ------------------------------------------------------------------------------------------------------------------------------- Full length Research Paper -------------------------------------------------------------------------------------------------------------------------------
RULE INHERITANCE IN OBJECT-BASED IMAGE CLASSIFICATION FOR URBAN LAND COVER MAPPING INTRODUCTION
 RULE INHERITANCE IN OBJECT-BASED IMAGE CLASSIFICATION FOR URBAN LAND COVER MAPPING Ejaz Hussain, Jie Shan {ehussain, jshan}@ecn.purdue.edu} Geomatics Engineering, School of Civil Engineering, Purdue University
Open-File Report 2010 1076. By Daniel H. Knepper, Jr. U.S. Department of the Interior U.S. Geological Survey
 Distribution of Potential Hydrothermally Altered Rocks in Central Colorado Derived From Landsat Thematic Mapper Data: A Geographic Information System Data Set By Daniel H. Knepper, Jr. Open-File Report
ENVIRONMENTAL MONITORING Vol. I - Remote Sensing (Satellite) System Technologies - Michael A. Okoye and Greg T. Koeln
 System Technologies - Michael A. Okoye and Greg T. Koeln") REMOTE SENSING (SATELLITE) SYSTEM TECHNOLOGIES Michael A. Okoye and Greg T. Earth Satellite Corporation, Rockville Maryland, USA Keywords: active microwave, advantages of satellite remote sensing, atmospheric
REMOTE SENSING (SATELLITE) SYSTEM TECHNOLOGIES Michael A. Okoye and Greg T. Earth Satellite Corporation, Rockville Maryland, USA Keywords: active microwave, advantages of satellite remote sensing, atmospheric
Objectives. Raster Data Discrete Classes. Spatial Information in Natural Resources FANR 3800. Review the raster data model
 Spatial Information in Natural Resources FANR 3800 Raster Analysis Objectives Review the raster data model Understand how raster analysis fundamentally differs from vector analysis Become familiar with
VIIRS-CrIS mapping. NWP SAF AAPP VIIRS-CrIS Mapping
 NWP SAF AAPP VIIRS-CrIS Mapping This documentation was developed within the context of the EUMETSAT Satellite Application Facility on Numerical Weather Prediction (NWP SAF), under the Cooperation Agreement
AERIAL PHOTOGRAPHS. For a map of this information, in paper or digital format, contact the Tompkins County Planning Department.
 AERIAL PHOTOGRAPHS What are Aerial Photographs? Aerial photographs are images of the land taken from an airplane and printed on 9 x9 photographic paper. Why are Aerial Photographs Important? Aerial photographs
Remote Sensing an Introduction
 Remote Sensing an Introduction Seminar: Space is the Place Referenten: Anica Huck & Michael Schlund Remote Sensing means the observation of, or gathering information about, a target by a device separated
The Scientific Data Mining Process
 Chapter 4 The Scientific Data Mining Process When I use a word, Humpty Dumpty said, in rather a scornful tone, it means just what I choose it to mean neither more nor less. Lewis Carroll [87, p. 214] In
EXPLORING SPATIAL PATTERNS IN YOUR DATA
 EXPLORING SPATIAL PATTERNS IN YOUR DATA OBJECTIVES Learn how to examine your data using the Geostatistical Analysis tools in ArcMap. Learn how to use descriptive statistics in ArcMap and Geoda to analyze
Classification-based vehicle detection in highresolution
 Classification-based vehicle detection in highresolution satellite images Line Eikvil, Lars Aurdal and Hans Koren Norwegian Computing Center P.O. Box 114, Blindern NO-0314 Oslo, Norway Tel: +47 22 85 25
Evaluation of the Effect of Upper-Level Cirrus Clouds on Satellite Retrievals of Low-Level Cloud Droplet Effective Radius
 Evaluation of the Effect of Upper-Level Cirrus Clouds on Satellite Retrievals of Low-Level Cloud Droplet Effective Radius F.-L. Chang and Z. Li Earth System Science Interdisciplinary Center University
Digital Image. Processing. Alpha. Science International Ltd. Oxford, U.K. S. K. Ghosh
 Digital Image Processing S. K. Ghosh Alpha Science International Ltd. Oxford, U.K. Preface Acknowledgement List offigures List of Tables vii ix xix xxiii 1. Concept of Images 1.1 1.1 Introduction 1.1 1.2
Introduction to Remote Sensing and Image Processing
 Introduction to Remote Sensing and Image Processing Of all the various data sources used in GIS, one of the most important is undoubtedly that provided by remote sensing. Through the use of satellites,
How To Make An Orthophoto
 ISSUE 2 SEPTEMBER 2014 TSA Endorsed by: CLIENT GUIDE TO DIGITAL ORTHO- PHOTOGRAPHY The Survey Association s Client Guides are primarily aimed at other professionals such as engineers, architects, planners
Treasure Hunt. Lecture 2 How does Light Interact with the Environment? EMR Principles and Properties. EMR and Remote Sensing
 Lecture 2 How does Light Interact with the Environment? Treasure Hunt Find and scan all 11 QR codes Choose one to watch / read in detail Post the key points as a reaction to http://www.scoop.it/t/env202-502-w2
Sub-pixel mapping: A comparison of techniques
 Sub-pixel mapping: A comparison of techniques Koen C. Mertens, Lieven P.C. Verbeke & Robert R. De Wulf Laboratory of Forest Management and Spatial Information Techniques, Ghent University, 9000 Gent, Belgium