PUMA SE FINANCIAL REPORT. January - June of 2013
|
|
|
- Edwin Palmer
- 8 years ago
- Views:
Transcription
1 PUMA SE FINANCIAL REPORT January - June of 2013
2 - 2 - CONTENT Key Figures 3 Interim Management Report Development of the PUMA Share Rebased Development incl. Trading Volume (Xetra) - General Economic Conditions 4 - Strategy 4 - Sales and Earnings Development Net Assets and Financial Position 10 - Outlook 11 Interim Consolidated Financial Statements - Balance Sheet 12 - Income Statement 13 - Statement of Comprehensive Income 14 - Cashflow Statement 15 - Changes in Equity 16 - Operating Segments Notes to the Financial Report Managing Directors / Administrative Board 22 Financial Calendar July Aug Sep Oct Nov Dec Jan Feb Mar Apr May June Xetra Trading Volume PUMA Share MDAX Index
3 - 3 - Key Figures 1-6/ /2012 Devi- million million ation Brand Sales 1.559, ,3-5,6% Consolidated net sales 1.473, ,8-6,3% Gross profit in % 47,7% 50,2% Operating result 110,1 149,1-26,1% Net earnings 67,8 100,6-32,6% - in % 4,6% 6,4% Michael Laemmermann, CFO: Despite sluggish performances in Southern Europe and the Far East as well as currency headwinds impacting sales, PUMA s second quarter performance was in line with our full-year guidance. We have pushed forward with our Transformation and Cost Reduction Program and continued to reduce the number of underperforming retail stores. With our new Chief Executive and Chief Operating Officers as well as Global Creative Director onboard, we are well positioned to secure profitable, long term growth. Total assets 2.523, ,7-2,2% Equity ratio in % 64,6% 65,7% Working capital 685,5 707,4-3,1% Cashflow - gross 125,8 182,8-31,2% Free cashflow (before acquisition) -91,9-57,1 61,0% Earnings per share (in ) 4,54 6,72-34,1% Cashflow - gross per share (in ) 8,42 12,21-31,0% Free cashflow per share (in ) (before acquisition) -6,15-3,81 61,4% Share price at end of the period 216,25 227,75-5,0% Market capitalization at end of the period ,0% Investments in tangible and intangible assets (excluding goodwill) 19,1 34,0-43,9% BRAND SALES Jan. - June ( million) CONSOLIDATED SALES Jan. - June ( million) EARNINGS PER SHARE Jan. - June ( ) ,07 7,69 6,72 4,54 1,
4 - 4 - Interim Management Report GENERAL ECONOMIC CONDITIONS The summer forecast published on June 20, 2013 by the Kiel World Economic Institute indicates that the world economy continued to grow, albeit at a slow pace during the first months of Gross domestic product (GDP) in western economies in particular increased modestly, although the recession in Europe continued despite a reduction in the rate of contraction. There does not, however, appear to be much hope of a recovery in southern Europe on the horizon. Growth in emerging markets also remained muted. STRATEGY With the objective of becoming "The Most Desirable and Sustainable Sportlifestyle Company, PUMA's position as one of the few, true multicategory brands is to be strengthened and the opportunities offered by the sportlifestyle market are to be systematically exploited in all categories and regions. As a multi-category supplier, PUMA is active in categories and business fields/divisions that suit its unique brand positioning, and in which permanent value increases can be achieved for the company. PUMA is positioned as a sportlifestyle brand that takes pleasure in skilfully combining sports and lifestyle influences and which strives to contribute to a better world. The above-mentioned brand positioning is to be supported by selectively expanding the existing product categories, by regional expansion, and by expansion with non-puma brands.
5 - 5 - Sales and Earnings Development Global Brand Sales Worldwide PUMA brand sales - comprised of consolidated and license sales - declined by 3.2% currency adjusted, from 795 million last year to 739 million in the first quarter of On a half year basis, brand sales decreased 2.4% currency adjusted to 1,559 million compared to the first half of Consolidated Sales PUMA s consolidated sales declined by 4.0% currency adjusted from 753 million to 692 million as a result of lower sales in all regions during the second quarter of Sales in Euro terms fell by 8.0% due to negative currency effects in various countries, notably in Japan, Argentina and South Africa. Eastern European growth boosted by Russian Market The EMEA region recorded a decline of 4.7% currency adjusted with sales of 266 million in the second quarter. PUMA s sales performance in Eastern Europe bucked the current sluggish business trend in Europe, delivering mid-single digit sales growth currency adjusted. Russia in particular rose strongly, delivering strong double-digit currency adjusted growth against a background of continuing retail portfolio optimization. Sales in Turkey rose likewise, driven in particular by an improved retail performance. However, these excellent performances were more than offset by slowing sales in Western and Southern Europe with France and Italy in particular not meeting expectations within the region. In the Americas sales softened by 1.3% currency adjusted to 267 million in the second quarter of 2013, including strong comparables. While sales in the US market decreased slightly and performance in Chile slowed, Canada and Argentina improved significantly. Golf products resonated particularly well with consumers in Canada, while in Argentina improved product availability due to increased local production underpinned strong sales growth. Sales in the Asia/Pacific region fell by 7.2% currency adjusted to 159 million, declining in nearly all markets. Although India continues to deliver another excellent quarterly performance, where our cricket offering continues to perform, and sales in Japan were positive on a currency adjusted basis, this was compensated by slowdowns in Korea and China, where some wholesalers have consolidated and high inventories persist within the market. Mixed half-year regional performance During the first six months of 2013, sales in EMEA declined by 4.8% currency adjusted to 614 million as major markets continued to underperform. However, the Americas performed much better, with sales being up slightly by 0.2% currency adjusted to 527 million. Asia/Pacific finished down by 5.0% currency adjusted at 333 million for the first half of the year CONSOLIDATED SALES ( million) CONSOLIDATED SALES Jan. - June ( million) SALES BY REGION Jan. - June ( million) Q1 Q2 Q3 Q4 Accessories Apparel Footwear Asia/Pacific Americas EMEA
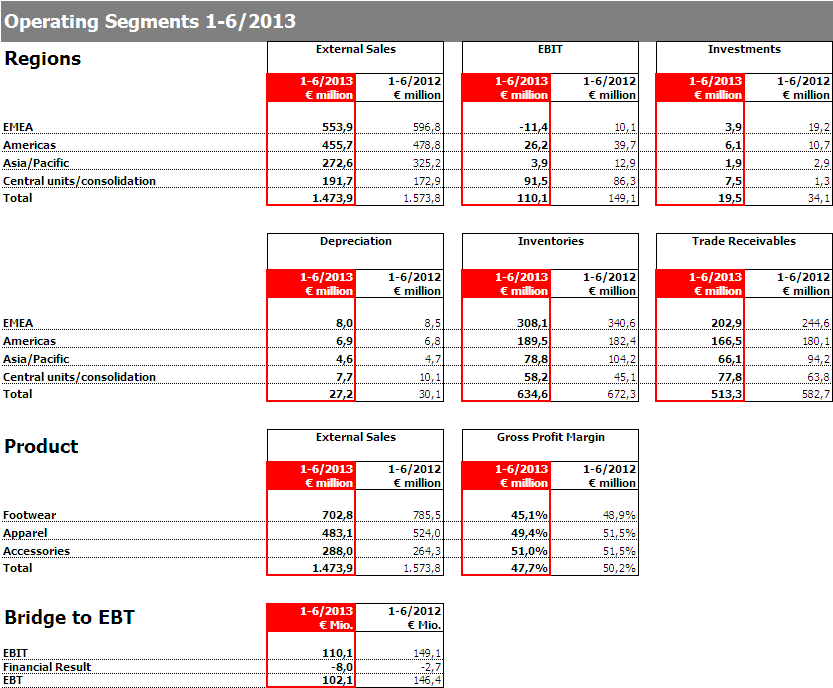
6 - 6 - Sales by regions and product segments million Euro Breakdown by regions Q2 growth rates 1-6 growth rates currency adjusted Euro currency adjusted EMEA 266,2 283,6-6,1% -4,7% 614,1 651,6-5,7% -4,8% Americas 267,0 278,7-4,2% -1,3% 527,2 539,5-2,3% 0,2% Asia/Pacific 159,1 190,6-16,5% -7,2% 332,5 382,6-13,1% -5,0% Total 692,3 752,9-8,0% -4,0% 1.473, ,8-6,3% -3,1% Breakdown by product segments Footwear 329,8 370,9-11,1% -7,3% 702,8 785,5-10,5% -7,5% Apparel 227,0 256,4-11,5% -6,8% 483,1 524,0-7,8% -3,8% Accessories 135,6 125,6 7,9% 10,9% 288,0 264,3 9,0% 11,4% Total 692,3 752,9-8,0% -4,0% 1.473, ,8-6,3% -3,1%
7 - 7 - Retail Business continues to grow as Transformation Program takes effect PUMA has continued to optimize its retail portfolio, notably by closing non-performing stores in line with the Transformation and Cost Reduction Program. This, combined with the opening of new, profitable stores and an improved e-commerce platform, has helped to propel PUMA s retail performance. Retail Sales increased by 3.4% currency adjusted in the second quarter to 149 million and by 8.1% during the first six months of the year to 284 million, which represents 19.3% of our total sales. Innovative Running Shoe Mobium is making Strides Currency adjusted Footwear sales moved down by 7.3% to 330 million in the second quarter of Although our Lifestyle category continues to perform well, Motorsport did not meet expectations and Teamsport was lower due to high comparables from last year s sales triggered by the Euro However, PUMA s top-selling adaptive running shoe Mobium Elite has won multiple awards. It has garnered accolades across the globe, including Most Innovative (Competitor Magazine/US), Best New Technology (Go Multi/South Africa) and Best Debut (Runner s World China). PUMA s Mobium Elite will continue to evolve and thrive with new colors and hues available in the coming seasons. The new evospeed football boot, which was launched in the second quarter, is also off to a good start with positive sell-through rates at major football specialty retailers. Sales in the Apparel segment declined by 6.8% currency adjusted to 227 million. While the Lifestyle and Fitness categories remained below expectations in the second quarter, PUMA s football category benefitted from Borussia Dortmund s outstanding performances in the Champions League. Accessories climbed by 10.9% currency adjusted to 136 million, as our joint ventures for socks and bodywear continued to outperform. Cobra PUMA Golf one of PUMA s currently most successful categories - grew by double digits. Golf professional and PUMA partner Jonas Blixt recently underscored Cobra PUMA Golf s burgeoning reputation, winning the Greenbrier Classic, his first US PGA tournament of the year. With his Cobra Clubs and PUMA Apparel and Footwear, Jonas cleared up the field to win by two strokes. Varied half yearly segment sales Footwear sales in the first half of the year were down by 7.5% currency adjusted to 703 million. Likewise Apparel, where sales retreated by 3.8% currency adjusted to 483 million. Accessories, however, advanced by 11.4% currency adjusted to 288 million. PUMA has had great successes with its partnered athletes and teams in the first half of the year. The focus now turns to the Track & Field World Championships in Moscow in August, where PUMA will be partnering eight national teams in the competition. Their performances will not only further improve PUMA s brand visibility but also our product expertise in the Running category.
8 - 8 - Transformation and Cost Reduction Program in line with plan PUMA continued to realize its quarterly objectives in effecting the Transformation and Cost Reduction Program during the second quarter of The company s retail portfolio delivered growth whilst being optimized, as unprofitable stores were closed and at the same time new, profitable stores opened in the second quarter. PUMA has now closed 60 stores within the Transformation Program since the beginning of the year, which also impacted the total sales number. In line with the Transformation and Cost Reduction Program, PUMA has also continued with its divestiture of non-core marketing and sponsorship assets and will continue to do so in the second half of the year. In addition, there has been further streamlining within PUMA s European operations, as the organization follows its path towards a more efficient, fully regional setup, and also amongst our business unit structure, both helping us to become a more market and consumer focused organization. This is all part of the management s clear aim of invigorating the brand desirability and rejuvenating the product offering, with a sharp focus on core markets and categories. PUMA continues to foster an entrepreneurial culture and cultivate strong sales forces in its markets, thriving on the high motivation of its employees. Gross Profit Margin Gross Profit Margin abates The expected pressure on margins continued during the second quarter of 2013, pushing PUMA s gross profit margin down from 49.1% to 46.0%. Ongoing currency headwinds arising from negative hedging positions compared to the same period last year, increased promotional activity as well as the regional and Footwear product mix combined to exert pressure on the margin. Footwear margin dropped from 48.3% to 44.1%, further impacted by discounts. Apparel fell from 49.4% to 47.0% and Accessories fell from 51.1% to 49.2%. The gross profit margin also declined over the first six months of the year from 50.2% to 47.7%. Footwear moved down from 48.9% to 45.1%, Apparel retreated from 51.5% to 49.4% and Accessories ebbed from 51.5% to 51.0%. Operating Expenses Maintained OPEX focus delivers an improved OPEX ratio As PUMA continues to implement the Transformation and Cost Reduction Program laid out last year, the Company continues to benefit in terms of reduced operating expenditure throughout the firm. Operating expenditures declined by almost 11% from 327 million to 292 million during the second quarter of 2013, underpinning our efforts to further improve the overall efficiency of our organization. This OPEX reduction has resulted in a decrease in the OPEX ratio by 130bps year-on-year to 42.2% in the second quarter. OPEX also fell during the first half of 2013 compared to 2012 and improved from 650 million to 602 million, with OPEX ratio decreasing to 40.8%. GROSS PROFIT MARGIN (in %) 51,2% 49,1% 49,1% 46,0% 48,2% 44,6% Q1 Q2 Q3 Q4
9 - 9 - EBIT Although, and as mentioned above, PUMA continues to achieve significant savings through the Cost Reduction Program, those could not offset the decline in sales and gross profit margin. As a result, EBIT declined from 47 million to 31 million in the second quarter. Similarly, half-year EBIT declined from 149 million to 110 million, equal to an EBIT margin of 7.5%. Financial Result/Income from Associated Companies The second quarter financial result was broadly stable at -4 million. Currency fluctuations during the first half of the year moved the financial result down from -3 million to -8 million compared to last year. Earnings before Taxes EBT for the second quarter was down from 43 million to 27 million with tax expenses also declining, reflecting a lower tax rate of 24.5% in the quarter. PUMA s half-year EBT also fell from 146 million to 102 million, with the tax rate improving to 28.0%. Net Earnings PUMA s consolidated net earnings retreated from 27 million to 18 million during the second quarter of Earnings per share fell from 1.78 to Net earnings also declined during the first half of 2013 from 101 million to 68 million with EPS decreasing from 6.72 to EBIT ( million) EARNINGS PER SHARE ( ) ,92 3,36 1,78 1,17 0,81 Q1 Q2 Q3 Q4-56 Q1 Q2 Q3 Q4-2,85
10 Net Assets and Financial Position Working Capital Working Capital improves As a result of PUMA s continued emphasis on tight inventory management, inventories as of June 30th were 5.6% lower at 635 million compared to last year. Group trade receivables were also 11.9% lower at 513 million compared to last year. The Group s working capital has therefore developed positively from 707 million to 685 million at the end of June Cashflow / Capex PUMA s Free Cashflow continued to improve during the first half of the year, moving from -147 million to -112 million. This is a result of lower payments for acquisitions and reduced Capex in The Free Cashflow (before acquisitions) came in at -92 million compared to -57 million for the same period in Capex significantly declined from 34 million to 19 million, with lower investments in retail stores and other equipment. Cash Position As a consequence of the elements mentioned above, PUMA s net cash position improved from 236 million to 291 million at the end of the second quarter.
11 Outlook 2013 Global Economy The summer forecast published on June 20, 2013 by the Kiel World Economic Institute projects only a piecemeal acceleration of global growth. Despite various sentiment indicators remaining rather low, the IfW indicator for world economic activity, based on the market sentiment in 42 countries, points to a somewhat higher growth for world output. The experts of the IfW have marginally revised their forecast, and project global gross domestic product (GDP) to increase by 3.2% this year, down from 3.4% in the March forecast. For 2014 they have also revised the outlook down slightly, to 3.8% (from 4.0% in March). Investments Investments totaling up to 60 million are planned for The majority of these funds have been allocated to infrastructure investments which are necessary to help drive the planned growth in sales, the expansion of our core markets as well as selective investments in retail trade operations. General Matters New Chief Operating Officer and Global Creative Director appointed PUMA has appointed Andy Koehler as Chief Operating Officer (COO), who took up his position on June 1st. Andy, who succeeds former COO Klaus Bauer, is part of PUMA s new management team built around PUMA s new CEO Bjoern Gulden. Andy takes control of the Operations, Supply Chain Management, Logistics and IT functions. To strengthen product and design, PUMA has created the new position of Global Creative Director as part of its Transformation Program and appointed to it Torsten Hochstetter. Torsten is responsible for designing, creating and developing the Sport Performance and Sport Lifestyle collections of the brand, touching on all product categories including Footwear, Apparel and Accessories. Torsten will work hands-on with all respective PUMA design teams worldwide. Outlook 2013 Full-year guidance remains unchanged from the first quarter Following PUMA s sales performance for the first half year 2013, Management continues to expect a low to mid single-digit decline in currency adjusted full-year net sales as well as pressure on the gross profit margin during the second half. As a consequence, and also based on continued OPEX improvements, Management reiterates its first quarter guidance and expects an increase in net earnings compared to 2012.
12 Balance Sheet Jun. 30,'13 Jun. 30,'12 Devi- Dec. 31,'12 million million ation million ASSETS Cash and cash equivalents 334,7 281,8 18,8% 407,3 Inventories 634,6 672,3-5,6% 552,5 Trade receivables 513,3 582,7-11,9% 507,0 Other current assets (Working Capital related) 157,8 160,9-1,9% 167,4 Other current assets 19,1 21,0-9,0% 8,4 Current assets 1.659, ,7-3,4% 1.642,6 Deferred taxes 140,3 92,2 52,1% 152,0 Other non-current assets 723,7 768,8-5,9% 735,7 Non-current assets 864,0 861,1 0,3% 887,6 Total Assets 2.523, ,7-2,2% 2.530,3 LIABILITIES AND SHAREHOLDERS' EQUITY Current bank liabilities 43,8 46,1-5,0% 44,1 Trade payables 435,3 469,5-7,3% 376,1 Other current liabilities (Working Capital related) 185,0 238,9-22,6% 227,2 Other current liabilities 108,0 4,2 156,1 Current liabilities 772,0 758,7 1,8% 803,5 Deferred taxes 53,9 55,1-2,2% 54,1 Pension provisions 30,0 30,8-2,6% 30,7 Other non-current liabilities 37,3 39,4-5,5% 44,7 Non-current liabilities 121,2 125,4-3,3% 129,4 Shareholders' equity 1.630, ,6-3,8% 1.597,4 Total Liabilities and Shareholders' equity 2.523, ,7-2,2% 2.530,3
13 Second Quarter Full Year Income Statement Q2/2013 Q2/2012 Devi- 1-6/ /2012 Devi- million million ation million million ation Sales 692,3 752,9-8,0% 1.473, ,8-6,3% Cost of sales -373,6-383,1-2,5% -771,2-783,8-1,6% Gross profit 318,7 369,8-13,8% 702,7 790,0-11,0% - in % of consolidated sales 46,0% 49,1% 47,7% 50,2% Royalty and commission income 4,6 4,7-0,4% 9,5 9,0 5,5% Other operating income and expenses -292,2-327,4-10,8% -602,0-649,9-7,4% Operating result (EBIT) 31,2 47,1-33,8% 110,1 149,1-26,1% - in % of consolidated sales 4,5% 6,2% 7,5% 9,5% Financial result / Income from associated companies -4,1-3,7 9,4% -8,0-2,7 202,4% Earnings before taxes (EBT) 27,1 43,3-37,5% 102,1 146,4-30,3% - in % of consolidated sales 3,9% 5,8% 6,9% 9,3% Taxes on income -6,6-14,6-54,7% -28,6-42,6-32,8% - Tax rate 24,5% 33,8% 28,0% 29,1% Net earnings attributable to non-controlling interests -2,9-2,0 44,3% -5,7-3,3 74,9% Net earnings 17,5 26,7-34,2% 67,8 100,6-32,6% Earnings per share ( ) 1,17 1,78-34,1% 4,54 6,72-32,4% Earnings per share ( ) - diluted 1,17 1,78-34,1% 4,54 6,72-32,4% Weighted average shares outstanding 14,939 14,972-0,2% Weighted average shares outstanding - diluted 14,940 14,974-0,2%
14 Statement of Comprehensive Income * After tax Tax impact Before tax After tax Tax impact Before tax million million million million million million Net earnings 73,5 73,5 103,8 103,8 Currency changes -42,1-42,1 17,4 17,4 Neutral effects hedge accounting 15,3-4,3 19,7-4,0 1,8-5,8 Share in other comprehensive income of at equity accounted investments 0,1 0,1 0,0 0,0 Items expected to be reclassified to the income statement in the future -26,8-4,3-22,5 13,4 1,8 11,6 Remeasurements of the net defined benefit liability 0,5-0,1 0,6 0,1 0,1 Items not expected to be reclassified to the income statement in the future 0,5-0,1 0,6 0,1 0,0 0,1 Other result -26,3-4,5-21,8 13,5 1,8 11,7 Comprehensive income 47,2-4,5 51,7 117,3 1,8 115,5 attributable to: Non-controlling interest 5,8 5,8 3,4 3,4 Equity holders of the parent 41,4-4,5 45,9 113,9 1,8 112,1 * Presentation adjusted in accordance with revised IAS 1
15 Cashflow Statement 1-6/ /2012 Devi- million million ation Earnings before taxes (EBT) 102,1 146,4-30,3% Financial result and non cash effected expenses and income 23,7 36,3-34,9% Cashflow - gross 125,8 182,8-31,2% Change in net working capital -147,2-168,2-12,5% Taxes and interest payments -45,9-40,4 13,6% Cashflow from operating activities -67,3-25,8 160,8% Payments for acquisitions -20,6-90,1-77,1% Payments for investments in fixed assets -19,1-34,0-43,9% Other investing activities -5,4 2,8-295,5% Cashflow from investing activities -45,1-121,4-62,8% Free Cashflow -112,5-147,2-23,6% Free Cashflow (before acquisition) -91,9-57,1 61,0% Dividends paid to equity holders of the parent company -7,5-29,9-75,0% Dividends paid to non-controlling interests -8,7-0,6 Proceeds from short term borrowings 58,0 0,0 Other changes 2,7 10,5-73,9% Cashflow from financing activities 44,6-19,9-324,1% Effect on exchange rates on cash -4,7 0,6 Change in cash and cash equivalents -72,5-166,4-56,4% Cash and cash equivalents at beginning of financial year 407,3 448,2-9,1% Cash and cash equivalents end of the period 334,7 281,8 18,8%
16 Changes in Equity Subscribed Group reserves Retained Treasury Equity Non- Total capital Capital Revenue Difference Cashflow At equity earnings stock before controlling Equity reserve reserves from hedges accounted non- interests currency investments controlling million conversion interests Dec. 31, ,6 187,6 66,7 6,4 19,8 0, ,3-32, ,5 0, ,2 Net earnings 0,0 0,0 0,0 0,0 0,0 0,0 100,6 0,0 100,6 3,3 103,8 Net income directly recognized in equity 0,0 0,0 0,1 17,9-4,0-0,6 0,0 0,0 13,4 0,1 13,5 Comprehensive income 0,0 0,0 0,1 17,9-4,0-0,6 100,6 0,0 113,9 3,4 117,3 Dividends paid to equity holders of the parent company / noncontrolling interests -29,9-29,9-0,6-30,4 Value of employees services 3,6 0,0 3,6 3,6 Conversion of options -0,8 0,8 0,0 0,0 June 30, ,6 190,3 66,7 24,3 15,7 0, ,0-31, ,1 3, ,6 Dec. 31, ,6 189,8 65,1-24,9-6,4 0, ,6-31, ,5 8, ,4 Net earnings 0,0 0,0 0,0 0,0 0,0 0,0 67,8 0,0 67,8 5,7 73,5 Net income directly recognized in equity 0,0 0,0 0,5-42,3 15,3 0,1 0,0 0,0-26,3 0,1-26,3 Comprehensive income 0,0 0,0 0,5-42,3 15,3 0,1 67,8 0,0 41,4 5,8 47,2 Dividends paid to equity holders of the parent company / noncontrolling interests -7,5-7,5-8,7-16,1 Value of employees services 1,9 1,9 1,9 Conversion of options -0,0 0,0 0,0 0,0 June 30, ,6 191,6 65,7-67,2 9,0 0, ,9-31, ,3 6, ,4
17 - 17 -
18 - 18 -
19 Notes to the Financial Report for the First Six Months of 2013 GENERAL REMARKS Under the PUMA brand name, PUMA SE and its subsidiaries (the PUMA group ) are engaged in the development and sales of a broad range of sport and sportlifestyle products including footwear, apparel and accessories. The company s registered head office is in Herzogenaurach, Federal Republic of Germany; its responsible court of registration is at Fürth (Bavaria). PUMA is an affiliated company of the Kering Group (formerly PPR Group) and will be consolidated in the consolidated financial statements of Kering. ACCOUNTING STANDARDS The unaudited financial report of PUMA SE and its subsidiaries (which together form the PUMA group) was prepared according to IAS 34 Interim Financial Reporting and should be read in connection with the annual financial statements as of December 31, The consolidated financial statements details contained therein apply to the financial reports for 2013, unless changes have been explicitly referred to. The financial report corresponds to all committing standards and interpretations applied and explained in the annual financial statements as of December 31, An exception is made only for the new standards and interpretations which must be applied for the first time for financial years as of January 1, 2013, and these had no significant impact on the accounting. This financial report is partly based on assumptions and estimates which have an impact on the amounts and on the breakdown of the reported assets and liabilities as well as of the revenues and expenses. The actual values may, in some exceptional cases, differ from these assumptions and estimates at a later date. The corresponding changes if and when they occur will be considered as soon as the findings are revised. SEASONAL VARIANCE The group s sales fluctuate with the seasons. Consequently, the sales and resulting earnings vary in the course of a year. EMPLOYEES Number of employees at the beginning of the period Number of employees at the end of the period Average number of employees ,290 10,836 10,553 10,889 10,692 10,745
20 EARNINGS PER SHARE Earnings per share are calculated according to IAS 33 by dividing the result for the period by the weighted average number of outstanding shares. The repurchased shares reduced the number of outstanding shares as well as diluted number of shares. In principle, outstanding stock options from the Management Incentive Program can result to a dilution of earnings per share Earnings per share Diluted earnings per share DIVIDEND According to the Annual Shareholders Meeting on May 7, 2013, a dividend of 0.50 per share was approved for the fiscal year The dividend totaled 7.5 million and was paid to the shareholders beginning on May 8, SHAREHOLDERS EQUITY Subscribed Capital As of balance sheet date the subscribed capital amounted to 38.6 million, divided into 15,082,464 no par value shares. Treasury Stock The resolution adopted by the Annual General Meeting on April 20, 2010 authorized the company to purchase until April 19, 2015 its own shares to a value of up to ten percent of the share capital. The company did not add shares to the treasury stock during the first six months. At the end of June, the company held a total of 142,989 shares. This represents 0.95% of the total subscribed capital. Development Number of Shares Number of shares at the beginning and at the end of the period Thereof own shares/treasury stocks Conversion of Management Incentives (issue of treasury stock) Shares outstanding at the end of the period ,082,464 15,082, , , ,762 14,939,475 14,938,395 Weighted average number 14,939,315 14,972,270 of shares, outstanding Diluted number of shares 14,940,458 14,974,166 RELATED PARTY TRANSACTIONS PUMA SE has taken on short-term financial liabilities ( 58.0 million) as a related party of the Kering-group as part of its financing activities. These liabilities are presented as other current liabilities that are not part of the working capital.
21 SEGMENT REPORTING Segment reporting is based on geographical regions in accordance with the internal reporting structure. Sales and gross profit are shown according to the geographical region where the respective group company is located (head office). Intra-group sales are eliminated. Allocation of the remaining segment information is also determined on the basis of the respective group company s head office. The sum totals equal the amounts on the income statement or on the balance sheet, respectively. EVENTS AFTER THE BALANCE SHEET DATE There were no events after the balance sheet date which may have a material effect on the financial situation and earnings position as of June 30, Responsibility Statement To the best of our knowledge, and in accordance with the applicable reporting principles for interim financial reporting, the interim consolidated financial statements give a true and fair view of the assets, liabilities, financial position and profit or loss of the group, and the interim management report of the group includes a fair review of the development and performance of the business and the position of the group, together with a description of the principal opportunities and risks associated with the expected development of the group for the remaining months of the financial year. Herzogenaurach, July 24, 2013 The Managing Directors
22 Managing Directors Bjoern Gulden (from July 1, 2013) (CEO, Chief Executive Officer) Stefano Caroti (CCO, Chief Commercial Officer) Michael Laemmermann (CFO, Chief Financial Officer) Andy Koehler (from June 1, 2013) (COO, Chief Operating Officer) Administrative Board Jean-François Palus (Chairman) François-Henri Pinault (Deputy Chairman) Thore Ohlsson Todd Hymel Michel Friocourt Jean-Marc Duplaix (from May 7, 2013) Bernd Illig Employees Representative Martin Koeppel Employees Representative Guy Buzzard Employees Representative
9132 81-0 email: investor-relations@puma.")
23 Financial Calendar FY 2013 February 14, 2013 Financial Results FY 2012 May 7, 2013 Annual Shareholders Meeting May 14, 2013 Financial Results Q1/2013 July 24, 2013 Financial Results Q2/2013 Published by PUMA SE PUMA Way 1 D Herzogenaurach Tel.: +49 (0) investor-relations@puma.com Internet: November 8, 2013 Financial Results Q3/2013 The financial releases and other financial information are available on the Internet at about.puma.com. Notes relating to forward-looking statements: This document contains forward-looking information about the Company s financial status and strategic initiatives. Such information is subject to a certain level of risk and uncertainty that could cause the Company's actual results to differ significantly from the information discussed in this document. The forward-looking information is based on the current expectations and prognosis of the management team. Therefore, this document is further subject to the risk that such expectations or prognosis, or the premise of such underlying expectations or prognosis, become erroneous. Circumstances that could alter the Company's actual results and procure such results to differ significantly from those contained in forward-looking statements made by or on behalf of the Company include, but are not limited to those discussed be above. PUMA PUMA is one of the world s leading Sportlifestyle companies that designs and develops footwear, apparel and accessories. It is committed to working in ways that contribute to the world by supporting Creativity, SAFE Sustainability and Peace, and by staying true to the principles of being Fair, Honest, Positive and Creative in decisions made and actions taken. PUMA starts in Sport and ends in Fashion. Its Sport Performance and Lifestyle labels include categories such as Football, Running, Motorsports, Golf and Sailing. Sport Fashion features collaborations with renowned designer labels such as Alexander McQueen, Mihara Yasuhiro and Sergio Rossi. The PUMA Group owns the brands PUMA, Cobra Golf and Tretorn. The company, which was founded in 1948, distributes its products in more than 120 countries, employs about 10,000 people worldwide and has headquarters in Herzogenaurach/Germany, Boston, London and Hong Kong. For more information, please visit
PUMA s Second Quarter Sales in line with Guidance
 PRESS RELEASE PUMA s Second Quarter Sales in line with Guidance Herzogenaurach, July 24, 2013 2013 Second Quarter Facts Consolidated sales decline by 4.0% currency adjusted to 692 million Strong sales
PUMA SE FINANCIAL REPORT. January - March of 2014
 PUMA SE FINANCIAL REPORT January - March of 2014 - 2 - CONTENT Key Figures 3 Development of the PUMA Share Rebased Development incl. Trading Volume (Xetra) Interim Management Report 140 70 - General Economic
PUMA SE FINANCIAL REPORT. January - September of 2013
 PUMA SE FINANCIAL REPORT January - September of 2013 - 2 - CONTENT Key Figures 3 Interim Management Report - General Economic Conditions 4 - Strategy 4 - Sales and Earnings Development 5-8 - Net Assets
PUMA SE FINANCIAL REPORT. January - June of 2014
 PUMA SE FINANCIAL REPORT January - June of 2014 - 2 - CONTENT Key Figures 3 Interim Management Report - General Economic Conditions 4 - Strategy 4 - Sales and Earnings Development 5-8 - Net Assets and
PUMA SE FINANCIAL REPORT. January September of 2014
 PUMA SE FINANCIAL REPORT January September of 2014 - 2 - CONTENT Key Figures 3 Interim Management Report - General Economic Conditions 4 - Strategy 4-5 - Sales and Earnings Development 6-9 - Net Assets
PUMA SE FINANCIAL REPORT. January March of 2015
 PUMA SE FINANCIAL REPORT January March of 2015 - 2 - CONTENT Key Figures 3 Interim Management Report - General Economic Conditions 4 - Strategy 4-5 - Sales and Earnings Development 6-8 - Net Assets and
Herzogenaurach, Germany, July 27, 2004 PUMA AG announces its consolidated nd
 P Quarter P Half-Year For immediate release MEDIA CONTACT: INVESTOR CONTACT: U.S.A.: Lisa Beachy, Tel. +1 617 488 2945 Europe: Ulf Santjer, Tel. +49 9132 81 2489 Dieter Bock, Tel. +49 9132 81 2261 Herzogenaurach,
First Quarter Sales Show Growth of PUMA
 PRESS RELEASE First Quarter Sales Show Growth of PUMA Currency effects weigh on reported margins Herzogenaurach, May 6, 2015 2015 First Quarter Facts Sales up by 4.4% currency-adjusted (+13.2% reported)
PUMA AG Rudolf Dassler Sport
 PUMA AG Rudolf Dassler Sport FINANCIAL REPORT January - September of 2010 -2- CONTENT Financial Highlights 3 Management Report Development of the PUMA Share Rebased Development incl. Trading Volume (Xetra)
PUMA SE FINANCIAL REPORT. January September of 2015
 PUMA SE FINANCIAL REPORT January September of 2015 - 2 - CONTENT Key Figures 3 Interim Management Report 140 Development of the PUMA Share Rebased Development incl. Trading Volume (Xetra) 90 - General
Group sales stable on a currency-neutral basis Results significantly impacted by negative currency effects adidas Group confirms full year guidance
 For immediate release Herzogenaurach, May 6, 2014 First Quarter 2014 Results: Group sales stable on a currency-neutral basis Results significantly impacted by negative currency effects adidas Group confirms
DEUFOL SE JOHANNES-GUTENBERG-STR. 3 5 65719 HOFHEIM (WALLAU), GERMANY PHONE: + 49 (61 22) 50-00 FAX: + 49 (61 22) 50-13 00 WWW.
, GERMANY PHONE: + 49 (61 22) 50-00 FAX: + 49 (61 22) 50-13 00 WWW.") SEMI-ANNUAL REPORT 5 Key Figures for the Deufol Group figures in thousand 6M 2015 6M 2014 Results of operations Revenue (total) 152,088 141,450 Germany 83,770 77,730 Rest of the World 68,318 63,720 International
SEMI-ANNUAL REPORT 5 Key Figures for the Deufol Group figures in thousand 6M 2015 6M 2014 Results of operations Revenue (total) 152,088 141,450 Germany 83,770 77,730 Rest of the World 68,318 63,720 International
Ahlers AG, Herford. ISIN DE0005009708 and DE0005009732 INTERIM REPORT
 Ahlers AG, Herford ISIN DE0005009708 and DE0005009732 I N T E R I M R E P O R T for the first six months of the 2006/07 financial year (December 1, 2006 to May 31, 2007) BUSINESS DEVELOPMENT IN THE FIRST
TO OUR SHAREHOLDERS DYNAMIC FIRST HALF YEAR
 HALF YEAR REPORT AS OF JUNE 30, 2015 TO OUR SHAREHOLDERS Patrik Heider, Spokesman of the Executive Board and CFOO The Nemetschek Group maintained its dynamic development from the first quarter of 2015
FOSSIL GROUP, INC. REPORTS FOURTH QUARTER AND FISCAL YEAR 2014 RESULTS; Fourth Quarter Net Sales of $1.065 Billion; Diluted EPS Increases 12% to $3.
 FOSSIL GROUP, INC. REPORTS FOURTH QUARTER AND FISCAL YEAR 2014 RESULTS; Fourth Quarter Net Sales of $1.065 Billion; Diluted EPS Increases 12% to $3.00 Fiscal Year 2014 Net Sales Increase 8% to $3.510 Billion;
F i r s t - h a l f r e s u l t s. 30 July 2014
 F i r s t - h a l f r e s u l t s 30 July 2014 Disclaimer This presentation does not constitute an offer of securities for sale in the United States of America or any other jurisdiction. Certain information
Elements of a Pharmaceutical Spending in the United Kingdom
 Half-yearly Financial Report January 1 June 30, engineering for a better world GEA Group: Key IFRS figures GEA Group: Key IFRS figures (EUR million) Q2 Q2 1 Q1-Q2 Q1-Q2 1 Results of operations Order intake
FOSSIL GROUP, INC. REPORTS THIRD QUARTER 2014 RESULTS. Third Quarter Net Sales Increase 10% to $894 Million; Diluted EPS Increases 24% to $1.
 FOSSIL GROUP, INC. REPORTS THIRD QUARTER RESULTS Third Quarter Net Sales Increase 10% to $894 Million; Diluted EPS Increases 24% to $1.96 Updates Full Year Guidance and Provides Fourth Quarter Guidance
Management forecasts sales and earnings improvements of between 6% and 8% for 2013 as a whole
 Press Release HUGO BOSS Nine Months Results 203 HUGO BOSS increases sales and profitability Accelerating growth momentum in Group s own retail business supports sales expansion in third quarter Rise in
FOR IMMEDIATE RELEASE
 FOR IMMEDIATE RELEASE O-I REPORTS FULL YEAR AND FOURTH QUARTER 2014 RESULTS O-I generates second highest free cash flow in the Company s history PERRYSBURG, Ohio (February 2, 2015) Owens-Illinois, Inc.
Consolidated Financial Results for the First Two Quarters of the Fiscal Year Ending March 31, 2016 (Japan GAAP)
") Consolidated Financial Results for the First Two Quarters of the Fiscal Year Ending March 31, 2016 (Japan GAAP) Name of Listed Company: Yokogawa Electric Corporation (the Company herein) Stock Exchanges
Consolidated Financial Results for the First Two Quarters of the Fiscal Year Ending March 31, 2016 (Japan GAAP) Name of Listed Company: Yokogawa Electric Corporation (the Company herein) Stock Exchanges
Earnings Release Q1 FY 2016 October 1 to December 31, 2015
 Munich, Germany, January 25, 2016 Earnings Release FY 2016 October 1 to December 31, 2015 Strong start into the fiscal year earnings outlook raised»we delivered a strong quarter and are well underway in
condensed consolidated interim financial statements 2015
 January march 2015 condensed consolidated interim financial statements 2015 (unaudited) contents 1. Income Statement 1 2. Statement of Comprehensive Income 2 3. Balance Sheet 3 4. Statement of Changes
Aalberts Industries increases earnings per share +10%
 Aalberts Industries increases earnings per share +10% Langbroek, 26 February 2015 Highlights o Revenue EUR 2,201 million, increase +8% (organic +3.1%) o Operating profit (EBITA) +10% to EUR 247 million;
FINANCIAL REPORT H1 2014
 FINANCIAL REPORT H1 2014 HIGH SPEED BY PASSION 02_Key Figures 03_Group Status Report 05_Consolidated Financial Statements 10_Notes 11_Declaration of the Legal Representatives 02 PANKL KEY FIGURES EARNING
adidas Group records stellar financial performance in Q3 2015 and raises full year guidance
 FOR IMMEDIATE RELEASE Herzogenaurach, November 5, 2015 Nine Months 2015 Results: adidas Group records stellar financial performance in Q3 2015 and raises full year guidance Major developments in Q3 2015
GrandVision reports 2.8 billion Revenue and 449 million EBITDA for 2014
 GrandVision reports 2.8 billion Revenue and 449 million EBITDA for 2014 Schiphol, the Netherlands 18 March 2015. GrandVision N.V. publishes Full Year and Quarter 2014 results. 2014 Highlights Revenue grew
Financial Information
 Financial Information Solid results with in all key financial metrics of 23.6 bn, up 0.4% like-for like Adjusted EBITA margin up 0.3 pt on organic basis Net profit up +4% to 1.9 bn Record Free Cash Flow
Delta Galil Reports 2016 First Quarter Results
 Delta Galil Reports 2016 First Quarter Results Sales Rise to $256.7 Million; Net Income to Shareholders is $7.9 Million Reaffirms 2016 Guidance; Sales Expected to Reach $1,090 Million-$1,110 Million and
Net sales Operating income Ordinary income Net income
 MORITO CO., LTD. Financial Statement (Unaudited) For the Third Quarters of the Fiscal Year ended November 30, 2015 (Translated from the Japanese original) October 9, 2015 Corporate Information Code: 9837
Logwin AG. Interim Financial Report as of 31 March 2015
 Logwin AG Interim Financial Report as of 31 March 2015 Key Figures 1 January 31 March 2015 Earnings position In thousand EUR 2015 2014 Revenues Group 274,433 278,533 Change on 2014-1.5% Solutions 101,821
Key figures as of June 30, 2013 1st half
 Never standing still. Interim Report as of June 30, 2013 Contents 2 Key figures as of June 30, 2013 1st half 3 Key figures as of June 30, 2013 2nd quarter 6 Strong revenue growth 12 Consolidated interim
TO OUR SHAREHOLDERS PROFITABLE GROWTH COURSE INTERNATIONALIZATION FURTHER EXTENDED US MARKET IN FOCUS
 QUARTERLY STATEMENT AS OF MARCH 31, 2015 TO OUR SHAREHOLDERS Patrik Heider, Spokesman of the Executive Board and CFOO The Nemetschek Group has made a dynamic start in the 2015 financial year and continues
Summary of Consolidated Financial Statements for the Second Quarter of Fiscal Year Ending March 31, 2012 (Japanese GAAP)
") This document is a translation of the Japanese financial statements and is not in conformity with accounting principles of the United States. Summary of Consolidated Financial Statements for the Second
This document is a translation of the Japanese financial statements and is not in conformity with accounting principles of the United States. Summary of Consolidated Financial Statements for the Second
INTERIM REPORT JANUARY 1 SEPTEMBER 30, 2011
 Q3 INTERIM REPORT JANUARY 1 SEPTEMBER 30, 2011 Helsinki, October 27, 2011 Fiskars Corporation Interim Report January 1 - September 30, 2011 October 27, 2011 Third quarter: Net sales and operating profit
FURTHER PROFIT GROWTH IN FIRST-HALF 2015
 FURTHER PROFIT GROWTH IN FIRST-HALF 2015 Net sales of 37.7bn, up +5.2% (+2.9% on an organic basis) Growth in Recurring Operating Income: 726m, +2.6% at constant rates Strong growth in adjusted net income,
adidas Group records strong top-line momentum in Q2 2015 and confirms full year guidance
 FOR IMMEDIATE RELEASE Herzogenaurach, August 6, 2015 First Half 2015 Results: adidas Group records strong top-line momentum in Q2 2015 and confirms full year guidance Major developments in Q2 2015 1 Robust
Financial Results. siemens.com
 s Financial Results Fourth Quarter and Fiscal 2015 siemens.com Key figures (in millions of, except where otherwise stated) Volume Q4 % Change Fiscal Year % Change FY 2015 FY 2014 Actual Comp. 1 2015 2014
Management s Discussion and Analysis
 Management s Discussion and Analysis of Financial Conditions and Results of Operations For the quarter and six months ended June 30, 2012 All figures in US dollars This Interim Management s Discussion
Ahlers AG, Herford. ISIN DE0005009708 and DE0005009732 INTERIM REPORT
 Ahlers AG, Herford ISIN DE0005009708 and DE0005009732 on the first nine months of fiscal 2005/06 (December 1, 2005, to August 31, 2006) BUSINESS DEVELOPMENT IN THE FIRST NINE MONTHS OF FISCAL 2005/06 According
(April 1, 2015 June 30, 2015)
") Financial Results Summary of Consolidated Financial Results For the Three-month Period Ended June 30, 2015 (IFRS basis) (April 1, 2015 June 30, 2015) *This document is an English translation of materials
Financial Results Summary of Consolidated Financial Results For the Three-month Period Ended June 30, 2015 (IFRS basis) (April 1, 2015 June 30, 2015) *This document is an English translation of materials
Consolidated Interim Report
 Consolidated Interim Report as of 31 March 2015 UNIWHEELS AG CONTENTS 1. Key performance data 2. Condensed group management report as of 31 March 2015 3. Condensed consolidated financial statements as
GrandVision reports Revenue growth of 13.8% and EPS growth of 31.7%
 GrandVision reports Revenue of 13.8% and EPS of 31.7% Schiphol, the Netherlands 16 March 2015. GrandVision NV (EURONEXT: GVNV) publishes Full Year and Fourth Quarter 2015 results. 2015 Highlights Revenue
Consolidated Financial Summary for the Six Months Ended September 30, 2008
 Member of Financial Accounting Standards Foundation Consolidated Financial Summary for the Six Months Ended September 30, 2008 Date: November 11, 2008 Name of Listed Company: NOK Corporation Securities
HALF YEAR REPORT AS OF JUNE 30
 2 0 1 4 HALF YEAR REPORT AS OF JUNE 30 T O O U R S H A R E H O L D E R S Dear shareholders, ladies and gentlemen, The Nemetschek Group continued its successful development in the second quarter of 2014
CANON REPORTS RESULTS FOR FISCAL 1999
 February 14, 2000 CANON REPORTS RESULTS FOR FISCAL 1999 1. CONSOLIDATED RESULTS Millions of yen (except per share amounts) Actual Projected 1999 1998 Change(%) 2000 Change(%) Net sales 2,622,265 2,826,269-7.2
Consolidated Financial Results for the First Three Quarters of the Fiscal Year Ending March 31, 2016 (Japan GAAP)
") Consolidated Financial Results for the First Three Quarters of the Fiscal Year Ending March 31, 2016 (Japan GAAP) Name of Listed Company: Yokogawa Electric Corporation (the Company herein) Stock Exchanges
Consolidated Financial Results for the First Three Quarters of the Fiscal Year Ending March 31, 2016 (Japan GAAP) Name of Listed Company: Yokogawa Electric Corporation (the Company herein) Stock Exchanges
Makita Corporation. Consolidated Financial Results for the nine months ended December 31, 2007 (U.S. GAAP Financial Information)
") Makita Corporation Consolidated Financial Results for the nine months ended (U.S. GAAP Financial Information) (English translation of "ZAIMU/GYOSEKI NO GAIKYO" originally issued in Japanese language) CONSOLIDATED
Makita Corporation Consolidated Financial Results for the nine months ended (U.S. GAAP Financial Information) (English translation of "ZAIMU/GYOSEKI NO GAIKYO" originally issued in Japanese language) CONSOLIDATED
W.W. Grainger, Inc. First Quarter 2015 Results Page 1 of 9
 W.W. Grainger, Inc. First Quarter 2015 Results Page 1 of 9 News Release GRAINGER REPORTS RESULTS FOR THE 2015 FIRST QUARTER Revises 2015 Guidance Quarterly Summary Sales of $2.4 billion, up 2 percent Operating
Consolidated Settlement of Accounts for the First 3 Quarters Ended December 31, 2011 [Japanese Standards]
![Consolidated Settlement of Accounts for the First 3 Quarters Ended December 31, 2011 [Japanese Standards]](/thumbs/37/17704792.jpg "Consolidated Settlement of Accounts for the First 3 Quarters Ended December 31, 2011 [Japanese Standards]") The figures for these Financial Statements are prepared in accordance with the accounting principles based on Japanese law. Accordingly, they do not necessarily match the figures in the Annual Report issued
The figures for these Financial Statements are prepared in accordance with the accounting principles based on Japanese law. Accordingly, they do not necessarily match the figures in the Annual Report issued
CENIT AG Systemhaus. Industriestraße 52-54 D-70565 Stuttgart Tel: + 49 711 7825-30 Fax: + 49 711 7825-4000 Internet: http://www.cenit.
 9 Months Report 2007 CENIT AG Systemhaus Industriestraße 52-54 D-70565 Stuttgart Tel: + 49 711 7825-30 Fax: + 49 711 7825-4000 Internet: http://www.cenit.de Investor Relations: ISIN:DE0005407100 Fabian
Report on the nine-month period ended July 31, 2004 WKN: 330 410 ISIN: DE0003304101
 GERRY WEBER International AG Report on the first nine months of 2003/2004 Report on the nine-month period ended July 31, 2004 WKN: 330 410 ISIN: DE0003304101 The GERRY WEBER share: While the stock market
Diluted net income per share (Yen) 90.03 129.05. Net assets per share assets. Equity
 90.03 129.05. Net assets per share assets. Equity") Summary of Consolidated Financial Results for the Nine months Ended December 31, 2008 February 3, 2009 Listed company name : Sysmex Corporation Code : 6869 Listed stock exchanges : Tokyo Stock Exchange
Summary of Consolidated Financial Results for the Nine months Ended December 31, 2008 February 3, 2009 Listed company name : Sysmex Corporation Code : 6869 Listed stock exchanges : Tokyo Stock Exchange
FORACO INTERNATIONAL REPORTS Q3 2014
 NEWS RELEASE FORACO INTERNATIONAL REPORTS Q3 2014 Toronto, Ontario / Marseille, France Tuesday, November 4, 2014 Foraco International SA (TSX:FAR) (the Company or Foraco ), a leading global provider of
Verifone Reports Results for the Second Quarter of Fiscal 2016
 Verifone Reports Results for the Second Quarter of Fiscal 2016 SAN JOSE, Calif. (BUSINESS WIRE) Verifone (NYSE: PAY), a world leader in payments and commerce solutions, today announced financial results
METRO GROUP increases sales 2012 in a challenging consumer environment
 METRO GROUP increases sales in a challenging consumer environment Sales rose by 1.2% to 66.7 billion (adjusted for portfolio measures: +2.3%); EBIT before special items reached around 2.0 billion Operating
CONFERENCE CALL Q1-Q3 2010. 10 November 2010
 CONFERENCE CALL Q1-Q3 2010 10 November 2010 Agenda Overview Q1-Q3 Q3 2010 Dr Helmut Leube, Chairman of the Management Board Key financials i Q1-Q3 Q3 2010 Dr Margarete Haase, CFO Outlook Dr Helmut Leube,
Service Tax Planning - Expected Revenue Growth in FY 2015
 Munich, Germany, May 7, 2015 Earnings Release FY 2015 January 1 to March 31, 2015 Portfolio gains drive income»for business volume, we performed well in our markets. The profitability of our Industrial
DATA GROUP LTD. ANNOUNCES FIRST QUARTER RESULTS FOR 2014
 For Immediate Release DATA GROUP LTD. ANNOUNCES FIRST QUARTER RESULTS FOR 2014 HIGHLIGHTS Q1 2014 First quarter 2014 ( Q1 ) Revenues of 77.9 million, Q1 Gross Profit of 18.8 million and Q1 Net Income of
Intel Reports Fourth-Quarter and Annual Results
 Intel Corporation 2200 Mission College Blvd. P.O. Box 58119 Santa Clara, CA 95052-8119 CONTACTS: Reuben Gallegos Amy Kircos Investor Relations Media Relations 408-765-5374 480-552-8803 reuben.m.gallegos@intel.com
Q1 2015 INTERIM REPORT JANUARY MARCH
 Q1 2015 INTERIM REPORT JANUARY MARCH 2 Contents GENERAL Business Developments Overview 3 Beiersdorf s Shares 4 INTERIM MANAGEMENT REPORT GROUP Results of Operations Group 5 Results of Operations Business
How To Understand And Understand Beiersdorf
 H1 2015 INTERIM REPORT JANUARY JUNE 2 Contents GENERAL Business Developments Overview 3 Beiersdorf s Shares 4 INTERIM MANAGEMENT REPORT GROUP Results of Operations Group 5 Results of Operations Business
Overview of the key figures for the first half of the year
 Half-Year Report 2015 Q2 Revenues increase in the first half of the year by 23% EBIT increased by 1.5 million euros compared to the previous year Order book is growing Overall annual forecast remains unchanged
Consolidated Financial Results for the First Quarter of the Fiscal Year Ending March 31, 2016 (Japan GAAP)
") Consolidated Financial Results for the First Quarter of the Fiscal Year Ending March 31, 2016 (Japan GAAP) Name of Listed Company: Yokogawa Electric Corporation (the Company herein) Stock Exchanges Where
Consolidated Financial Results for the First Quarter of the Fiscal Year Ending March 31, 2016 (Japan GAAP) Name of Listed Company: Yokogawa Electric Corporation (the Company herein) Stock Exchanges Where
Order bookings 48,719 55,565-12 12,835 14,845 Sales 48,331 56,492-14 13,166 17,076
 28 January, 2002 SCANIA YEAR-END REPORT JANUARY - DECEMBER 2001 After the unsatisfactory 2001, our measures to adjust production to lower global demand, structural changes related to cab production and
Klöckner & Co SE. Q3 2014 Results
 Klöckner & Co SE A Leading Multi Metal Distributor Gisbert Rühl CEO Marcus A. Ketter CFO Results Analysts and Investors Conference November 6, Disclaimer This presentation contains forward-looking statements
Arrow Reports Solid First Quarter Operating Results and Strong Asset Quality Ratios
 250 Glen Street Glens Falls, NY Contact: Timothy C. Badger Tel: (518)745-1000 Fax: (518)745-1976 TO: All Media DATE: Tuesday, April 19, 2011 Arrow Reports Solid First Quarter Operating Results and Strong
Diluted net income per share. Six months ended Sep. 30, 2012 0.40 0.39 Six months ended Sep. 30, 2011 (1.09) -
 -") November 9, 2012 Summary of Consolidated Financial Results for the Second Quarter of Fiscal Year Ending March 31, 2013 (Six Months Ended September 30, 2012) [Japanese GAAP] Company name: Japan System Techniques
November 9, 2012 Summary of Consolidated Financial Results for the Second Quarter of Fiscal Year Ending March 31, 2013 (Six Months Ended September 30, 2012) [Japanese GAAP] Company name: Japan System Techniques
Consolidated Earnings Report for the Second Quarter of Fiscal 2011 [Japanese GAAP]
![Consolidated Earnings Report for the Second Quarter of Fiscal 2011 [Japanese GAAP]](/thumbs/39/20260573.jpg "Consolidated Earnings Report for the Second Quarter of Fiscal 2011 [Japanese GAAP]") Consolidated Earnings Report for the Second Quarter of Fiscal 2011 [Japanese GAAP] October 27, 2010 Company Name: KOITO MANUFACTURING CO., LTD. Stock Listing: First Section, Tokyo Stock Exchange Code Number:
Consolidated Earnings Report for the Second Quarter of Fiscal 2011 [Japanese GAAP] October 27, 2010 Company Name: KOITO MANUFACTURING CO., LTD. Stock Listing: First Section, Tokyo Stock Exchange Code Number:
Net income in the second quarter was 1.281 billion, compared to 538 million in the previous quarter and 578 million in the same quarter a year ago.
 Press Presse Prensa For the business and financial press Munich/Erfurt, April 25, 2002 Siemens in the second quarter (January 1 to March 31) of fiscal 2002 Net income in the second quarter was 1.281 billion,
Consolidated Financial Statements for the Third Quarter of the Fiscal Year Ending March 31 st, 2016 (FY2016), Japan GAAP February 9 th, 2016
, Japan GAAP February 9 th, 2016") Consolidated Financial Statements for the Third Quarter of the Fiscal Year Ending March 31 st, 2016 (FY2016), Japan GAAP February 9 th, 2016 Company Name Tokyo Seimitsu Co., Ltd. Stock Listing: First Section,
Consolidated Financial Statements for the Third Quarter of the Fiscal Year Ending March 31 st, 2016 (FY2016), Japan GAAP February 9 th, 2016 Company Name Tokyo Seimitsu Co., Ltd. Stock Listing: First Section,
Quarterly Financial Report
 3/2012 Quarterly Financial Report Sales up by over 27 % to more than 35 million EBIT improved by 20 % to 3.4 million Quarterly Financial Report 3/2012 Dear shareholders, employees, partners and friends
2015 Quarterly Report II
 2015 Quarterly Report II 2 Key data Eckert & Ziegler 01 06/2015 01 06/2014 Change Sales million 69.0 61.9 + 11 % Return on revenue before tax % 16 % 9 % + 87 % EBITDA million 15.6 9.7 + 61 % EBIT million
Results PostNL Q1 2015
 Results PostNL Q1 2015 On track to achieve full year 2015 outlook Financial highlights Q1 2015 Revenue at 1,058 million (Q1 2014: 1,033 million) Underlying cash operating income at 68 million (Q1 2014:
Earnings Release Q3 FY 2015 April 1 to June 30, 2015
 Munich, Germany, July 30, 2015 Earnings Release FY 2015 April 1 to June 30, 2015 Solid performance, softening market environment»overall our businesses delivered solid underlying profitability despite
Third Quarter 2014 Earnings Conference Call. 13 August 2014
 Third Quarter 2014 Earnings Conference Call 13 August 2014 Safe Harbor Statement & Disclosures The earnings call and accompanying material include forward-looking comments and information concerning the
per share diluted 44.40 Equity ratio millions of yen 188,789 Total
 Consolidated Financial Results for the First Half of the Fiscal Year Ending March h 31, 2016 (April 1, 2015 through September 30, 2015) ( Prepared pursuant to Japanese GAAP) All financial information has
Summary of Consolidated Business Results for the First Quarter of Fiscal 2015 For the fiscal year ending May 31, 2016
 October 9, 2015 Summary of Consolidated Business Results for the First Quarter of Fiscal 2015 For the fiscal year ending May 31, 2016 Toyo Denki Seizo K.K. Stock Exchange: 1st Section of the Tokyo Stock
Unaudited Half Year Financial Report January June 2013. Creating career prospects and deploying targeted professional skills.
 Creating career prospects and deploying targeted professional skills Amadeus FiRe AG Unaudited Half Year Financial Report January June 2013 Unaudited Half Year Financial Report, January June 2013 1 Unaudited
Aalberts Industries Net profit and earnings per share +15%
 PRESS RELEASE 1 ST HALF YEAR 2015 Aalberts Industries Net profit and earnings per share +15% Langbroek, 13 August 2015 Highlights o Revenue EUR 1,244 million, increase +18% (organic +2%). o Operating profit
Summary of Financial Statements (J-GAAP) (Consolidated)
 (Consolidated)") Summary of Financial Statements (J-GAAP) (Consolidated) February 10, 2016 Company Name: Sodick Co., Ltd. Stock Exchange: Tokyo Stock Exchange, 1st Section Code Number: 6143 URL: http://www.sodick.co.jp
Summary of Financial Statements (J-GAAP) (Consolidated) February 10, 2016 Company Name: Sodick Co., Ltd. Stock Exchange: Tokyo Stock Exchange, 1st Section Code Number: 6143 URL: http://www.sodick.co.jp
3 M O N T H S R E P O R T 2 O O 3 / 2 O O 4
 3 M O N T H S R E P O R T 2 O O 3 / 2 O O 4 Content 03 Hönle at a glance 04 Letter to the Shareholders 06 Management Report 09 Consolidated financial statement 17 Shareholdings of the corporate bodies
First Quarter 2015 Earnings Conference Call. May 12, 2015
 First Quarter 2015 Earnings Conference Call May 12, 2015 Forward Looking Statements Statements made in this presentation that relate to our future performance or future financial results or other future
Release no. 04 2014 Report on first quarter 2014 To NASDAQ OMX Nordic Exchange Copenhagen A/S
 Page 1/10 22 May 2014 for ROCKWOOL International A/S Today the Board of ROCKWOOL International A/S has discussed and approved the following report on first quarter 2014. Highlights Sales in first quarter
Media Contact: Mike Conway Director, Corporate Communications Sherwin-Williams Direct: 216.515.4393 Pager: 216.422.3751 mike.conway@sherwin.
 The Sherwin-Williams Company Reports First Quarter 2012 Financial Results Consolidated net sales increased 15.1% to a record $2.14 billion Diluted net income per common share increased 50.8% to a record
THE WALT DISNEY COMPANY REPORTS RECORD QUARTERLY EARNINGS FOR THE FIRST QUARTER OF FISCAL 2016
 FOR IMMEDIATE RELEASE February 9, THE WALT DISNEY COMPANY REPORTS RECORD QUARTERLY EARNINGS FOR THE FIRST QUARTER OF FISCAL Global success of Star Wars: The Force Awakens drove record quarterly operating
GERRY WEBER International AG Report on the first three months of 2005/2006 Report on the three-month period ended January 31, 2006 ISIN: DE0003304101
 GERRY WEBER International AG Report on the first three months of 2005/2006 Report on the three-month period ended January 31, 2006 ISIN: DE0003304101 The GERRY WEBER share Building on its excellent price
Quarterly Financial Report March 31, 2009. MBB Industries AG. Berlin
 Quarterly Financial Report March 31, 2009 MBB Industries AG. Berlin Quarterly Financial Report March 31, 2009 MBB Industries AG MBB Industries in Numbers 03 MBB Industries in Numbers Three Month (Jan.
Half year results 2011
 Half year results 2011 29 July 2011 Bert De Graeve, Chief Executive Officer Bruno Humblet, Chief Financial Officer Address by Bert De Graeve, Chief Executive Officer Introductory remark The consolidated
Unaudited Financial Report
 RECRUITING SERVICES Amadeus FiRe AG Unaudited Financial Report Quarter I - 2015 Temporary Staffing. Permanent Placement Interim Management. Training www.amadeus-fire.de Unaudited Amadeus FiRe Group Financial
Outstanding operating and financial performances
 PRESS RELEASE Paris, February 17, 2011 2010 Results Outstanding operating and financial performances Recurring net income from continuing operations Group share surges 56% Recurring operating income up
A good start to the year, in line with expectations Danone continues to re-balance its model of growth
 First-quarter 206 sales Press release Paris, April 9, 206 A good start to the year, in line with expectations Danone continues to re-balance its model of growth FIRST QUARTER 206 sales growth: +3.5% Solid
Nordex SE Conference Call 9M 2012. Hamburg, 13/11/2012
 Nordex SE Conference Call 9M 2012 Hamburg, 13/11/2012 AGENDA 1. Highlights 9M 2012 Dr. J. Zeschky 2. Financials 9M 2012 B. Schäferbarthold 3. Guidance 2012 and market outlook B. Schäferbarthold 4. Strategy
Half Year Financial Statement And Announcement for the Period Ended 31/12/2010
 AUSSINO GROUP LTD Company Registration No.: 199100323H Half Year Financial Statement And Announcement for the Period Ended 31/12/2010 PART I - INFORMATION REQUIRED FOR ANNOUNCEMENTS OF QUARTERLY (Q1, Q2
Aalberts Industries realises strong growth in revenue (15%) and earnings per share (24%)
 and earnings per share (24%)") date 23 February 2012 more information e-mail Jan Aalberts / John Eijgendaal info@aalberts.nl phone +31 (0)343 565 080 Press Release Aalberts Industries realises strong growth in revenue (15%) and earnings
date 23 February 2012 more information e-mail Jan Aalberts / John Eijgendaal info@aalberts.nl phone +31 (0)343 565 080 Press Release Aalberts Industries realises strong growth in revenue (15%) and earnings
Consolidated Statement of Profit or Loss (in million Euro)
") Consolidated Statement of Profit or Loss (in million Euro) Q2 2012 Q2 2013 % H1 2012 H1 2013 % Restated * change Restated * change Revenue 779 732-6.0% 1,513 1,437-5.0% Cost of sales (553) (521) -5.8%
Consolidated Statement of Profit or Loss (in million Euro) Q2 2012 Q2 2013 % H1 2012 H1 2013 % Restated * change Restated * change Revenue 779 732-6.0% 1,513 1,437-5.0% Cost of sales (553) (521) -5.8%
Our results at a glance
 1Report 15 AkzoNobel I Report for the first quarter 2015 2 AkzoNobel around the world Revenue by destination (44 percent in high growth markets) A North America B Emerging Europe C Mature Europe D Asia
WEYCO REPORTS THIRD QUARTER SALES AND EARNINGS
 WEYCO REPORTS THIRD QUARTER SALES AND EARNINGS (Milwaukee, Wisconsin---November 4, 2014) Weyco Group, Inc. (NASDAQ:WEYS) (the Company ) today announced financial results for the quarter ended September
Interim Report First Quarter of Fiscal 2004
 s Interim Report First Quarter of Fiscal 2004 Introduction We prepare the Interim Report as an update of our Annual Report, with a focus on the current reporting period. As such, the Interim Report should
Consolidated sales of 6,347 million euros, up 10% on a like-for-like basis (7% as reported)
") 14.18 Order intake surged 25% to 9.1 billion euros Sales came in at 6.3 billion euros, up 10% like for like (7% as reported) Operating margin (1) up 15% to 442 million euros, or 7.0% of sales Net income
14.18 Order intake surged 25% to 9.1 billion euros Sales came in at 6.3 billion euros, up 10% like for like (7% as reported) Operating margin (1) up 15% to 442 million euros, or 7.0% of sales Net income