PUMA SE FINANCIAL REPORT. January September of 2014
|
|
|
- Godwin Carr
- 8 years ago
- Views:
Transcription
1 PUMA SE FINANCIAL REPORT January September of 2014


2 - 2 - CONTENT Key Figures 3 Interim Management Report - General Economic Conditions 4 - Strategy Sales and Earnings Development Net Assets and Financial Position 10 - Outlook 11 Interim Consolidated Financial Statements - Balance Sheet 12 - Income Statement 13 - Statement of Comprehensive Income 14 - Cashflow Statement 15 - Changes in Equity 16 - Operating Segments Notes to the Financial Report Managing Directors / Administrative Board 22 Financial Calendar 23


3 - 3 - Bjørn Gulden, CEO: In a good third quarter, PUMA achieved sales that were slightly better than expected. Footwear sales were up for the first time in seven quarters, and operating profits met our expectations. The launch of the Forever Faster marketing campaign was well received by both consumers and retailers. We told our consumers that PUMA is back and showed our retail partners that we deliver on our promises by investing in media campaigns. We feel that things are moving in the right direction, but as we have said all along: We know that the repositioning of PUMA and the turnaround of the business will take time as we need to continue to build confidence in the marketplace. I am convinced that our efforts have already translated into better products, better marketing and more efficient operations. In addition, we have now defined the key priorities which will mark the start of our IT infrastructure upgrade, laying the foundations for a fast, lean and efficient company in the future.

4 - 4 - Interim Management Report GENERAL ECONOMIC CONDITIONS The autumn forecast published on September 11, 2014 by the Kiel World Economic Institute (IfW) indicates that global growth has again faltered during the course of A worldwide economic upturn remains out of sight. Economic growth remains susceptible to geopolitical shocks and turbulence in the financial markets. STRATEGY Our strategy encompasses the repositioning of PUMA as the World s Fastest Sports Brand, the improvement of our product engine, the optimization of our distribution quality and increasing the speed within our organization and infrastructure. In the third quarter we continued to progress well on all our key strategic priorities that are crucial to ensuring that 2014 marks the start of the turnaround. In terms of our brand repositioning, August saw the launch of the biggest marketing campaign in PUMA s history, which marked the start of our repositioning as a true Sports Brand to our consumers and retail partners. The objective of the campaign was to demonstrate that PUMA is back in sports and that our brand has great assets and a distinctive attitude: Brave, confident, determined, and joyful. We achieved this objective as our campaign reached our consumers in 35 countries, generating 1 billion TV impressions in our target group as well as 31 million online views. The market surveys showed a very positive consumer reception. The launch of this campaign marks the start of a long-term marketing strategy, with continuous investment up to the Rio de Janeiro Olympic Games in 2016 and beyond. To improve our product engine, we initiated key projects to improve our product designs, develop more innovative technologies and increase the commerciality of our product range. The first results have already been implemented for the coming Spring/Summer 2015 season, and the feedback from our retail partners make us very confident that we are heading in the right direction. With the continued positive feedback received for our Autumn/Winter 2015 collection, we are positive that we are on the right path. In order to improve the quality of our revenues and distribution, we have developed joint product and marketing programs with our key retailers to showcase our brand in the right retail environment and push sell-through with our partners. Our most prominent example is currently the PUMA Lab at Foot Locker, which we launched in Feb 2014 and has developed very positively as we have expanded our presence in the US throughout the year. The success of the PUMA Lab has not only improved our business with Foot Locker but also generated a positive spill-over effect on to other key retailers in the US marketplace both with performance and lifestyle accounts. In 2015, we will continue to foster our collaborations and will launch further product and marketing programs with our most important key accounts in every Region. We have also continued to optimize our organizational structure and setup by making it faster. With the finalization of the relocation of our Global and European Retail Organization from Oensingen, Switzerland, to our Headquarters in Herzogenaurach as of September 30th, we finalized the last out of our three major consolidation projects in This relocation followed the closure of our PUMA Village Development Center in Vietnam as of May 2nd and the relocation of our Lifestyle Business Unit from London to our Headquarters in Herzogenaurach as of May 31st.

5 - 5 - Going forward, our strategic priorities will be complemented with a further objective: the upgrade of our current IT infrastructure to match the industry s best practice benchmark. The process and system due diligence of our new COO revealed significant improvement potential in our IT and process landscape and we have now defined the key priorities which will mark the start of our IT infrastructure upgrade. We are very confident that our investment in these areas will lay the foundations for a lean and efficient company in the future. BRAND In September, PUMA participated in the capital increase of its strategic partner Borussia Dortmund GmbH & Co. KGaA (BVB) by acquiring 4,600,000 shares of the club, representing 5.0% of the voting rights. As Borussia Dortmund s technical supplier since July 2012, we look forward to continuing our successful partnership with BVB as its close partner and shareholder. As one of the top clubs in Germany and Europe, Borussia Dortmund is a perfect fit for PUMA, increasing our brand awareness on a national and international level. In addition to Borussia Dortmund, PUMA also added top English Premier League club Arsenal FC to its list of Teamsport partners at the start of the quarter. Our sales of replica jerseys, fanwear and associated accessories have been very satisfying since the new kits were launched in July. In Motorsports, the PUMA partnered Mercedes AMG Petronas F1 team showed that they are truly Forever Faster, sealing the 2014 Constructor s Championship with 3 races to go and thereby confirming their status as the fastest team in the world s fastest sport. It has been a superb season for the team, with Lewis Hamilton and Nico Rosberg dominating the sport. PUMA has also extended its partnership with BMW Motorsport as the Official Supplier of Team and Racewear for all BMW Motorsport racing operations. With a relationship dating back to 2004 when PUMA first partnered the BMW Williams Formula One team, BMW Motorsport is PUMA s longest standing partner in Motorsport and remains a core part of our Sports Marketing portfolio.
 by acquiring 4,600,000 shares of the club, representing 5.")


6 - 6 - Sales and Earnings Development Global Brand Sales Worldwide PUMA brand sales - comprised of consolidated and licensed sales - increased by 6.1% currency adjusted to 893 million in the third quarter of In the first nine months of 2014, brand sales increased by 2.3% currency adjusted to 2,355 million. THIRD QUARTER 2014 Consolidated Sales Sales increase PUMA s 2014 third quarter sales performance was positive, as consolidated sales rose by 6.4% currency adjusted to 843 million. This represents an increase of 3.7% in Euro terms, as continuing currency effects from various countries had a negative impact on sales. Sales performance stronger in all regions and markets in Q3 Sales in the EMEA region increased by 4.4% currency adjusted to 388 million. Performance improved in Western Europe, notably in Germany, where the new Borussia Dortmund jerseys were well received, as well as Switzerland and France, as sales of Teamsport and Lifestyle products rose. Sales increased by 6.3% currency adjusted to 265 million in the Americas, as North America continued to benefit from improved wholesale business, including key account initiatives like the PUMA Labs at Foot Locker. Sales in Latin America also rose, supported by a strong Teamsport business within the region. Asia/Pacific sales increased by 10.7% currency adjusted to 191 million due to growth in all key markets, including India, China, Korea and Japan. This growth was supported by the successful start of the Forever Faster brand campaign, the positive reception of PUMA s new Arsenal jerseys and a strong Accessories business. All product segments positive Third quarter Footwear sales rose by 2.0% currency adjusted to 374 million as Teamsport sales, particularly the PUMA evospeed boot, continued to improve. PUMA s third quarter Apparel sales rose by 11.4% currency adjusted to 323 million, supported by strong demand for our Teamsport products, especially Arsenal jerseys and kit. Accessories sales also improved by 7.5% currency adjusted to 147 million due to continued demand for socks and bodywear. However, Golf equipment sales declined in the quarter as the golfing environment remained very weak.


7 - 7 -
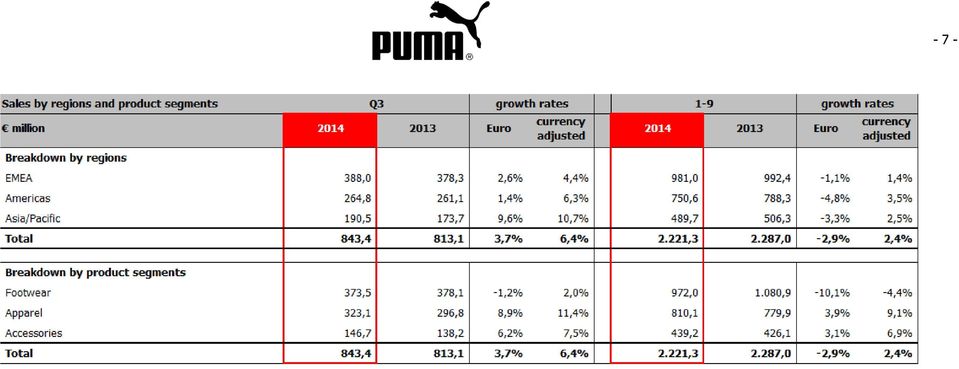


8 - 8 - Gross Profit Margin Gross profit margin lower PUMA s gross profit margin declined from 47.1% to 46.3% for the third quarter of 2014 on the back of adverse currency impacts as well as shifts within the product mix which influenced the margin negatively. In addition, stronger sales in our distribution business within Latin America, particularly in Footwear, led to a decline in the Footwear margin from 44.4% to 41.9%. Apparel margin decreased slightly from 49.9% to 49.6%. However, the margin for Accessories improved from 48.6% to 50.3%. Operating Expenses OPEX increased PUMA s operating expenditures increased as expected in the third quarter, from 309 million to 349 million, due to the higher marketing expenditures associated with the Arsenal partnership and the launch of the Forever Faster brand campaign ahead of the back-to-school season. EBIT Operating Result (EBIT) decreased The decline in PUMA s operating result (EBIT) from 80 million to 46 million in the third quarter of 2014 is mainly due to significantly higher marketing expenditures within the OPEX. Financial Result / Income from Associated Companies The financial result improved from -1.5 million to -0.7 million in the third quarter. The result remained negative due mainly to currency conversion impacts. Net Earnings PUMA s consolidated net earnings declined from 53 million to 29 million. As a result, earnings per share decreased from 3.53 to 1.93 in the third quarter of the year. NINE MONTHS 2014 Consolidated Sales Currency adjusted sales rose by 2.4% for the first nine months of the year to 2.2 billion. As currency volatility continued to have a negative impact in the third quarter, albeit to a lesser extent, nine month sales in Euro terms declined by 2.9%. Regional performances positive Currency adjusted sales in the EMEA region rose by 1.4% to 981 million, thanks to improvements in the United Kingdom and throughout Eastern Europe, the Middle East and Africa. Sales in the Americas increased by 3.5% currency adjusted to 751 million, with sales growth evenly spread over North America and Latin America. Asia/Pacific sales rose by 2.5% currency adjusted to 490 million, with positive performances throughout the region except in Japan, where the business climate in the first half of the year prevented a better result.


9 - 9 - Apparel and Accessories sales increased In terms of product segments, Footwear sales declined by 4.4% currency adjusted to 972 million in the first nine months of Sales in Apparel increased by 9.1% currency adjusted to 810 million, and Accessories sales also rose by 6.9% currency adjusted to 439 million. PUMA s Retail sales rose PUMA s own and operated retail sales for the first nine months of the year increased by 3.4% currency adjusted to 432 million, equal to 19.5% of total sales, as comparable sales in our stores improved during the period. Gross Profit Margin Gross Profit Margin down slightly PUMA s nine month gross profit margin declined slightly to 47.2% due to negative impacts from currency/hedging. The decline in the Footwear gross profit margin from 44.9% to 42.9% was almost offset by increases in the Apparel margin, from 49.6% to 50.4%, and in the Accessories margin, from 50.2% to 50.7%. Operating Expenses OPEX increase for the first nine months of the year PUMA s operating expenditure increased due to increased marketing costs associated with the launch of the Forever Faster brand campaign and the Arsenal partnership. However, tight control was maintained on all other areas of expenditure. OPEX rose by 3.7% from 911 million to 944 million compared to the same period last year. EBIT Operating Result (EBIT) lower Continued currency weakness in a number of countries had a negative impact on sales and gross profit. In addition, marketing spending increased due to our Forever Faster Campaign and new assets like Arsenal. As a result, PUMA s EBIT declined as expected from 190 million to 117 million for the first nine months of the year, equivalent to 5.3% of sales. Financial Result / Income from Associated Companies PUMA s financial result improved from -9.5 million to -5.2 million. The negative result was caused mainly by the impact of foreign currency fluctuations. Net Earnings Consolidated net earnings fell from 121 million to 69 million for the first nine months of 2014, with earnings per share declining from 8.07 to 4.59.

10 Net Assets and Financial Position Working Capital Focus on Working Capital continues PUMA retained its focus on working capital management in the third quarter. As a result, Inventories were broadly flat at 573 million and trade receivables increased by 4.6% to 547 million, in line with the sales growth. Cashflow / Capex PUMA s Free Cashflow (before acquisitions) moved from -75 million to -91 million for the first nine months of 2014, due to lower Earnings but supported by a much improved working capital position. Capital expenditure rose from 34 million to 48 million as PUMA continued to invest in the opening and refurbishment of selected retail stores, as well as office and IT equipment. Cash Position PUMA s Net Cash Position at the end of September 2014 declined slightly from 246 million to 231 million, also impacted by the payment for a 5.0% equity stake in Borussia Dortmund.

11 Outlook 2014 Global Economy The autumn forecast published on September 11, 2014 by the Kiel World Economic Institute (IfW) expects continued global economic growth next year. Momentum is, however, expected to remain moderate and therefore vulnerable for setbacks. The motor for this growth will be provided by developed economies, whereas momentum in emerging markets should remain muted. All in all, the experts of the IfW have lowered their forecast for world output growth by 0.4 percentage points to 3.2% for this year and by 0.3 percentage points to 3.7% in This forecast could still prove to be too optimistic should geopolitical tensions continue to escalate. Investments Investments totaling around 70 million are planned for The majority of these funds have been allocated to infrastructure investments which are necessary to help drive the sustainable growth, as well as the expansion of our core markets and selective investments in retail stores. Outlook continues to be a turnaround year for PUMA, where the brand will be re-established in the market place and brought back to a path of profitable and sustainable growth in the mid-term. To support this turnaround, PUMA will continue to invest strongly in marketing and sports assets as well as start investing in IT infrastructure, while maintaining tight control on other operating expenditures. Given PUMA s results through the first nine months of the year, we now expect a low single digit increase in currency adjusted net sales (previously flat) and a stable gross profit margin (previously slight increase) for the full year. As planned, OPEX will increase significantly based on increased Marketing investments throughout the second half of the year. PUMA s full year guidance for EBIT and Net Earnings (approx. 5% and 3% of net sales respectively) remains unchanged; we reiterate that the continued volatile currency movements will have a negative impact of around 50 basis points on the EBIT and Net Earnings margin for the year.

12 - 12 -


13 - 13 -


14 - 14 -


15 - 15 -


16 - 16 -

17 - 17 -


18 - 18 -

19 Notes to the Financial Report for the first nine months of 2014 GENERAL REMARKS Under the PUMA brand name, PUMA SE and its subsidiaries (the PUMA group ) are engaged in the development and sales of a broad range of sport and sportlifestyle products including footwear, apparel and accessories. The company s registered head office is in Herzogenaurach, Federal Republic of Germany; its responsible court of registration is at Fürth (Bavaria). PUMA is an affiliated company of the Kering Group and will be consolidated in the consolidated financial statements of Kering. ACCOUNTING STANDARDS The unaudited financial report of PUMA SE and its subsidiaries (which together form the PUMA group) was prepared according to IAS 34 Interim Financial Reporting and should be read in connection with the annual financial statements as of December 31, The consolidated financial statements details contained therein apply to the financial reports for 2014, unless changes have been explicitly referred to. The financial report corresponds to all committing standards and interpretations applied and explained in the annual financial statements as of December 31, This financial report is partly based on assumptions and estimates which have an impact on the amounts and on the breakdown of the reported assets and liabilities as well as of the revenues and expenses. The actual values may, in some exceptional cases, differ from these assumptions and estimates at a later date. The corresponding changes if and when they occur will be considered as soon as the findings are revised. SEASONAL VARIANCE The group s sales fluctuate with the seasons. Consequently, the sales and resulting earnings vary in the course of a year. EMPLOYEES Number of employees at the beginning of the period Number of employees at the end of the period Average number of employees EARNINGS PER SHARE ,982 11,290 10,866 10,697 10,695 10,680 Earnings per share are calculated according to IAS 33 by dividing the result for the period by the weighted average number of outstanding shares. The repurchased shares reduced the number of outstanding shares as well as diluted number of shares. In principle, outstanding stock options from the Management Incentive Program can result to a dilution of earnings per share Earnings per share Diluted earnings per share

20 DIVIDEND According to the Annual Shareholders Meeting on May 13, 2014, a dividend of 0.50 per share was approved for the fiscal year The dividend totaled 7.5 million and was paid to the shareholders beginning on May 14, SHAREHOLDERS EQUITY Subscribed Capital As of balance sheet date the subscribed capital amounted to 38.6 million, divided into 15,082,464 no par value shares. Treasury Stock The resolution adopted by the Annual General Meeting on April 20, 2010 authorized the company to purchase until April 19, 2015 its own shares to a value of up to ten percent of the share capital. The company did not add shares to the treasury stock during the first nine months. At the end of September, the company held a total of 142,551 shares. This represents 0.95% of the total subscribed capital. Development Number of Shares Number of shares at the beginning and at the end of the period Thereof own shares/treasury stocks Conversion of Management Incentives (issue of treasury stock) Shares outstanding at the end of the period ,082,464 15,082, , , ,939,913 14,939,692 Weighted average number 14,939,913 14,939,420 of shares, outstanding Diluted number of shares 14,939,913 14,940,598 RELATED PARTY TRANSACTIONS PUMA SE has taken on short-term financial liabilities of 40.0 million (prior year: 40.0 million) as a related party of the Kering-group as part of its financing activities. These liabilities are presented as other current liabilities that are not part of the working capital. OTHER OPERATING INCOME AND EXPENSES Other operating income and expenses includes 4.5 million income from the partial release of the restructuring provision. This release is related to the remaining affected restructuring provisions as of September 30, 2014, which were part of the errors totaling 11.0 million identified by the German Accounting Enforcement Panel (DPR) in their audit of PUMA s consolidated financial statements as of December 31, These errors are comprised of the planned relocation of inventories, the expected dual-rent payments related to the office relocation currently under negotiation, advisory costs related to the future conduct of the business and future expenses related to sailing sponsorship contracts. The difference of 6.5 million between the amount released and the errors identified by the DPR is due to provisions being either used ( 5.8 million) or released ( 0.7 million) in prior periods. These misstatements had no material effect on either the financial situation or the earnings position of the PUMA group in prior years and the current year. We have therefore corrected the misstatements in the current accounts.

21 SEGMENT REPORTING Segment reporting is based on geographical regions in accordance with the internal reporting structure. Sales and gross profit are shown according to the geographical region where the respective group company is located (head office). Intra-group sales are eliminated. Allocation of the remaining segment information is also determined on the basis of the respective group company s head office. The sum totals equal the amounts on the income statement or on the balance sheet, respectively. EVENTS AFTER THE BALANCE SHEET DATE There were no events after the balance sheet date which may have a material effect on the financial situation and earnings position as of September 30, Herzogenaurach, November 7, 2014 The Managing Directors
22 Managing Directors Bjørn Gulden (CEO, Chief Executive Officer) Stefano Caroti (CCO, Chief Commercial Officer) Michael Laemmermann (CFO, Chief Financial Officer) Lars Radoor Soerensen (since August 1, 2014) (COO, Chief Operating Officer) Andy Koehler (until July 31, 2014) (COO, Chief Operating Officer) Administrative Board Jean-François Palus (Chairman) François-Henri Pinault (Deputy Chairman) Thore Ohlsson Todd Hymel Michel Friocourt Jean-Marc Duplaix Bernd Illig Employees Representative Martin Koeppel Employees Representative Guy Buzzard Employees Representative
9132 81-0 email: investor-relations@puma.")
23 Financial Calendar FY 2014 February 20, 2014 Financial Results FY 2013 May 13, 2014 Annual Shareholders Meeting May 14, 2014 Financial Results Q1/2014 July 29, 2014 Financial Results Q2/2014 Published by PUMA SE PUMA Way 1 D Herzogenaurach Tel.: +49 (0) investor-relations@puma.com Internet: November 7, 2014 Financial Results Q3/2014 The financial releases and other financial information are available on the Internet at about.puma.com. Notes relating to forward-looking statements: This document contains forward-looking information about the Company s financial status and strategic initiatives. Such information is subject to a certain level of risk and uncertainty that could cause the Company's actual results to differ significantly from the information discussed in this document. The forward-looking information is based on the current expectations and prognosis of the management team. Therefore, this document is further subject to the risk that such expectations or prognosis, or the premise of such underlying expectations or prognosis, become erroneous. Circumstances that could alter the Company's actual results and procure such results to differ significantly from those contained in forward-looking statements made by or on behalf of the Company include, but are not limited to those discussed be above. PUMA PUMA is one of the world s leading Sports Brands, designing, developing, selling and marketing footwear, apparel and accessories. For over 65 years, PUMA has established a history of making fast product designs for the fastest athletes on the planet. PUMA offers performance and sport-inspired lifestyle products in categories such as Football, Running, Training and Fitness, Golf, and Motorsports. It engages in exciting collaborations with renowned design brands such as Alexander McQueen and Mihara Yasuhiro to bring innovative and fast designs to the sports world. The PUMA Group owns the brands PUMA, Cobra Golf, Tretorn, Dobotex and Brandon. The company distributes its products in more than 120 countries, employs more than 10,000 people worldwide, and is headquartered in Herzogenaurach/Germany. For more information, please visit
PUMA SE FINANCIAL REPORT. January - June of 2014
 PUMA SE FINANCIAL REPORT January - June of 2014 - 2 - CONTENT Key Figures 3 Interim Management Report - General Economic Conditions 4 - Strategy 4 - Sales and Earnings Development 5-8 - Net Assets and
PUMA SE FINANCIAL REPORT. January - March of 2014
 PUMA SE FINANCIAL REPORT January - March of 2014 - 2 - CONTENT Key Figures 3 Development of the PUMA Share Rebased Development incl. Trading Volume (Xetra) Interim Management Report 140 70 - General Economic
PUMA SE FINANCIAL REPORT. January - September of 2013
 PUMA SE FINANCIAL REPORT January - September of 2013 - 2 - CONTENT Key Figures 3 Interim Management Report - General Economic Conditions 4 - Strategy 4 - Sales and Earnings Development 5-8 - Net Assets
PUMA SE FINANCIAL REPORT. January March of 2015
 PUMA SE FINANCIAL REPORT January March of 2015 - 2 - CONTENT Key Figures 3 Interim Management Report - General Economic Conditions 4 - Strategy 4-5 - Sales and Earnings Development 6-8 - Net Assets and
PUMA SE FINANCIAL REPORT. January - June of 2013
 PUMA SE FINANCIAL REPORT January - June of 2013 - 2 - CONTENT Key Figures 3 Interim Management Report Development of the PUMA Share Rebased Development incl. Trading Volume (Xetra) - General Economic Conditions
PUMA s Second Quarter Sales in line with Guidance
 PRESS RELEASE PUMA s Second Quarter Sales in line with Guidance Herzogenaurach, July 24, 2013 2013 Second Quarter Facts Consolidated sales decline by 4.0% currency adjusted to 692 million Strong sales
First Quarter Sales Show Growth of PUMA
 PRESS RELEASE First Quarter Sales Show Growth of PUMA Currency effects weigh on reported margins Herzogenaurach, May 6, 2015 2015 First Quarter Facts Sales up by 4.4% currency-adjusted (+13.2% reported)
PUMA SE FINANCIAL REPORT. January September of 2015
 PUMA SE FINANCIAL REPORT January September of 2015 - 2 - CONTENT Key Figures 3 Interim Management Report 140 Development of the PUMA Share Rebased Development incl. Trading Volume (Xetra) 90 - General
Herzogenaurach, Germany, July 27, 2004 PUMA AG announces its consolidated nd
 P Quarter P Half-Year For immediate release MEDIA CONTACT: INVESTOR CONTACT: U.S.A.: Lisa Beachy, Tel. +1 617 488 2945 Europe: Ulf Santjer, Tel. +49 9132 81 2489 Dieter Bock, Tel. +49 9132 81 2261 Herzogenaurach,
Group Management Report for the Financial Year 2014
 Group Management Report for the Financial Year 2014 Overview 2014 PUMA Group Essential Information Commercial Activities and Organizational Structure Targets and Strategy Product Development and Design
F i r s t - h a l f r e s u l t s. 30 July 2014
 F i r s t - h a l f r e s u l t s 30 July 2014 Disclaimer This presentation does not constitute an offer of securities for sale in the United States of America or any other jurisdiction. Certain information
PUMA AG Rudolf Dassler Sport
 PUMA AG Rudolf Dassler Sport FINANCIAL REPORT January - September of 2010 -2- CONTENT Financial Highlights 3 Management Report Development of the PUMA Share Rebased Development incl. Trading Volume (Xetra)
Group sales stable on a currency-neutral basis Results significantly impacted by negative currency effects adidas Group confirms full year guidance
 For immediate release Herzogenaurach, May 6, 2014 First Quarter 2014 Results: Group sales stable on a currency-neutral basis Results significantly impacted by negative currency effects adidas Group confirms
FOSSIL GROUP, INC. REPORTS FOURTH QUARTER AND FISCAL YEAR 2014 RESULTS; Fourth Quarter Net Sales of $1.065 Billion; Diluted EPS Increases 12% to $3.
 FOSSIL GROUP, INC. REPORTS FOURTH QUARTER AND FISCAL YEAR 2014 RESULTS; Fourth Quarter Net Sales of $1.065 Billion; Diluted EPS Increases 12% to $3.00 Fiscal Year 2014 Net Sales Increase 8% to $3.510 Billion;
FOSSIL GROUP, INC. REPORTS THIRD QUARTER 2014 RESULTS. Third Quarter Net Sales Increase 10% to $894 Million; Diluted EPS Increases 24% to $1.
 FOSSIL GROUP, INC. REPORTS THIRD QUARTER RESULTS Third Quarter Net Sales Increase 10% to $894 Million; Diluted EPS Increases 24% to $1.96 Updates Full Year Guidance and Provides Fourth Quarter Guidance
Ahlers AG, Herford. ISIN DE0005009708 and DE0005009732 INTERIM REPORT
 Ahlers AG, Herford ISIN DE0005009708 and DE0005009732 I N T E R I M R E P O R T for the first six months of the 2006/07 financial year (December 1, 2006 to May 31, 2007) BUSINESS DEVELOPMENT IN THE FIRST
Group Management Report for the Financial Year 2015
 Group Management Report for the Financial Year 2015 Overview 2015 PUMA Group Essential Information Commercial Activities and Organizational Structure Targets and Strategy Product development and design
Report on the nine-month period ended July 31, 2004 WKN: 330 410 ISIN: DE0003304101
 GERRY WEBER International AG Report on the first nine months of 2003/2004 Report on the nine-month period ended July 31, 2004 WKN: 330 410 ISIN: DE0003304101 The GERRY WEBER share: While the stock market
FINANCIAL REPORT H1 2014
 FINANCIAL REPORT H1 2014 HIGH SPEED BY PASSION 02_Key Figures 03_Group Status Report 05_Consolidated Financial Statements 10_Notes 11_Declaration of the Legal Representatives 02 PANKL KEY FIGURES EARNING
Half year results 2011
 Half year results 2011 29 July 2011 Bert De Graeve, Chief Executive Officer Bruno Humblet, Chief Financial Officer Address by Bert De Graeve, Chief Executive Officer Introductory remark The consolidated
Makita Corporation. Consolidated Financial Results for the nine months ended December 31, 2007 (U.S. GAAP Financial Information)
") Makita Corporation Consolidated Financial Results for the nine months ended (U.S. GAAP Financial Information) (English translation of "ZAIMU/GYOSEKI NO GAIKYO" originally issued in Japanese language) CONSOLIDATED
Makita Corporation Consolidated Financial Results for the nine months ended (U.S. GAAP Financial Information) (English translation of "ZAIMU/GYOSEKI NO GAIKYO" originally issued in Japanese language) CONSOLIDATED
Consolidated Financial Results for the First Two Quarters of the Fiscal Year Ending March 31, 2016 (Japan GAAP)
") Consolidated Financial Results for the First Two Quarters of the Fiscal Year Ending March 31, 2016 (Japan GAAP) Name of Listed Company: Yokogawa Electric Corporation (the Company herein) Stock Exchanges
Consolidated Financial Results for the First Two Quarters of the Fiscal Year Ending March 31, 2016 (Japan GAAP) Name of Listed Company: Yokogawa Electric Corporation (the Company herein) Stock Exchanges
Consolidated Earnings Report for the Second Quarter of Fiscal 2011 [Japanese GAAP]
![Consolidated Earnings Report for the Second Quarter of Fiscal 2011 [Japanese GAAP]](/thumbs/39/20260573.jpg "Consolidated Earnings Report for the Second Quarter of Fiscal 2011 [Japanese GAAP]") Consolidated Earnings Report for the Second Quarter of Fiscal 2011 [Japanese GAAP] October 27, 2010 Company Name: KOITO MANUFACTURING CO., LTD. Stock Listing: First Section, Tokyo Stock Exchange Code Number:
Consolidated Earnings Report for the Second Quarter of Fiscal 2011 [Japanese GAAP] October 27, 2010 Company Name: KOITO MANUFACTURING CO., LTD. Stock Listing: First Section, Tokyo Stock Exchange Code Number:
Unaudited Financial Report
 RECRUITING SERVICES Amadeus FiRe AG Unaudited Financial Report Quarter I - 2015 Temporary Staffing. Permanent Placement Interim Management. Training www.amadeus-fire.de Unaudited Amadeus FiRe Group Financial
*See note 4 to our Summary Financial Information table below concerning our current operational and reporting structure
 INTERIM REPORT 1(39) Nokia Corporation Interim Report for Q1 2014 FINANCIAL AND OPERATING HIGHLIGHTS First quarter 2014 highlights for continuing operations*: Nokia s non-ifrs diluted EPS in Q1 2014 of
Statement by Kasper Rorsted Chairman of the Management Board Conference-Call August 12, 2015, 10.30 a.m.
 Statement by Kasper Rorsted Chairman of the Management Board Conference-Call August 12, 2015, 10.30 a.m. Welcome to our conference call. This morning you will have received our news release and our financial
CANON REPORTS RESULTS FOR FISCAL 1999
 February 14, 2000 CANON REPORTS RESULTS FOR FISCAL 1999 1. CONSOLIDATED RESULTS Millions of yen (except per share amounts) Actual Projected 1999 1998 Change(%) 2000 Change(%) Net sales 2,622,265 2,826,269-7.2
FOR IMMEDIATE RELEASE
 FOR IMMEDIATE RELEASE O-I REPORTS FULL YEAR AND FOURTH QUARTER 2014 RESULTS O-I generates second highest free cash flow in the Company s history PERRYSBURG, Ohio (February 2, 2015) Owens-Illinois, Inc.
W.W. Grainger, Inc. First Quarter 2015 Results Page 1 of 9
 W.W. Grainger, Inc. First Quarter 2015 Results Page 1 of 9 News Release GRAINGER REPORTS RESULTS FOR THE 2015 FIRST QUARTER Revises 2015 Guidance Quarterly Summary Sales of $2.4 billion, up 2 percent Operating
Consolidated Settlement of Accounts for the First 3 Quarters Ended December 31, 2011 [Japanese Standards]
![Consolidated Settlement of Accounts for the First 3 Quarters Ended December 31, 2011 [Japanese Standards]](/thumbs/37/17704792.jpg "Consolidated Settlement of Accounts for the First 3 Quarters Ended December 31, 2011 [Japanese Standards]") The figures for these Financial Statements are prepared in accordance with the accounting principles based on Japanese law. Accordingly, they do not necessarily match the figures in the Annual Report issued
The figures for these Financial Statements are prepared in accordance with the accounting principles based on Japanese law. Accordingly, they do not necessarily match the figures in the Annual Report issued
Statement by Kasper Rorsted Chairman of the Management Board Conference-Call November 11, 2015, 10.30 a.m.
 Statement by Kasper Rorsted Chairman of the Management Board Conference-Call November 11, 2015, 10.30 a.m. Welcome to our conference call today. As you will have seen, this morning we sent out our news
Aastra Technologies Limited First Quarter ended March 31, 2003
 Aastra Technologies Limited First Quarter ended March 31, 2003 AASTRA TECHNOLOGIES LIMITED MESSAGE TO OUR SHAREHOLDERS First Quarter ended March 31, 2003 To our Shareholders: Aastra Technologies Limited
GAP INC. REPORTS FOURTH QUARTER AND FISCAL YEAR 2014 RESULTS
 GAP INC. REPORTS FOURTH QUARTER AND FISCAL YEAR 2014 RESULTS Fourth Quarter 2014 Earnings Per Share Grew 10 Percent; Up 20 Percent Excluding Foreign Exchange Impact Fiscal Year 2014 Earnings Per Share
Financial Information
 Financial Information Solid results with in all key financial metrics of 23.6 bn, up 0.4% like-for like Adjusted EBITA margin up 0.3 pt on organic basis Net profit up +4% to 1.9 bn Record Free Cash Flow
How To Understand How Well-Run A Company Like Aerocean Does Well
 3 rd Quarter 2014 Earnings Conference Call Transcript Overview*: BDC reported 3Q14 consolidated revenues of $613.1M, income from continuing operations of $50.4M and diluted EPS from continuing operations
CENIT AG Systemhaus. Industriestraße 52-54 D-70565 Stuttgart Tel: + 49 711 7825-30 Fax: + 49 711 7825-4000 Internet: http://www.cenit.
 9 Months Report 2007 CENIT AG Systemhaus Industriestraße 52-54 D-70565 Stuttgart Tel: + 49 711 7825-30 Fax: + 49 711 7825-4000 Internet: http://www.cenit.de Investor Relations: ISIN:DE0005407100 Fabian
Management s Discussion and Analysis
 Management s Discussion and Analysis of Financial Conditions and Results of Operations For the quarter and six months ended June 30, 2012 All figures in US dollars This Interim Management s Discussion
Net income in the second quarter was 1.281 billion, compared to 538 million in the previous quarter and 578 million in the same quarter a year ago.
 Press Presse Prensa For the business and financial press Munich/Erfurt, April 25, 2002 Siemens in the second quarter (January 1 to March 31) of fiscal 2002 Net income in the second quarter was 1.281 billion,
Brunswick Earnings Conference Call Q3, 2015
 Brunswick Earnings Conference Call Q3, 2015 Helping Active People Live Active Lives Forward-Looking Statements Certain statements in this presentation are forward-looking as defined in the Private Securities
Ahlers AG, Herford. ISIN DE0005009708 and DE0005009732 INTERIM REPORT
 Ahlers AG, Herford ISIN DE0005009708 and DE0005009732 on the first nine months of fiscal 2005/06 (December 1, 2005, to August 31, 2006) BUSINESS DEVELOPMENT IN THE FIRST NINE MONTHS OF FISCAL 2005/06 According
Consolidated sales of 6,347 million euros, up 10% on a like-for-like basis (7% as reported)
") 14.18 Order intake surged 25% to 9.1 billion euros Sales came in at 6.3 billion euros, up 10% like for like (7% as reported) Operating margin (1) up 15% to 442 million euros, or 7.0% of sales Net income
14.18 Order intake surged 25% to 9.1 billion euros Sales came in at 6.3 billion euros, up 10% like for like (7% as reported) Operating margin (1) up 15% to 442 million euros, or 7.0% of sales Net income
Verifone Reports Results for the Second Quarter of Fiscal 2016
 Verifone Reports Results for the Second Quarter of Fiscal 2016 SAN JOSE, Calif. (BUSINESS WIRE) Verifone (NYSE: PAY), a world leader in payments and commerce solutions, today announced financial results
BMW Motorrad delivered more than 47,000 motorcycles from April to June its highest-ever quarterly figures.
 Media Information - Check against delivery - Statement Dr. Friedrich Eichiner Member of the Board of Management of BMW AG, Finance Conference Call Interim Report to 30 June 2015, 10:00 a.m. Ladies and
Intel Reports Second-Quarter Results
 Intel Corporation 2200 Mission College Blvd. Santa Clara, CA 95054-1549 CONTACTS: Mark Henninger Amy Kircos Investor Relations Media Relations 408-653-9944 480-552-8803 mark.h.henninger@intel.com amy.kircos@intel.com
Zebra Technologies Announces Record Sales for Second Quarter of 2006
 FOR IMMEDIATE RELEASE Zebra Technologies Announces Record Sales for Second Quarter of 2006 Vernon Hills, IL, July 26, 2006 Zebra Technologies Corporation (NASDAQ: ZBRA) today announced that net income
Travel24.com AG. Quarterly Report Q1 2015
 Travel24.com AG Quarterly Report Q1 2015 2 Selected Key Group Data January 1 - March 31 Change In thousands of euro 2015 2014 % Revenue 4,494 7,810-42 % EBIT 806 1,231-35 % Net profit 66 518-87 % Earnings
TO OUR SHAREHOLDERS DYNAMIC FIRST HALF YEAR
 HALF YEAR REPORT AS OF JUNE 30, 2015 TO OUR SHAREHOLDERS Patrik Heider, Spokesman of the Executive Board and CFOO The Nemetschek Group maintained its dynamic development from the first quarter of 2015
FOOT LOCKER, INC. REPORTS THIRD QUARTER RESULTS
 N E W S R E L E A S E FOOT LOCKER, INC. REPORTS THIRD QUARTER RESULTS Contact: Peter D. Brown Senior Vice President, Chief Information Officer and Investor Relations Foot Locker, Inc. (22) 720-4254 Third
9-MONTHS REPORT. Stable development of business in Q3 Lila Logistik confirms full-year forecast
 /08 9-MONTHS REPORT Stable development of business in Q3 Lila Logistik confirms full-year forecast Key figures for the first three quarters of 2008 in accordance with IFRS 01.01. 01.01. Change in Change
GrandVision reports 2.8 billion Revenue and 449 million EBITDA for 2014
 GrandVision reports 2.8 billion Revenue and 449 million EBITDA for 2014 Schiphol, the Netherlands 18 March 2015. GrandVision N.V. publishes Full Year and Quarter 2014 results. 2014 Highlights Revenue grew
Garmin Reports Best Quarter and Best Year in Company History, Announces Share Repurchase Program, Offers 2008 Guidance
 INVESTOR CONTACT: Polly Schwerdt Phone 913/397-8200 E-Mail investor.relations@garmin.com MEDIA CONTACT: Ted Gartner Phone 913/397-8200 E-Mail media.relations@garmin.com Garmin Reports Best Quarter and
Group Management Report for the Financial Year 2013
 Group Management Report for the Financial Year 2013 Overview 2013 PUMA Group Essential Information Commercial Activities and Organizational Structure Targets and Strategies Product Development and Design
Intel Reports Fourth-Quarter and Annual Results
 Intel Corporation 2200 Mission College Blvd. P.O. Box 58119 Santa Clara, CA 95052-8119 CONTACTS: Reuben Gallegos Amy Kircos Investor Relations Media Relations 408-765-5374 480-552-8803 reuben.m.gallegos@intel.com
Airbus Group Reports Improved Nine-Month (9m) Results 2014
 Results 2014") Airbus Group Reports Improved Nine-Month () Results Financial performance reflects operational progress, guidance confirmed Revenues increase four percent to 40.5 billion EBIT* before one-off rises 12
Airbus Group Reports Improved Nine-Month () Results Financial performance reflects operational progress, guidance confirmed Revenues increase four percent to 40.5 billion EBIT* before one-off rises 12
FRANKLIN ELECTRIC REPORTS RECORD SECOND QUARTER 2013 SALES AND EARNINGS
 For Immediate Release For Further Information Refer to: John J. Haines 260-824-2900 FRANKLIN ELECTRIC REPORTS RECORD SECOND QUARTER 2013 SALES AND EARNINGS Bluffton, Indiana July 30, 2013 - Franklin Electric
last page of this release. 3 Operating margin is calculated as operating income divided by net revenues.
 By: EARNINGS RELEASE Expeditors International of Washington, Inc. 1015 Third Avenue, Suite 1200 Seattle, Washington 98104 CONTACTS: R. Jordan Gates Bradley S. Powell President and Chief Operating Officer
ROFIN-SINAR REPORTS RESULTS FOR THE FIRST QUARTER OF FISCAL YEAR 2016
 - PRESS RELEASE - Contact: Katharina Manok ROFIN-SINAR 011-49-40-733-63-4256 - or - 734-416-0206 ROFIN-SINAR REPORTS RESULTS FOR THE FIRST QUARTER OF FISCAL YEAR 2016 Quarterly earnings per share increased
Media Contact: Mike Conway Director, Corporate Communications Sherwin-Williams Direct: 216.515.4393 Pager: 216.422.3751 mike.conway@sherwin.
 The Sherwin-Williams Company Reports First Quarter 2012 Financial Results Consolidated net sales increased 15.1% to a record $2.14 billion Diluted net income per common share increased 50.8% to a record
Delta Galil Reports 2016 First Quarter Results
 Delta Galil Reports 2016 First Quarter Results Sales Rise to $256.7 Million; Net Income to Shareholders is $7.9 Million Reaffirms 2016 Guidance; Sales Expected to Reach $1,090 Million-$1,110 Million and
Corporate Communications. Media Information 5 November 2013. - Check against delivery - Ladies and gentlemen, Good morning from my side as well.
 - Check against delivery - Statement Dr. Friedrich Eichiner Member of the Board of Management of BMW AG, Finance Conference Call Interim Report to 30 September 2013, 10:00 a.m. Ladies and gentlemen, Good
Nokia Conference Call Third Quarter 2004 Financial Results. Jorma Ollila Chairman and CEO Rick Simonson Senior Vice President and CFO
 Nokia Conference Call Third Quarter 2004 Financial Results Jorma Ollila Chairman and CEO Rick Simonson Senior Vice President and CFO Ulla James Vice President, Investor Relations October 14, 2004 15.00
Accenture Reports Third-Quarter Fiscal 2015 Results. -- Revenues of $7.8 billion, up 0.4% in U.S. dollars and 10% in local currency --
 Accenture Reports Third-Quarter Fiscal 2015 Results -- Revenues of $7.8 billion, up 0.4% in U.S. dollars and 10% in local currency -- -- EPS of $1.24 include a $0.06 non-cash pension settlement charge.
Press Conference on the Release of E.ON SE s Interim Report for the First Quarter of 2014
 Press Conference on the Release of E.ON SE s Interim Report for the First Quarter of 2014 Düsseldorf, May 13, 2014 Statement by: K l aus Schä f e r, CFO, E.ON SE Please check against delivery. Statement
Release no. 04 2014 Report on first quarter 2014 To NASDAQ OMX Nordic Exchange Copenhagen A/S
 Page 1/10 22 May 2014 for ROCKWOOL International A/S Today the Board of ROCKWOOL International A/S has discussed and approved the following report on first quarter 2014. Highlights Sales in first quarter
Fiscal Year Guidance Achieved Execution of Vision 2020 Begun
 Fiscal Year Guidance Achieved Execution of Vision 2020 Begun Joe Kaeser, President and Chief Executive Officer of Siemens AG We delivered the results we originally promised for fiscal 2014 and made substantial
Klöckner & Co SE. Q3 2014 Results
 Klöckner & Co SE A Leading Multi Metal Distributor Gisbert Rühl CEO Marcus A. Ketter CFO Results Analysts and Investors Conference November 6, Disclaimer This presentation contains forward-looking statements
Service Tax Planning - Expected Revenue Growth in FY 2015
 Munich, Germany, May 7, 2015 Earnings Release FY 2015 January 1 to March 31, 2015 Portfolio gains drive income»for business volume, we performed well in our markets. The profitability of our Industrial
adidas Group records stellar financial performance in Q3 2015 and raises full year guidance
 FOR IMMEDIATE RELEASE Herzogenaurach, November 5, 2015 Nine Months 2015 Results: adidas Group records stellar financial performance in Q3 2015 and raises full year guidance Major developments in Q3 2015
EARNINGS RELEASE FOR IMMEDIATE RELEASE EXPEDITORS REPORTS FOURTH QUARTER 2014 EPS OF $0.51 PER SHARE 1
 By: Expeditors International of Washington, Inc. 1015 Third Avenue, Suite 1200 Seattle, Washington 98104 EARNINGS RELEASE CONTACTS: R. Jordan Gates Bradley S. Powell President and Chief Operating Officer
METRO GROUP increases sales 2012 in a challenging consumer environment
 METRO GROUP increases sales in a challenging consumer environment Sales rose by 1.2% to 66.7 billion (adjusted for portfolio measures: +2.3%); EBIT before special items reached around 2.0 billion Operating
Consolidated Financial Statements for the Third Quarter of the Fiscal Year Ending March 31 st, 2016 (FY2016), Japan GAAP February 9 th, 2016
, Japan GAAP February 9 th, 2016") Consolidated Financial Statements for the Third Quarter of the Fiscal Year Ending March 31 st, 2016 (FY2016), Japan GAAP February 9 th, 2016 Company Name Tokyo Seimitsu Co., Ltd. Stock Listing: First Section,
Consolidated Financial Statements for the Third Quarter of the Fiscal Year Ending March 31 st, 2016 (FY2016), Japan GAAP February 9 th, 2016 Company Name Tokyo Seimitsu Co., Ltd. Stock Listing: First Section,
FUCHS PETROLUB SE The leading independent lubricants manufacturer of the world
 FUCHS PETROLUB SE The leading independent lubricants manufacturer of the world Dr. Alexander Selent, Vice Chairman & CFO Dagmar Steinert, Head of Investor Relations January 2014 The leading independent
GOLDMAN SACHS REPORTS THIRD QUARTER LOSS PER COMMON SHARE OF $0.84
 The Goldman Sachs Group, Inc. 200 West Street New York, New York 10282 GOLDMAN SACHS REPORTS THIRD QUARTER LOSS PER COMMON SHARE OF $0.84 NEW YORK, October 18, 2011 - The Goldman Sachs Group, Inc. (NYSE:
Summary of Consolidated Financial Statements for the Second Quarter of Fiscal Year Ending March 31, 2012 (Japanese GAAP)
") This document is a translation of the Japanese financial statements and is not in conformity with accounting principles of the United States. Summary of Consolidated Financial Statements for the Second
This document is a translation of the Japanese financial statements and is not in conformity with accounting principles of the United States. Summary of Consolidated Financial Statements for the Second
2015 Quarterly Report II
 2015 Quarterly Report II 2 Key data Eckert & Ziegler 01 06/2015 01 06/2014 Change Sales million 69.0 61.9 + 11 % Return on revenue before tax % 16 % 9 % + 87 % EBITDA million 15.6 9.7 + 61 % EBIT million
Net attributable income totaled 64.7million in first-half 2015 compared with 69.0 million in firsthalf
 HALF-YEAR RESULTS 2015 H1 2015: FURTHER STRONG GROWTH FOR COMMUNICATION AND SHIPPING SOLUTIONS Sales up 10.4%, or -1.1% organically 1 CSS activities: organic growth of 16.0% Current operating margin 2
FORACO INTERNATIONAL REPORTS Q3 2014
 NEWS RELEASE FORACO INTERNATIONAL REPORTS Q3 2014 Toronto, Ontario / Marseille, France Tuesday, November 4, 2014 Foraco International SA (TSX:FAR) (the Company or Foraco ), a leading global provider of
I am Takeshi Okazaki, Group Senior Vice President and CFO at Fast Retailing.
 I am Takeshi Okazaki, Group Senior Vice President and CFO at Fast Retailing. I would like to run through Fast Retailing Group s business performance over the full business year through end August 2013,
STONESOFT CORP. STOCK EXCHANGE RELEASE APRIL 28,2006 AT 9.00 AM STONESOFT CORP.'S INTERIM REPORT FOR JANUARY-MARCH 2006
 STONESOFT CORP. STOCK EXCHANGE RELEASE APRIL 28,2006 AT 9.00 AM STONESOFT CORP.'S INTERIM REPORT FOR JANUARY-MARCH 2006 The sales of StoneGate products increased by 12 % during the first quarter. SUMMARY
FINANCIAL SUMMARY. (All financial information has been prepared in accordance with U.S. generally accepted accounting principles)
") FINANCIAL SUMMARY FY2015 First Quarter (April 1, 2014 through June 30, 2014) English translation from the original Japanese-language document TOYOTA MOTOR CORPORATION FY2015 First Quarter Consolidated
FINANCIAL SUMMARY FY2015 First Quarter (April 1, 2014 through June 30, 2014) English translation from the original Japanese-language document TOYOTA MOTOR CORPORATION FY2015 First Quarter Consolidated
650-527-5152 650-527-6273 SYMANTEC REPORTS FIRST QUARTER FISCAL YEAR 2016 RESULTS
 FOR IMMEDIATE RELEASE MEDIA CONTACT: INVESTOR CONTACT: Kristen Batch Sean Hazlett Symantec Corp. Symantec Corp. 650-527-5152 650-527-6273 kristen_batch@symantec.com sean_hazlett@symantec.com SYMANTEC REPORTS
2OO 6 9 MONTHS REPORT 2OO 7
 2OO 6 9 MONTHS REPORT 2OO 7 Hönle at a glance Hönle Group Figures 1) 2006/2007 2005/2006 Changes 9 months 9 months Income Statement T T in % Revenues 19,055 17,081 11.6 EBITDA 3,504 2,661 31.7 EBIT 3,005
Delphi Reports Third Quarter 2015 Financial Results
 Delphi Reports Third Quarter 2015 Financial Results GILLINGHAM, England - Delphi Automotive PLC (NYSE: DLPH), a leading global vehicle components manufacturer, today reported third quarter 2015 U.S. GAAP
HIGHLIGHTS FIRST QUARTER 2016
 Q1-16 EUROPRIS ASA 2 CONTENTS / HIGHLIGHTS FIRST QUARTER 2016 HIGHLIGHTS FIRST QUARTER 2016 (Figures for the corresponding period of last year in brackets. The figures are unaudited.) Group revenues increased
Consolidated Financial Review for the First Quarter Ended June 30, 2004
 Consolidated Financial Review for the First Quarter Ended August 9, 2004 Company Name: Head Office: Tokyo, Japan URL: Stock exchange listing: Tokyo Stock Exchange 1ST Section Code number: 6481 Representative:
QUARTERLY REPORT For the six months ended September 30, 2012 010_0774017502412.indd 2 2012/12/21 11:54:11
 QUARTERLY REPORT For the six months ended September 30, 2012 QUALITATIVE INFORMATION (1) Qualitative Information Relating to Consolidated Quarterly Operating Results During the first half of the fiscal
Interim report April-June 2003
 Interim report April-June 2003 Pre-tax profit for the second quarter amounted to SEK -34m, which is a SEK 30m improvement compared to last year (SEK -64m). Software revenue grew by 5% during the second
Interim Report First Quarter of Fiscal 2004
 s Interim Report First Quarter of Fiscal 2004 Introduction We prepare the Interim Report as an update of our Annual Report, with a focus on the current reporting period. As such, the Interim Report should
Ferrari posted a record Q3 2015 performance
 Ferrari posted a record Q3 2015 performance Shipments were 1,949 units, up 21% Net revenues were up 9% (3% at constant currencies) to Euro 723 million EBIT reached Euro 141 million, 610bps margin increase
THIRD QUARTER 2015 RECORD RESULTS REPORTED BY AMPHENOL CORPORATION
 Amphenol News Release World Headquarters 358 Hall Avenue P. O. Box 5030 Wallingford, CT 06492-7530 Telephone (203) 265-8900 FOR IMMEDIATE RELEASE For Further Information: Craig A. Lampo Senior Vice President
Second Quarter Highlights
 Kalamazoo, Michigan - July 23, 2015 - Stryker Corporation (NYSE:SYK) reported operating results for the second quarter of 2015: Second Quarter Highlights Raises full year organic sales growth guidance
Earnings Release Q3 FY 2015 April 1 to June 30, 2015
 Munich, Germany, July 30, 2015 Earnings Release FY 2015 April 1 to June 30, 2015 Solid performance, softening market environment»overall our businesses delivered solid underlying profitability despite
Sales increased 15 percent to $4.5 billion Earnings per Share increased 37 percent to $0.96 Operating Cash Flow increased 22 percent to $319 million
 Contact: Mark Polzin (314) 982-1758 John Hastings (314) 982-8622 EMERSON REPORTS RECORD FIRST-QUARTER 2006 RESULTS Sales increased 15 percent to $4.5 billion Earnings per Share increased 37 percent to
TRADING STATEMENT FINANCIAL YEAR 2014/15
 METRO GROUP TRADING STATEMENT FINANCIAL YEAR 2014/15 P. 1 TRADING STATEMENT FINANCIAL YEAR 2014/15 METRO GROUP achieves sales target and confirms EBIT guidance Like-for-like sales growth of 1.5% in financial
GERRY WEBER International AG Report on the first three months of 2005/2006 Report on the three-month period ended January 31, 2006 ISIN: DE0003304101
 GERRY WEBER International AG Report on the first three months of 2005/2006 Report on the three-month period ended January 31, 2006 ISIN: DE0003304101 The GERRY WEBER share Building on its excellent price
EARNINGS RELEASE FOR THE QUARTER ENDED SEPTEMBER 30, 2015
 21ST CENTURY FOX REPORTS FIRST QUARTER INCOME FROM CONTINUING OPERATIONS PER SHARE OF $0.34 AND FIRST QUARTER TOTAL SEGMENT OPERATING INCOME BEFORE DEPRECIATION AND AMORTIZATION OF $1.54 BILLION ON TOTAL
ANNOUNCEMENT OF FINANCIAL RESULTS. PANASONIC REPORTS THIRD QUARTER AND NINE-MONTH RESULTS - Sales downturn led to a decrease in earnings -
 FOR IMMEDIATE RELEASE Media Contacts: February 4, 2009 Investor Relations Contacts: Akira Kadota (Japan) Kazuo Sasaki (Japan) International PR Investor Relations (Tel: +81-3-3578-1237) (Tel: +81-6-6908-1121)
Diluted net income per share (Yen) 90.03 129.05. Net assets per share assets. Equity
 90.03 129.05. Net assets per share assets. Equity") Summary of Consolidated Financial Results for the Nine months Ended December 31, 2008 February 3, 2009 Listed company name : Sysmex Corporation Code : 6869 Listed stock exchanges : Tokyo Stock Exchange
Summary of Consolidated Financial Results for the Nine months Ended December 31, 2008 February 3, 2009 Listed company name : Sysmex Corporation Code : 6869 Listed stock exchanges : Tokyo Stock Exchange
Financial Results for the First Quarter Ended June 30, 2014
 July 28, 2014 Company name : Nissan Motor Co., Ltd. Code no : 7201 (URL http://www.nissan-global.com/en/ir/) Representative : Carlos Ghosn, President Contact person : Joji
INTERIM RESULTS ANNOUNCEMENT SIX MONTHS ENDED 28 AUGUST 2010
 12 October 2010 N Brown Group plc INTERIM RESULTS ANNOUNCEMENT SIX MONTHS ENDED 28 AUGUST 2010 N Brown Group plc, the internet and catalogue home shopping company, today announces its interim results for