EXTERNAL ECONOMIC SITUATION IN INDIA
|
|
|
- Bryan Dalton
- 7 years ago
- Views:
Transcription
1 EXTERNAL ECONOMIC SITUATION IN INDIA RECENT TRENDS AND POLICY IMPLICATIONS This paper reviews the status of the external sector of the Indian economy. It is divided into 5 broad sections. Section I gives the trends of imports and exports, as well as the composition and direction of external trade, since It also includes the latest available position of balance of trade and exchange reserves, exchange rate movement, the latest Export Import Policy and the recent trends in foreign investment. The strategy to be followed to promote exports and improve the balance of payments situation is also discussed in this Section. In Section II, some of the issues relating to the agreements under the WTO, their implications and areas of concern for India are discussed. Section III looks at the South-East Asian Crisis and its impact on India's trade prospects as well as the lessons that India can learn from the crisis. Section IV discusses the impact of sanctions after the nuclear tests in May, 1998 on the Indian economy. Finally, the recent developments in the world economy and issues relating to modifications in the architecture of the international monetary system in the context of changed global scenario are flagged in Section V. I. TRENDS IN IMPORTS AND EXPORTS 1.1 Imports The level of imports in the Indian economy trebled from nearly US$ 13.9 billion in to about US$ 41.9 billion in The value of imports for some major commodity groups is shown in Annexure 1. The fuel products (mainly petroleum) and machinery & equipment accounted for the bulk of the total imports of the country. These two categories accounted for a little less than half of the total imports in and their share has varied in the range of 38-53% of the total imports till , as may be seen from Table 1. The details on share of different commodity groups in total imports from to are given in Annexure 2. The other important items of imports have been chemicals, iron & steel, pearls, precious and semi- precious stones. In the recent years, there has been a spurt in the value of imports of gold and silver. In the country imported gold and silver worth nearly US$ 4.9 billion. This accounted for approximately 11.6% of the total DGCI&S imports. Table 1 : Share of Different Commodity Groups in Total Imports Commodity Group I Food & Allied Products of which Cereals Pulses Edible Oils II. Fuel of which Coal Petroleum Products III. Fertilizers IV. Chemicals V Machinery & Equipment (Incl. Project Goods) VI Iron & Steel VII Pearls Precs. & Semi- Precs. Stones VIII Gold & Silver IX Others TOTAL Source : Based on DGCI&S Database

2 Imports during were nearly US $ 42 billion, which is 0.9% higher than imports of US $ 41.5 billion during The growth was nearly 14.2% in rupees terms. The imports of POL declined by 21% in this period and these accounted for 15.4% of the total imports in as compared to 19.7% in Non POL imports increased by 6.3% in this period and formed 86% and 80.3% of the total imports in the two periods respectively. The reduction in the POL bill has occurred mainly due to a decline in the international prices of crude oil and products on account of excess oil inventories, new oil fields brought on stream and new technologies that helped to save production costs. Composition and Direction of Imports - Recent Trends The broad composition of imports during vis-à-vis is shown in Figure 1 based on Annexure 3. It reveals that the imports of almost all major commodity groups declined. However, there was an increase of 2.7% in export-related imports (comprising mainly textile yarn, fabrics and made-up articles, raw silk and wool, rubber, leather, chemicals, and pearls, precious and semi-precious stones), 56% increase in imports of bulk consumption goods and 54% increase in the import of gold and silver, Imports of pearls, precious and semi-precious stones which is mainly an export item, increased by 12.6% and those of non-metallic mineral manufactures by 10.7%. Imports of gold and silver increased by 53.9% in as compared to and it represented over 70% of the increase of total imports (DGCI&S). Increase in the import of rough diamonds, gold and silver, sugar, vegetable oils and project goods more than neutralised the entire increase in imports during over The spurt in the import of gold can be explained in terms of liberalisation of gold sector since October 1997 and on account of the shift in the recording of such imports from baggage route to the DGCI&S reporting system. To moderate these imports, the customs duty was enhanced from Rs.250 to Rs.400 per ten grams with effect from 5 th January, Imports of manufactures of metals, electrical machinery, electronic goods, project goods and professional instruments witnessed positive growth while those of machine tools, non-electrical machinery, computer software and transport equipment declined. Nearly half of India s imports in came from the OECD countries as compared to about 54% in and The share of Eastern European countries declined from 11% in to 7.8% in and further to 2.1% in The share of OPEC countries has in general tended to increase (17.4% in , 16.3% in and 23.1% in ) with some year to year fluctuations. Similarly, the share of other countries has also increased from 18% in to 22.5% in During , imports from top sixteen countries decreased by 1.7% and they accounted for 72% of imports by India in as against 79% in These countries are USA, Switzerland, Belgium, UK, Japan, Germany, Saudi Arabia, UAE, Malaysia, Kuwait, Australia, Singapore, Nigeria, Republic of Korea, Italy and China (See Figure 2). Trend of Growth in Imports vis-à-vis GDP The rate of growth of imports has been 8.8% in the period to If we divide this period into two sub periods i.e to (when the economic reforms process began) and to , the following trends emerged : The value of imports grew by 5% in to whereas it rose by over 13% in the second sub period. (It may be pointed out that in , severe curbs were imposed on the level of imports across the board which resulted in an overall decrease in imports by 18.8% in as compared to ). Pearls, precious & semi-precious stones, chemicals and machinery and equipment increased at a faster rate, compared to the overall average. It may also be observed that the growth rate in the second sub-period has been lower for pearls, precious & semi-precious stones; machinery and equipment and fertilisers. For all other commodity groups, the growth rate has been higher in the second sub-period vis-à-vis the first subperiod. Among the various factors that explain the higher growth in imports in the later period are the more liberal regime for imports and higher rate of growth of GDP in the second sub-period as compared to the first one. The GDP increased by 5.8% in the period to The growth rate of GDP in the sub period (i) and (ii) has been 5.2% and 6.5% per annum respectively. Also, the rate of growth of imports is compared to the rate of growth in the value added of the industrial sector. Figure 3 shows the trends of rates of growth of imports, GDP and value added in industrial sector. The performance in the industrial sector seems to have a clear bearing on the imports. Greater industrial activity is seen to be associated with higher growth in imports in the country.


3 The elasticity of imports with respect to GDP has been 1.5 in the period to It was close to unity in the period to and a little over 2 in to The details are shown in Annexure 4. It may, however, be mentioned that the elasticity is quite sensitive to the choice of the cut off year for the two sub-periods. In case is taken as the cut- off year (instead of ) the rate of growth of imports during to is 9.6% (against 5% seen earlier) and 7.8% in the second subperiod (against 13% earlier).the growth rate of GDP for these two sub periods is 5.9% and 5.6% respectively, resulting in the elasticity of imports with respect to GDP at 1.6 and 1.4 respectively. During the Ninth Plan, the imports are projected to increase by 10.8%. Oil imports are estimated to constitute about 22% of the total imports in as against the current level of about 15%. The greater dependence on oil imports to meet the growing needs of the economy is likely to put pressure on the balance of payments. This is more so in view of the recent increase in the prices of crude oil and petroleum products. The long-term elasticity ( ) of oil consumption with respect to GDP has been Even during the time period , it has been in the range of 1.10 to Assuming the same trend continues, the consumption of petroleum products will be increasing by 7.5% to 8% in the remaining years of the Ninth Five Year Plan. As a result, by the end of the Ninth Plan, the country may have to import nearly 75 million tonnes of crude oil and petroleum products and about million tonnes of coal, thus putting pressure on the balance of payments. I.2 Exports The level of exports increased from US $ 9.6 billion in to about US $ 33.7 billion in thereby representing an increase by nearly 3.5 times. The major commodity-wise break-up (in value terms) can be seen in Annexure 5. The share of agricultural products has been declining while manufactured exports have increased as may be seen in Table 2. Table 2 : Share of Certain Commodities in Total Exports (%) I Agri. & Allied, of which Tea Coffee Cashew nut Marine Products
.the growth rate of GDP for these two sub periods is 5.9% and 5.6% respectively, resulting in the elasticity of imports with respect to GDP at 1.")
4 II. Ores & Minerals III. Manufactured Goods, of which Leather & Leather Products Gems & Jewllwery Drugs, Pharmcutes & Fine Chemcls Dyes etc. & Coal Tar Chemcl Inorganic/ Organic Agro Chemcls Manufactures of Metals Machinery & Equipments incl. Machine Tools Electronic Goods Cotton Yarn, Fabrics, Madeups, etc Manmade Yarn, Fabrics, Madeups Ready Made Garments Handicrafts (Excl. Handmade Crpts) IV. Crude Oil & Petroleum Products V. Others TOTAL Source : Based on DGCI&S Database It may be observed that the share of tea has declined from over 6% in to the current level of around 1.6%. A similar trend has been observed in the category of ores & minerals in which the share has declined from 5-7% in the mid-eighties to about 2.6% in The share of manufactured goods increased from about 45-55% in the mid-eighties to nearly 3/4 th of the total exports at present. The details can be seen in Annexure 6. (It may be pointed out that the category "other" was about 25% in and it declined to 1-2% after This could be on account of different classification of the exports prior to ). Exports during are estimated to be around US $ 33.6 billion, as compared to 35 billion in , representing a decline of 3.8%. This poor performance in exports is attributed to both domestic and external factors. The domestic factors include infrastructural constraints, high transaction costs, certain restrictive policies for small scale sector, inadequate standardised quality products. On the external side, there has been a slow down in the global trade that began in 1996 and continued to decelerate in 1997 and 1998 (more details in a separate section later). Slump in the world trade has led to imposition of protectionist measures (mainly in the form of non-tariff barriers by developed countries including stringent requirements of quality, testing and labelling and using investigations related to dumping and subsidies). This had an adverse impact on our exports, particularly those of textiles, engineering items, chemicals, pharmaceuticals, agricultural and marine products. Composition and Direction of Exports - Recent Trends The OECD countries account for over half of India s exports. The share of these countries in total exports increased from 50.8% in to 55.7% in The share of East European countries, on the other hand, registered a continuous decline from about 21% in to about 3% in The share of other countries has increased to about 31% in as compared to 20.5% in The Asian countries accounted for the bulk (21%) in this group. Their share increased consistently till However, in the wake of the Asian crisis, their share declined in More on this in a later section. The broad composition and direction of exports during may be seen in Figures 4 and 5 and Annexure 7. It may be seen that there has been a decline in exports of almost all major commodity groups except gems and jewellery, ready made garments and handicrafts which recorded an increase of 10.4%, 14.6% and 19% respectively. Exports of some agricultural products like tea, rice (other than basmati), manufactured tobacco, guergum meal and processed vegetables also registered some increase.
 1.2 1.2 1.5 1.9 IV. Crude Oil & Petroleum Products 1.9 2.9 1.6 0.3 V. Others 24.8 1.7 1.3 2.6 TOTAL 100.0 100.")
5 Trends in Growth of Exports vis-à-vis GDP The rate of growth of exports has been 10.5% in the period to With a negative growth in exports in , the growth rate for the period to declined to 9.4%. The trends in the annual rate of growth of exports are shown in Annexure 8. There are year to year fluctuations, with negative rate of growth in 4 of these 14 years. If we divide this period into two sub-periods as has been done in the case of imports; the rate of growth works out to 9.5% and 9.3% for the period to and to respectively. Overall, one observes two phases of high rate of growth of exports i.e. the period to and to The rate of growth has been higher in case of textiles, manufacture of metals and gems & jewellery. The trends in growth rates of exports (both in value & volume) and GDP are shown in Figure 6 (on page 13). It may be observed that the years of slower growth rate in the GDP have also, generally, been the years when the rate of growth of exports has declined. Unlike the imports, the elasticity of exports with respect to GDP has been fairly stable in these two sub-periods. The elasticity of exports with respect to GDP has been 1.82 in the period to It has been 1.83 and 1.81 for the two sub-periods, i.e to and to respectively. There has been a slowdown in the rate of growth of value of exports since One of the reasons for this decline, is the reduction in the international prices of various commodities. According to the World Economic Outlook of the IMF, May 1998, the world prices of manufactured goods have declined by nearly 14% in the years The performance of exports in volume terms has been fairly robust in the last few years as compared to the value of exports. A reduction in the global GDP growth rates as well as the slowdown in world trade in the last 2 years, coupled with certain non-trade barriers by several countries also had an adverse impact on India s exports. The price competitiveness of exports (as reflected by the Real Effective Exchange Rate) also has an impact on the volume of trade. Joshi and Little (1994) have pointed out that "periods of rapid exports growth were associated with real exchange rate depreciation while periods of slow exports growth were associated with real exchange rate appreciation." Although the period Joshi and Little refer to is prior to the reforms, their observation is all the more relevant after 1993 when the unification of exchange rate made the rupee convertible for current account transactions. Table-3 gives the ten country REER of the Rupee with as the base. Table 3 : Trends in REER of Rupee

6 Source : RBI, Report on Currency & Finance, As indicated earlier, the slow down in the growth rate of exports occur in the years following , when there is an increase in the REER (indicating appreciation) and thereby affecting the competitiveness of the Indian exports Movement of Exchange Rate in the Recent Period After reasonable stability for a period of about eighteen months, the exchange rate of the rupee against the US dollar came under downward pressure intermittently since August However, from September 1998, the rupee appreciated slightly until November 1998, then depreciated in December and again witnessed marginal appreciation in January and February At the end of April 1999, the exchange rate was 42.43, recording a cumulative depreciation of about 6.9% from Rs level during the end of March Indices of real effective exchange rate (REER) and nominal effective exchange rate (NEER) of the Indian rupee have been indicated in Annexures 9 and 10. It may be observed that the trade-based REER broadly moved in consonance with the trade-based NEER. The REER continued to appreciate till October 1997 when. the conditions in South-East Asian economies also affected the Indian economy adversely. Also, there has been positive inflation differential in India compared to its major trading partners which also had its impact on the trends in REER. In nominal terms, the depreciation in rupee since the beginning of the Asian crisis in July 1997, has been quite modest as compared to some of the other Asian countries. During July 1997 to January 1999 the depreciation has been 73% for Indonesian Rupiah, 33% for Malaysian Ringgit, 31% for Philippines Peso, 30% for Thai Baht, 24% for South Korean Won as against a little over 15% for the Rupee. This seems to have also resulted in loss in competitiveness of the Indian exports vis-à-vis these countries and hence a slowdown. The process of globalisation of the Indian economy is irreversible and the opening of the economy has to be managed in a manner so as to derive maximum benefits from the world markets. The aim should be to strengthen the potential of Indian industry to compete effectively in the world markets. Though import tariff in India have been significantly reduced over time, they continue to be much higher as compared to other Asian and Latin American (developing) countries. Table 4 gives the import duties as % of imports for certain countries. Table 4 : Import Duties as percent of Imports (average for various Years) Argentina n.a Brazil n.a 6.23 n.a India Indonesia Malaysia Nepal Pakistan Republic of Korea Sri Lanka Thailand Turkey Source: F. Rodriguez and Dani Rodrik, Trade Policy and Economic Growth: A Sceptics Guide to the Cross National Evidence. Working Paper 7081, NBER, April, In this context, it is suggested that there is a need to bring about a phased reduction in the import tariff to bring them in line with other developing countries so that our industry becomes more competitive in the world market. It is further suggested that this, along with realistic market determined exchange rates could be helpful in reducing the costs of production and give an incentive to modernise industry. Simultaneously,

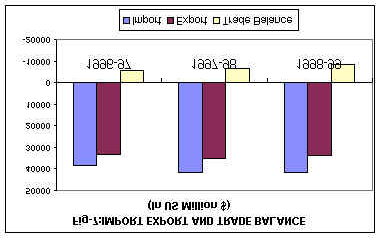
7 steps will have to be taken to strengthen the anti-dumping machinery to ensure that the domestic industry is not subject to unfair competition. It is obvious from the above that maintenance of balance of payments stability is of paramount importance and this will require achieving high rates of exports growth. The recent slowdown in the rate of growth of exports is a matter of concern and needs to be reversed at the earliest. Exchange rate is one important determinant of export performance and it is essential to ensure that the exchange rate remains supportive of the export effort and the developmental process simultaneously. Trade Balance and Foreign Exchange Reserves Our trade balance has consistently deteriorated after The trade deficit was US $ 1.1 billion in and it increased to US $ 6.5 billion in Even in , it continued to deteriorate. The trade deficit in was nearly US $ 8.3 billion (Figure 7). Despite the widening trade deficit, India s foreign exchange reserves have continued to increase. These were US $ 32.5 billion (comprising foreign currency assets, gold and SDRs) at the end of March, 1999 as compared to US $ 29.4 billion in March These reserves are sufficient to meet about 9 months of imports. I.3 The New Export Import (EXIM) Policy The Export Import Policy for the year was announced on 31 st March, The restrictions on imports have been further liberalised by bringing over 1300 items to the free and special import licence category. Import of 894 items including consumer goods, agricultural products and textiles has been made free and 414 items placed under special import licence. There is an effort to give a boost to exports. The annual advance licence system has been introduced to take care of imports required by exporters. Free trade zones (FTZs) are proposed to be established from 1 st July, 1999 to replace export processing zones and the FTZs will be treated outside the customs territory. The units in these zones will be allowed to undertake any manufacturing or trading activities and not be subjected to any pre-determined export obligation or value addition or other norms. The pre-export duty entitlement pass book scheme will allow credit entitlement up to 10% (as against 5% earlier) of the previous years export performance. Zero duty export promotion capital goods scheme has been extended to chemicals, plastics and textiles. Additional facilities have been provided for exports of gems and jewellery. Inspite of the policy initiatives for promotion of exports, it is imperative that there is continued effort to increase efficiency in the critical sectors viz. power, transport, ports, storage, processing and packaging, etc. to be able to push exports. Greater emphasis should be laid on areas with high export potential and improve competitiveness through vigorous R&D, quality upgradation and marketing strategy. This is all the more important to be able to achieve the Ninth Plan target of 11.8% growth in exports, especially in view of the slowdown in the global trade and output and with no significant improvement postulated during I.4 Foreign Investment Foreign direct investment (FDI) in India has increased from US $ 129 million in to US $ 3197 million in During , FDI was of the order of US $ 2062 million. India s share in global FDI flows to developing countries has risen to 2.2% in Portfolio investment which was just US $ 4 million in rose to US $ 3824 million in , and has since been fluctuating widely. It declined to US $ 1828 million in and deteriorated further to US $ (-) 61 million in India s share in net portfolio investment flows to the developing countries declined to 5.1% in 1997 after having increased to 8.7% in The decline in portfolio investment since is on account of both foreign institutional investment (FII) and the Global Depository Receipts (GDRs). Fresh inflows under FII declined from US $ 1926 million in to US $ 979 million in Further, there was an outflow of US $ 390 million during There has, however, been some buoyancy since April 1999, when there was an additional inflow of US $ 716 million till June 11, The GDRs raised during was US $ 645 million, which was less than half the amount raised in In it further declined to US $ 15 million. The poor performance of portfolio investment is a consequence of both enhanced risk perception in wake of the South East Asian crisis, and the depressed domestic capital market.

8 Foreign investment provides external resources which help not only to finance the balance of payments deficit but also provides critical access to technology and other types of know-how as well as potential linkages to the world market. It is important to encourage foreign investment as part of the process of modernisation and technological upgradation of our industry. The issue of liberalisation of capital account in order to increase our presence in the international market also needs careful consideration at this stage. Free access to capital from world sources would be advantageous but in a relatively poor developing country like ours, it could even be counter-productive as had been witnessed in South-. East Asian countries. The sudden outflow of the short term debts freely borrowed by banks and corporations in these countries led to a virtual currency crisis. In India, the status of the capital markets and more so the banking sector still requires better regulations. Hence until appropriate regulations, prudential norms and macro economic fundamentals are not in place, it may be considered imprudent to follow capital account liberalisation. I.5 External Debt India s stock of external debt stood at US $ million at end of September, 1998 (according to India's External Debt- Status Report, June, 1999). The share of multilateral and bilateral government borrowings declined from 44.4% in to 42.5% at end of December, On the other hand, non-government borrowings increased from 6.6% at end of March 1996 to 7.9% at end of December, The share of IMF declined from 4.3% in March, 1995 to 0.4% at end December, Share of commercial borrowings increased from 13.1% to 21.1% during this period. NRI & FC (B&O) deposits were12.6% in December, Short-term debt constituted 4.5% in March '95 and this declined to 3.8% at the end of December, The share of concessional debt declined from 45.3% to 39.3% during this period. External debt -GDP ratio declined to 23.8% March Debt service ratio was 19.4% in April-December Details are in Annexure 11 and it may be seen that the major indicators of external indebtedness have improved over time. The external debt situation in India vis-à-vis selected developing countries is important in view of the Asian financial crisis. The Table-5 examines certain external debt indicators for some of the Asian countries. Table 5 : External Debt Indicators: Selected countries in East & South Asia; 1996 EDT/XGS EDT/GNP DS/XGS CAB/GNP SEDT/RES CEDT/EDT SEDT/EDT India (-) Indonesia (-) S. Korea (-) Malaysia (-) Philippines (-) Thailand (-) China Bangladesh (-) Pakistan (-) Sri Lanka (-) Note : EDT : External Debt, XGS : Exports of Goods & Services, DS : Debt Service, CAB : Current Account Balance, CEDT : Concessional Component in External Debt SEDT : Short Term Debt Source: Derived from John Williamson: "Implications of the East Asian Crisis for Debt Management" in A. Vasudeva (Ed.), External Debt Management: Issues, Lessons & Preventive Measures, RBI, April It may be seen from above that, although India stands favourably, vis-à-vis most of the Asian countries (except China) on the external debt front, its ratio relative to export is high. Our external debt to GNP ratio was 28.3% in 1996 and the current account balance was (-) 1.4% of GNP. The short term debt nearly onefourth of the total exchange reserves and nearly 7% of the total debt. The relatively favourable position of external debt vis-à-vis other countries has been on account of continuous effort to optimally manage the external debt, so as to maintain a sustainable balance between maturity profiles and also limit the

9 interest/cost structure, with special emphasis on management of short term debt. However, the debt service to export ratio is higher than most other countries, except Pakistan and Bangladesh. This indicates the need for raising the growth rate of exports. II. INDIA AND THE WTO India is one of the founding members of the World Trade Organisation (WTO) since its inception on The participation in the WTO rule based system implies greater stability and predictability in the governance of international trade. Emerging from continued discussions in various multilateral forum, developmental issues along with trade are being increasingly focussed. Poverty concerns of developing countries along with development and trade policy are also being given cognisance. A recent high level symposium held in mid- March, 1999 on Trade and Development at the WTO noted the need for integration of trade policy with development strategies, increasing support to areas of finance and debt relief, importance of technology for development, improvement in market access for developing countries in sectors like textiles, clothing and agriculture and better access to dispute settlement mechanism for these countries. The issue of abuse of anti- dumping procedure, the problem of rules of origin criteria, technical barriers to trade, regional trading blocs, etc. were also considered. The Government of India has taken several steps to implement the commitments made under some of the agreements, particularly under the agreements on Tariffs and Quantitative Restrictions, Agriculture, Intellectual Property Rights, Trade Related Investment Measures, General Agreement on Trade in Services apart from others. Each of these are discussed briefly here. The other commitments are in the technical barriers to trade, social agenda covering labour standards and also environmental & phyto sanitary issues which require establishment of national standards and technical regulations within a transparent system. (a) Tariffs & Quantitative Restrictions As far as the agreement on tariffs and quantitative restrictions is concerned, the pattern and amount of tariff reductions towards the bound rate were related to base levels in member countries, and differed for Indian industrial and agricultural products. The base rate for industrial products was the rate prevalent on and included all duties and charges on imports. For agricultural products, the base rate was either the rate prevalent on , or a higher rate of tariff could be imposed for items on which a ceiling binding rate was applied. Safeguards were provided to the least developed countries and relaxation given while undertaking tariff reductions as per the prescribed schedules. This was mainly to meet temporary exigencies due to balance of payments difficulty or other country specific problems. Many developing countries are under one or other form of relaxation. India too was allowed to maintain quantitative restriction (QRs) as a special dispensation under the balance of payments cover (under article XVIII-b). Approximately 667 tariff lines at the HS 8-digit level in manufacturing and mining sectors still continue to be subject to import licensing restrictions as on 1 st April, It is, however, important to add that the validity of the balance of payments cover to India was contested by the USA and this was taken up by the Dispute Settlement Body (DSB) of the WTO. The IMF is the expert body to advise the DSB on this issue. In a recent ruling, the DSB panel has upheld the charge of the USA on the basis of the present level of India's foreign exchange reserves aggregating to over 30 billion. This interim panel report has been taken up by the Indian Government. Apart from questioning the basic definition of a `comfortable' balance of payments situation in India, it is suggested that there is a threat of immediate decline in reserves consequent to removal of restrictions, and there is a distinct possibility of getting into an external debt trap which would affect the development process. The Indian Government has already had to resort to medium term borrowings at commercial rates through Resurgent India Bonds amounting to over US $ 4 billion by December, Further, it is estimated that in case the quantitative restrictions are removed, the likely impact would be increase in imports of around US $ 13 to 18 billion (at prices). The Ninth Plan projections are based on the estimates of the impact equivalent to US $ 13 billion. Since the Plan projections have taken into account all available sources of financing, the balance of payments deficit with the steady increase in imports would lead to substantial decline in foreign exchange reserves and reach below the minimum recommended level. This would have an adverse impact on the growth of GDP during the Ninth Plan period and affect the development strategy itself. The Govt. of India has requested that the reduction in QRs may

10 be allowed in the six year time frame from 1997, and not immediately, as has been suggested in the panel report. In India, the tariff rates have been brought down substantially from the average rate of 128% in to 40% in , and 39.3% in The number of items under quantitative restrictions has also come down. The remaining are required to be phased out by the year At the same time, the applied tariffs on those commodities which are often seen to be considerably lower than the bound rates (ranging from 100 to 300 percent for agricultural goods and for non-agricultural goods 40% ad-valorem on finished and 25% on intermediate goods, machinery & equipment) are likely to change once tariffication of the remaining commodities takes place. On the other hand, even though tariff barriers in developed countries is relatively low, there are still "peaks" in tariff schedules in these countries on items like agriculture, textiles and clothing, which are of interest to developing countries like India and need to be reduced through negotiations. (b) Agriculture The Agreement on Agriculture is very complex and the commitments of member countries are in the field of market access, in terms of imports restrictions, domestic support to producers; and export subsidies. All farm activities can be subsidised under the agreement, and some of which can be provided support without any limit. These so called `green box' subsidies are deemed to be minimally trade distorting and include subsidies for research, pest and disease control, marketing, infrastructure, public stocking, etc. India is required to implement its commitments by the year As of now, no concrete commitments have been made regarding market access, reduction of subsidies or tariffs. Some of the aspects of the commitments are against the interest of developing countries like us. The minimum access for imports of primary goods by developing countries flouts the rule of free trade enshrined in the WTO agreements. The Government budgetary support for agriculture is subject to international discipline as the `green box' areas and certain export subsidies are required to be clearly identified to be permissible while the rest is actionable by the WTO. India and some other developing countries have been stressing the importance of food security. Even though domestic support measures are relaxed for the purpose of food security and PDS also allowed but only at market price to targetted population for developing countries. A large country such as India which has high percentage of poor population and also dependent on agriculture, it is not in a position to buy agricultural products in the international market. Moreover, support packages by developed countries under production-limiting programmes for retirement of producers, as well as resources employed for production of marketable surplus in the past is still beyond the purview of the subsidy discipline. This needs to be re-negotiated. Also, there is the issue of import access rights by agricultural exporters of developing countries who are restricted on grounds of phytosanitary regulations in developed countries. It is important that scientific phytosanitary standards are established at the international level so as to prevent protectionist measures by developed countries on this plea. (c) Trade Related Investment Measures The Agreement under Trade Related Investment Measures (TRIMs) primarily applies to trade of goods that takes place via trans national corporations (TNCs). These measures aim to protect conditions applied by domestic enterprises like purchase or use of products of domestic origin, volume or value of products of local production, export conditions, etc. The agreement does not cover restrictions by the Government on various performance criteria. India has notified the TRIMs maintained by it, which are required to be eliminated by This agreement has been resented at various levels since all controls on operations of TNCs are required to be removed and complete freedom granted globally, including some of the unfair trade and industrial practices adopted by several powerful multi-national companies. Related to this agreement, the OECD countries have tried to introduce the Multilateral Agreement on Investment which widens the scope of entry of foreign companies and the definition of FDI, more of which is seen later. (d) Trade Related Intellectual Property Rights

11 The Agreement on Trade Related Intellectual Property Rights (TRIPs) aims to provide returns for undertaking innovation by giving exclusive marketing rights. TRIPs establishes certain minimum standards concerning the availability, scope, use and enforcement of intellectual property rights to be extended transparently and non-discriminately. The agreement covers copy rights, trade marks, geographical indications, industrial designs, patents, lay out designs of integrated circuits and undisclosed information. India was required to enact the necessary legislation for revision in the Patents Act, 1970, before and only then registration will be administered by the trademark office. This is also important for protection of our products to be able to compete with other members of the WTO. The legislation to amend domestic Patent Laws have been passed so as to remain in conformity with our obligations under articles 70.8 and 70.9 of the TRIPs agreement. Under the TRIPs Agreement India has agreed to accept applications for product patents of pharmaceuticals and agro-chemicals from January 1, 1995 onwards. The applications will be received in a `mailbox' and will be examined only with effect from January 1, The agreement requires granting Exclusive Marketing Rights to pharmaceuticals and agro-chemicals which have been given product patents and marketing approval in another member-country of the WTO. It has been suggested that appropriate clause for dissemination of knowledge should be incorporated and ensure wider use of improved technologies and new products. Moreover, within the realm of geographical indication, there is need to negotiate rights to particular area specific names to include products like `basmati' rice, Darjeeling tea and certain traditional medicines made from turmeric, neem, etc. in TRIPS, as has been done for certain wines and spirits in UK, France, etc. (e) General Agreement on Trade in Services (GATS) The GATS allows member countries to take on obligations in sectors of their choice. India has made commitments in 33 activities while the average for all developing countries is 23 activities. Entry to foreign service providers is encouraged in areas where there is highest advantage in terms of capital flows, technology and employment. The issues which are of particular interest to India include those relating to movement of natural persons, particularly access to certain professional positions in developed countries, and trade in specialist services, apart from movement of skilled workers, telecommunications and financial services, tourism and travel services etc. Greater access to these service industries which are of importance to us, need to be included in the negotiations. (f) Multilateral Agreement on Investment (MAI) The other important issue of concern is regarding the Multilateral Agreement on Investment which is being introduced by the OECD over and above the Agreement on Trade Related Investment Measures under the WTO. The MAI is being promoted by the developed countries which have an overwhelming control on the flows of FDI (around 82% of the total FDI in 1996). The demand is based on the need to further consolidate opportunities for increased market access in the world. Foreign direct investment is seen to be complementary to trade and technology by the developing countries. At the same time, it is an important source for production internationally by TNCs. On this basis, the industrialised countries are taking an integrated view of trade in goods and services along with investment and technology and thus emphasising high level of multilateral disciplines in each of these areas so as to ensure increased market access for their enterprises around the world. The developing countries continue to be mainly recipients of FDI. Under the WTO, the agreement on Trade Related Aspects of Investment Measures (TRIMs) seeks to reduce and ultimately eliminate restrictions that several developing countries had imposed on TNCs. However, even before TRIMs had actually been implemented by most of these countries, the Organisation for Economic Cooperation & Development (OECD) took the initiative of introducing multilateral agreement on investment to provide better opportunities for investments by TNCs. The OECD initiative covers all direct investment transactions, whether by non-resident enterprises or by domestic enterprises under foreign control. Three fundamental principles form the basis of the OECD instruments, viz., right of entry and establishment, national treatment and freedom of repatriation both on capital and current accounts, with the ultimate objective of progressive liberalisation of policies to be carried out by member countries in respect of FDI. The focus has thus been towards shifting the obligations from the owners of capital i.e. of the industrialised world to the world of host countries and the instruments are sought to be made legally binding. It is expected that the obligations of the investors should be addressed by the national laws and regulations which are applicable to domestic and foreign investors alike, and subject to the country's international obligations. At

12 the same time, the inter-governmental agreements should be confined to the obligations and commitments of the signatory governments. This has implications on the developmental objectives that host country may want to address while inviting FDI and negotiating the multilateral agreement. The developing countries feel the need for selective and judicious intervention of the government to support domestic industry and technology creation so as to ensure a level playing field for domestic enterprises. These countries also employ an appropriate mix of incentives and performance requirements for FDI to achieve specific developmental objectives. It is in this background that the important features of MAI needs to be looked into in greater detail and view the proposed agreement of bringing the world under a legally secure, non-discriminatory and stable regime for foreign investment. III. THE SOUTH-EAST ASIAN CRISIS AND IT S IMPACT ON INDIA'S TRADE The South-East Asian countries were the most successful emerging economies in terms of sustained growth and gains in living standards for over three decades since the 1960s. These countries had become a model for many other developing countries. However, with gradual slow down in the markets in the industrialised world from the mid-1990s, there was not enough demand for products from South-East Asian countries. Over time there was excessive expenditure on creation of infrastructure and other forms of capital expenditure. There was greater concern on sustaining very high growth rate and inadequate attention was given to returns on the capital employed. The ICOR in these economies had increased. In Indonesia, it increased from 4.0 in to 4.4 in , and the corresponding ICOR for Korea was 3.5 and 5.1, Malaysia 3.6 and 5.0, Thailand 2.9 and 5.2, Philippines 3.3 and 6.0. It is some of these factors which are suggested to have led to the South-East Asian crisis beginning in July 1997 and continued to deepen through well into While the East Asian economies continued to achieve rapid economic growth in the 1990s, there were growing imbalances and weaknesses in these economies, both at the microeconomic and macroeconomic levels. Most importantly, there was a rapid build-up of short-term external debt along with a relatively weak financial system. This emerged from East Asia s successful track record which attracted foreign credits, and also from partial financial market liberalisation which opened new channels for foreign capital to enter these economies. The inflows led to appreciating real exchange rates along with a rapid expansion of bank lending. Governments maintained exchange rates either with very little variation (Malaysia, Thailand, the Philippines) or small, predictable changes (Indonesia, Korea). The central banks absorbed the risks of exchange rate movements on behalf of investors, which helped encourage capital inflows, especially with short maturity structures. As a result, the exchange rates appreciated in real terms. Real exchange rates appreciated by more than 25% in the four Southeast Asian countries between 1990 and early In Korea, the appreciation was about 12%. At the same time, the devaluation of the Chinese Yuan in January 1994, the competitive effects of Mexico s participation in NAFTA and the peso devaluation, and the world-wide glut in semi-conductor production resulted in slow down in the rate of growth of exports of East-Asian countries. The rising share of foreign borrowing was mainly in form of short-term debt, especially in Korea, Thailand, and Indonesia. Short-term debts to offshore banks in these three countries amounted to $68 billion, $46 billion, and $34 billion, respectively, at the end of Radalet and Sachs have suggested that these numbers in fact understate total short-term liabilities, since non-bank finance like bonds etc. are not included in this data. The table below gives the position of short-term debt as a proportion of foreign exchange reserve for some of the Asian countries. Table 6 : Short term debt as a Ratio of Foreign Exchange Reserves June 1994 June 1997 India Indonesia Korea Malaysia Pakistan Philippines Thailand Turkey Source: S. Radalet and J. Sachs : The East Asian Financial Crisis :

13 Diagnosis, Remedies, Prospects, HIID, April, In Thailand, Korea and Indonesia the three countries hardest hit by the crisis the ratio of short-term debt to foreign exchange reserves exceeded unity after This, though sustainable in principle, indicates excessive vulnerability to crisis situation with loss of market confidence, as also witnessed in these countries. The Role of Financial Sector in the East-Asian Crisis The financial system plays a critical role in the economy. When it operates properly, it channels funds from those who save surplus funds to those who need these funds to engage in productive investment opportunities. The major barrier to the financial system performing this job properly is asymmetric information, i.e. one party to a financial contract does not have the same information as the other party. There are two reasons why excessive risk-taking occurred after the financial liberalisation in East Asia. The first is that managers of banking institutions often lacked the expertise to manage risk appropriately when new lending opportunities opened up after financial liberalisation. Moreover, there was the inadequacy of the regulatory/supervisory system. In fact there was an implicit safety net provided by the government to bail out foreign and domestic lenders to the banks. This problem was made even more severe by the rapid credit growth in a lending boom which stretched the resources of the bank supervisors. Further, due to financial liberalisation, there were larger foreign capital flows into banks because it earned high yields. As a result, the capital inflows fuelled lending boom which led to excessive risk-taking on the part of banks. In East Asian countries such capital inflows amounted to between fifty to one hundred billion dollars annually from 1973 to The outcome of the lending boom arising after financial liberalisation was huge loan losses and a subsequent deterioration of bank s balance sheets. In the case of the East-Asian crisis countries, the share of non-performing loans to total loans rose to between 15 and 35 percent. Also, a large part of the domestic bank lending was used to finance real estate, property and other non-developmental activity. Table 7 gives the lending by banks and other financial institutions to different sectors of the economy in some of the East Asian countries. Table 7 : Loans and Advances by Sector (% Share) Indonesia Malaysia Philippines Rep. Of Korea Thailand Sectors Agri. &Mining Mfg Constn Tra&Tpt Fin.&Real Estate Service Industry HH.ConsCredit Others Source: Radalet and Sachs, 1998, op cit. All these factors resulted in the deterioration in the balance sheets of banking firms. This resulted in the inability of the banks to lend in order to improve their capital ratios. Deterioration in bank balance sheets resulted in currency crisis because it became very difficult for the central bank to defend its currency against a speculative attack. The currency crisis and the subsequent devaluation resulted in the financial crisis. As a result of currency devaluation, the debt burden of domestic firms increased. Since assets were typically denominated in domestic currency, there was no simultaneous increase in the value of firms assets. Therefore, devaluation

14 led to a substantial deterioration in firms balance sheets and a decline in net worth. The damage to balance sheets from devaluation in the aftermath of the foreign exchange crisis has been a major source of the contraction of the economies in East Asia. This mechanism was particularly strong in Indonesia which saw the value of its currency decline by over seventy-five percent, thus increasing the rupiah value of foreigndenominated debts by a factor of four. A sharp depreciation of the currency is also associated with upward pressure on prices which leads to a dramatic rise in both actual and expected inflation. A rise in expected inflation after the currency crisis exacerbates the financial crisis because it leads to a sharp rise in interest rates. The short duration of debt contracts along with higher interest rate leads to huge increases in interest payments by firms, thereby weakening firms cash flow position and further weakening their balance sheets. It is therefore clear that banks had many liabilities denominated in foreign currency which increased in value. The problems of firms and households meant that they were unable to pay off their debts, resulting in losses on the assets side of the banks balance sheets. The result was that banks balance sheets are squeezed from both the assets and liabilities side and the net worth of banks therefore declined. As Frederic Mishkin (1999); pointed out, ".. the East Asian financial crisis was the result of a systemic collapse in both financial and non-financial firm balance sheets that made asymmetric information problems worse. The result was that financial markets were no longer able to channel funds to those with productive investment opportunities which then led to devastating effects on the economies of these countries." The Impact of South East Asian Crisis on India The crisis resulted in a sharp contraction in domestic demand in these countries. This even led to contraction in world commodity trade. The growth in world exports declined from 9.9% in 1997 to 3.3% in 1998 and is expected to be 4.4% in 1999(World Economic Outlook, April, 1999). The Asian crisis was one of the main factors which led to slowing of the growth in world trade. Large declines in import volumes occurred in Asia in 1998 : imports of the "Asia 5 `` the five countries most affected by the Asian crisis (Indonesia, Korea, Malaysia, Philippines and Thailand) are estimated to have fallen by 22% and those of Japan by 7.5% in this time period. The South-East Asian crisis and the deteriorating economic situation in Japan have had spillover effects on financial markets in the industrial countries. The crisis also had an impact on India s exports to these countries. The crisis also adversely affected the international financial flows. Depreciation of the currencies of these countries as against the rupee has reduced India's export competitiveness. The depreciation of Indian rupee has been modest compared to East-Asian currencies. The cumulative depreciation of Indian rupee since July 1997 has been 15.7% by end-january 1999 as against a depreciation of 73.4% of the Indonesian Rupiah, 33.6% of the Malaysian Ringgit, and similarly with some of the other currencies of the region, as discussed earlier in Section I. Looking at India's export position during the year to China, Hongkong, Indonesia, Japan, Korea Peoples Republic, Malaysia, Philippines, Singapore and Thailand, it is observed that there has been a double digit decline. The decline was highest in the case of exports to Indonesia (57.3%), Korean Peoples Republic (41.3%) and Philippines (50.4%). Exports to these countries during comprised around 18% of the total DGCI&S exports as compared to about 24% during this period in Decline in foreign direct investment to US $ 2062 million in as against US $ 2511 million during The decline in portfolio investment to US $ -61 million in as against US $ 1828 million in is partly due to the financial crisis in South-East Asia which has affected foreign investment flows to all emerging market economies. Inspite of the situation faced by India due to the Asian crisis, it is important to note that India was able to protect itself from the whirlpool of crisis directly since the country is a small player in world trade viz., 0.7% of world exports (WTO, 1998). The dependence on short-term debts is limited although large short-term portfolio investment has been playing an important role in supplementing domestic savings in the growth process. The importance of financial sector reforms and role of Central bank needs to be underlined. There is also need for suitable regulatory framework in order to ensure symmetric information and timely remedial measures, as and when required for restoring market confidence. Also, good corporate governance and investment in productive activities wherein adequate returns are ensured is essential. Greater emphasis on growth in services sector instead of concentrating only on manufacturing sector would also go a long way in ensuring growth with distribution concerns.

15 IV. IMPACT OF SANCTIONS AFTER NUCLEAR TESTS After the nuclear tests undertaken by India in May 1998, sanctions were imposed against India by several countries, particularly the USA, UK, European Commission, Japan and others. The World Bank had put on hold sanction of new projects, although disbursement on ongoing projects have been allowed to continue while new projects relating to basic human needs was supported. The ongoing ADB projects have remained unaffected and only new projects relating to basic human needs continue to get support. The largest amount of assistance was affected by sanctions imposed by the USA. Under the Nuclear Proliferation Prevention Act, 1994 of the USA, all assistance in the form of credit and credit guarantees by US government was denied and included termination of all new export-import bank credits and credit guarantees for US exports to India and discontinuance of US Overseas Private Investment Corporations guarantees for foreign investment in India. The existing EXIM Bank loans were not affected. The US banks were not allowed to make any loans or credits to Government of India except for food or agricultural commodity purchases. All sales of defence articles, services and designs were terminated and licences cancelled for export of any item on US munitions list and other military financing. The ongoing scientific projects were subjected to clearance by the State Department. Also, trade embargoes were placed on a large number of commodities relating to defence and atomic energy. However, after diplomatic discussions, the US sanctions have been considerably relaxed, particularly relating to the operations of US EXIM Bank, Trade Development Agency Programmes, Overseas Private Investment Corporations apart from resumption of US bank activities and the military education and training programmes. The opposition by US to several loans by the multilateral financial institutions has been considerably relaxed. The Japanese aid for new projects continues to be frozen except for emergency humanitarian and grass root projects. In addition, Yen loans for new projects is frozen but support for ongoing projects is unaffected. As far as aid from UK is concerned, disbursement on ongoing projects are continuing and new projects are being sanctioned. The European Commission's disbursement for ongoing projects has been unaffected. France has not cut development aid. Germany has also continued funding ongoing projects. Although the 1998 German Aid Negotiations were cancelled, fresh commitment has been made for technical assistance projects to the tune of DM 22.5 million. Netherlands has frozen macro-economic aid which is mainly in the form of debt relief but grants to ongoing as well as future projects are not affected. There is no effect on development co-operation from Italy and Belgium. As far as Switzerland is concerned, there was reduction in the budget of approximately SFr 3 million and new programmes with Government of India were suspended except poverty alleviation and human rights programmes. Denmark reduced aid although ongoing projects were not affected. Norway decided to freeze all aid except those directed towards poverty alleviation programmes. Sweden terminated its current co-operation agreement with India although it allocated SEK 40 million towards social sector projects ending June On the whole, the sanctions did not have a major impact on the Indian economy. Most of the ongoing projects were allowed to be supported and developmental aid relating to poverty alleviation, basic human needs and grass rootprojects from the US, Japan, the EC countries have been allowed. Investments from the Scandinavian countries have, however, been restricted. V. The Recent Global and Economic Monetary Trends and the Modifications in the International Monetary System There has been considerable slowdown in the global GDP growth rates as well as in world trade during the last two years. The recessionary situation in the South-East Asian economies and Japan has worsened this. In addition, Russia has been facing severe economic problems. The Brazilian currency devaluation has also contributed to this down trend in the world economy, fall in world stock markets and commodity prices. To elaborate, the growth in world output has declined from 4.2% in 1997 to 2.5% in The prospects for 1999 are no better. As seen in Section III this led to sharp deceleration in world trade volume from 9.9% in 1997 to 3.3% in Since mid-april 1998, monetary authorities in most industrial countries have held short-term interest rates steady as the deflationary effects of the Asian crisis and its repercussions have helped to keep inflationary pressures well contained. The weakening of the commodity prices (oil: -5.4% in 1997 and 32.1% in 1998 and non-fuel : - 3.3% in 1997 and % in 1998, in terms of US dollars) has affected the commodity exporting countries, and led to deceleration in world economic activity (World Economic Outlook, IMF, ).

16 During this period, the Japanese economy also faced a recession as the output fell from 5% in 1996 to 1.4% in 1997 and then a decline of 2.8% in 1998 (IMF December, 1998). There has been stagnation of industrial production and investment and declining employment levels of private domestic demand. This is linked to difficulties in the financial sector as well as net exports demand with appreciation in yen. The Japanese government has attempted to stimulate private demand with fiscal packages although with limited success so far. The Brazilian crisis has also imparted a new contractionary impulses to the global economy. The growth projections for Brazil have been revised downwards, for There has been a sharp fall in industrial production as tight fiscal and monetary policy has been adopted. The cost of external finance is also higher and contributed to the adverse effect on real economy. The economy has also been affected by the recent fall in export earnings from soya, sugar, coffee and several manufactured items. In addition, Brazil s abandonment of the crawling-peg exchange rate system in January, 1999 and associated developments have added to the problems in the region. Financial sector fragility in several emerging market economies, including China, added to the risks associated with continued turbulence. In Russia, the delay in adopting coherent policies to promote stabilisation and reforms has postponed improvements in the economy. The Russian financial crisis, it may be recalled, emanated from the large fiscal deficit and the associated increase in holdings of Russian government debt by domestic and foreign investors. Series of domestic political events and external shocks, coupled with weak world oil prices in 1998 accentuated the problem. The government tried to extend the maturity structure of the debt in the context of an IMF programme. However, the market confidence could not be restored and selling pressures mounted in debt, equity and foreign exchange markets. Inspite of several measures by the government to further restructure the debt, the domestic banking system still faces severe liquidity crisis. Russia faces heavy external debt - service obligations which are at totally unaffordable levels and investors are sceptical of potential default. In many cases, the trading opportunities were reduced and institutional investors were even forced to sell-off other market securities for improved liquidity. This has also had an impact on the accessibility of emerging market economies to global financial markets. The conflict in the Federal Republic of Yugoslavia will have severe effects on small neighbouring countries and broader adverse consequences for other countries in South-East Europe. Japan s economy still remains rather weak. Global trade imbalances have increased by the series of emerging market crises, as well as by the uneven pattern of growth among the United States, the Euro area and Japan. There is an apprehension that these imbalances may give rise to destabilising movements in exchange rates and may also increase protectionist pressures, which would adversely affect the developing countries like India. Apart from these setbacks, there have been some positive developments in global trade. After the deep output contractions in Asia s crisis affected economies, activity has recently turned around in Korea and seems to have bottomed out in Malaysia and Thailand. Generally most of the advanced economies of North America and Europe and also Australia, have proved resilient. Particularly notable has been the continued strong growth of the US economy (3.9% each in the year 1997 and 1998). Developments in Brazil since early March 1999 have been encouraging, financial spillovers have been limited, and the slowdown seems unlikely to be prolonged. Japan s recession deepened further in late Indicators for early 1999 are mixed, and it remains unclear whether activity has stabilised, although survey evidence points towards a modest recovery in business confidence, and financial market developments suggest a turn around in investor sentiments. The revival of the East Asian economies is important for the world economy and also for India. Effort has been made by these countries to initiate recovery and restore confidence for investors. Korea and Thailand have made considerable progress in this regard. The situation in Indonesia is still difficult. Malaysia has attempted to control external payments in order to insulate its economy. Japan has experienced limited recovery in spite of substantial fiscal stimulus and initiatives to handle banking sector problems. The Chinese currency has been under pressure. The impact of these developments has adversely affected the confidence of the financial markets. There has been a sharp slowdown in capital inflows not only to South East Asian economies but also India. As seen earlier, portfolio investment to India went down from the peak of US $ 3824 million in to US $ 1282 million in and deteriorated further to US $ (-) 682 million during April-December The foreign direct investment (FDI) was US $ 3197 million and US $ 1562 million during April-December In the light of these developments, there has been a talk of bringing about a change in the way the International Monetary System operates and in particular, the role of IMF.

17 Modifications in the International Monetary System Originally, the mandate of the IMF was primarily to act as a lender of last resort to countries in distress and prevent competitive devaluation apart from encouraging current account convertibility. Later with the currency crises faced by many countries, the IMF has been rescuing these countries and also pushing for capital account convertibility. The IMF thus began to lend not only to combat trade deficits brought on by macro economic imbalances, but also to prevent currency contagion spread from one country into many others resulting from globalisation of finance. For instance, the Mexican crisis of 1994 affected most of Latin America, and more recently the virus spread from Thailand to many South-East Asian countries in It was in this background that need was felt for sketching out a new comprehensive framework for change in the international monetary system. The IMF Executive Board decided in April, 1998 to concentrate on five aspects for change in the international monetary system, viz., : (i) (ii) (iii) (iv) (v) Strengthening domestic finance sector including supervision and regulation of this sector, improvement in accounting practices to conform with international standards; establishment of independent central banks along with auditing and valuation of bank assets and guidelines for effective corporate governance. It was decided that the IMF would play an important role in surveillance activities and disseminating internationally agreed standards for regulation, and also encourage members to adopt best practices. Strengthening IMF surveillance in preventing crises. This would be achieved through intensifying IMF's surveillance of financial sector issues in collaboration with the World Bank, Bank for International Settlements, and the private sector. Greater attention would be paid to capital account liberalisation with appropriate sequencing and pace. The focus would be to prevent large reversal of capital flows, rapid accumulation of short term debts, excessive currency fluctuations, etc. Promoting greater availability and transparency of information on the economic situation and policy of member countries. The need for broadening the IMF's special data dissemination standards is being emphasized so as to make available timely data, increasing its coverage & accessibility to public and market participants. This would in turn help to increase dissemination of information on policy recommendations and encourage member countries to increase transparency of their policy. The IMF should play a central role in crisis management, co-ordinate assistance from different sources, and anticipate and prevent every crisis. It was decided that the IMF would play a catalytic role to co-ordinate timely technical and financial support from all sources. The world financial community should respond to balance of payments crises so as to ensure appropriate involvement of all groups of creditors including those from the private sector. The management of crises should help to prevent exposure of short term claimants to hazards of collapse of the financial system, which raise concerns about moral issues. It is suggested that the adjustment programmes should include continued involvement of private creditors through better use of information to analyse risks appropriately. These suggestions of the IMF are indeed important for the multilateral financial institutions in the changed world scenario. However, scepticism has been expressed on the prescriptions of the IMF while tackling the more recent crises. Need has been felt for greater sensitivity on the basic cause for the problems faced by individual countries rather than a blanket move for macro-economic stabilisation with additional multilateral funds, which anyway are dwindling. It has been suggested that some of the above mentioned `Strengthening' measures may not be useful enough to combat the crisis in a member country. It is important to first analyse the root cause of emergence & spread of the crisis. For instance, the South-East Asian crisis became widespread not because of macro-economic mismanagement but mainly due to poor credit appraisal and financial management. Later, the rampant spread of virus could have been curtailed by confidence building measures. It is suggested that the world monetary system should take due cognisance of these issues while prescribing appropriate remedial medicines to member countries. Prudential norms are required for short term capital flows. This would also help to prevent crises and restrain contagion. It has been suggested that capital account convertibility should be adopted after appropriate macro fundamentals and strong banking institutions are in place. In order to contain fall in growth of world output and avert the crises faced by several countries, it has been felt that an easier monetary policy in developed countries may help to contain world deflationary situation.

18 An effective programme needs to be worked out to build suitable safety nets for vulnerable countries. International assistance has to be forthcoming to reduce pressure on the creditor countries. In addition, the developed countries need to resist protectionist pressures in their countries and maintain an open international trading regime, which is fair to developing countries. In the above context, there is need to redefine the role of global financial institutions. The operational policies and procedures of these institutions are required to be reviewed. In fact, the IMF s intervention on almost all international trade issues have been questioned since it tends to override the expert opinions of various institutions like the ILO, UNEP, WHO and others, as the case may be. A credible mechanism for establishing prudential norms and monitoring of lending operations by international financial centres requires to be strengthened.

19 BIBLIOGRAPHY Asian Development Bank (1999), Asian Development Outlook, Das, B.L. (1998), The WTO Agreements, Deficiency, Imbalances and Required Changes; Third World Network, Malaysia. Dhar B. & Chaturvedi S. (1998), Multilateral Regime for Foreign Investment: An Assessment of the Emerging Trend, RIS Occasional Paper No. 52, RIS Fischer Stanley (1999), The Financial Crisis in Emerging Markets: Some Lessons, IMF. Government of India, Economic Survey, Various Issues, Ministry of Finance. Government of India, Foreign Trade Statistics of India, Various Issues, DGCI&S Government of India (1999), Ninth Five Year Plan, Vol. I, Planning Commission. Government of India (1999), India's External Debt, A Status Report, Ministry of Finance. International Monetary Fund (1998), Annual Report, Washington D.C. International Monetary Fund, World Economic Outlook, Various Issues, IMF, Washington D.C. Joshi V & Little I.M.D (1994), India: Macroeconomics and Political Economy , World Bank, Washington D.C. Krueger Anne.O. (1999), The Developing Countries and the Next Round of Multilateral Trade Negotiations, World Bank Working Paper No.2118; World Bank, Washington D.C. Mishkin, Frederic S. (1999). Lessons from the Asian Crisis, Working Paper 7102, NBER Working Paper Series. Radalet S. and Sachs J. (1998). The East Asian Financial Crisis: Diagnosis, Remedies and Prospects, Harvard Institute of International Development. Reserve Bank of India, Report on Currency & Finance, Various Issues Rodriguez F. & D. Rodrik: (1999): Trade Policy and Economic Growth; A Sceptics Guide to Cross National Evidence, Working Paper 7081, NBER Working Paper Series. Srinivasan T. N. (1998), India s Export Performance: A Comparative Analysis in I. J. Ahluwalia and I.M.D. Little (Ed.), India s Economic Reforms and Development, Essays for Manmohan Singh, Delhi, Oxford University Press. Williamson, John (1999), Implications of the East Asian Crisis for Debt Management, in A. Vasudevan (Ed.) External Debt Management : Issues, Lessons and Preventive Measures, RBI World Trade Organisation (1995), WTO Legal Text, WTO, Geneva World Trade Organisation (1998), Trade Policy Review India, Report by WTO Secretariat, Geneva. World Trade Organisation (1999), Background Note for the High Level Symposium on Trade and Development, held on March, 1999, Geneva.
, Ninth Five Year Plan, Vol. I, Planning Commission.")
20 Value of Imports for Major Commodity Groups Annexure-1 (US $ million) Commodity Group I Food & Allied Products of which Cereals Pulses Edible Oils II. Fuel of which Coal Petroleum Products III. Fertilizers IV. Chemicals V Machinery & Equipment (Incl. Project Goods) VI Iron & Steel VII Pearls Precs. & Semi- Precs. Stones VIII Gold & Silver IX Others TOTAL Source : Based on DGCI&S Database

21 Annexure 2 Percentage Share of Different Commodity Groups in Total Imports Commodity Group I Food & Allied Products of which Cereals Pulses Edible Oils II. Fuel of which Coal Petroleum Products III. Fertilizers IV. Chemicals V. Machinery & Equipment (Incl. Project Goods) VI. Iron & Steel VII. Pearls Precs. & Semi- Precs. Stones VIII. Gold & Silver IX. Others TOTAL
22 Commodity Group Annexure 2 Conld I Food & Allied Products of which Cereals Pulses Edible Oils II. Fuel of which Coal Petroleum Products III. Fertilizers IV. Chemicals V. Machinery & Equipment (Incl. Project Goods) VI. Iron & Steel VII. Pearls Precs. & Semi- Precs. Stones VIII. Gold & Silver IX. Others TOTAL Source : Based on DGCI&S Database
23 Annexure - 3 BROAD COMPOSITION AND MAGNITUDE OF IMPORTS DURING AND GROWTH S.NO. COMMODITY GROUP IMPORTS % SHARE IMPORTS % SHARE RATE (%) Rs. Crore Rs. Crore 1 Export related imports Bulk consumption goods Fertilisers Coal, coke and briquettes Petroleum crude and products Iron and steel Machinery, transport equipments, project goods and electronic goods Gold and silver Non-ferrous metals Others Total IMPORTS US $ million % SHARE IMPORTS US $ million Annexure 3 Concld... % GROWTH SHARE RATE (%) 1 Export related imports Bulk consumption goods Fertilisers Coal, coke and briquettes Petroleum crude and products Iron and steel Machinery, transport equipments, project goods and electronic goods Gold and silver Non-ferrous metals Others Total Source :Foreign Trade Statistics of India, March' 99.
24 Annexure 4 Rates of growth of Imports (Percent) I Commodity Group Food & Allied Products of which Cereals Pulses Edible Oils II. Fuel of which Coal Petroleum Products III. Fertilizers IV. Chemicals V Machinery & Equipment (Incl. Project Goods) VI Iron & Steel VII Pearls Precs. & Semi- Precs. Stones VIII Gold & Silver IX Others TOTAL GDP at prices (Rs. Crore)
25 I Commodity Group Food & Allied Products of which Cereals Pulses Edible Oils / / / II. Fuel of which Coal Petroleum Products III. Fertilizers IV. Chemicals V Machinery & Equipment (Incl. Project Goods) VI Iron & Steel VII Pearls Precs. & Semi- Precs. Stones VIII Gold & Silver IX Others TOTAL GDP at prices (Rs. Crore)
26 Value of Exports for Major Commodity Groups Annexure 5 US $ Million Commodity Group I Agri. & Allied, of which Tea Coffee Cashew nut Marine Products II. Ores & Minerals III. Manufactured Goods of which Leather & Leather Products Gems & Jewllwery Drugs, Pharmcutes & Fine Chemcls Dyes etc. & Coal Tar Chemcl Inorganic/ Organic Agro Chemcls Manufactures of Metals Machinery & Equipments incl. Machine Tools Electronic Goods Cotton Yarn, Fabrics, Madeups, etc Manmade Yarn, Fabrics, Madeups Ready Made Garments Handicrafts (Excl. Handmade Crpts) IV. Crude Oil & Petroleum Products V. Others TOTAL Source : Derived from DGCI&S Database
27 Percentage Share of Certain Commodities in Total Exports Annexure I Agri. & Allied, of which Tea Coffee Cashew nut Marine Products II. Ores & Minerals III. Manufactured Goods, of which Leather & Leather Products Gems & Jewllwery Drugs, Pharmcutes & Fine Chemcls Dyes etc. & Coal Tar Chemcl Inorganic/ Organic Agro Chemcls Manufactures of Metals Machinery & Equipments incl. Machine Tools Electronic Goods Cotton Yarn, Fabrics, Madeups, etc Manmade Yarn, Fabrics, Madeups Ready Made Garments Handicrafts (Excl. Handmade Crpts) IV. Crude Oil & Petroleum Products V. Others TOTAL Source : Derived from DGCI&S Database
28 BROAD COMPOSITION AND MAGNITUDE OF EXPORTS DURING AND Annexure - 7 S.NO. COMMODITY GROUP GROWTH EXPORTS % SHARE EXPORTS % SHARE RATE (%) Rs. Crore Rs. Crore 1 Agricultural & allied products Ores and minerals Leather and manufactures 3 including footwear of leather Gems and jewellery Chemicals and allied products Engineering and electronic goods 6 including computer software Iron and steel Yarn, fabrics, madeups etc Readymade garments Handicrafts Carpets Petroleum products Others Total EXPORTS US $ million % SHARE EXPORTS US $ million % SHARE GROWTH RATE (%) 1 Agricultural & allied products Ores and minerals Leather and manufactures 3 including footwear of leather Gems and jewellery Chemicals and allied products Engineering and electronic goods 6 including computer software Iron and steel Yarn, fabrics, madeups etc Readymade garments Handicrafts Carpets Petroleum products Others Total Source :Foreign Trade Statistics of India, March' 99.
29 I Rates of growth of Exports (Percent) Annexure 8 Agri. & Allied, of which Tea Coffee Cashew nut Marine Products / / / II. Ores & Minerals III. Manufactured Goods, of which Leather & Leather Products Gems & Jewllwery Drugs, Pharmcutes & Fine Chemcls. Dyes etc. & Coal Tar Chemcl Inorganic/ Organic Agro Chemcls Manufactures of Metals Machinery & Equipments incl. Machine Tools Electronic Goods Cotton Yarn,
30 Fabrics, Madeups, etc. Manmade Yarn, Fabrics, Madeups Ready Made Garments Handicrafts (Excl. Handmade Crpts) IV. Crude Oil & Petroleum Products V. Others TOTAL GDP at prices Rate of Growth in GDP over Previous year Elasticity of Exports with respect to GDP
31 Indices of Real Effective Exchange Rate (REER) and Nominal Effective Exchange Rate (NEER) of the Indian Rupee Annexure 9 Year Trade based Weights REER NEER (P) Notes: country bilateral weights 2. The indices from to are based on official exchange rate and from and onwards on FEDAI indicative rates. 3. P - Provisional Source: Report on currency & Finance &
32 Annexure 10 Indices of Real Effective Exchange Rate (REER) and Nominal Effective Exchange Rate (NEER) of the Indian Rupee Monthly Averages Year Month Trade based Weights REER NEER Base : 1985 = Jan Feb Mar Apr May Jun Jul Aug Sep Oct Nov Dec Jan Feb Mar Apr May Jun Jul Aug Sep Oct Nov Dec Jan Feb Mar Apr May Jun Jul Aug Sep Oct Nov
33 Dec Jan Feb Notes: country bilateral weights 2. The indices are based on FEDAI indicative rates. Source : RBI Bulletin, June,1999

34

35

36

37
38
TABLE 6.3 Exports of Selected South-East Asian Countries COUNTRY 1992 1993 1994 1995 1996 1997 @
 Merchandise Trade 14. The analysis in this section is based on the trade data provided by the DGCI&S. The ratio of foreign trade to GDP (in rupee terms), increased from 11.6 per cent in 1985-86 to 14.1
India's Foreign Trade Statistics
 India's Foreign Trade Statistics Each country tries to increase the availability of goods and services to its people through purchase from other countries. Similarly it tries to sell its surplus production
EXPORT-IMPORT BANK OF INDIA: Catalysing India s Trade and Investment. July 01, 2015
 EXPORT-IMPORT BANK OF INDIA: Catalysing India s Trade and Investment July 01, 2015 INDIAN ECONOMY SNAPSHOT PARAMETER FY 2010 FY 2013 FY 2014 FY 2015 GDP (current prices, US$ bn) 1365.4 1835.8 1875.9 2050.6
Impact of Global Financial Crisis on South Asia
 Impact of Global Financial Crisis on South Asia February 17, 2009 - The global financial crisis hit South Asia at a time when it had barely recovered from severe terms of trade shock resulting from the
World Manufacturing Production
 Quarterly Report World Manufacturing Production Statistics for Quarter IV, 2013 Statistics Unit www.unido.org/statistics Report on world manufacturing production, Quarter IV, 2013 UNIDO Statistics presents
Chapter-2. The Global Economic Situation and India s External Sector
 Chapter-2 The Global Economic Situation and India s External Sector Introduction Four years after the onset of the global financial crisis, the world economy continues to struggle. Whilst a weak global
World Manufacturing Production
 Quarterly Report World Manufacturing Production Statistics for Quarter III, 2013 Statistics Unit www.unido.org/statistics Report on world manufacturing production, Quarter III, 2013 UNIDO Statistics presents
Fifty years of Australia s trade
 Fifty years of Australia s trade Introduction This edition of Australia s Composition of Trade marks the publication s 50th anniversary. In recognition of this milestone, this article analyses changes
Business and Agricultural Loans
 Business and Agricultural Loans Business Loan Proposals Fund based business requirements. Non fund based business requirement. Classification of Loans based on Loan Pricing Sub-PLR (Prime Lending Rate)
THE RETURN OF CAPITAL EXPENDITURE OR CAPEX CYCLE IN MALAYSIA
 PUBLIC BANK BERHAD ECONOMICS DIVISION MENARA PUBLIC BANK 146 JALAN AMPANG 50450 KUALA LUMPUR TEL : 03 2176 6000/666 FAX : 03 2163 9929 Public Bank Economic Review is published bi monthly by Economics Division,
ECONOMIC ANALYSIS (Republic of the Marshall Islands: Public Sector Program)
") Public Sector Program (RRP RMI 43321-1) A. Summary ECONOMIC ANALYSIS (Republic of the Marshall Islands: Public Sector Program) 1. The Republic of the Marshall Islands (RMI) gross domestic product (GDP)
Public Sector Program (RRP RMI 43321-1) A. Summary ECONOMIC ANALYSIS (Republic of the Marshall Islands: Public Sector Program) 1. The Republic of the Marshall Islands (RMI) gross domestic product (GDP)
Negotiation of a Free Trade Agreement between Hong Kong and the Association of Southeast Asian Nations. Consultation Document
 Negotiation of a Free Trade Agreement between Hong Kong and the Association of Southeast Asian Nations Consultation Document INTRODUCTION The Government of the Hong Kong Special Administrative Region will
Monetary Policy in the Post-Crisis Period
 Monetary Policy in the Post-Crisis Period A. Hakan Kara Research and Monetary Policy Department EAF Conference October 10, 2011 Contents I. Changing View of Central Banking II. Capital Flows to Emerging
How To Understand Current Account Balance In Armenia
 CURRENT ACCOUNT: THE REGIONAL DEVELOPMENTS AND TRENDS Prepared by Armenuhi Burnazyan and Arevik Aleksanyan In our project we tried to analyze Current Account (CA) balance trends for Armenia, Georgia and
Economic Change in India
 Adam Cagliarini and Mark Baker* India has become an increasingly important part of the global economic landscape over the past decade. Its economy has become more open to international trade, its workforce
Further Developments of Hong Kong s Offshore RMB Market: Opportunities and Challenges
 Further Developments of Hong Kong s Offshore RMB Market: Opportunities and Challenges Zhang Ying, Senior Economist In recent years, as the internationalization of the RMB has been steadily carrying out,
Trends in Australia s Exports 1
 April 2 Trends in Australia s Exports 1 The reduction of trade barriers, and cheaper transportation and communication costs have contributed to Australia becoming more open and more closely integrated
X. INTERNATIONAL ECONOMIC DEVELOPMENT 1/
 1/ X. INTERNATIONAL ECONOMIC DEVELOPMENT 1/ 10.1 Overview of World Economy Latest indicators are increasingly suggesting that the significant contraction in economic activity has come to an end, notably
II. Merchandise trade
 II. Merchandise trade Merchandise trade increased by 5 per cent in volume in 211. The strongest momentum was achieved by trade in manufactured goods, which grew by.5 per cent. Key developments in 211:
Main trends in industry in 2014 and thoughts on future developments. (April 2015)
") Main trends in industry in 2014 and thoughts on future developments (April 2015) Development of the industrial sector in 2014 After two years of recession, industrial production returned to growth in 2014.
Main trends in industry in 2014 and thoughts on future developments (April 2015) Development of the industrial sector in 2014 After two years of recession, industrial production returned to growth in 2014.
18th Year of Publication. A monthly publication from South Indian Bank. www.sib.co.in
 To kindle interest in economic affairs... To empower the student community... Open YAccess www.sib.co.in ho2099@sib.co.in A monthly publication from South Indian Bank 18th Year of Publication SIB STUDENTS
General Certificate of Education Advanced Level Examination January 2010
 General Certificate of Education Advanced Level Examination January 2010 Economics ECON4 Unit 4 The National and International Economy Tuesday 2 February 2010 1.30 pm to 3.30 pm For this paper you must
Project LINK Meeting New York, 20-22 October 2010. Country Report: Australia
 Project LINK Meeting New York, - October 1 Country Report: Australia Prepared by Peter Brain: National Institute of Economic and Industry Research, and Duncan Ironmonger: Department of Economics, University
EXTERNAL DEBT AND LIABILITIES OF INDUSTRIAL COUNTRIES. Mark Rider. Research Discussion Paper 9405. November 1994. Economic Research Department
 EXTERNAL DEBT AND LIABILITIES OF INDUSTRIAL COUNTRIES Mark Rider Research Discussion Paper 9405 November 1994 Economic Research Department Reserve Bank of Australia I would like to thank Sally Banguis
INDIA S EXTERNAL DEBT AS AT END-DECEMBER 2014
 GOVERNMENT OF INDIA INDIA S EXTERNAL DEBT AS AT END-DECEMBER 2014 MINISTRY OF FINANCE DEPARTMENT OF ECONOMIC AFFAIRS EXTERNAL DEBT MANAGEMENT UNIT MARCH 2015 www.finmin.nic.in INDIA S EXTERNAL DEBT AS
The Macroeconomic Situation and Monetary Policy in Russia. Ladies and Gentlemen,
 The Money and Banking Conference Monetary Policy under Uncertainty Dr. Sergey Ignatiev Chairman of the Bank of Russia (The 4 th of June 2007, Central Bank of Argentina, Buenos Aires) The Macroeconomic
Lecture 2. Output, interest rates and exchange rates: the Mundell Fleming model.
 Lecture 2. Output, interest rates and exchange rates: the Mundell Fleming model. Carlos Llano (P) & Nuria Gallego (TA) References: these slides have been developed based on the ones provided by Beatriz
Caucasus and Central Asia: Oil Price Decline and Regional Spillovers Darken the Outlook
 Caucasus and Central Asia: Oil Price Decline and Regional Spillovers Darken the Outlook Economic activity in the Caucasus and Central Asia (CCA) will continue to decelerate in 215 mainly as a consequence
The EMU and the debt crisis
 The EMU and the debt crisis MONETARY POLICY REPORT FEBRUARY 212 43 The debt crisis in Europe is not only of concern to the individual debt-ridden countries; it has also developed into a crisis for the
CAN INVESTORS PROFIT FROM DEVALUATIONS? THE PERFORMANCE OF WORLD STOCK MARKETS AFTER DEVALUATIONS. Bryan Taylor
 CAN INVESTORS PROFIT FROM DEVALUATIONS? THE PERFORMANCE OF WORLD STOCK MARKETS AFTER DEVALUATIONS Introduction Bryan Taylor The recent devaluations in Asia have drawn attention to the risk investors face
Cross-Border Capital Flows Statistics and Its Implication for Monitoring in China
 First IMF Statistical Forum Statistics for Global Economic and Financial Stability Cross-Border Capital Flows Statistics and Its Implication for Monitoring in China Wang Xiaoyi State Administration of
Reading the balance of payments accounts
 Reading the balance of payments accounts The balance of payments refers to both: All the various payments between a country and the rest of the world The particular system of accounting we use to keep
IV. Special feature: Foreign currency deposits of firms and individuals with banks in China
 Robert N McCauley (+852) 2878 71 RMcCauley@bis.org.hk YK Mo (+852) 2878 71 IV. Special feature: deposits of firms and individuals with banks in China In principle, an economy with capital controls can
www.pwc.co.uk/economics Global wage projections to 2030 September 2013
 www.pwc.co.uk/economics Global wage projections to 2030 Summary: Wage gap between emerging and advanced economies will shrink significantly by 2030 By 2030, our projections in this report suggest that
MGE#12 The Balance of Payments
 MGE#12 The Balance of Payments The Current Account, the Capital Account and the Balance of Payments Introduction to the Foreign Exchange Market Savings, Investment and the Current Account 1 From last session
Currency Crisis in Thailand:
 Currency Crisis in Thailand: The Leading Indicators By Quan B. Lai Among the developing countries across the globe, those in Southeast Asia have experienced the most economic success within the last several
CONCEPT OF LIBERALIZATION, PRIVATIZATION AND GLOBALIZATION
 Foundation Course Semester 2 CONCEPT OF LIBERALIZATION, PRIVATIZATION AND GLOBALIZATION 9 Unit structure 9.0 Objectives 9.1 Concept of Liberalization 9.2 Concept of Privatization 9.3 Concept of Globalization
Recent Developments and Outlook for the Mexican Economy Credit Suisse, 2016 Macro Conference April 19, 2016
 Credit Suisse, Macro Conference April 19, Outline 1 Inflation and Monetary Policy 2 Recent Developments and Outlook for the Mexican Economy 3 Final Remarks 2 In line with its constitutional mandate, the
Have Recent Increases in International Cereal Prices Been Transmitted to Domestic Economies? The experience in seven large Asian countries
 Have Recent Increases in International Cereal Prices Been Transmitted to Domestic Economies? The experience in seven large Asian countries David Dawe ESA Working Paper No. 08-03 April 2008 Agricultural
Benchmarking Travel & Tourism Global Summary
 Benchmarking Travel & Tourism Global Summary How does Travel & Tourism compare to other sectors? Sponsored by: Summary of Findings, November 2013 Outline Introduction... 3 Summary of research structure..
Brief on Sri Lanka s Position on the Key Issues of the Hong Kong Ministerial Declaration
 Brief on Sri Lanka s Position on the Key Issues of the Hong Kong Ministerial Declaration While Sri Lanka shares most of the characteristics and concerns of a typical low income developing country it has
The Global Chemical Industry: US, China and Global Status and Opportunities, 2015
 The Global Chemical Industry: US, China and Global Status and Opportunities, 2015 August 28, 2005 American Chemical Society Martha Gilchrist Moore Moore Economics mmoore@mooreeconomics.com Opportunities
Competition based Industrial Policy. Outline. What is industrial policy? What is industrial policy? Framework for Industrial Policy
 What is industrial policy? Competition based Industrial Mari Pangestu Jakarta, May 3, 2005 Source of growth often thought to matter: indigenous vs. foreign Is it confined to industries/manufacturing? How
Sub-national Debt Management
 Sub-national Debt Management Indian Experience Alok Chandra Director, Ministry of Finance, India 27 June 2008 Structure Part A: Institutional Approaches to regulations of Sub-national Borrowings Part B:
Section 2 Evaluation of current account balance fluctuations
 Section 2 Evaluation of current account balance fluctuations Key points 1. The Japanese economy and IS balance trends From a macroeconomic perspective, the current account balance weighs the Japanese economy
Weiqiao Textile Announces its 2015 Interim Results
 Weiqiao Textile Announces its 2015 Interim Results Seize new opportunities in new normal development phase Continued leadership against the backdrop of industry changes Financial Summary Revenue was approximately
FEDERAL RESERVE BULLETIN
 FEDERAL RESERVE BULLETIN VOLUME 38 May 1952 NUMBER 5 Business expenditures for new plant and equipment and for inventory reached a new record level in 1951 together, they exceeded the previous year's total
An analysis of the drivers behind the fall in direct investment earnings and their impact on the UK's current account deficit
 Article An analysis of the drivers behind the fall in direct investment earnings and their impact on the UK's current account deficit The UK current account deficit continued to widen in 2015, marking
THE GREAT DEPRESSION OF FINLAND 1990-1993: causes and consequences. Jaakko Kiander Labour Institute for Economic Research
 THE GREAT DEPRESSION OF FINLAND 1990-1993: causes and consequences Jaakko Kiander Labour Institute for Economic Research CONTENTS Causes background The crisis Consequences Role of economic policy Banking
GROWTH & DEVELOPMENT OF THE MALAYSIAN ECONOMY - An overview -
 GROWTH & DEVELOPMENT OF THE MALAYSIAN ECONOMY - An overview - MOHAMED ARIFF 1 MALAYSIA: GDP GROWTH % 15 10 5 0-5 -10 1957 1960 1970 1980 1990 2000 2010 GDP Growth (%) Source: DOS 2 Factors Contributing
In 2012, GNP in constant prices increased by 1.8% compared with 2011.
 8 Economy In 2012, GNP in constant prices increased by 1.8% compared with 2011. The building and construction sector fell by 7.7% in value added terms in 2012 compared to 2011. Manufacturing industry decreased
IMPACT OF LIBERALISING FINANCIAL SERVICES
 IMPACT OF LIBERALISING FINANCIAL SERVICES January 22 This brief reviews the evidence for the impact of liberalising markets for financial services. It begins by showing the increasing economic importance
Republic of Tajikistan: Joint Bank-Fund Debt Sustainability Analysis
 February 2006 Republic of Tajikistan: Joint Bank-Fund Debt Sustainability Analysis Tajikistan s risk of debt distress is moderate. Under the baseline scenario, all the external debt burden indicators are
The history of the Bank of Russia s exchange rate policy
 The history of the Bank of Russia s exchange rate policy Central Bank of the Russian Federation Abstract During the post-soviet period of 1992 98, the monetary policy of the Bank of Russia was essentially
Globalization, IMF and Bulgaria
 Globalization, IMF and Bulgaria Presentation by Piritta Sorsa * *, Resident Representative of the IMF in Bulgaria, At the Conference on Globalization and Sustainable Development, Varna Free University,
An outlook on the Spanish economy Official Monetary and Financial Institutions Forum (OMFIF), London
, London") 09.02.2016 An outlook on the Spanish economy Official Monetary and Financial Institutions Forum (OMFIF), London Luis M. Linde Governor I would like to thank OMFIF and Mr. David Marsh for the invitation
09.02.2016 An outlook on the Spanish economy Official Monetary and Financial Institutions Forum (OMFIF), London Luis M. Linde Governor I would like to thank OMFIF and Mr. David Marsh for the invitation
Managing Systemic Banking Crises. David S. Hoelscher Assistant Director Money and Credit Markets Department
 Managing Systemic Banking Crises David S. Hoelscher Assistant Director Money and Credit Markets Department 2 Introduction Systemic banking crises of unprecedented scale: Argentina, East Asia, Ecuador,
SAMPLE PAPER II ECONOMICS Class - XII BLUE PRINT
 SAMPLE PAPER II ECONOMICS Class - XII Maximum Marks 100 Time : 3 hrs. BLUE PRINT Sl. No. Form of Very Short Short Answer Long Answer Total Questions (1 Mark) (3, 4 Marks) (6 Marks) Content Unit 1 Unit
INTRODUCTION TO EXPORT MARKETING I (Meaning and importance of Exports)
") 1 INTRODUCTION TO EXPORT MARKETING I (Meaning and importance of Exports) Unit Structure 1.0 Objectives 1.1 Introduction 1.2 Definitions of Export Marketing 1.3 Features of Export Marketing 1.4 Importance
1 INTRODUCTION TO EXPORT MARKETING I (Meaning and importance of Exports) Unit Structure 1.0 Objectives 1.1 Introduction 1.2 Definitions of Export Marketing 1.3 Features of Export Marketing 1.4 Importance
SUMMARY PROGRAM IMPACT ASSESSMENT
 Third Financial Sector Program, Subprogram 2 (RRP VIE 37577) SUMMARY PROGRAM IMPACT ASSESSMENT I. Introduction 1. This program impact analysis (PIA) documents the formulation of the Financial Sector Program
Debt Dynamics and its Burden on National Economy: A Case Study of Pakistan (1970-2005)
") Debt Dynamics and its Burden on National Economy: A Case Study of Pakistan (1970-2005) Tahir Mahmood Shahnaz A. Rauf Hafeez ur Rehman Abstract This paper examines the debt dynamics and its burden in Pakistan
Debt Dynamics and its Burden on National Economy: A Case Study of Pakistan (1970-2005) Tahir Mahmood Shahnaz A. Rauf Hafeez ur Rehman Abstract This paper examines the debt dynamics and its burden in Pakistan
Forecasting Chinese Economy for the Years 2013-2014
 Forecasting Chinese Economy for the Years 2013-2014 Xuesong Li Professor of Economics Deputy Director of Institute of Quantitative & Technical Economics Chinese Academy of Social Sciences Email: xsli@cass.org.cn
The World Trade Organization...
 The World Trade Organization......In brief, the World Trade Organization (WTO) is the only international organization dealing with the global rules of trade between nations. Its main function is to ensure
Globalization and International Trade
 12 Globalization and International Trade Globalization refers to the growing interdependence of countries resulting from the increasing integration of trade, finance, people, and ideas in one global marketplace.
URUGUAY. 1. General trends
 Economic Survey of Latin America and the Caribbean 2014 1 URUGUAY 1. General trends In 2013, Uruguay s level of economic activity increased by 4.4% compared with 2012, according to the country s physical
Science Technology and Innovation in Sri Lanka
 THE PANEL OF THE UNITED NATIONS COMMISSION ON SCIENCE AND TECHNOLOGY FOR DEVELOPMENT 28-30 November 2007 Kuala Lumpur Science Technology and Innovation in Sri Lanka The views presented here are the participants
External Commercial Borrowings
 External Commercial Borrowings Neha Gupta Vinod Kothari & Company 1012 Krishna, 224 AJC Bose Road Kolkata- 7000017 Ph: 91-33-22817715/ 22811276 Email: neha@vinodkothari.com What is ECB? Source of funds
Chart 1: Zambia's Major Trading Partners (Exports + Imports) Q4 2008 - Q4 2009. Switzernd RSA Congo DR China UAE Kuwait UK Zimbabwe India Egypt Other
 Q4 2008 - Q4 2009. Switzernd RSA Congo DR China UAE Kuwait UK Zimbabwe India Egypt Other") Bank of Zambia us $ Million 1. INTRODUCTION This report shows Zambia s direction of merchandise trade for the fourth quarter of 2009 compared with the corresponding quarter in 2008. Revised 1 statistics,
Bank of Zambia us $ Million 1. INTRODUCTION This report shows Zambia s direction of merchandise trade for the fourth quarter of 2009 compared with the corresponding quarter in 2008. Revised 1 statistics,
In recent years, fiscal policy in China has been prudent. Fiscal deficits
 1 Fiscal Policy in China STEVEN DUNAWAY AND ANNALISA FEDELINO* In recent years, fiscal policy in China has been prudent. Fiscal deficits have been lower than budgeted, because revenue overperformances
INVESTMENT PROMOTION, STRATEGIES, POLICIES AND PRACTICES MALAYSIA S EXPERIENCE
 INVESTMENT PROMOTION, STRATEGIES, POLICIES AND PRACTICES MALAYSIA S EXPERIENCE OECD China Conference on Foreign Investment 11 12 September 2000 Xiamen, People s Republic of China By Kaziah Abdul Kadir
WORLD BANK CHINA RESEARCH PAPER NO. 8
 WORLD BANK CHINA RESEARCH PAPER NO. 8 RAW MATERIAL PRICES, WAGES, AND PROFITABILITY IN CHINA S INDUSTRY HOW WAS PROFITABILITY MAINTAINED WHEN INPUT PRICES AND WAGES INCREASED SO FAST? Song-Yi Kim * / and
Mutual Funds in Pakistan
 Mutual Funds in Pakistan Investors Education Seminar arranged by SECP and ICAP held on 29th January 2015 Presented By First Capital Investments Limited Definition of Mutual Fund A mutual fund is a collective
What Drives the Economy? Key Economic Variables
 Vegetable Industry Development Program What Drives the Economy? Key Economic Variables This fact sheet provides a brief explanation of four key economic variables, how these variables interact and what
UNITED REPUBLIC OF TANZANIA TANZANIA INVESTMENT CENTRE INVESTMENT CLIMATE AND OPPORTUNITIES IN TANZANIA
 UNITED REPUBLIC OF TANZANIA TANZANIA INVESTMENT CENTRE INVESTMENT CLIMATE AND OPPORTUNITIES IN TANZANIA PRESENTATION TO THE CDM WORKSHOP DAR ES SALAAM INTERNATIONAL CONFERENCE CENTRE 21 ST JANUARY,2008
II. Merchandise trade
 II. Merchandise trade World merchandise trade grew by 2 per cent in volume terms in 2012 against a backdrop of weak global demand and declining prices. This is significantly less than the 5 per cent increase
Adjusting to a Changing Economic World. Good afternoon, ladies and gentlemen. It s a pleasure to be with you here in Montréal today.
 Remarks by David Dodge Governor of the Bank of Canada to the Board of Trade of Metropolitan Montreal Montréal, Quebec 11 February 2004 Adjusting to a Changing Economic World Good afternoon, ladies and
The global economy in 2007
 Introduction The global economy in 27 Global output grew 3.8 percent in 27, receding slightly from 4 percent in 26. The downturn was greatest in high-income economies, where growth fell from 3 percent
1997 Asian Financial Crisis
 1997 Asian Financial Crisis. Ed Vallorani 12/14/2009 Table of Contents Background 1 Japan The Lost Decade 4 Country Information China 6 Hong Kong 6 Taiwan 7 Indonesia 8 Japan 8 Korea 9 Philippines 10 Singapore
7. Spillovers from Russia to the CCA
 7. Spillovers from Russia to the CCA In the face of sharply lower oil prices and geopolitical tensions and sanctions, economic activity in Russia has rapidly decelerated, resulting in negative spillovers
THE US DOLLAR, THE EURO, THE JAPANESE YEN AND THE CHINESE YUAN IN THE FOREIGN EXCHANGE MARKET A COMPARATIVE ANALYSIS
 THE US DOLLAR, THE EURO, THE JAPANESE YEN AND THE CHINESE YUAN IN THE FOREIGN EXCHANGE MARKET A COMPARATIVE ANALYSIS ORASTEAN Ramona Lucian Blaga University of Sibiu, Romania Abstract: This paper exposes
Annexure 1. 1. India s FTA/PTA and RMG Trade with FTA/PTA Partners
 Annexure 1 1. India s FTA/PTA and RMG Trade with FTA/PTA Partners The size of India s clothing industry is estimated to be US$ 62 bn. in 2012 as per FICCI and Textile committee estimates including exports
BALANCE OF PAYMENTS AND FOREIGN DEBT
 BALANCE OF PAYMENTS AND FOREIGN DEBT V 1. BALANCE OF PAYMENTS In 1997, the external current account deficit was 8.1 billion krónur, corresponding to 1. percent of GDP. It declined from 8.9 b.kr., or 1.8
Any comments and suggestions on the content of the publication are most welcome.
 PREFACE The agro-processing industry is among the sectors identified by National Development Plan (NDP, 2011), Industrial Policy Action Plan (IPAP, 2015) and Agricultural Policy Action Plan (APAP, 2015)
Asian Development Bank
 ERD POLICY BRIEF SERIES Economics and Research Department Number 7 Causes of the 1997 Asian Financial Crisis: What Can an Early Warning System Model Tell Us? Juzhong Zhuang Malcolm Dowling Asian Development
Insurance Market Outlook
 Munich Re Economic Research May 2014 Premium growth is again slowly gathering momentum After a rather restrained 2013 (according to partly preliminary data), we expect growth in global primary insurance
Explanation beyond exchange rates: trends in UK trade since 2007
 Explanation beyond exchange rates: trends in UK trade since 2007 Author Name(s): Michael Hardie, Andrew Jowett, Tim Marshall & Philip Wales, Office for National Statistics Abstract The UK s trade performance
GHANA S IMF PROGRAM - THE RISK OF FISCAL CONSOLIDATION WITHOUT STRONG FISCAL POLICY RULES. Commentary
 GHANA S IMF PROGRAM - THE RISK OF FISCAL CONSOLIDATION WITHOUT STRONG FISCAL POLICY RULES Introduction Commentary Mohammed Amin Adam, PhD Africa Centre for Energy Policy Following macroeconomic challenges
Recent Developments in Local Currency Bond Markets (LCBMs) 1. October 2013
 1. October 2013") Recent Developments in Local Currency Bond Markets (LCBMs) 1 October 2013 Given the importance of local currency bond markets (LCBMs), including in the context of the work now underway on financing for
Recent Developments in Local Currency Bond Markets (LCBMs) 1 October 2013 Given the importance of local currency bond markets (LCBMs), including in the context of the work now underway on financing for
GLOBALIZATION INTERNATIONAL BUSINESS
 GLOBALIZATION INTERNATIONAL BUSINESS OBJECTIVES To define globalization and international business and how they affect each other To understand why companies engage in international business and why international
Monetary and Financial Trends First Quarter 2011. Table of Contents
 Financial Stability Directorate Monetary and Financial Trends First Quarter 2011 Table of Contents Highlights... 1 1. Monetary Aggregates... 3 2. Credit Developments... 4 3. Interest Rates... 7 4. Domestic
Comparing Levels of Development
 2 Comparing Levels of Development Countries are unequally endowed with natural capital. For example, some benefit from fertile agricultural soils, while others have to put a lot of effort into artificial
Macroeconomic Influences on U.S. Agricultural Trade
 Macroeconomic Influences on U.S. Agricultural Trade In addition to the influence of shifting patterns of growth in foreign populations and per capita income, cyclical macroeconomic factors associated with
7-13 December, 2015. The Korea Development Institute lowered its outlook for Korea's economic growth for this year and next.
 Weekly Korea Economic Digest 7-13 December, 2015 Office of Commercial Affairs, Seoul KDI Lowers Economic Growth Outlook The Korea Development Institute lowered its outlook
Kiel. Policy Brief. The Importance of Investment Income and Transfers in the Current Account: A New Look on Imbalances. Rolf J.
 Kiel Policy Brief The Importance of Investment Income and Transfers in the Current Account: A New Look on Imbalances Rolf J. Langhammer No. 48 May 2012 Institut für Weltwirtschaft Kiel Kiel Institute for
Mexico in the face of slowing emerging economies. Manuel Sánchez
 Manuel Sánchez Adam Smith Seminar Central Bank of Hungary, Budapest, November 10, 2015 Contents 1 Soft economic rebound 2 Coping with higher risk aversion 3 Tamed inflation 2 Since 2014, global growth
Econ 336 - Spring 2007 Homework 5
 Econ 336 - Spring 2007 Homework 5 Name MULTIPLE CHOICE. Choose the one alternative that best completes the statement or answers the question. 1) The real exchange rate, q, is defined as A) E times P B)
Indonesia: stabilizing the exchange rate along its fundamental
 Indonesia: stabilizing the exchange rate along its fundamental Perry Warjiyo 1 Abstract For a small open economy like Indonesia, exchange rate movement does not always reflect fundamental value. Increasing
European Union, Trade in goods with USA
 European Union, Trade in goods with USA Table of Contents pg - Key Figures 2 - / 2015 2 - - AMA/NAMA product Groups 2 - - SITC product Groups 2 - - Top 5 - HS sections 2 - - Top 5 - SITC sections 2 - EU
Thailand Update. Yield Movements. Size and Composition
 Thailand Update Yield Movements Thai government bond yields fell for most maturities between end-december 2009 and end-october 2010 (Figure 1). Yields for 1- and 2-year maturities rose 46 and 25 basis
A BRIEF HISTORY OF BRAZIL S GROWTH
 A BRIEF HISTORY OF BRAZIL S GROWTH Eliana Cardoso and Vladimir Teles Organization for Economic Co operation and Development (OECD) September 24, 2009 Paris, France. Summary Breaks in Economic Growth Growth