WHAT S ON MY NETWORK? A NETWORK MONITORING AND ANALYSIS TUTORIAL
|
|
|
- Brice Simon
- 9 years ago
- Views:
Transcription
1 DATA COMMUNICATIONS MANAGEMENT WHAT S ON MY NETWORK? A NETWORK MONITORING AND ANALYSIS TUTORIAL Betty DuBois, SCE, CNI, CNE, CNX INSIDE Step 1: Network Monitoring: What types of traffic are on my network now?; Now that the tools are in place, what is on my network?; Network Utilization; Application Distribution; Top Talkers; Step 2: Network Analysis: What could be eliminated from our network and what could be faster?; What can be eliminated from our network?; Excessive broadcasts; Others; Conversation Flow Analysis: what could be faster?; Response times; Conversation Flow Errors; Step 3: Packet Analysis INTRODUCTION Are you planning to move to a pure IP infrastructure in the near future? Do you want to make sure there are no extraneous protocols lurking on your network? Perhaps you want to optimize your applications, or are just interested in how much traffic is really going out to your WAN link. If any of these issues are of concern or importance to you, then you will want to read further. So often network administrators need to know what is really happening on their networks, and a network analysis tool, or analyzer, is the only way to obtain this information. First, you need to look at the big picture. This information-gathering process is known as monitoring. Before you can start to capture the traffic on your network, you must learn what is really taking place on your network. Monitoring shows you what is actually happening on your network in real-time. For example: Protocols being used The top talkers Server response times PAYOFF IDEA A network analysis tool, or analyzer, is the only way a network administrator can know what is really happening on a network. The first step is information gathering, or monitoring. Monitoring shows what is actually happening on your network in real-time. Having studied the big picture, next obtain the details, which is called protocol analysis, or more commonly, sniffing. By copying the datastream into the analyzer software, a network administrator can eliminate extraneous traffic, troubleshoot slow response times, and understand how the conversations really flow. 6/03 Auerbach Publications 2003 CRC Press LLC

2 2 DATA COMMUNICATIONS MANAGEMENT EXHIBIT 1 Acme Corporation, Widget Manufacturer Atlanta New York Chicago Boston Volume of local conversations versus those traveling across the WAN Traffic that can be eliminated without affecting the users Once you have studied the big picture, you can work on obtaining the details, which is called protocol analysis or, more commonly, sniffing. By copying the datastream into the analyzer software, the network administrator can eliminate extraneous traffic, troubleshoot slow response times, and understand how the conversations really flow. The purpose of this article is to guide you through the placement and use of a network monitor and analysis tool. Exhibit 1 shows Acme Corporation, a fictitious company, which will serve as our sample network for this tutorial. We start the analysis with a 30,000-foot overview of the network, and work our way down to the nitty-gritty details. STEP 1: NETWORK MONITORING WHAT TYPES OF TRAFFIC ARE ON MY NETWORK NOW? This is where network monitoring comes in. Planning is the most important aspect of this process. Before purchasing and positioning a network monitoring and analysis tool, you need to answer a couple key questions: 1. What topologies are on your network? 2. How many segments do you intend to monitor? Looking at Acme Corporation s network in Exhibit 1, you see there are two different topologies. Ethernet is used for the local area network (LAN), and frame relay is used for the wide area network (WAN). Because not all analyzers are designed for the WAN environment, you

3 WHAT S ON MY NETWORK? A NETWORK MONITORING AND ANALYSIS TUTORIAL 3 EXHIBIT 2 Acme Corporate Headquarters Atlanta Switch A Network Analyzer A B C Gateway Router and Firewall Switch B X Y Z Network Analyzer Server A and Users X, Y, and Z are in VLAN1 Servers A, B, and C are in VLAN2 have to determine if you can get all the statistics you need from your telecommunications provider, or if you yourself need to monitor the segment you are interested in. While this article focuses only on LAN analyzers, many WAN analyzer concepts are similar. The next question to ask yourself is, How many segments should I monitor? The days of employing hubs are long gone, and with them the ability to see everything on the network at one time. While switches are now the standard in Ethernet, they create new network monitoring challenges. Atlanta is Acme Corporation s corporate headquarters, so we focus our efforts there. Exhibit 2 shows multiple Ethernet segments two switches, the uplink between the switches, and the uplink to the router (gateway segment). In this example, the virtual local area networks (VLANs) on the switches could each be considered their own segment. Good network and VLAN documentation will save a lot of time and frustration when working on this step in the process. Now that your segments have been identified, the next question to ask is, Where should I put the analyzer on my network? The correct answer is always, It depends. If your goal is to see all the traffic that goes out over your WAN link, your analyzer should be placed on Switch A (see Exhibit 2) mirroring the uplink to the router. Because a switch only forwards a packet to the port where the destination address resides and the analyzer needs to also receive a copy of that packet, the switch must be configured to mirror or copy the packets to the analyzer s own port. Vendors may refer to this

4 4 DATA COMMUNICATIONS MANAGEMENT process as mirroring, spanning, or port monitoring. For consistency purposes, this article uses the term mirroring. However, if your goal is to see the traffic from the client s perspective, the uplink from Switch B should be mirrored and therefore the analyzer should be placed on Switch B. The analyzer should always be placed on the same switch that has been configured to mirror. Trying to mirror an upstream switch would place too great a load on the uplink port. Is mirroring your only choice when you need to see these packets? No, because (1) mirroring puts a large load on the switch s processor and buffer, and (2) not all switches support mirroring. There is also the possibility of dropping packets from your analyzer, or worse, overloading the switch and causing it to reboot. Another choice is to use a tap at each insertion point and to hang the analyzer off of the tap. The problem with using taps is that there needs to be one tap between each switch and there also needs to be one tap between each server and switch to see the most traffic on your network. Installing that many taps can be cost prohibitive. Also, because our Ethernet segments are running at fullduplex, either you must use a full-duplex analyzer or you need to have two analyzers hanging off each tap so that both the send and receive packets are analyzed. However, using taps allows you to take the analyzer load off the switch and still obtain correct statistics. But the more ports that are being mirrored, the more your switch must buffer the packets to send down to the analyzer. This can cause a skew in the timings when measuring latency between commands and responses. Now that the Tools Are in Place, What Is on My Network? Now that the tools are in place, you can start to monitor our network. Network monitoring is simply doing a baseline with your goal to gather statistics about what is happening on your network. Depending on the analyzer used, many different types of reports are available to display the statistical information. The key information to gather and review is network utilization, protocol distribution, and top talkers. In many cases, the information learned at this level guides the direction for the rest of the network analysis. Each answer leads to the next question. For example, while looking at the utilization statistics, the focus should be on what is happening on your network during peak times. Does the protocol distribution shift, or are you just seeing more of the same protocols? Network Utilization. The first segment being monitored in our sample network is the uplink to the router. Depending on your analyzer, you might only be able to see absolute and average utilization statistics. If your analyzer supports it, being able to see what your network utilization is over a period of time makes it much easier to see when the peak times
 mirroring puts a large load on the switch s processor and buffer, and (2) not all switches support mirroring.")
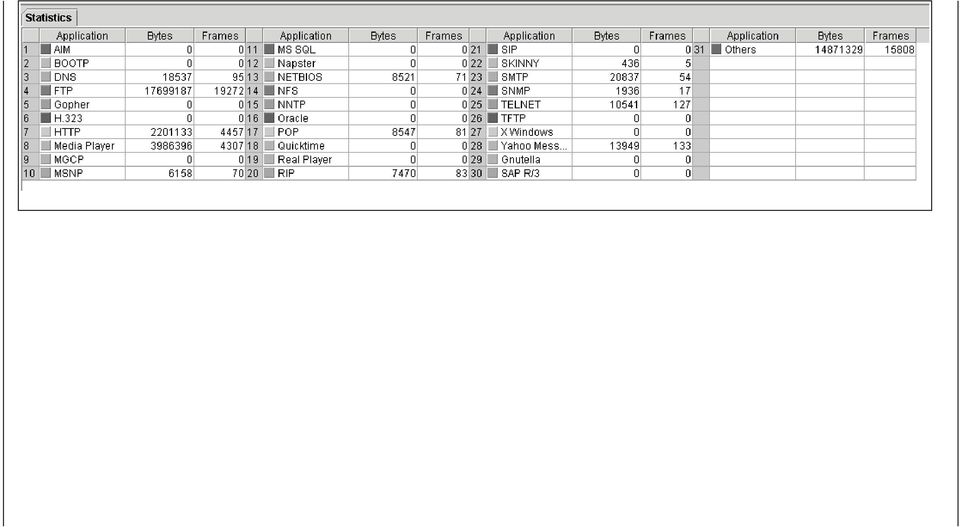
5 WHAT S ON MY NETWORK? A NETWORK MONITORING AND ANALYSIS TUTORIAL 5 occur on your network. This information also helps to plan when the low utilization points occur on your network, so that change control processes can be scheduled. In Exhibit 3 we see that network utilization spikes on the gateway segment after 3:00 pm. Application Distribution. How long do these spikes last? If the spikes are sustained, the next question to ask yourself is, What protocols are being used? Often, what the network administrator thinks is happening on the network and what is really happening on the network are two very different things. The first segment being monitored on our sample network is the uplink to the router (see Exhibit 4). We see from the analyzer that HTTP, FTP, Media Player, and something called Others account for most of the network traffic. We expect HTTP and FTP traffic because the users have access to the Internet; and now that we know they are listening to music via the WAN link, we can block the Media Player traffic at the firewall. But what type of traffic is Others? This is the kind of information you find when you start monitoring your network. There is stuff out on your network that you cannot account for, and this stuff is a prime target to evaluate when looking to optimize your network. Later, we will capture the packets to find out what these Others are. Top Talkers. Now that you know what protocols are in use, you can look at who is using them the most. While it is very easy to get lost in the great abyss of information that an analyzer can provide, you need to focus your time and efforts on where the greatest impact on our sample network can be made in terms of optimization. This is one of the reasons all analyzers have a top talkers report (see Exhibit 5). This report tells us who is using the most bandwidth. On Acme Corporation s network, we want to look at the top talkers for both the uplink to the router and for the server farm segments. Because our servers are all on the same VLAN, by mirroring the VLAN2 we are able to see not only all the clientto-server traffic, but also any server-to-server traffic, such as database replication. By looking at the IP address, we can also tell how much of the traffic is from the Atlanta users and how much is from users located at other sites. Once we look at who is accessing our servers, we can focus on the gateway segment and determine: Who are the top talkers to our WAN link? Is the traffic predominately initiated from our other sites querying our CRM database, or is it coming from inside the company by users surfing the Internet?

6 EXHIBIT 3 Sniffer Portable Utilization History Report

7 WHAT S ON MY NETWORK? A NETWORK MONITORING AND ANALYSIS TUTORIAL 7 The answers to these questions will help you decide if you need to increase the speed of the WAN link, or if you need to load balance your database server. Being able to see not only the top talkers in Exhibit 5 but also the top conversations in Exhibit 6 will help you make these decisions. STEP 2: NETWORK ANALYSIS WHAT COULD BE ELIMINATED FROM OUR NETWORK AND WHAT COULD BE FASTER? Now that you know the network utilization, application distribution, and top talker statistics, and therefore where to concentrate your optimization efforts, you can start to do the analysis. This will involve both determining what traffic is superfluous and what can be done to improve access to the information your staff and customers need. What Can Be Eliminated from the Network? The ultimate goal of any network analysis is to make the network response time faster. With that in mind, any unnecessary traffic you locate and eliminate will move you closer toward this goal. Excessive Broadcasts. One of the most common network issues is broadcast traffic, which is traffic sent to all devices on a segment. There are many recommendations for what should be the broadcast ratio on a network. It all depends on the types of traffic on your network. For example, in places where many screens are updated with the same information, such as a stock brokerage office, extremely high multicast traffic (i.e., traffic sent to a group of devices using a special address) is considered normal. However, for our sample client/server-based network, the recommended ratio is 10 percent broadcast and multicast traffic. To calculate this ratio, simply divide the sum of the broadcast packets plus the multicast packets by the packets received (see Exhibit 7). The result for our sample network is 23 percent, which is much greater than our recommended ratio of 10 percent. Later, when discussing packet analysis, we will examine different types of broadcast and multicast packets to see what can be optimized. Our goal is to determine what services are being advertised on the segment that no one is using. Others. There are a multitude of different types of conversations that can be analyzed on a network. The key is to focus on the ones that are most critical to the business. Acme Corporation s corporate office in Atlanta also houses a Web server where the public can purchase their widgets online and download installation and maintenance information about their widgets. Therefore, although we expected to see high levels of HTTP and FTP traffic when monitoring the uplink to the router, we also saw a large percentage of Others traffic. Remember that Others

8 EXHIBIT 4 AppDancer F/A Application Distribution

9
10 EXHIBIT 5 AppDancer F/A IP Hosts

11 EXHIBIT 6 AppDancer F/A IP Flows

12 12 DATA COMMUNICATIONS MANAGEMENT EXHIBIT 7 Etherpeek Network Statistics are protocols that do not fit into the preconfigured list of defined port numbers on our analyzer. Because no analyzer is configured with all of the well-known port numbers, finding out what the Others are is usually simply a matter of capturing the data, finding the port number in the TCP or UDP header, and looking it up on Unlike monitoring, which is looking at statistics, capturing allows us to bring an entire copy of a packet into the buffer of the analyzer for detailed analysis and decode. After capturing packets on Acme Corporation s gateway segment long enough to see the Others increment in the Application Distribution in Exhibit 4, we can then stop and display the buffer. Now we can filter the trace file for the Others (see Exhibit 8). By sorting the conversations by byte count, we can focus on those conversations with the greatest impact in this case, the top three conversations. The first conversation used port 1494, which is the well-known port for the Citrix client. Acme Corporation s users access an SQL database to look up customer information. The database is housed on a server in Atlanta, and all locations access it. Because staff in the other offices access the customer database using a Citrix client, this traffic is expected and normal. We now only need to add this port number to our analyzer so that it will be delineated in the future. The next conversation uses port 6346, the well-known port number for Gnutella. Gnutella is certainly not authorized use of Acme Corporation s network resources, so we will not only add ports 6346 and 6347 (Gnutella Router) to our analyzer so they can be watched for in the future, but we will configure the firewall to block the traffic from those ports as well. The last conversation we will look at uses port Because this is not on the Internet Assigned Number Authority s (IANA) list, we will have to look at the ASCII representation of the hexadecimal code of the packet itself to look for clues to determine what the traffic really is. In Exhibit 9 we see that the words Ghost and Config Server appear in the ASCII translation. Because this packet was sent to a multicast address, we now know it is the client checking for updates from the Ghost Server. We can

13 EXHIBIT 8 AppDancer F/A Classic Tab, Port 1494

14 EXHIBIT 9 AppDancer F/A Classic Tab, Port 1345

15 WHAT S ON MY NETWORK? A NETWORK MONITORING AND ANALYSIS TUTORIAL 15 investigate perhaps changing the timings in the software to see if checking for updates can be done less frequently, but this traffic is not something we want to eliminate entirely. These are just a few examples of the kinds of things you might find once you really start digging into your network. Conversation Flow Analysis: What Could Be Faster? Next we can focus on what conversation flows can be optimized, but first we have to move our analyzer to the user segment. When users complain that the network is slow, they mean that the access time to the applications they need is slow. By mirroring the port the user is attached to, we can get as close as we can to their actual experience and look at the response times. Response Times. There are two types of response times (see Exhibit 10). Delta time is the time between a command and the response literally the time between when the packets passed through the analyzer. Relative time (Rel. Time) is the cumulative sum of the delta times. It tells us how long the conversation lasted. If you see a large gap in the delta times, you need to determine which side is causing the delay. If the large delta time occurs after a server response, it could simply imply that the user is reading what is on his screen before asking for more information. If the gap in the delta time is from the server response, you must delve deeper into the reason for the delay. Either way, you now have a baseline of response times from which to work. It is recommended that you look at the common processes on your network and get a baseline of response times for each of your different applications. Although the analyzer can also be shipped to each office to get a baseline of response times for each office accessing the servers across the WAN, a distributed network analyzer greatly simplifies the process. We can have a distributed network analyzer in each location and access each one from a single console in Atlanta. Then, when users are experiencing a slowdown, we can have one analyzer at the server and one at the user segment, and compare them to determine where the latency is occurring. For example, if we are sniffing only on the users segment, and we see a command travel down the wire and the delta time for the response is very large, we still do not know if the network is causing the latency or if the server or the application is causing the latency. However, by looking at the same conversation on the server segment, we see one of two scenarios: either (1) the delta time between the command and the response is small, which means the network is inducing the latency, or (2) the delta time between the command and the response is large, which means either the server or the application is at fault. Remember

16 EXHIBIT 10 AppDancer F/A Application Flow

17 WHAT S ON MY NETWORK? A NETWORK MONITORING AND ANALYSIS TUTORIAL 17 that delta times are based on the difference between the timestamps of the two packets as they pass the analyzer (not when they left the originating device), so a small delta time at the server segment with a large delta time at the user segment means the command was delayed getting to the server and response was delayed going back to the client. Therefore, the network is causing the latency. We would then perform a Trace Route to see where within the path the latency is being induced. If the delta time between the command and the response is large, the issue is either the server or the application. To determine if the server is causing the problem, we would look at how many conversations the server was currently involved in. If it is a large number of conversations, perhaps some tasks could be offloaded, or we could check the utilization on the server itself to see if the hardware needs to be upgraded. AnalogX s NetStat Live utility is an excellent tool for helping us with both of these tasks. To be able to prove it is the application causing the problem, we need to look at the TCP acknowledgments. If we see a TCP ack after the user command, and then later see the server response, we can prove that the TCP stack on the server received the data but the application could not process the request fast enough. That is, it is not the network s fault. Notice the large delta time in packet 6 in Exhibit 11, yet the server s TCP stack acknowledges the request packet in packet 5, then 87 seconds later, the upper layer of the server sends the response of 244 bytes. However, before pointing fingers at the application developer, we need to check to see if the server requested data from another server. At Acme Corporation, a Citrix server makes calls to the SQL server to look up customer data before responding to the client. If we filter for the user and Citrix server conversation by the TCP port pairing, the call to the SQL server would be filtered out and we could be led to the wrong conclusion. When doing this type of in-depth analysis, having two or more analyzers makes a tremendous difference in being able to see the conversation at each point of contact and makes it a lot easier to prove your case when participating in whose fault is it -type meetings. Conversation Flow Errors Having looked at response times, now we can look at specific errors for different conversations. Exhibit 12 shows an FTP download from ftp.microsoft.com where the server timed the user out after only 30 seconds (error code 421). We need to decide how long the timeout should be for Acme Corporation s FTP server. Because the site is for our customers, we want to make it as easy as possible for them to download at their leisure, yet we do not want ports open forever

18 EXHIBIT 11 AppDancer F/A Classic Summary Pane

19 EXHIBIT 12 AppDancer F/A AppFlow FTP Error

20 20 DATA COMMUNICATIONS MANAGEMENT Exhibit 13 shows an error on our HTTP server. The client requested a graphic file and, after almost three (3) seconds, had not received a response and therefore asked again. After the second request, the file was downloaded so we know that the file was available. Because almost all upper-layer retransmissions are caused by a physical issue, we would first check the statistics on the switch where the Web server is connected to see if there were any physical layer errors that might cause a TCP retransmission. If there were no physical errors, then we would check the statistics on the router to see if any packets were being dropped due to our exceeding our Committed Information Rate (CIR). Exhibit 14 shows an error in an SQL conversation. The response from the server tells us that CCSEvents is an invalid object name and that the Statement(s) could not be prepared, which is obviously not a network issue. Armed with this information from our analyzer, we now can forward the trace file to our SQL developers and request a fix. Because the error messages are in such an easy-to-read format, we are more likely to get a cooperative response from the SQL developers than if we just told them that the SQL is broken. STEP 3: PACKET ANALYSIS Although our analyzers have given us a lot of useful information, sometimes you just have to look at the hexadecimal code. Remember that we had postponed looking at our excessive broadcast traffic until now. To capture broadcast and multicast traffic, we only need to plug into a switch port of the VLAN we are interested in. No mirroring is necessary because broadcast and multicast traffic is flooded throughout the VLAN. In the packet shown in Exhibit 15, address sends a WINS request for the ICS workstation because a printer share had been configured on the workstation. That printer has been out of service for three months. Yet at least 25 stations have been broadcasting a Name Query for it every 0.7 seconds! Configuration issues like this are impossible to find without an analyzer and can easily bog down a network if not detected. SUMMARY This article described some of the many factors to consider when performing network monitoring and analysis. The process requires not only knowledge of the devices on your network, but also knowledge of the traffic flows and the protocols involved. We also learned that for every question answered by our analysis, two or three more questions emerge

21 EXHIBIT 13 AppDancer F/A AppFlow HTTP Error
22 EXHIBIT 14 AppDancer F/A AppFlow SQL Error
23 WHAT S ON MY NETWORK? A NETWORK MONITORING AND ANALYSIS TUTORIAL 23 EXHIBIT 15 AppDancer F/A Classic, Name Query References AppDancer Networks AppDancer F/A. Compuware Corporation Application Vantage. Sniffer Technologies Sniffer Pro. Wildpackets Etherpeek. Betty DuBois, SCE, CNI, CNE, CNX, is the president of Cornerstone Professional Services, a Powder Springs, Georgia-based network consulting firm dedicated to getting networks running at their peak efficiency. She has more than ten years of networking, protocol analysis, and training experience. Additional company and services information is available at Betty can be reached via at [email protected]
Diagnosing the cause of poor application performance
 Diagnosing the cause of poor application performance When it comes to troubleshooting application performance issues, there are two steps you can take to make diagnosis easier, faster and more accurate.
Troubleshooting LANs with Network Statistics Analysis
 Application Note Troubleshooting LANs with Network Statistics Analysis Introduction This application note is one in a series of local area network (LAN) troubleshooting papers from JDSU Communications
Zarząd (7 osób) F inanse (13 osób) M arketing (7 osób) S przedaż (16 osób) K adry (15 osób)
 F inanse (13 osób) M arketing (7 osób) S przedaż (16 osób) K adry (15 osób)") QUESTION NO: 8 David, your TestKing trainee, asks you about basic characteristics of switches and hubs for network connectivity. What should you tell him? A. Switches take less time to process frames than
QUESTION NO: 8 David, your TestKing trainee, asks you about basic characteristics of switches and hubs for network connectivity. What should you tell him? A. Switches take less time to process frames than
Troubleshooting LANs with Wirespeed Packet Capture and Expert Analysis
 Application Note Troubleshooting LANs with Wirespeed Packet Capture and Expert Analysis Introduction This application note is one in a series of local area network (LAN) troubleshooting papers from JDSU
UPPER LAYER SWITCHING
 52-20-40 DATA COMMUNICATIONS MANAGEMENT UPPER LAYER SWITCHING Gilbert Held INSIDE Upper Layer Operations; Address Translation; Layer 3 Switching; Layer 4 Switching OVERVIEW The first series of LAN switches
Configuring Network Address Translation (NAT)
") 8 Configuring Network Address Translation (NAT) Contents Overview...................................................... 8-3 Translating Between an Inside and an Outside Network........... 8-3 Local and
8 Configuring Network Address Translation (NAT) Contents Overview...................................................... 8-3 Translating Between an Inside and an Outside Network........... 8-3 Local and
Network Security: Workshop. Dr. Anat Bremler-Barr. Assignment #2 Analyze dump files Solution Taken from www.chrissanders.org
 1.pcap - File download Network Security: Workshop Dr. Anat Bremler-Barr Assignment #2 Analyze dump files Solution Taken from www.chrissanders.org Downloading a file is a pretty basic function when described
Network Management and Monitoring Software
 Page 1 of 7 Network Management and Monitoring Software Many products on the market today provide analytical information to those who are responsible for the management of networked systems or what the
Network audit Campina UK Horsham November 10th, 2004
 Network audit Campina UK Horsham November 10th, 2004-1 - Contents Contents... 2 Problem description... 2 Problem description... 3 Current infrastructure... 4 Test... 5 Test setup... 5 Test results... 9
Lab VI Capturing and monitoring the network traffic
 Lab VI Capturing and monitoring the network traffic 1. Goals To gain general knowledge about the network analyzers and to understand their utility To learn how to use network traffic analyzer tools (Wireshark)
How To Understand and Configure Your Network for IntraVUE
 How To Understand and Configure Your Network for IntraVUE Summary This document attempts to standardize the methods used to configure Intrauve in situations where there is little or no understanding of
EKT 332/4 COMPUTER NETWORK
 UNIVERSITI MALAYSIA PERLIS SCHOOL OF COMPUTER & COMMUNICATIONS ENGINEERING EKT 332/4 COMPUTER NETWORK LABORATORY MODULE LAB 2 NETWORK PROTOCOL ANALYZER (SNIFFING AND IDENTIFY PROTOCOL USED IN LIVE NETWORK)
Observer Analysis Advantages
 In-Depth Analysis for Gigabit and 10 Gb Networks For enterprise management, gigabit and 10 Gb Ethernet networks mean high-speed communication, on-demand systems, and improved business functions. For enterprise
Basic Network Configuration
 Basic Network Configuration 2 Table of Contents Basic Network Configuration... 25 LAN (local area network) vs WAN (wide area network)... 25 Local Area Network... 25 Wide Area Network... 26 Accessing the
Lab 5.5.3 Developing ACLs to Implement Firewall Rule Sets
 Lab 5.5.3 Developing ACLs to Implement Firewall Rule Sets All contents are Copyright 1992 2007 Cisco Systems, Inc. All rights reserved. This document is Cisco Public Information. Page 1 of 8 Device Interface
Firewall Defaults and Some Basic Rules
 Firewall Defaults and Some Basic Rules ProSecure UTM Quick Start Guide This quick start guide provides the firewall defaults and explains how to configure some basic firewall rules for the ProSecure Unified
Introduction. What is a Remote Console? What is the Server Service? A Remote Control Enabled (RCE) Console
 Console") Contents Introduction... 3 What is a Remote Console?... 3 What is the Server Service?... 3 A Remote Control Enabled (RCE) Console... 3 Differences Between the Server Service and an RCE Console... 4 Configuring
Contents Introduction... 3 What is a Remote Console?... 3 What is the Server Service?... 3 A Remote Control Enabled (RCE) Console... 3 Differences Between the Server Service and an RCE Console... 4 Configuring
NETWORK LAYER/INTERNET PROTOCOLS
 CHAPTER 3 NETWORK LAYER/INTERNET PROTOCOLS You will learn about the following in this chapter: IP operation, fields and functions ICMP messages and meanings Fragmentation and reassembly of datagrams IP
Monitoring Service Delivery in an MPLS Environment
 Monitoring Service Delivery in an MPLS Environment A growing number of enterprises depend on (or are considering) MPLS-based routing to guarantee high-bandwidth capacity for the real-time applications
Extending Network Visibility by Leveraging NetFlow and sflow Technologies
 Extending Network Visibility by Leveraging and sflow Technologies This paper shows how a network analyzer that can leverage and sflow technologies can provide extended visibility into enterprise networks
52-20-15 RMON, the New SNMP Remote Monitoring Standard Nathan J. Muller
 52-20-15 RMON, the New SNMP Remote Monitoring Standard Nathan J. Muller Payoff The Remote Monitoring (RMON) Management Information Base (MIB) is a set of object definitions that extend the capabilities
Extending Network Visibility by Leveraging NetFlow and sflow Technologies
 Extending Network Visibility by Leveraging and sflow Technologies This paper shows how a network analyzer that can leverage and sflow technologies can provide extended visibility into enterprise networks
Internet Working 5 th lecture. Chair of Communication Systems Department of Applied Sciences University of Freiburg 2004
 5 th lecture Chair of Communication Systems Department of Applied Sciences University of Freiburg 2004 1 43 Last lecture Lecture room hopefully all got the message lecture on tuesday and thursday same
Measure wireless network performance using testing tool iperf
 Measure wireless network performance using testing tool iperf By Lisa Phifer, SearchNetworking.com Many companies are upgrading their wireless networks to 802.11n for better throughput, reach, and reliability,
SNMP Monitoring: One Critical Component to Network Management
 Network Instruments White Paper SNMP Monitoring: One Critical Component to Network Management Although SNMP agents provide essential information for effective network monitoring and troubleshooting, SNMP
Non-intrusive, complete network protocol decoding with plain mnemonics in English
 The Triple Play Analysis Suite - DATA The Triple Play Analysis Suite - Data are meant for emulating the client s application such as FTP downloading or Web Browser testing at the termination point of DSL
Question: 3 When using Application Intelligence, Server Time may be defined as.
 1 Network General - 1T6-521 Application Performance Analysis and Troubleshooting Question: 1 One component in an application turn is. A. Server response time B. Network process time C. Application response
Technical Support Information Belkin internal use only
 The fundamentals of TCP/IP networking TCP/IP (Transmission Control Protocol / Internet Protocols) is a set of networking protocols that is used for communication on the Internet and on many other networks.
Can PowerConnect Switches Be Used in IP Multicast Networks?
 PowerConnect Application Note #6 January 2004 Can PowerConnect Switches Be Used in IP Multicast Networks? This Application Note relates to the following Dell PowerConnect products: PowerConnect 33xx PowerConnect
Observer Probe Family
 Observer Probe Family Distributed analysis for local and remote networks Monitor and troubleshoot vital network links in real time from any location Network Instruments offers a complete line of software
SSVP SIP School VoIP Professional Certification
 SSVP SIP School VoIP Professional Certification Exam Objectives The SSVP exam is designed to test your skills and knowledge on the basics of Networking and Voice over IP. Everything that you need to cover
Chapter 3. TCP/IP Networks. 3.1 Internet Protocol version 4 (IPv4)
") Chapter 3 TCP/IP Networks 3.1 Internet Protocol version 4 (IPv4) Internet Protocol version 4 is the fourth iteration of the Internet Protocol (IP) and it is the first version of the protocol to be widely
Chapter 3 TCP/IP Networks 3.1 Internet Protocol version 4 (IPv4) Internet Protocol version 4 is the fourth iteration of the Internet Protocol (IP) and it is the first version of the protocol to be widely
Implementing, Managing, and Maintaining a Microsoft Windows Server 2003 Network Infrastructure
 Question Number (ID) : 1 (wmpmsp_mngnwi-121) You are an administrator for an organization that provides Internet connectivity to users from the corporate network. Several users complain that they cannot
Enabling NAT and Routing in DGW v2.0 June 6, 2012
 Enabling NAT and Routing in DGW v2.0 June 6, 2012 Proprietary 2012 Media5 Corporation Table of Contents Introduction... 3 Starting Services... 4 Distinguishing your WAN and LAN interfaces... 5 Configuring
LAN Switching and VLANs
 26 CHAPTER Chapter Goals Understand the relationship of LAN switching to legacy internetworking devices such as bridges and routers. Understand the advantages of VLANs. Know the difference between access
INTERNATIONAL JOURNAL OF PURE AND APPLIED RESEARCH IN ENGINEERING AND TECHNOLOGY
 INTERNATIONAL JOURNAL OF PURE AND APPLIED RESEARCH IN ENGINEERING AND TECHNOLOGY A PATH FOR HORIZING YOUR INNOVATIVE WORK PACKET SNIFFING MS. SONALI A. KARALE 1, MS. PUNAM P. HARKUT 2 HVPM COET Amravati.
Aerohive Networks Inc. Free Bonjour Gateway FAQ
 Aerohive Networks Inc. Free Bonjour Gateway FAQ 1. About the Product... 1 2. Installation... 2 3. Management... 3 4. Troubleshooting... 4 1. About the Product What is the Aerohive s Free Bonjour Gateway?
Exhibit n.2: The layers of a hierarchical network
 3. Advanced Secure Network Design 3.1 Introduction You already know that routers are probably the most critical equipment piece in today s networking. Without routers, internetwork communication would
Beyond Monitoring Root-Cause Analysis
 WHITE PAPER With the introduction of NetFlow and similar flow-based technologies, solutions based on flow-based data have become the most popular methods of network monitoring. While effective, flow-based
- Hubs vs. Switches vs. Routers -
 1 Layered Communication - Hubs vs. Switches vs. Routers - Network communication models are generally organized into layers. The OSI model specifically consists of seven layers, with each layer representing
Cisco NetFlow TM Briefing Paper. Release 2.2 Monday, 02 August 2004
 Cisco NetFlow TM Briefing Paper Release 2.2 Monday, 02 August 2004 Contents EXECUTIVE SUMMARY...3 THE PROBLEM...3 THE TRADITIONAL SOLUTIONS...4 COMPARISON WITH OTHER TECHNIQUES...6 CISCO NETFLOW OVERVIEW...7
Managing Network Bandwidth to Maximize Performance
 Managing Network Bandwidth to Maximize Performance With increasing bandwidth demands, network professionals are constantly looking to optimize network resources, ensure adequate bandwidth, and deliver
IMPLEMENTING VOICE OVER IP
 51-20-78 DATA COMMUNICATIONS MANAGEMENT IMPLEMENTING VOICE OVER IP Gilbert Held INSIDE Latency is the Key; Compression; Interprocessing Delay; Network Access at Origin; Network Transmission Delay; Network
OptiView. Total integration Total control Total Network SuperVision. Network Analysis Solution. No one knows the value of an
 No one knows the value of an Network Analysis Solution Total integration Total control Total Network SuperVision integrated solution better than network engineers and Fluke Networks. Our Network Analysis
Intrusion Detection, Packet Sniffing
 Intrusion Detection, Packet Sniffing By : Eng. Ayman Amaireh Supervisor :Dr.: Lo'ai Tawalbeh New York Institute of Technology (NYIT)- Jordan s s campus-2006 12/2/2006 eng Ayman 1 What is a "packet sniffer"?
Web Analytics Understand your web visitors without web logs or page tags and keep all your data inside your firewall.
 Web Analytics Understand your web visitors without web logs or page tags and keep all your data inside your firewall. 5401 Butler Street, Suite 200 Pittsburgh, PA 15201 +1 (412) 408 3167 www.metronomelabs.com
This chapter covers four comprehensive scenarios that draw on several design topics covered in this book:
 This chapter covers four comprehensive scenarios that draw on several design topics covered in this book: Scenario One: Pearland Hospital Scenario Two: Big Oil and Gas Scenario Three: Beauty Things Store
Management Software. Web Browser User s Guide AT-S106. For the AT-GS950/48 Gigabit Ethernet Smart Switch. Version 1.0.0. 613-001339 Rev.
 Management Software AT-S106 Web Browser User s Guide For the AT-GS950/48 Gigabit Ethernet Smart Switch Version 1.0.0 613-001339 Rev. A Copyright 2010 Allied Telesis, Inc. All rights reserved. No part of
How To Monitor And Test An Ethernet Network On A Computer Or Network Card
 3. MONITORING AND TESTING THE ETHERNET NETWORK 3.1 Introduction The following parameters are covered by the Ethernet performance metrics: Latency (delay) the amount of time required for a frame to travel
Security+ Guide to Network Security Fundamentals, Fourth Edition. Chapter 6 Network Security
 Security+ Guide to Network Security Fundamentals, Fourth Edition Chapter 6 Network Security Objectives List the different types of network security devices and explain how they can be used Define network
Top-Down Network Design
 Top-Down Network Design Chapter Five Designing a Network Topology Copyright 2010 Cisco Press & Priscilla Oppenheimer Topology A map of an internetwork that indicates network segments, interconnection points,
Application-Centric Analysis Helps Maximize the Value of Wireshark
 Application-Centric Analysis Helps Maximize the Value of Wireshark The cost of freeware Protocol analysis has long been viewed as the last line of defense when it comes to resolving nagging network and
co Characterizing and Tracing Packet Floods Using Cisco R
 co Characterizing and Tracing Packet Floods Using Cisco R Table of Contents Characterizing and Tracing Packet Floods Using Cisco Routers...1 Introduction...1 Before You Begin...1 Conventions...1 Prerequisites...1
OptiView. Total integration Total control Total Network SuperVision. Network Analysis Solution. No one knows the value of an
 No one knows the value of an Network Analysis Solution Total integration Total control Total Network SuperVision integrated solution better than network engineers and Fluke Networks. Our Network Analysis
HOSTED VOICE Bring Your Own Bandwidth & Remote Worker. Install and Best Practices Guide
 HOSTED VOICE Bring Your Own Bandwidth & Remote Worker Install and Best Practices Guide 2 Thank you for choosing EarthLink! EarthLinks' best in class Hosted Voice phone service allows you to deploy phones
Firewall Defaults, Public Server Rule, and Secondary WAN IP Address
 Firewall Defaults, Public Server Rule, and Secondary WAN IP Address This quick start guide provides the firewall defaults and explains how to configure some basic firewall rules for the ProSafe Wireless-N
Smart Tips. Enabling WAN Load Balancing. Key Features. Network Diagram. Overview. Featured Products. WAN Failover. Enabling WAN Load Balancing Page 1
 Smart Tips Enabling WAN Load Balancing Overview Many small businesses today use broadband links such as DSL or Cable, favoring them over the traditional link such as T1/E1 or leased lines because of the
MANAGING NETWORK COMPONENTS USING SNMP
 MANAGING NETWORK COMPONENTS USING SNMP Abubucker Samsudeen Shaffi 1 Mohanned Al-Obaidy 2 Gulf College 1, 2 Sultanate of Oman. Email: [email protected] [email protected] Abstract:
51-30-60 DATA COMMUNICATIONS MANAGEMENT. Gilbert Held INSIDE
 51-30-60 DATA COMMUNICATIONS MANAGEMENT PROTECTING A NETWORK FROM SPOOFING AND DENIAL OF SERVICE ATTACKS Gilbert Held INSIDE Spoofing; Spoofing Methods; Blocking Spoofed Addresses; Anti-spoofing Statements;
CS514: Intermediate Course in Computer Systems
 : Intermediate Course in Computer Systems Lecture 7: Sept. 19, 2003 Load Balancing Options Sources Lots of graphics and product description courtesy F5 website (www.f5.com) I believe F5 is market leader
CCNA R&S: Introduction to Networks. Chapter 5: Ethernet
 CCNA R&S: Introduction to Networks Chapter 5: Ethernet 5.0.1.1 Introduction The OSI physical layer provides the means to transport the bits that make up a data link layer frame across the network media.
Note! The problem set consists of two parts: Part I: The problem specifications pages Part II: The answer pages
 Part I: The problem specifications NTNU The Norwegian University of Science and Technology Department of Telematics Note! The problem set consists of two parts: Part I: The problem specifications pages
Lab 2. CS-335a. Fall 2012 Computer Science Department. Manolis Surligas [email protected]
 Lab 2 CS-335a Fall 2012 Computer Science Department Manolis Surligas [email protected] 1 Summary At this lab we will cover: Basics of Transport Layer (TCP, UDP) Broadcast ARP DNS More Wireshark filters
Traffic Monitoring in a Switched Environment
 Traffic Monitoring in a Switched Environment InMon Corp. 1404 Irving St., San Francisco, CA 94122 www.inmon.com 1. SUMMARY This document provides a brief overview of some of the issues involved in monitoring
Application Performance Analysis and Troubleshooting
 Exam : 1T6-520 Title : Application Performance Analysis and Troubleshooting Version : DEMO 1 / 6 1. When optimizing application efficiency, an improvement in efficiency from the current 90% to an efficiency
Computer Networking. Definitions. Introduction
 Computer Networking Definitions DHCP Dynamic Host Configuration Protocol It assigns IP addresses to client devices, such as desktop computers, laptops, and phones, when they are plugged into Ethernet or
hp ProLiant network adapter teaming
 hp networking june 2003 hp ProLiant network adapter teaming technical white paper table of contents introduction 2 executive summary 2 overview of network addressing 2 layer 2 vs. layer 3 addressing 2
Hosted Voice. Best Practice Recommendations for VoIP Deployments
 Hosted Voice Best Practice Recommendations for VoIP Deployments Thank you for choosing EarthLink! EarthLinks best in class Hosted Voice phone service allows you to deploy phones anywhere with a Broadband
Analyzing Full-Duplex Networks
 Analyzing Full-Duplex Networks There are a number ways to access full-duplex traffic on a network for analysis: SPAN or mirror ports, aggregation TAPs (Test Access Ports), or full-duplex TAPs are the three
What is VLAN Routing?
 Application Note #38 February 2004 What is VLAN Routing? This Application Notes relates to the following Dell product(s): 6024 and 6024F 33xx Abstract Virtual LANs (VLANs) offer a method of dividing one
Deploying Probes and Analyzers in an Enterprise Environment
 Network Instruments White Paper Deploying Probes and Analyzers in an Enterprise Environment As an IT manager, you need visibility into every corner of the network, from the edge to the core. A distributed
SSVVP SIP School VVoIP Professional Certification
 SSVVP SIP School VVoIP Professional Certification Exam Objectives The SSVVP exam is designed to test your skills and knowledge on the basics of Networking, Voice over IP and Video over IP. Everything that
DEPLOYMENT GUIDE Version 1.1. DNS Traffic Management using the BIG-IP Local Traffic Manager
 DEPLOYMENT GUIDE Version 1.1 DNS Traffic Management using the BIG-IP Local Traffic Manager Table of Contents Table of Contents Introducing DNS server traffic management with the BIG-IP LTM Prerequisites
When Recognition Matters THE COMPARISON OF PROGRAMS FOR NETWORK MONITORING. www.pecb.com
 When Recognition Matters THE COMPARISON OF PROGRAMS FOR NETWORK MONITORING www.pecb.com Imagine a working environment comprised of a number of switches, routers, some terminals and file servers. Network
Any-to-any switching with aggregation and filtering reduces monitoring costs
 Any-to-any switching with aggregation and filtering reduces monitoring costs Summary Physical Layer Switches can filter and forward packet data to one or many monitoring devices. With intuitive graphical
INTRODUCTION TO VOICE OVER IP
 52-30-20 DATA COMMUNICATIONS MANAGEMENT INTRODUCTION TO VOICE OVER IP Gilbert Held INSIDE Equipment Utilization; VoIP Gateway; Router with Voice Modules; IP Gateway; Latency; Delay Components; Encoding;
Gaining Operational Efficiencies with the Enterasys S-Series
 Gaining Operational Efficiencies with the Enterasys S-Series Hi-Fidelity NetFlow There is nothing more important than our customers. Gaining Operational Efficiencies with the Enterasys S-Series Introduction
Sage ERP Accpac Online
 Sage ERP Accpac Online Mac Resource Guide Thank you for choosing Sage ERP Accpac Online. This Resource Guide will provide important information and instructions on how you can get started using your Mac
Observer Probe Family
 Observer Probe Family Distributed analysis for local and remote networks Monitor and troubleshoot vital network links in real time from any location Network Instruments offers a complete line of software
Sage 300 ERP Online. Mac Resource Guide. (Formerly Sage ERP Accpac Online) Updated June 1, 2012. Page 1
 Updated June 1, 2012. Page 1") Sage 300 ERP Online (Formerly Sage ERP Accpac Online) Mac Resource Guide Updated June 1, 2012 Page 1 Table of Contents 1.0 Introduction... 3 2.0 Getting Started with Sage 300 ERP Online using a Mac....
Sage 300 ERP Online (Formerly Sage ERP Accpac Online) Mac Resource Guide Updated June 1, 2012 Page 1 Table of Contents 1.0 Introduction... 3 2.0 Getting Started with Sage 300 ERP Online using a Mac....
How To Connect Xbox 360 Game Consoles to the Router by Ethernet cable (RJ45)?
?") Is it really necessary for the three ports mentioned in Troubleshooting (UDP 88, UDP 3074, and TCP 3074) to be opened for Xbox Live to work properly? Most cable/dsl routers implement Network Address Translation
Is it really necessary for the three ports mentioned in Troubleshooting (UDP 88, UDP 3074, and TCP 3074) to be opened for Xbox Live to work properly? Most cable/dsl routers implement Network Address Translation
LESSON 3.6. 98-366 Networking Fundamentals. Understand TCP/IP
 Understand TCP/IP Lesson Overview In this lesson, you will learn about: TCP/IP Tracert Telnet Netstat Reserved addresses Local loopback IP Ping Pathping Ipconfig Protocols Anticipatory Set Experiment with
Quick Start for Network Agent. 5-Step Quick Start. What is Network Agent?
 What is Network Agent? The Websense Network Agent software component uses sniffer technology to monitor all of the internet traffic on the network machines that you assign to it. Network Agent filters
Broadband Phone Gateway BPG510 Technical Users Guide
 Broadband Phone Gateway BPG510 Technical Users Guide (Firmware version 0.14.1 and later) Revision 1.0 2006, 8x8 Inc. Table of Contents About your Broadband Phone Gateway (BPG510)... 4 Opening the BPG510's
Ranch Networks for Hosted Data Centers
 Ranch Networks for Hosted Data Centers Internet Zone RN20 Server Farm DNS Zone DNS Server Farm FTP Zone FTP Server Farm Customer 1 Customer 2 L2 Switch Customer 3 Customer 4 Customer 5 Customer 6 Ranch
Customer Tips. Network Packet Analyzer Tips. for the user. Purpose. Introduction to Packet Capture. Xerox Multifunction Devices.
 Xerox Multifunction Devices Customer Tips January 15, 2004 This document applies to these Xerox products: Network Packet Analyzer Tips Purpose This document contains a procedure that Xerox customers can
ESSENTIALS. Understanding Ethernet Switches and Routers. April 2011 VOLUME 3 ISSUE 1 A TECHNICAL SUPPLEMENT TO CONTROL NETWORK
 VOLUME 3 ISSUE 1 A TECHNICAL SUPPLEMENT TO CONTROL NETWORK Contemporary Control Systems, Inc. Understanding Ethernet Switches and Routers This extended article was based on a two-part article that was
Network Agent Quick Start
 Network Agent Quick Start Topic 50500 Network Agent Quick Start Updated 17-Sep-2013 Applies To: Web Filter, Web Security, Web Security Gateway, and Web Security Gateway Anywhere, v7.7 and 7.8 Websense
Voice over IP. Demonstration 1: VoIP Protocols. Network Environment
 Voice over IP Demonstration 1: VoIP Protocols Network Environment We use two Windows workstations from the production network, both with OpenPhone application (figure 1). The OpenH.323 project has developed
Mike Canney Principal Network Analyst getpackets.com
 Mike Canney Principal Network Analyst getpackets.com 1 My contact info contact Mike Canney, Principal Network Analyst, getpackets.com [email protected] 319.389.1137 2 Capture Strategies capture Capture
Implementation of Virtual Local Area Network using network simulator
 1060 Implementation of Virtual Local Area Network using network simulator Sarah Yahia Ali Department of Computer Engineering Techniques, Dijlah University College, Iraq ABSTRACT Large corporate environments,
Troubleshooting TCP/IP Networks with Wireshark
 Troubleshooting TCP/IP Networks with Wireshark Eğitim Tipi ve Süresi: 5 Days VILT Troubleshooting TCP/IP Networks with Wireshark Learn to use Wireshark to troubleshoot TCP/IP networks while preparing for
Cover. White Paper. (nchronos 4.1)
") Cover White Paper (nchronos 4.1) Copyright Copyright 2013 Colasoft LLC. All rights reserved. Information in this document is subject to change without notice. No part of this document may be reproduced
Cover White Paper (nchronos 4.1) Copyright Copyright 2013 Colasoft LLC. All rights reserved. Information in this document is subject to change without notice. No part of this document may be reproduced
UIP1868P User Interface Guide
 UIP1868P User Interface Guide (Firmware version 0.13.4 and later) V1.1 Monday, July 8, 2005 Table of Contents Opening the UIP1868P's Configuration Utility... 3 Connecting to Your Broadband Modem... 4 Setting
Intelligent Network Monitoring for Your LAN, WAN and ATM Network
 Intelligent Network Monitoring for Your LAN, WAN and ATM Network Solutions ZettaE2E Intelligent Network Monitoring for Your LAN, WAN and ATM Network Key Benefits Reduce current and future LAN, WAN and