Graphical Analyses of Clinical Trial Safety Data
|
|
|
- Avice Berry
- 9 years ago
- Views:
Transcription
1 Graphical Analyses of Clinical Trial Safety Data Haijun Ma, Kefei Zhou, Amy ia, Matt Austin, George Li, Michael Connell 08/10/07, GBE Scientific Forum

2 verview Current situation of clinical trial safety analyses Examples of statistical graphs used in safety analyses environment Summary 2

3 Clinical Trial Safety Analysis Safety assessment is crucial in drug development As part of risk management, safety data should be continuously monitored Current practice and available tools are not up to standard Recognize the need to develop new tools for reviewing, presenting and analyzing clinical trial safety data 3

4 Reviewing Safety Data 4

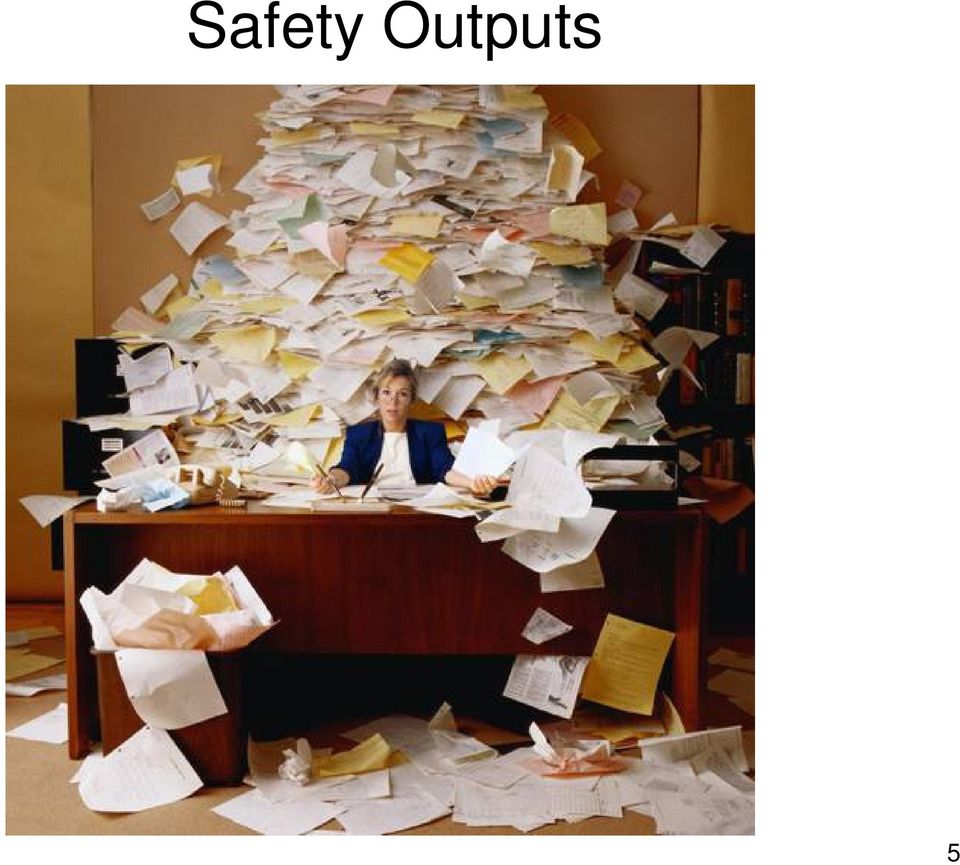
5 Safety utputs 5
6 Building Blocks in Safety Analysis Standards for clinical trial data (CDISC) Clinical Data Interchange Standards Consortium Approaches to coding of adverse events and MedDRA search strategies for use in clinical trial event counting and analysis Software tools for data access, exploration, analysis Modern statistical metrics to characterize event rates, risk and risk factors Some visual graphs and displays to facilitate understanding Robert T. Neill, Director, ffice of Biostatistics, CDER, FDA, Signal Detection in Clinical Trials, 19 th Annual DIA Euromeeting 6

7 Graphical Analyses A graph is worth words Statistical graphics are useful tools for exploring data, aiding inference and communicating results Display large data coherently Maximize the ability to detect unusual features Facilitate communication with: regulators, investigators, collaborators, upper management, DMC, etc. 7

8 Application Examples of statistical graphs used to better visualize different types of clinical trial safety data and facilitate safety signal detection. Graphics tool-box in development Some questions to answer Which AEs are elevated in treatment vs. placebo? Any special patterns of AE onset? What is the trend of treatment effects on safety outcomes over time? Which patients have abrupt changes in lab tests? Is there temporal causality of drug intake? 8

9 Clinical Safety Data Data types: Adverse Event Data Lab Data ther Data: demographic, exposure, vital signs, conmed, etc. Level of details: Group level information display Individual level information display 9

10 Demographic data Drug exposure 10
11 Table 2.1. Baseline Demographics (Subjects Exposed to Study Drug) Placebo (N=165) Study Drug A (N=164) Total (N=329) Sex - n(%) Female 65 (39.4) 64 (39.0) 129 (39.2) Male 100 (60.6) 100 (61.0) 200 (60.8) Race - n(%) Caucasian 136 (82) 135 (82) 271 (82) African American 6 (4) 8 (5) 14 (4) Hispanic 13 (8) 10 (6) 23 (7) Asian 6 (4) 7 (4) 13 (4) Japanese 2 (1) 2 (1) 4 (1) American Indian 0 (0) 1 (1) 1 (0) Native Hawaiian 0 (0) 0 (0) 0 (0) ther 2 (1) 1 (1) 3 (1) 11
 Race - n(%) Caucasian 136 (82) 135 (82) 271 (82) African American 6 (4) 8 (5) 14 (4) Hispanic 13 (8) 10 (6) 23")
12 Baseline Demographics 12

13 Table 1.1 Summary of Subject-year Follow-up (Subjects Exposed to Study Drug) (Study ) N Placebo (N=184) Subjects Exposed to Study Drug (Subject-years) 182 Study Drug A (N=224) 224 Total (N=406) 406 Total Duration Exposed to Study Drug (Days) n Mean SD Median Q1, Q , , , Min, Max 6.0, , ,
 n 182 224 406 Mean 947.2 916.3 930.14 SD 302.01 321.81 313.")
14 Summary of Safety Subjects Exposure by Treatment mean Placebo 50% Inter-quartile median Drug A Central 95% Days on Study 14

15 Number of Subjects on Study Summary of Safety Subjects Exposure by Treatment Placebo Drug A Days from Randomization Vertical bars indicate withdrawals from study due to AE. Placebo Drug A Placebo n :182 Min.: 6.0 1st Qu.: Median: Mean: rd Qu.: Max.: Drug A n :224 Min.: st Qu.: Median: Mean: rd Qu.: Max.: Days on Study 15

16 Adverse events data 16
17 Table 2. Subject Incidence of All Treatment Emergent Adverse Events by Preferred Term in Descending rder of Frequency (Subjects Exposed to Study Drug) PREFERRED TERM Placebo (N = 184) n (%) Drug A (N = 224) n (%) Number of Subjects Reporting Any Adverse Events 146 (79.3) 195 (87.0) CNSTIPATIN 43 (23.4) 59 (26.3) ASTHENIA 32 (17.4) 39 (17.4) BACK PAIN 27 (14.7) 37 (16.5) BNE PAIN 23 (12.5) 34 (15.1) FATIGUE 22 (12.0) 29 (12.9) HYPCALCAEMIA 5 (2.7) 16 (7.1) INSMNIA 22 (12.0) 10 (4.5) DIZZINESS 5 (2.7) 0 (0) 17
 195 (87.0) CNSTIPATIN 43 (23.4) 59 (26.3) ASTHENIA 32 (17.4) 39 (17.4) BACK PAIN 27 (14.7) 37 (16.5) BNE PAIN 23 (12.")
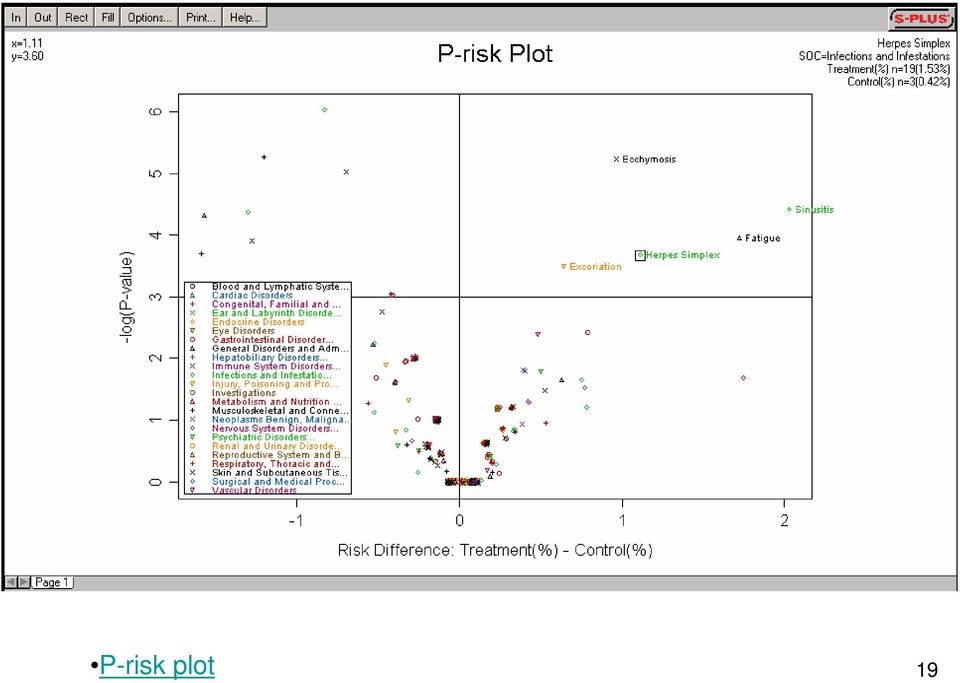
18 AE dot plot by descending order of frequency AE dot plot by descending order of risk difference 18

19 P-risk plot 19
20 Seriouse Adverse Events Incidences (%) Drug A Placebo 0-6 mon 7-12 mon mon mon Time on Study 20

21 Distribution of Days on Study to AE nset for Subjects with AE Time to AE nset (Days) mon 18 mon 12 mon 6 mon # Events in Placebo # Events in Drug A 21
22 Lab test data 22
23 Lab shift Plots 23
24 24
25 Corrected Calcium (mmol/l) Change of Albumin Corrected Calcium over Time by Creatinine Abnormality Grade Drug A Placebo n study days Creatinine increase baseline to worst on study grade shift = 1 Corrected Calcium (mmol/l) Drug A Placebo n study days Creatinine increase baseline to worst on study grade shift = 2 25
26 B PLT Albumin [g/l] Control Treatment Month 26
27 Figure 7.1. Mean (SD) Blood Pressure Subgrouped by Therapy ver Visit Weeks Safety Analysis Set Mean (SD) Blood Pressure (mmhg) N= N= N= N= Study Week 27
28 Patient Profile Simultaneous display of large amount of relevant information of a subject Efficiently establish safety profile of a subject Easier to see drug effect, drug/drug interaction, connections between lab test and adverse events, etc. 28
29 Patient Profile Basic info: demog, treatment, visit time, dosing Lab values serious AE/SAEs non-serious ongoing Concomitant medications resolved 29
30 Patient Profile Legend Different symbols/colors to distinguish severity, seriousness Arrow to indicate whether AE/conMed resolved 30
31 Summary Graphics are powerful in concisely and efficiently conveying multiple pieces of safety information Graphics are useful for efficacy analysis as well Graphs are not cure-all, should be used in combination with other statistical analyses methods and display formats There is a need for standardized statistical graphical language across industry and regulatory SPs on validation of graphic outputs are needed New tools and processes will facilitate signal detection and clinical trial safety management Still much to be done in this area 31
32 Reference had Amit, Understanding Patients Safety Through Use of Statistical Graphics. William Blackwell, Tools for Data Mining and Signal Detection, DIA 19 th Annual EuroMeeting Simon Day, Signal Detection from Clinical Trial Databases Trevor Gibbs, Pharmacovigilance and Risk Management. DIA 19 th Euro meeting talk Michael Connell, Graphic analysis and reporting of safety data, 42th DIA annual meeting talk Robert T. Neill, Signal Detection in Clinical Trials Some perspectives on New tools and Processes - A Critical Path Update, 19th Annual DIA Euromeeting 32
33 Acknowledgement Rachel Flodin Springer Li Ying Tian Bob Treder Jenny Yuan 33
34
35 Back-up Slides 35
36 Clinical Trial Safety Analysis Safety data are often collected concomitantly in clinical trials - lack of proactive planning Safety analyses are usually descriptive in nature - lack of power Safety data and analysis results often reported in form of tables and listings not easy to review and interpret 36
37 How to Lie With Statistics Huff s timeless 1954 classic, How to Lie With Statistics. A beginning playbook might read as follows. mit sample size, confidence, and any greeks ( The blindfolded leading the blind. ) Sample high, but use a flawed methodology to drive action from biased conclusions ( Measure with a micrometer, mark with a crayon, cut with an axe. ) Sample low, or at least sub-sample until the means tell an insightful story ( Throw it against the wall and see what sticks. kay, throw it again. ) 37
38 Summary of Safety Subjects Exposure by Treatment mean Placebo 50% Inter-quartile median Drug A Central 95% Days on Study 38
39 Number of Subjects on Study Summary of Safety Subjects Exposure by Treatment Drug A Placebo Days from Randomization Vertical bars indicate withdrawals from study due to AE. Days on Study Drug A Placebo Drug A n :224 Min.: st Qu.: Median: Mean: rd Qu.: Max.: Placebo n :182 Min.: 6.0 1st Qu.: Median: Mean: rd Qu.: Max.:
40 Lab Scatter Plot 300 Treatment Control SGT ALP BILI.TL ALB SGPT SGT ALP BILI.TL 40
41 Baseline Lab Values Drug A Placebo SGPT40 60 SGPT SGT SGT PHS PHS CREAT CREAT CA.CR CA.CR ALP ALP
42 Glucose by Time 42
Optimizing Safety Surveillance During Clinical Trials Using Data Visualization Tools
 Optimizing Safety Surveillance During Clinical Trials Using Data Visualization Tools Laura McKain, M.D., Medical Director, Pharmacovigilance; Tammy Jackson, Director, Preclarus Development, Clinical Innovation;
ABSTRACT INTRODUCTION PATIENT PROFILES SESUG 2012. Paper PH-07
 Paper PH-07 Developing a Complete Picture of Patient Safety in Clinical Trials Richard C. Zink, JMP Life Sciences, SAS Institute, Cary, NC, United States Russell D. Wolfinger, JMP Life Sciences, SAS Institute,
CDISC Data Standards Can Facilitate Composition of Adverse Event Narratives
 CDISC Data Standards Can Facilitate Composition of Adverse Event Narratives Anisa Scott, Ph.D. and Richard C. Zink, Ph.D. JMP Life Sciences SAS Institute, Inc. [email protected] Copyright 2010 SAS Institute
Introduction to Post marketing Drug Safety Surveillance: Pharmacovigilance in FDA/CDER
 Introduction to Post marketing Drug Safety Surveillance: Pharmacovigilance in FDA/CDER LT Andrew Fine, Pharm.D., BCPS Safety Evaluator Division of Pharmacovigilance Office of Pharmacovigilance and Epidemiology
Bridging Statistical Analysis Plan and ADaM Datasets and Metadata for Submission
 , October 24-26, 2012, San Francisco, USA Bridging Statistical Analysis Plan and ADaM Datasets and Metadata for Submission Abstract In this article, the relationship between the Statistical Analysis Plan
SAS CLINICAL TRAINING
 SAS CLINICAL TRAINING Presented By 3S Business Corporation Inc www.3sbc.com Call us at : 281-823-9222 Mail us at : [email protected] Table of Contents S.No TOPICS 1 Introduction to Clinical Trials 2 Introduction
PharmaSUG 2013 - Paper DG06
 PharmaSUG 2013 - Paper DG06 JMP versus JMP Clinical for Interactive Visualization of Clinical Trials Data Doug Robinson, SAS Institute, Cary, NC Jordan Hiller, SAS Institute, Cary, NC ABSTRACT JMP software
Guidance for Industry Diabetes Mellitus Evaluating Cardiovascular Risk in New Antidiabetic Therapies to Treat Type 2 Diabetes
 Guidance for Industry Diabetes Mellitus Evaluating Cardiovascular Risk in New Antidiabetic Therapies to Treat Type 2 Diabetes U.S. Department of Health and Human Services Food and Drug Administration Center
South Dakota DOE 2013-2014 Report Card
 School Classification: Focus Title I Designation: Schoolwide Performance Indicators * No bar will display at the school or district level if the subgroup does not meet minimum size for reporting purposes.
Sponsor Novartis. Generic Drug Name Secukinumab. Therapeutic Area of Trial Psoriasis. Approved Indication investigational
 Clinical Trial Results Database Page 2 Sponsor Novartis Generic Drug Name Secukinumab Therapeutic Area of Trial Psoriasis Approved Indication investigational Clinical Trial Results Database Page 3 Study
Copyright 2012, SAS Institute Inc. All rights reserved. VISUALIZATION OF STANDARD TLFS FOR CLINICAL TRIAL DATA ANALYSIS
 VISUALIZATION OF STANDARD TLFS FOR CLINICAL TRIAL DATA ANALYSIS WENJUN BAO AND JASON CHEN JMP, SAS INC. PHUSE, SHANGHAI, NOV 28, 2014 OUTLINES: CDISC Standard SDTM ADaM Interactive Standardized TLFs Tables
Organizing Your Approach to a Data Analysis
 Biost/Stat 578 B: Data Analysis Emerson, September 29, 2003 Handout #1 Organizing Your Approach to a Data Analysis The general theme should be to maximize thinking about the data analysis and to minimize
Novartis Gilenya FDO Program Clinical Protocol and Highlights from Prescribing Information (PI)
") Novartis Gilenya FDO Program Clinical Protocol and Highlights from Prescribing Information (PI) Highlights from Prescribing Information - the link to the full text PI is as follows: http://www.pharma.us.novartis.com/product/pi/pdf/gilenya.pdf
Novartis Gilenya FDO Program Clinical Protocol and Highlights from Prescribing Information (PI) Highlights from Prescribing Information - the link to the full text PI is as follows: http://www.pharma.us.novartis.com/product/pi/pdf/gilenya.pdf
Pharmaceutical Applications
 Integrated Summary of Safety and Efficacy Programming for Studies Using Electronic Data Capture Changhong Shi, Merck & Co., Inc., Rahway, NJ Qing Xue, Merck & Co., Inc., Rahway, NJ ABSTRACT The Integrated
Subject: No. Page PROTOCOL AND CASE REPORT FORM DEVELOPMENT AND REVIEW Standard Operating Procedure
 703 1 of 11 POLICY The Beaumont Research Coordinating Center (BRCC) will provide advice to clinical trial investigators on protocol development, content and format. Upon request, the BRCC will review a
This clinical study synopsis is provided in line with Boehringer Ingelheim s Policy on Transparency and Publication of Clinical Study Data.
 abcd Clinical Study for Public Disclosure This clinical study synopsis is provided in line with s Policy on Transparency and Publication of Clinical Study Data. The synopsis which is part of the clinical
GENERAL INFORMATION. Adverse Event (AE) Definition (ICH GUIDELINES E6 FOR GCP 1.2):
 Definition (ICH GUIDELINES E6 FOR GCP 1.2):") Make copies of the blank SAE report form as needed. Retain originals with confirmation of all information faxed to DMID Pharmacovigilance Group Clinical Research Operations and Management Support (CROMS
Make copies of the blank SAE report form as needed. Retain originals with confirmation of all information faxed to DMID Pharmacovigilance Group Clinical Research Operations and Management Support (CROMS
2.0 Synopsis. Vicodin CR (ABT-712) M05-765 Clinical Study Report R&D/07/095. (For National Authority Use Only) to Part of Dossier: Volume:
 M05-765 Clinical Study Report R&D/07/095. (For National Authority Use Only) to Part of Dossier: Volume:") 2.0 Synopsis Abbott Laboratories Name of Study Drug: Vicodin CR Name of Active Ingredient: Hydrocodone/Acetaminophen Extended Release (ABT-712) Individual Study Table Referring to Part of Dossier: Volume:
2.0 Synopsis Abbott Laboratories Name of Study Drug: Vicodin CR Name of Active Ingredient: Hydrocodone/Acetaminophen Extended Release (ABT-712) Individual Study Table Referring to Part of Dossier: Volume:
StARScope: A Web-based SAS Prototype for Clinical Data Visualization
 Paper 42-28 StARScope: A Web-based SAS Prototype for Clinical Data Visualization Fang Dong, Pfizer Global Research and Development, Ann Arbor Laboratories Subra Pilli, Pfizer Global Research and Development,
Guidance for Industry
 Guidance for Industry End-of-Phase 2A Meetings U.S. Department of Health and Human Services Food and Drug Administration Center for Drug Evaluation and Research (CDER) September 2009 Procedural Guidance
Clinical Trials Terminology for SAS Programmers
 Paper TU03 Clinical Trials Terminology for SAS Programmers Sy Truong, Meta-Xceed, Inc, Fremont, CA ABSTRACT The drug development process is a clinical process that has its own language. It is not required
The Product Review Life Cycle A Brief Overview
 Stat & Quant Mthds Pharm Reg (Spring 2, 2014) Lecture 2,Week 1 1 The review process developed over a 40 year period and has been influenced by 5 Prescription User Fee Act renewals Time frames for review
Guidance for Industry Determining the Extent of Safety Data Collection Needed in Late Stage Premarket and Postapproval Clinical Investigations
 Guidance for Industry Determining the Extent of Safety Data Collection Needed in Late Stage Premarket and Postapproval Clinical Investigations DRAFT GUIDANCE This guidance document is being distributed
Viral Hepatitis Case Report
 Page 1 of 9 Viral Hepatitis Case Report Perinatal Hepatitis B Virus Infection Michigan Department of Community Health Communicable Disease Division Investigation Information Investigation ID Onset Date
STATS8: Introduction to Biostatistics. Data Exploration. Babak Shahbaba Department of Statistics, UCI
 STATS8: Introduction to Biostatistics Data Exploration Babak Shahbaba Department of Statistics, UCI Introduction After clearly defining the scientific problem, selecting a set of representative members
SUGI 29 Posters. Web Server
 Paper 151-29 Clinical Trial Online Running SAS. on the Web without SAS/IntrNet. Quan Ren ABSTRACT During clinical trial, it is very important for the project management to have the most recent updated
Visualizing Clinical Trial Data Matt Becker, SAS Institute
 Visualizing Clinical Trial Data Matt Becker, SAS Institute ABSTRACT Today, all employees at health and life science corporations may need access to view operational data. There may be visualization needs
Adopting Site Quality Management to Optimize Risk-Based Monitoring
 Adopting Site Quality Management to Optimize Risk-Based Monitoring Medidata and other marks used herein are trademarks of Medidata Solutions, Inc. All other trademarks are the property of their respective
Week 12 study results
 Week 12 study results 15 April 2015 Copyright 2015 Galapagos NV Disclaimer This document may contain certain statements, including forward-looking statements, such as statements concerning the safety and
Guidance for Industry
 Guidance for Industry Cancer Drug and Biological Products Clinical Data in Marketing Applications U.S. Department of Health and Human Services Food and Drug Administration Center for Drug Evaluation and
Sponsor. Novartis Generic Drug Name. Vildagliptin. Therapeutic Area of Trial. Type 2 diabetes. Approved Indication. Investigational.
 Clinical Trial Results Database Page 1 Sponsor Novartis Generic Drug Name Vildagliptin Therapeutic Area of Trial Type 2 diabetes Approved Indication Investigational Study Number CLAF237A2386 Title A single-center,
And Now, Presenting...
 Presentation and Handling of Clinical Laboratory Data From Test Tube to Table Randall K. Carlson, Wilmington, DE and Nate Freimark, Lakewood, NJ Omnicare Clinical Research. Inc. INTRODUCTION In human clinical
We are used to the idea of measurement in the general practice of
 This article describes some key considerations for organizations as they review their approach to metrics or as they begin developing a key set of metrics. Keith Dorricott, BSc Using Metrics to Direct
Competency 1 Describe the role of epidemiology in public health
 The Northwest Center for Public Health Practice (NWCPHP) has developed competency-based epidemiology training materials for public health professionals in practice. Epidemiology is broadly accepted as
Humulin (LY041001) Page 1 of 1
 Page 1 of 1") (LY041001) These clinical study results are supplied for informational purposes only in the interests of scientific disclosure. They are not intended to substitute for the FDA-approved package insert or
(LY041001) These clinical study results are supplied for informational purposes only in the interests of scientific disclosure. They are not intended to substitute for the FDA-approved package insert or
Form B-1. Inclusion form for the effectiveness of different methods of toilet training for bowel and bladder control
 Form B-1. Inclusion form for the effectiveness of different methods of toilet training for bowel and bladder control Form B-2. Assessment of methodology for non-randomized controlled trials for the effectiveness
An Application of the G-formula to Asbestos and Lung Cancer. Stephen R. Cole. Epidemiology, UNC Chapel Hill. Slides: www.unc.
 An Application of the G-formula to Asbestos and Lung Cancer Stephen R. Cole Epidemiology, UNC Chapel Hill Slides: www.unc.edu/~colesr/ 1 Acknowledgements Collaboration with David B. Richardson, Haitao
How to build ADaM from SDTM: A real case study
 PharmaSUG2010 - Paper CD06 How to build ADaM from SDTM: A real case study JIAN HUA (DANIEL) HUANG, FOREST LABORATORIES, NJ ABSTRACT: Building analysis data based on the ADaM model is highly recommended
Monitoring Clinical Trials with a SAS Risk-Based Approach
 Paper DH05 Monitoring Clinical Trials with a SAS Risk-Based Approach Laurie Rose, SAS, Cary, NC USA ABSTRACT With global regulatory encouragement, the life sciences industry is gaining momentum to embrace
PharmaSUG 2015 - Paper DV05
 PharmaSUG 2015 - Paper DV05 Techniques of Preparing Datasets for Visualizing Clinical Laboratory Data Amos Shu, MedImmune, Gaithersburg, MD Victor Sun, MedImmune, Gaithersburg, MD ABSTRACT Visualizing
Analysis and Interpretation of Clinical Trials. How to conclude?
 www.eurordis.org Analysis and Interpretation of Clinical Trials How to conclude? Statistical Issues Dr Ferran Torres Unitat de Suport en Estadística i Metodología - USEM Statistics and Methodology Support
SAE Reconciliation process
 SAE Reconciliation process Barbara Inversini Data Manager Biostatistics, Data Management and Clinical Systems Department Rottapharm - Monza Definition of SAEs Reconciliation 1. Serious adverse events data
U.S. Food and Drug Administration
 U.S. Food and Drug Administration Notice: Archived Document The content in this document is provided on the FDA s website for reference purposes only. It was current when produced, but is no longer maintained
Exploratory data analysis (Chapter 2) Fall 2011
 Fall 2011") Exploratory data analysis (Chapter 2) Fall 2011 Data Examples Example 1: Survey Data 1 Data collected from a Stat 371 class in Fall 2005 2 They answered questions about their: gender, major, year in school,
Exploratory data analysis (Chapter 2) Fall 2011 Data Examples Example 1: Survey Data 1 Data collected from a Stat 371 class in Fall 2005 2 They answered questions about their: gender, major, year in school,
Systolic Blood Pressure Intervention Trial (SPRINT) Principal Results
 Principal Results") Systolic Blood Pressure Intervention Trial (SPRINT) Principal Results Paul K. Whelton, MB, MD, MSc Chair, SPRINT Steering Committee Tulane University School of Public Health and Tropical Medicine, and
Systolic Blood Pressure Intervention Trial (SPRINT) Principal Results Paul K. Whelton, MB, MD, MSc Chair, SPRINT Steering Committee Tulane University School of Public Health and Tropical Medicine, and
First In Human Pediatric Trials and Safety Assessment for Rare and Orphan Diseases
 First In Human Pediatric Trials and Safety Assessment for Rare and Orphan Diseases Andrew E. Mulberg, MD, FAAP Division Deputy Director OND/ODE3/DGIEP FDA Partnership is the Key Coming together is a beginning;
The Prevention and Treatment of Missing Data in Clinical Trials: An FDA Perspective on the Importance of Dealing With It
 nature publishing group The Prevention and Treatment of Missing Data in Clinical Trials: An FDA Perspective on the Importance of Dealing With It RT O Neill 1 and R Temple 2 At the request of the Food and
Appendix G STATISTICAL METHODS INFECTIOUS METHODS STATISTICAL ROADMAP. Prepared in Support of: CDC/NCEH Cross Sectional Assessment Study.
 Appendix G STATISTICAL METHODS INFECTIOUS METHODS STATISTICAL ROADMAP Prepared in Support of: CDC/NCEH Cross Sectional Assessment Study Prepared by: Centers for Disease Control and Prevention National
Active centers: 2. Number of patients/subjects: Planned: 20 Randomized: Treated: 20 Evaluated: Efficacy: 13 Safety: 20
 These results are supplied for informational purposes only. Prescribing decisions should be made based on the approved package insert in the country of prescription Sponsor/company: sanofi-aventis ClinialTrials.gov
Lecture 1: Review and Exploratory Data Analysis (EDA)
") Lecture 1: Review and Exploratory Data Analysis (EDA) Sandy Eckel [email protected] Department of Biostatistics, The Johns Hopkins University, Baltimore USA 21 April 2008 1 / 40 Course Information I Course
Lecture 1: Review and Exploratory Data Analysis (EDA) Sandy Eckel [email protected] Department of Biostatistics, The Johns Hopkins University, Baltimore USA 21 April 2008 1 / 40 Course Information I Course
U.S. Scientific Update Aricept 23 mg Tablets. Dr. Lynn Kramer President NeuroScience Product Creation Unit Eisai Inc.
 U.S. Scientific Update Aricept 23 mg Tablets Dr. Lynn Kramer President NeuroScience Product Creation Unit Eisai Inc. Unmet Need in Moderate to Severe Alzheimer s Disease (AD) Ongoing clinical deterioration
WHITE PAPER. CONVERTING SDTM DATA TO ADaM DATA AND CREATING SUBMISSION READY SAFETY TABLES AND LISTINGS. SUCCESSFUL TRIALS THROUGH PROVEN SOLUTIONS
 WHITE PAPER CONVERTING SDTM DATA TO ADaM DATA AND CREATING SUBMISSION READY SAFETY TABLES AND LISTINGS. An innovative approach to deliver statistical analysis and data in a CDISC ADaM complient manner
Perspectives on GCP and Clinical Research Training of Physicians
 Perspectives on GCP and Clinical Research Training of Physicians Michael Koren, MD, FACC, CPI, CEO, Jacksonville Center for Clinical Research Presented by Jonathan Seltzer, MD, MA,MBA,FACC, President,
SYNOPSIS. 2-Year (0.5 DB + 1.5 OL) Addendum to Clinical Study Report
 Addendum to Clinical Study Report") Name of Sponsor/Company: Bristol-Myers Squibb Name of Finished Product: Abatacept () Name of Active Ingredient: Abatacept () Individual Study Table Referring to the Dossier (For National Authority Use
Name of Sponsor/Company: Bristol-Myers Squibb Name of Finished Product: Abatacept () Name of Active Ingredient: Abatacept () Individual Study Table Referring to the Dossier (For National Authority Use
Statistics and Pharmacokinetics in Clinical Pharmacology Studies
 Paper ST03 Statistics and Pharmacokinetics in Clinical Pharmacology Studies ABSTRACT Amy Newlands, GlaxoSmithKline, Greenford UK The aim of this presentation is to show how we use statistics and pharmacokinetics
Descriptive statistics Statistical inference statistical inference, statistical induction and inferential statistics
 Descriptive statistics is the discipline of quantitatively describing the main features of a collection of data. Descriptive statistics are distinguished from inferential statistics (or inductive statistics),
PharmaSUG2010 - Paper HS01. CDASH Standards for Medical Device Trials: CRF Analysis. Parag Shiralkar eclinical Solutions, a Division of Eliassen Group
 PharmaSUG2010 - Paper HS01 CDASH Standards for Medical Device Trials: CRF Analysis Parag Shiralkar eclinical Solutions, a Division of Eliassen Group Jennie Tedrow Boston Scientific Kit Howard Kestrel Consultants
CSU, Fresno - Institutional Research, Assessment and Planning - Dmitri Rogulkin
 My presentation is about data visualization. How to use visual graphs and charts in order to explore data, discover meaning and report findings. The goal is to show that visual displays can be very effective
Guideline for Industry
 Guideline for Industry The Extent of Population Exposure to Assess Clinical Safety: For Drugs Intended for Longterm Treatment of Non-Life- Threatening Conditions ICH-E1A March 1995 GUIDELINE FOR INDUSTRY
STATISTICA. Clustering Techniques. Case Study: Defining Clusters of Shopping Center Patrons. and
 Clustering Techniques and STATISTICA Case Study: Defining Clusters of Shopping Center Patrons STATISTICA Solutions for Business Intelligence, Data Mining, Quality Control, and Web-based Analytics Table
Treatment for Adolescent Substance Use Disorders: What Works?
 Treatment for Adolescent Substance Use Disorders: What Works? Mark W. Lipsey Emily E. Tanner-Smith Sandra J. Wilson Peabody Research Institute, Vanderbilt University Addiction Health Services Research
BIAsp30 A 1 chieve Tehran 31 July 2015
 BIAsp30 A 1 chieve Tehran 31 July 2015 Beginning insulin with biphasic insulin aspart 30: experience from the A 1 chieve study Professor Philip Home Newcastle University Presenter and sponsor duality of
Opioid Treatment Program Participant Satisfaction Survey
 Opioid Treatment Program Participant Satisfaction Survey Please complete the following information prior to completing the survey. Gender: Male Female Transgender Race: African American Caucasian Hispanic
Clinical Study Synopsis
 Clinical Study Synopsis This Clinical Study Synopsis is provided for patients and healthcare professionals to increase the transparency of Bayer's clinical research. This document is not intended to replace
Tutorial 3: Graphics and Exploratory Data Analysis in R Jason Pienaar and Tom Miller
 Tutorial 3: Graphics and Exploratory Data Analysis in R Jason Pienaar and Tom Miller Getting to know the data An important first step before performing any kind of statistical analysis is to familiarize
Bringing Order to Your Clinical Data Making it Manageable and Meaningful
 CLINICAL DATA MANAGEMENT Bringing Order to Your Clinical Data Making it Manageable and Meaningful eclinicalsol.com DATA IS SIMPLY BEAUTIFUL DATA STACKS IN STANDARD FORMATION This imaginative visual suggests
1.0 Abstract. Title: Real Life Evaluation of Rheumatoid Arthritis in Canadians taking HUMIRA. Keywords. Rationale and Background:
 1.0 Abstract Title: Real Life Evaluation of Rheumatoid Arthritis in Canadians taking HUMIRA Keywords Rationale and Background: This abbreviated clinical study report is based on a clinical surveillance
USUAL WEEKLY EARNINGS OF WAGE AND SALARY WORKERS FIRST QUARTER 2015
 For release 10:00 a.m. (EDT) Tuesday, April 21, USDL-15-0688 Technical information: (202) 691-6378 [email protected] www.bls.gov/cps Media contact: (202) 691-5902 [email protected] USUAL WEEKLY EARNINGS
Basic Statistics and Data Analysis for Health Researchers from Foreign Countries
 Basic Statistics and Data Analysis for Health Researchers from Foreign Countries Volkert Siersma [email protected] The Research Unit for General Practice in Copenhagen Dias 1 Content Quantifying association
NCT00272090. sanofi-aventis HOE901_3507. insulin glargine
 These results are supplied for informational purposes only. Prescribing decisions should be made based on the approved package insert in the country of prescription Sponsor/company: Generic drug name:
Data Exploration Data Visualization
 Data Exploration Data Visualization What is data exploration? A preliminary exploration of the data to better understand its characteristics. Key motivations of data exploration include Helping to select
EXPANDING THE EVIDENCE BASE IN OUTCOMES RESEARCH: USING LINKED ELECTRONIC MEDICAL RECORDS (EMR) AND CLAIMS DATA
 AND CLAIMS DATA") EXPANDING THE EVIDENCE BASE IN OUTCOMES RESEARCH: USING LINKED ELECTRONIC MEDICAL RECORDS (EMR) AND CLAIMS DATA A CASE STUDY EXAMINING RISK FACTORS AND COSTS OF UNCONTROLLED HYPERTENSION ISPOR 2013 WORKSHOP
EXPANDING THE EVIDENCE BASE IN OUTCOMES RESEARCH: USING LINKED ELECTRONIC MEDICAL RECORDS (EMR) AND CLAIMS DATA A CASE STUDY EXAMINING RISK FACTORS AND COSTS OF UNCONTROLLED HYPERTENSION ISPOR 2013 WORKSHOP
Demographics of Atlanta, Georgia:
 Demographics of Atlanta, Georgia: A Visual Analysis of the 2000 and 2010 Census Data 36-315 Final Project Rachel Cohen, Kathryn McKeough, Minnar Xie & David Zimmerman Ethnicities of Atlanta Figure 1: From
ICH guideline E2C (R2) Periodic benefit-risk evaluation report (PBRER)
 Periodic benefit-risk evaluation report (PBRER)") April 2012 EMA/CHMP/ICH/544553/1998 Committee for medicinal products for human use (CHMP) ICH guideline E2C (R2) Periodic benefit-risk evaluation report (PBRER) Step 3 Transmission to CHMP 16 April 2012
April 2012 EMA/CHMP/ICH/544553/1998 Committee for medicinal products for human use (CHMP) ICH guideline E2C (R2) Periodic benefit-risk evaluation report (PBRER) Step 3 Transmission to CHMP 16 April 2012
PATIENT INFORMATION INTAKE F O R M BESSMER CHIROPRACTIC P. C.
 PATIENT INFORMATION INTAKE F O R M BESSMER CHIROPRACTIC P. C. Date today: _ PERSONAL INFORMATION Full Name: SS#: Address: City: State: Home Phone: Cell Phone: W o r k Phone: Email: Birthdate: Age: Sex:
New Evidence reports on presentations given at EULAR 2012. Rituximab for the Treatment of Rheumatoid Arthritis
 New Evidence reports on presentations given at EULAR 2012 Rituximab for the Treatment of Rheumatoid Arthritis Report on EULAR 2012 presentations Long-term safety of rituximab: 10-year follow-up in the
March 28 2011 ABSTRACT
 March 28 2011 A registry based comparative cohort study in four Swedish counties of the risk for narcolepsy after vaccination with Pandemrix - A first and preliminary report, by the Medical Products Agency.
Guidance for Industry
 Guidance for Industry E2F Development Safety Update Report U.S. Department of Health and Human Services Food and Drug Administration Center for Drug Evaluation and Research (CDER) Center for Biologics
Challenges and Opportunities in Clinical Trial Data Processing
 Challenges and Opportunities in Clinical Trial Data Processing Vadim Tantsyura, Olive Yuan, Ph.D. Sergiy Sirichenko (Regeneron Pharmaceuticals, Inc., Tarrytown, NY) PG 225 Introduction The review and approval
Data Management and Analysis for Successful Clinical Research. Lily Wang, PhD Department of Biostatistics Vanderbilt University
 Data Management and Analysis for Successful Clinical Research Lily Wang, PhD Department of Biostatistics Vanderbilt University Goals of This Presentation Provide an overview on data management and analysis
A white paper presented by: Barry Cohen Director, Clinical Data Strategies Octagon Research Solutions, Inc. Wayne, PA
 THE CLINICAL DATA AND REGULATORY EXPERTS SDTM, Plus or Minus A white paper presented by: Barry Cohen Director, Clinical Data Strategies Octagon Research Solutions, Inc. Wayne, PA This Whitepaper is for
Organization Profile. IT Services
 Introduction In today s scientific and medical world, various issues in clinical trials and research have permeated every society and every field in medicine. Ethics and in particular the quality of research
Graphing Made Easy for Project Management
 Paper 7300-2016 Graphing Made Easy for Project Management Zhouming (Victor) Sun, AZ/Medimmune Corp., Gaithersburg, MD ABSTRACT Project management is a hot topic across many industries, and there are multiple
Iris Sample Data Set. Basic Visualization Techniques: Charts, Graphs and Maps. Summary Statistics. Frequency and Mode
 Iris Sample Data Set Basic Visualization Techniques: Charts, Graphs and Maps CS598 Information Visualization Spring 2010 Many of the exploratory data techniques are illustrated with the Iris Plant data
Application for a Marketing Authorisation: Requirements and Criteria for the Assessment of QT Prolonging Potential
 Application for a Marketing Authorisation: Requirements and Criteria for the Assessment of QT Prolonging Potential Bundesinstitut für Arzneimittel Dr. med. Clemens Mittmann Bundesinstitut für Arzneimittel
Overview of CDISC Implementation at PMDA. Yuki Ando Senior Scientist for Biostatistics Pharmaceuticals and Medical Devices Agency (PMDA)
") Overview of CDISC Implementation at PMDA Yuki Ando Senior Scientist for Biostatistics Pharmaceuticals and Medical Devices Agency (PMDA) CDISC 2012 Outline Introduction Update of PMDA activity CDISC implementation
Overview of CDISC Implementation at PMDA Yuki Ando Senior Scientist for Biostatistics Pharmaceuticals and Medical Devices Agency (PMDA) CDISC 2012 Outline Introduction Update of PMDA activity CDISC implementation
Clinical Study Synopsis for Public Disclosure
 abcd Clinical Study for Public Disclosure This clinical study synopsis is provided in line with s Policy on Transparency and Publication of Clinical Study Data. The synopsis - which is part of the clinical
Medical Data Review and Exploratory Data Analysis using Data Visualization
 Paper PP10 Medical Data Review and Exploratory Data Analysis using Data Visualization VINOD KERAI, ROCHE, WELWYN, UKINTRODUCTION Drug Development has drastically changed in the last few decades. There
Exercise 1: How to Record and Present Your Data Graphically Using Excel Dr. Chris Paradise, edited by Steven J. Price
 Biology 1 Exercise 1: How to Record and Present Your Data Graphically Using Excel Dr. Chris Paradise, edited by Steven J. Price Introduction In this world of high technology and information overload scientists
TUTORIAL on ICH E9 and Other Statistical Regulatory Guidance. Session 1: ICH E9 and E10. PSI Conference, May 2011
 TUTORIAL on ICH E9 and Other Statistical Regulatory Guidance Session 1: PSI Conference, May 2011 Kerry Gordon, Quintiles 1 E9, and how to locate it 2 ICH E9 Statistical Principles for Clinical Trials (Issued
ADVANCE: a factorial randomised trial of blood pressure lowering and intensive glucose control in 11,140 patients with type 2 diabetes
 ADVANCE: a factorial randomised trial of blood pressure lowering and intensive glucose control in 11,140 patients with type 2 diabetes Effects of a fixed combination of the ACE inhibitor, perindopril,
Scatter Plots with Error Bars
 Chapter 165 Scatter Plots with Error Bars Introduction The procedure extends the capability of the basic scatter plot by allowing you to plot the variability in Y and X corresponding to each point. Each