Healthcare: Biotech. Oramed Pharmaceuticals Inc. (ORMP $8.01*) F2Q16 Earnings: Focus Remains on Phase IIb Data in 2Q16.
|
|
|
- Opal Cobb
- 8 years ago
- Views:
Transcription
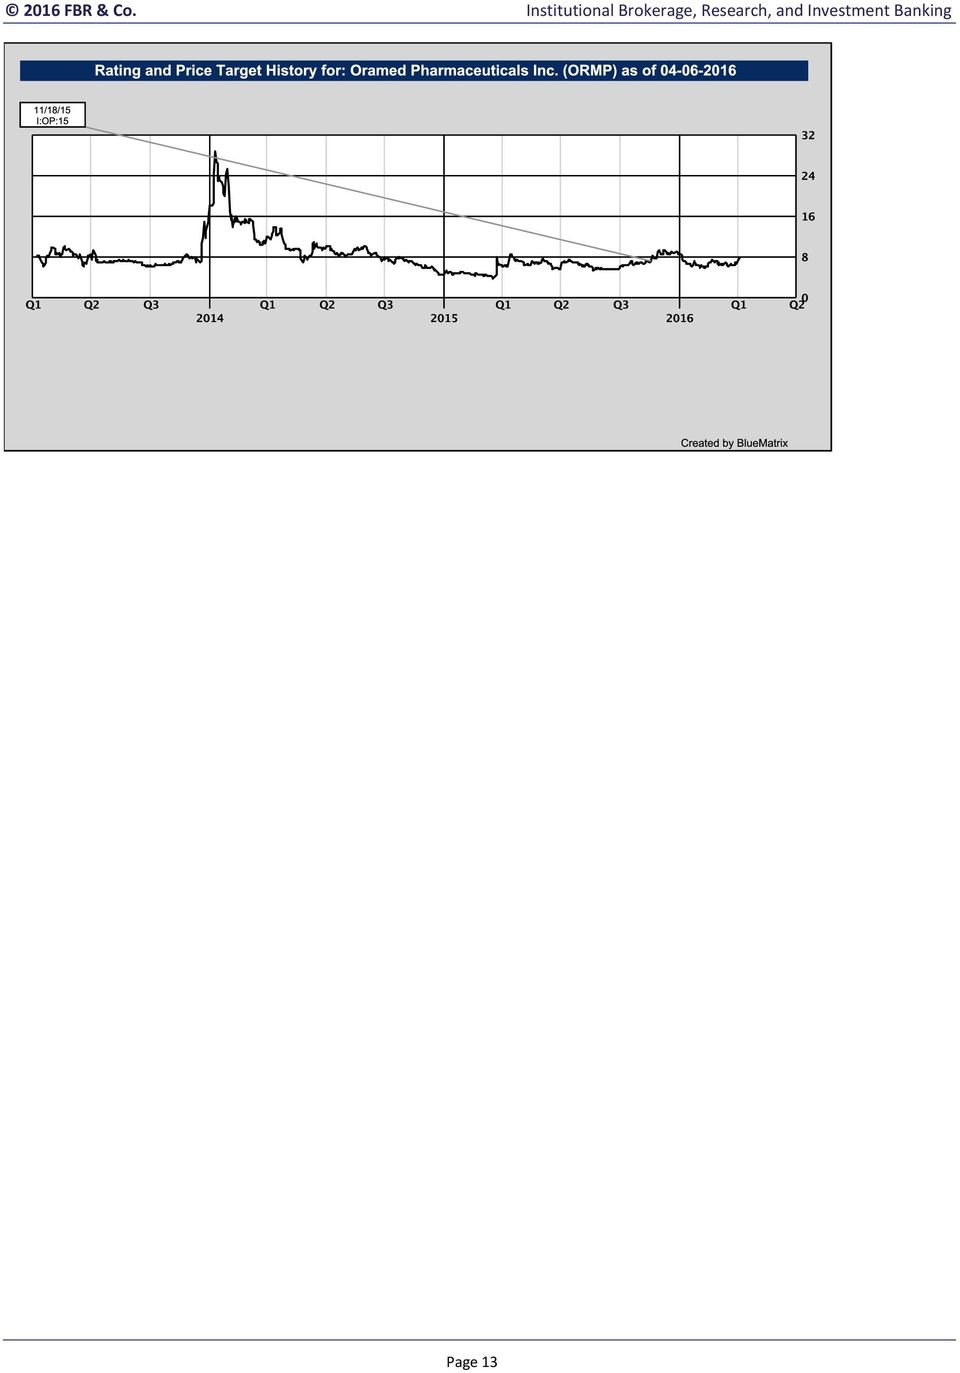
1 Oramed Pharmaceuticals Inc. (ORMP $8.01*) Christopher S. James, M.D Justin A. Kim Healthcare: Biotech Company Update Jerusalem, Israel Outperform April 7, 2016 Price Target: $15.00 STOCK DATA 52-Week Range $10.74 $ Month ADTV 49,095 Dividend Yield NA Market Cap (mil) $105.1 Shares Outstanding (mil) 13.1 Beta (0.19) Float (%) 78.7 Fiscal Year-End August EARNINGS DATA EPS 2015A 2016E 2017E 1Q ($0.19) ($0.21)A 2Q ($0.15) ($0.15)A 3Q ($0.15) ($0.20) 4Q ($0.18) ($0.22) FY ($0.67) ($0.78) ($0.81) BALANCE SHEET DATA 2Q16 Cash & Equivalents $35.9 Current Assets $26.0 Total Assets $38.4 Total Liabilities $5.7 Total Stockholder Equity $32.7 Total Debt $0.0 $ in millions. F2Q16 Earnings: Focus Remains on Phase IIb Data in 2Q16 Summary and Recommendation Yesterday afternoon, April 6, Oramed Pharmaceuticals reported F2Q16 earnings per share of ($0.15), compared with ($0.21) in F1Q16. Although Oramed does not host a conference call, we saw several positive developments in the company's 10- Q filing for the second quarter. The company recently announced the completion of all follow-up visits of the Phase IIb study with ORMD We expect to see data from this trial in 2Q16, which we believe has the potential to be a major inflection point for the stock. As a reminder, Oramed is developing two clinical candidates: ORMD-0801, an oral insulin analog for the treatment of type 1 and type 2 diabetes (T1D and T2D), and ORMD-0901, an oral GLP-1 analog for the treatment of T2D. Oramed is also conducting a study with ORMD-0901, which we expect will be completed in 2Q16. Overall, we are encouraged by Oramed's progress during the quarter and remain focused on the Phase IIb data readout. Key Points Important disclosures can be found on pages 9-13 of this report. Phase IIb data expected in 2Q16 has potential to be a major catalyst. Oramed reported on April 5 that it has completed final follow-up visits for all 180 patients in its Phase IIb study with ORMD-0801 for T2D. We remind investors that the Phase IIb study is being conducted across 33 clinical sites in the U.S. and will examine the primary endpoint of effect on weighted mean nighttime glucose levels between baseline and week four of treatment. Following verification and analysis of the data, we expect Oramed to announce top-line results in 2Q16. We believe these data could help clarify the existence of a dose effect and resolve concerns over a cited manufacturing fault with the 16 mg capsule. We expect a partnership to follow a positive data readout. We remind investors that Oramed plans to seek a partner for ORMD-0801 before initiating large and costly pivotal Phase III studies. At the end of last year, Oramed announced the completion of its Chinese out-licensing deal for ORMD-0801 with Hefei Tianhui Incubation of Technologies Co. (HTIT). We believe the deal further validates the potential for additional partnerships with ORMD-0801 and the potential of ORMD-0801 for the treatment of T1D and T2D. Progress across the pipeline. Following the conclusion of a Phase Ib ex- U.S. study with ORMD-0901 in T2D, Oramed plans to initiate a Phase II multi-center study in 1Q17. Recall, ORMD-0901 is an oral exenatide GLP-1 analog-based preparation for the treatment of T2D. ORMD-0901 demonstrated biologic activity in a small prior clinical trial performed in Jerusalem. Moreover, treatment with ORMD-0901 was not associated with reports of nausea, which is the most frequently reported adverse reaction associated with injectable exenatide. Earnings details. R&D spending decreased to $1.3 million in F2Q16 from $1.9 million in F1Q16. G&A spend increased to $0.7 million from $0.5 million in F1Q16. As of February 29, 2016, the company reported a cash and equivalents balance of $35.9 million, which provides sufficient cash runway through 2017, according to our model FBR & Co.
A 2Q ($0.15) ($0.15)A 3Q ($0.15) ($0.20) 4Q ($0.18) ($0.22) FY ($0.67) ($0.78) ($0.81) BALANCE SHEET DATA 2Q16 Cash & Equivalents $35.9 Current Assets $26.0 Total Assets $38.4 Total Liabilities $5.")
2 The Debate TM Debatable Point Our Thoughts Time Frame Impact Will ORMD-0801 show positive safety and efficacy in the current Phase IIb study? We have reviewed the previous Phase IIa study results to handicap the potential success of ORMD-0801 in the current Phase IIb study. Overall, ORMD-0801 showed a consistent and short-acting rise in plasma insulin, which positively decreased plasma glucose levels with the 8 mg capsule (16 mg dose). We note that these results can only be described as trends, as the study was not powered to show statistical significance. In the 24 mg dose, there was a manufacturing fault associated with the 16 mg capsule, which makes us uncertain regarding the existence of a dose-related effect. That being said, we think there is a significant market opportunity for oral insulin if the Phase IIb outcome is positive, and we view the risk/reward profile as favorable. 3 Months Will Oramed successfully partner ORMD-0801 to support late-stage clinical trials, approval, and commercialization? Will Oramed s oral GLP-1 candidate (ORMD-0901) prove to be safe and effective in T2D patients? If ORMD-0801 is shown to be both safe and effective, Oramed plans to ultimately seek a strategic partner or partners with extensive drug development experience and marketing capabilities. Given the size and scope (approximately 3,000 patients over 24 weeks) of a Phase III program in T1D and T2D, we would expect Oramed to attempt to partner ORMD-0801 after the Phase II studies are complete. The strategic partner(s) would be responsible for global clinical trials, post-marketing studies, and label expansion, which are outside of Oramed s core developmental capabilities. We expect to see a partnership or partnerships following Phase IIb data, which should read out in the 2Q16. ORMD-0901 is an oral exenatide GLP-1 analog-based preparation designed with Oramed s oral formulation technology. Oramed completed non-fda approved clinical trials of ORMD-0901 in healthy volunteers at a medical center in Jerusalem. The first-inhuman study demonstrated retained biological activity on insulin excursions after oral administration of ORMD-0901 followed by an oral glucose load. While these data are encouraging and provide a rationale for advanced development, only six subjects were analyzed for safety, and only four subjects were considered for the efficacy evaluations due to adverse events reported upon glucose load. 6 to 18 Months 2 Years+ Investment Thesis Given its focus on developing orally administered peptides that are currently available only as injectables, we view Oramed as owning platform technology with a strong patent estate. We believe the data for both ORMD-0801 and ORMD-0901 are compelling and would be buyers of the stock at these levels. Valuation Our $15 price target is based on probability-weighted DCF and sum-of-the-parts (SOTP) analyses of the commercial opportunities available to the company. Our model incorporates a 13.5% discount rate and a 3% growth rate, which is in line with development-stage companies. Catalysts/Milestones 2Q16: complete Phase Ib ex-u.s. study with ORMD-0901 in T2D. 2Q16: Phase IIb study data readout with ORMD-0801 oral insulin. 1Q17: initiate Phase II multi-center study with ORMD-0901 oral GLP-1 analog. Page 2

3 Valuation Methodology Our $15 price target is based on probability-weighted DCF and sum-of-the-parts (SOTP) analyses of the commercial opportunities available to the company. Our model incorporates a 13.5% discount rate, which is in line with development-stage companies. We ascribe a 20% probability of success (PoS) to ORMD-0801 in T1D and T2D, as we are keen on seeing the results of the Phase IIb trial without the use of the 16 mg capsule. Our SOTP analysis shows that 73% of the total value of ORMP can be ascribed to ORMD-0801 T2D, given its large market size relative to T1D, and ORMD-0901 GLP- 1 for T2D patients. We ascribe a 10% PoS to ORMD-0901, which completed a Phase I study in healthy volunteers. ORMP Sum-of-the-Parts Analysis ($ in Millions) EV PoS EV Per Diluted Share ORMD T2D * 20.0% = % % ORMD T1D * 20.0% = % % ORMD-0901 GLP-1 - T2D * 10.0% = % % Total Firm Value 1,078.7 * 17.6% = % % Total Equity Value % % Fully Diluted Shares 12.7 Source: FBR Research ORMP DCF Analysis ($ in Millions) Present Value of FCF 1,078.6 Blended PoS 0.18 Present Value of Equity Diluted Shares Outstanding 12.7 Equity Value per Share $ Upside/(Downside) Potential 87.0% Terminal Value Summary Perpetual Growth Rate 2.0% Terminal Free Cash Flow Terminal Value 3,727.6 Present Value of FCF 1,078.6 Present Value of TV Terminal Value % of EV 56.0% Source: FBR Research Page 3

4 Risks Clinical risks. The development of clinical drug candidates is inherently risky and may never lead to marketable products. Oramed s lead drug candidate, ORMD-0801, is at an early stage of clinical development and depends on third-party suppliers for raw materials. As the company does not control these parties, it is not able to guarantee that the clinical operations will be performed in a timely and adequate manner. Competitive risks. Several companies are developing candidates or marketing products for the same treatment indications for which Oramed is developing product candidates. These candidates or products may negatively affect future pricing power or market opportunities for Oramed s developmental candidates. Financial risks. Oramed is currently developing several clinical candidates and may need additional funds in the future to continue research and development programs and for the commercialization of its products. Liquidity risk. The company has a relatively small float with a market capitalization of approximately $100 million on common shares outstanding. Investors could potentially be at risk of finding a liquid market to buy or sell shares. Regulatory risks. There is a risk that the company will be unable to receive regulatory approvals or experience delays in receiving approval. Additionally, the company must obtain several foreign regulatory approvals to be able to sell products internationally. Manufacturing risks. Oramed may be unable to manufacture or contract with third parties for the manufacture of insulin-based applications and/or other orally digestible drugs. Company Profile Oramed Pharmaceuticals Inc. develops a proprietary platform technology focused on creating orally administered oral polypeptides. The company has two oral candidates in development in the diabetes space: ORMD-0801, an insulin analog for type 1 diabetes (T1D) and type 2 diabetes (T2D); and ORMD-0901, an oral GLP-1 analog for T2D. ORMD-0801 is currently in a Phase IIb study in T2D patients, which is expected to read out in 2Q16. In 4Q16, Oramed plans to initiate a Phase II multisite study with ORMD-0901 under a U.S. IND. Page 4

5 Income Statement Oramed Pharmaceuticals Inc. (ORMP) $ in Millions 2012A 2013A 2014A 2015A 1Q16A 2Q16A 3Q16E 4Q16E 2016E 2017E 2018E 2019E 2020E Royalties ORMD T2D ORMD T1D ORMD T2D Total Product Royalties Gross Profit Operating Expenses: Research and Development (1.7) (2.3) (3.3) (4.8) (1.9) (1.3) (1.7) (2.0) (6.9) (8.1) (9.4) (10.5) (11.2) Selling, General and Administrative (1.2) (2.0) (2.6) (2.6) (0.5) (0.7) (0.8) (0.8) (2.9) (3.4) (3.9) (4.5) (5.0) Total Operating Expenses (2.9) (4.3) (5.9) (7.4) (2.4) (2.0) (2.5) (2.9) (9.8) (11.4) (13.3) (15.0) (16.2) Growth 18% 49% 37% 25% 13% -17% 23% 14% 33% 16% 16% 13% 8% % of Revenue n.a. n.a. n.a. n.a. n.a. n.a. n.a. n.a. n.a. n.a. n.a. n.a. 305% Operating Profit/(Loss) (EBIT) (2.9) (4.3) (5.9) (7.4) (2.4) (2.0) (2.5) (2.9) (9.8) (11.4) (13.3) (15.0) (10.9) Growth 18% 49% 37% 25% 13% -17% 23% 14% 33% 16% 16% 13% -28% Financial income Financial expenses (0.2) (0.3) (0.0) (0.0) (0.0) (0.0) - - (0.0) (0.3) (0.9) (1.6) (2.2) Other Income (Expense), Net (0.2) Net Profit/(Loss) - Pretax (3.3) (4.4) (5.7) (7.2) (2.4) (1.9) (2.5) (2.8) (9.7) (11.6) (13.6) (16.2) (12.6) Tax Rate 0% 0% 0% 0% 0% 0% 0% 0% 0% 0% 0% 0% 0% (Taxes)/Tax Benefits (0.1) 0.2 (0.0) Net Income (After Taxes) (3.3) (4.2) (5.7) (7.2) (2.4) (1.9) (2.5) (2.8) (9.7) (11.6) (13.6) (16.2) (12.6) Growth 114% 27% 35% 27% 13% -19% 28% 14% 34% 20% 17% 19% -22% Basic Net Profit/ (Loss) per Common Share (0.57) (0.59) (0.62) (0.67) (0.21) (0.15) (0.20) (0.22) (0.78) (0.81) (0.74) (0.88) (0.69) Weighted Average Shares Outstanding Growth -91% 23% 28% 17% 1% 9% 0% 0.0% 14% 16% 28% 0% 0% Diluted Net Profit/ (Loss) per Common Share (0.57) (0.59) (0.62) (0.67) (0.21) (0.15) (0.20) (0.22) (0.78) (0.81) (0.74) (0.88) (0.69) Fully Diluted Average Shares Growth -91% 23% 28% 17% 1% 9% 0% 0.0% 14% 16% 28% 0% 0% Proprietary to FBR Capital Markets & Co. April 7, 2016 Christopher S. James, M.D cjames@fbr.com Source: Company reports and FBR Research Page 5
 (0.8) (0.8) (2.9) (3.4) (3.9) (4.5) (5.0) Total Operating Expenses (2.9) (4.3) (5.9) (7.4) (2.4) (2.0) (2.5) (2.9) (9.8) (11.4) (13.3) (15.0) (16.")
6 Balance Sheet Oramed Pharmaceuticals Inc. (ORMP) $ in Millions 2012A 2013A 2014A 2015A 1Q16A 2Q16A 3Q16E 4Q16E 2016E 2017E 2018E 2019E 2020E Current assets: Cash and cash equivalents Short-term deposits Marketable securities Restricted cash Accounts receivable - other Prepaid expenses and other current assets Related parties Grants receivable from the Office of the Chief Scientist Total current assets Investment in a joint venture Long-term deposits and investment Marketable securities Amounts funded for employee rights upon retirement Property and equipment, net Total assets Liabilities and stockholders equity Current liabilities: Accounts payable and accrued expenses Advance on account of license agreement Related parties Account payable with former shareholder Total current liabilities Warrants Long-term debt Employee rights upon retirement Provision for uncertain tax position Deferred Revenue Total liabilities Common stock Additional paid-in capital Accumulated other comprehensive income Accumulated Loss (17.9) (22.1) (27.8) (35.1) (37.4) (39.3) (41.7) (44.6) (44.6) (56.2) (69.8) (85.9) (98.6) Total stockholders (deficit) equity Total liabilities and stockholders equity Proprietary to FBR Capital Markets & Co. April 7, 2016 Christopher S. James, M.D cjames@fbr.com Source: Company reports and FBR Research Page 6

7 Discounted Cash Flow (DCF) Analysis Oramed Pharmaceuticals Inc. (ORMP) $ in Millions 2015A 2016E 2017E 2018E 2019E 2020E 2021E 2022E 2023E 2024E 2025E 2026E 2027E 2028E 2029E 2030E TVE EBIT (7.4) (9.7) (11.4) (13.3) (15.0) (10.9) Effective Tax Rate 0.0% 0.0% 0.0% 0.0% 0.0% 0.0% 0.0% 0.0% 30.0% 30.0% 30.0% 30.0% 30.0% 30.0% 30.0% 30.0% Tax Expense (36.7) (67.8) (102.1) (119.2) (133.1) (149.0) (167.2) (187.9) NOPAT (7.4) (9.7) (11.4) (13.3) (15.0) (10.9) Add: Depreciation & Amortization Less: Change in Working Capital (0.0) (0.0) 0.3 (0.2) (0.9) (0.0) (0.0) (0.0) (0.0) (0.0) (0.0) (0.0) (0.0) (0.0) Less: Capital Expenditures (0.0) (0.1) (0.2) (0.3) (0.5) (2.1) (7.8) (3.6) (7.3) (12.9) (19.2) (22.4) (25.0) (28.0) (31.4) (35.3) Unlevered Free Cash Flow (6.5) (5.6) (11.6) (13.6) (15.2) (13.1) (6.3) Terminal Value Total Free Cash Flows (6.5) (5.6) (11.6) (13.6) (15.2) (13.1) (6.3) Discount Period Discount Factor Discounted Free Cash Flows - (5.4) (9.7) (10.0) (9.9) (7.5) (3.2) Proprietary to FBR Capital Markets & Co. April 7, 2016 Christopher S. James, M.D cjames@fbr.com Source: Company reports and FBR Research Page 7
 (0.0) 0.3 (0.2) (0.9) (0.0) (0.0) (0.0) (0.0) (0.0) (0.0) (0.0) (0.0) (0.0) Less: Capital Expenditures (0.")
8 Sum-of-the-Parts (SOTP) Analysis Oramed Pharmaceuticals Inc. (ORMP) $ in Millions 2015A 2016E 2017E 2018E 2019E 2020E 2021E 2022E 2023E 2024E 2025E 2026E 2027E 2028E 2029E 2030E TVE ORMD T2D Royalty Revenue Gross Income R&D Share (4) (6) (7) (8) (9) (9) (10) (11) (12) (17) (22) (26) (30) (35) (41) (48) G&A Share (2) (3) (3) (3) (4) (4) (5) (5) (6) (6) (7) (8) (9) (9) (10) (11) Operating Income (6.6) (8.9) (10.2) (11.7) (13.1) (8.4) (2.1) Less: Tax (19) (45) (59) (68) (79) (92) (107) (125) NOPAT (7) (9) (10) (12) (13) (8) (2) Plus: Share of Noncash 1 4 (0) (0) (0) (2) 9 (2) (3) (7) (9) (9) (10) (10) (11) (13) Unlevered FCF (6) (5) (10) (12) (13) (10) ,478 Discount Factor Discounted FCF - (5) (9) (9) (9) (6) ORMD T2D 691 ORMD T1D Royalty Revenue Gross Income R&D Share (0) (0) (0) (0) (1) (1) (1) (1) (2) (2) (4) (5) (5) (5) (6) (6) G&A Share (0) (0) (0) (0) (0) (0) (0) (0) (0) (0) (1) (1) (1) (1) (1) (1) Operating Income (0.4) (0.5) (0.6) (0.7) (0.8) (1.0) Less: Tax (6) (8) (15) (17) (18) (19) (19) (20) NOPAT (0) (0) (1) (1) (1) (1) Plus: Share of Noncash 0 0 (0) (0) (0) (0) (6) (0) (1) (1) (2) (2) (2) (2) (2) (2) Unlevered FCF (0) (0) (1) (1) (1) (1) (5) Discount Period Discount Factor Discounted FCF - (0) (1) (1) (1) (1) (2) ORMD T1D 126 ORMD-0901 GLP-1 - T2D Royalty Revenue Gross Income R&D Share (0) (0) (0) (1) (1) (1) (2) (2) (3) (4) (8) (10) (11) (11) (12) (13) G&A Share (0) (0) (0) (0) (0) (0) (0) (0) (1) (1) (1) (1) (1) (1) (2) (2) Operating Income (0.4) (0.5) (0.6) (0.8) (1.1) (1.5) Less: Tax (11) (15) (29) (34) (36) (38) (40) (43) NOPAT (0) (0) (1) (1) (1) (1) Plus: Share of Noncash (0.0) (0.0) (0.0) (0.3) (11.5) (0.3) (1.7) (2.2) (4.2) (4.5) (4.4) (4.3) (4.3) (4.3) Unlevered FCF (0) (0) (1) (1) (1) (2) (9) Discount Factor Discounted FCF - (0) (1) (1) (1) (1) (4) ORMD-0901 GLP-1 - T2D 262 Proprietary to FBR Capital Markets & Co. April 7, 2016 Christopher S. James, M.D cjames@fbr.com Source: Company reports and FBR Research Page 8
 (9) (10) (11) Operating Income (6.6) (8.9) (10.2) (11.7) (13.1) (8.4) (2.1) 40.5 64.9 150.3 195.3 227.3 264.5 307.8 358.0 416.")
9 *Closing price of last trading day immediately prior to the date of this publication unless otherwise indicated. Important Information FBR is the global brand for FBR & Co. and its subsidiaries. This report has been prepared by FBR Capital Markets & Co. (FBRC), a subsidiary of FBR & Co. FBRC is a broker-dealer registered with the SEC and member of FINRA, the NASDAQ Stock Market and the Securities Investor Protection Corporation (SIPC). The address for FBRC is 1300 North 17th Street Suite 1400, Arlington, VA All references to FBR & Co. mean FBR Capital Markets & Co. (FBRC) and its affiliates. Company-Specific Disclosures Within the next three months, FBR, and/or FBR Affiliates, expects to receive or intends to seek compensation for investment banking services from this issuer: Oramed Pharmaceuticals Inc.. FBR, and/or FBR Affiliate(s), has managed or co-managed a public offering of the company's securities and has received compensation for investment banking services from the company as a client of FBR, and/or FBR Affiliates, during the past twelve months: Oramed Pharmaceuticals Inc.. For up-to-date company disclosures including price charts, please click on the following link or paste URL in a web browser: General Disclosures Information about the Research Analyst Responsible for this report: The primary analyst(s) covering the issuer(s), Christopher S. James, M.D., certifies (certify) that the views expressed herein accurately reflect the analyst's personal views as to the subject securities and issuers and further certifies that no part of such analyst's compensation was, is, or will be, directly or indirectly, related to the specific recommendations or views expressed by the analyst in the report. The analyst(s) responsible for this research report has received and is eligible to receive compensation, including bonus compensation, based on FBR s overall operating revenues, including revenues generated by its investment banking activities. Information about FBR's Conflicts Management Policy: Our Research conflicts management policy is available at: Information about investment banking: In the normal course of its business, FBR seeks to perform investment banking and other services for various companies and to receive compensation in connection with such services. As such, investors should assume that FBR intends to seek investment banking or other business relationships with the companies. Information about our recommendations, holdings and investment decisions: The information and rating included in this report represent the long-term view as described more fully below. The analyst may have different views regarding short-term trading strategies with respect to the stocks covered by the rating, options on such stocks, and/or other securities or financial instruments issued by the company, and such views may be made available to all or some of our clients from time to time. Our brokers may make recommendations to their clients, and our affiliates may make investment decisions that are contrary to the recommendations contained in this research report. Such recommendations or investment decisions are based on the particular investment strategies, risk tolerances, and other investment factors of that particular client or affiliate. From time to time, FBR, its affiliated entities, and their respective directors, officers, employees, or members of their immediate families may have a long or short position in the securities or other financial instruments mentioned in this report. We provide to certain customers on request specialized research products or services that focus on covered stocks from a particular perspective. These products or services include, but are not limited to, compilations, reviews, and analysis that may use different research methodologies or focus on the prospects for individual stocks as compared to other covered stocks or over differing time horizons or under assumed market events or conditions. Readers should be aware that we may issue investment research on the subject companies from a technical perspective and/or include in this report discussions about options on stocks covered in this report and/or other securities or financial instruments issued by the company. These analyses are different from fundamental analysis, and the conclusions reached may differ. Technical research and the discussions Page 9
 and its affiliates.")
10 concerning options and other securities and financial instruments issued by the company do not represent a rating or coverage of any discussed issuer(s). The disclosures concerning distribution of ratings and price charts refer to fundamental research and do not include reference to technical recommendations or discussions concerning options and other securities and financial instruments issued by the company. Important Information Concerning Options Transactions: This discussion is directed to experienced professional investors with a high degree of sophistication and risk tolerance. Options transactions are not suitable for all investors. This brief statement does not address all of the risks or other significant aspects of entering into any particular transaction. Tax implications are an important consideration for options transactions. Prior to undertaking any trade you should discuss with your preferred tax, ERISA, legal, accounting, regulatory, or other advisor how such particular trade may affect you. Opinion with respect to options is distinct from fundamental research analysis. Opinion is current as of the time of publication, and there should be no expectation that it will be updated, supplemented, or reviewed as information changes. We make no commitment to continue to follow any ideas or information contained in this section. Analysis does not consider the cost of commissions. Supporting documentation is available upon request. Please ensure that you have read and understood the current options risk disclosure document before entering into any options transactions. The options risk disclosure document can be accessed at the following Web address: optionsclearing.com/about/publications/character-risks.jsp. If this link is inaccessible, please contact your representative. Risks Some options strategies may be complex, high risk, and speculative. There are potentially unlimited combinations of hedged and unhedged options strategies that expose investors to varying degrees of risk. Generally, buyers establishing long options positions risk the loss of the entire premium paid for the position, while sellers establishing short options positions have unlimited risk of loss. There are a number of commonly recognized options strategies, that expose investors to varying degrees of risk, some of which are summarized below: Buying Calls or Puts--Investors may lose the entire premium paid. Selling Covered Calls--Selling calls on long stock position. Risk is that the stock will be called away at strike, limiting investor profit to strike plus premium received. Selling Uncovered Calls--Unlimited risk that investors may experience losses much greater than premium received. Selling Uncovered Puts--Significant risk that investors will experience losses much greater than premium income received. Buying Vertical Spreads (Calls--long call and short call with higher strike; Puts--long put and short put with lower strike) Same expiration month for both options. Investors may lose the entire premium paid. Buying Calendar Spreads (different expiration months with short expiration earlier than long). Investors may lose the entire premium paid. Selling Call or Put Vertical Spreads (Calls--short call and long call with higher strike; Puts--short put and long put with a lower strike, same expiration month for both options.) Investors risk the loss of the difference between the strike prices, reduced by the premium received. Buying Straddle--Buying a put and a call with the same underlying strike and expiration. Investors risk loss of the entire premium paid. Selling Straddle--Sale of call and put with the same underlying strike and expiration.) Unlimited risk that investors will experience losses much greater than the premium income received. Buying Strangle--Long call and long put, both out of the money, with the same expiration and underlying security. Investors may lose the entire premium paid. Selling Strangle--Short call and put, both out of the money, with the same expiration and underlying security. Unlimited risk of loss in excess premium collected. Important Information about Convertible & Other Fixed-Income Securities and Financial Instruments: This discussion is directed to experienced professional investors with a high degree of sophistication and risk tolerance. Opinion with respect to convertible, other fixed-income securities and other financial instruments is distinct from fundamental research analysis. Opinion is current as of the time of publication, and there should be no expectation that it will be updated, supplemented, or reviewed as information changes. We make no commitment to continue to follow any ideas or information contained in this section. Page 10

11 Research analysts may consult Credit Sales and Trading personnel when preparing commentary on convertible and fixedincome securities and other financial instruments. FBR may be a market maker in the company s convertible or fixed-income securities. FBR Capital Markets LT, Inc. may be a market maker in financial instruments that are not securities. Securities and financial instruments discussed may be unrated or rated below investment grade, may be considered speculative, and should only be considered by accounts qualified to invest in such securities. Securities and financial instruments discussed may not be registered or exempt from registration in all jurisdictions. Nonregistered securities discussed may be subject to a variety of unique risk considerations, including those related to liquidity, price volatility, and lack of widely distributed information. Rule 144A securities are sold only to persons who are Qualified Institutional Buyers within the meaning of Rule 144A, under the Securities Act of 1933, as amended. Information about our rating system: FBR instituted the following three-tiered rating system on October 11, 2002, for securities it covers: Outperform (OP) FBR expects that the subject company will outperform its peers over the next 12 months. We recommend that investors buy the securities at the current valuation. Market Perform (MP) FBR expects that the subject company s stock price will be in a trading range neither outperforming nor underperforming its peers over the next 12 months. Underperform (UP) FBR expects that the subject company will underperform its peers over the next 12 months. We recommend that investors reduce their positions until the valuation or fundamentals become more compelling. A description of the five-tiered rating system used prior to October 11, 2002, can be found at Rating. FBR Research Distribution 1 FBR Banking Services in the past 12 months 1 BUY [Outperform] 64.43% 32.26% HOLD [Market Perform] 33.03% 11.19% SELL [Underperform] 2.54% 9.09% (1) As of midnight on the business day immediately prior to the date of this publication. General Information about FBR Research: Additional information on the securities mentioned in this report is available upon request. This report is based on data obtained from sources we believe to be reliable but is not guaranteed as to accuracy and does not purport to be complete. Opinion is as of the date of the report unless labeled otherwise and is subject to change without notice. Updates may be provided based on developments and events and as otherwise appropriate. Updates may be restricted based on regulatory requirements or other considerations. Consequently, there should be no assumption that updates will be made. FBR and its affiliates disclaim any warranty of any kind, whether express or implied, as to any matter whatsoever relating to this research report and any analysis, discussion or trade ideas contained herein. This research report is provided on an "as is" basis for use at your own risk, and neither FBR nor its affiliates are liable for any damages or injury resulting from use of this information. This report should not be construed as advice designed to meet the particular investment needs of any investor or as an offer or solicitation to buy or sell the securities or financial instruments mentioned herein, and any opinions expressed herein are subject to change. Some or all of the securities and financial instruments discussed in this report may be speculative, high risk, and unsuitable or inappropriate for many investors. Neither FBR nor any of its affiliates make any representation as to the suitability or appropriateness of these securities or financial instruments for individual investors. Investors must make their own determination, either alone or in consultation with their own advisors, as to the suitability or appropriateness of such investments based upon factors including their investment objectives, financial position, liquidity needs, tax status, and level of risk tolerance. These securities and financial instruments may be sold to or purchased from customers or others by FBR acting as principal or agent. Securities and financial instruments issued by foreign companies and/or issued overseas may involve certain risks, including differences in accounting, reporting, and registration, as well as foreign currency, economic, and political risks. Page 11

12 This report and the securities and financial instruments discussed herein may not be eligible for distribution or sale in all jurisdictions and/or to all types of investors. This report is provided for information purposes only and does not represent an offer or solicitation in any jurisdiction where such offer would be prohibited. Commentary regarding the future direction of financial markets is illustrative and is not intended to predict actual results, which may differ substantially from the opinions expressed herein. If any hyperlink is inaccessible, call and ask for Editorial. FBR utilizes a tiered approach to service its clients. The services provided by FBR s research analysts to clients vary, based upon a variety of factors including, but not limited to, client preferences and the extent of a client s total relationship with the Firm. FBR does not provide any of the Firm s clients with access to unpublished research opinion. FBR provides clients across all tiers equal access to research reports. Pairs Trade Disclaimer From time to time FBR Research Analysts will offer short term trading ideas, including identifying a paired trade. In a paired trade an investor buys the securities of one company and sells the securities of another company. The idea to buy the securities of one company and sell the securities of the other company is based on the expected short term price move or relative value between the two companies mentioned in the paired trade, not between the companies and any other companies. In contrast, the recommendations in a Research Analyst s published report reflects the Research Analyst s views on a company over the long term (i.e., the next twelve (12) months) relative to other companies covered by the Research Analyst. The trade idea in a paired trade is unrelated to the Research Analyst s long term view of the companies as expressed in the Research Analyst s most recently published research report. A paired trade idea to sell a company that is rated as a market perform or higher, or to buy a security that is a market perform or lower, is not inconsistent because the call to sell or buy the company is relative to the other company mentioned in the paired trade over the short term; it is not a long term view relative to other companies covered by the Research Analyst. Important information for French addresses and potential investors: Addresses and potential investors based in France expressly acknowledge that they have not been subject to any kind of solicitation by FBR Capital Markets & Co, as defined under Article L and seq. of the French Monetary and Financial code. The above analyses have not been prepared in the context of a public offering of financial instruments in France within the meaning of Article L and seq. of the French Monetary and Financial code and shall not be deemed to be drawn up for the purpose of providing investment services as defined under Article L and seq. of the French Monetary and Financial code. In this respect, the above analyses shall not be qualified as a personalized investment advice related to financial instruments under French law and shall therefore not be deemed to be qualified as investment advice provided by FBR Capital Markets & Co. Addresses and potential investors based in France may initiate the first contact with FBR Capital Markets & Co in order to get additional information on financial analyses and services provided by the latter. By doing so, addresses and potential investors based in France expressly acknowledge that the banking and financial solicitation regime as defined under Article L and seq. of the French Monetary and Financial code shall not be applicable. Information for Clients of FBRC: This publication has been approved by FBR Capital Markets & Co. (FBRC), which accepts responsibility for its contents and its distribution to our clients. Any FBRC client who receives this research and wishes to effect a transaction in the securities or financial instruments discussed should contact and place orders with an FBRC Sales representative or a representative of FBR Capital Markets LT, Inc. for financial instruments that are not securities. Copyright 2016 FBR & Co. Page 12

13 Page 13
Breakthrough oral drug delivery technology for diabetes, drugs and vaccines November 5, 2014
 Oramed Pharmaceuticals, Inc. Initiating Report Breakthrough oral drug delivery technology for diabetes, drugs and vaccines November 5, 2014 Key data Sector Rating Biotechnology BUY Target Price $45.00
Trxade Group, Inc. (TCQB: TRXD): Record Revenues in Q3
: Record Revenues in Q3") Siddharth Rajeev, B.Tech, MBA, CFA Analyst November 5, 2015 Trxade Group, Inc. (TCQB: TRXD): Record Revenues in Q3 Sector/Industry: E-commerce Market Data (as of November 5, 2015) Current Price $1.15 Fair
Siddharth Rajeev, B.Tech, MBA, CFA Analyst November 5, 2015 Trxade Group, Inc. (TCQB: TRXD): Record Revenues in Q3 Sector/Industry: E-commerce Market Data (as of November 5, 2015) Current Price $1.15 Fair
MANNKIND CORPORATION (NASDAQGM: MNKD)
") UPDATE REPORT Pharmaceutical Industry February 15, 2013 KEITH A. MARKEY, PH.D., M.B.A. 212-514-7914 KMARKEY@GRIFFINSECURITIES.COM MANNKIND CORPORATION (NASDAQGM: MNKD) CLINICAL TRIALS ON SCHEDULE & FINANCES
UPDATE REPORT Pharmaceutical Industry February 15, 2013 KEITH A. MARKEY, PH.D., M.B.A. 212-514-7914 KMARKEY@GRIFFINSECURITIES.COM MANNKIND CORPORATION (NASDAQGM: MNKD) CLINICAL TRIALS ON SCHEDULE & FINANCES
OptimizeRx OPRX. Buy. Platform Potential Continues to Grow $0.87 $4.00. Refer to the last two pages of this report for Disclosures
 Nov 14, 2014 Healthcare OptimizeRx Platform Potential Continues to Grow Other OTC OPRX Buy Rating Unchanged Current Price $0.87 Target Price $4.00 Market Capitalization 20.32M Shares Outstanding 23.36M
Ituran Location & Control Ltd. In-line Quarter, Big Dividend, Maintain Outperform
 EQUITY RESEARCH COMPANY UPDATE February 23, 2012 Stock Rating: OUTPERFORM 12-18 mo. Price Target $16.00 ITRN - NASDAQ $13.47 3-5 Yr. EPS Gr. Rate 8% 52-Wk Range $16.96-$11.27 Shares Outstanding 21.0M Float
BUY Target: 215p. Strategic impact: cross-selling. Financial impact: good value
 UK Daily Letter 1 K3 Business Technology Group KBT : AIM : 144p BUY Target: 215p Bob Liao, CFA 44.20.7050.6654 bliao@canaccordgenuity.com COMPANY STATISTICS: 52-week Range: 0.82-1.50 Avg. Daily Vol. (000s):
Financial Statement Analysis: An Introduction
 Financial Statement Analysis: An Introduction 2014 Level I Financial Reporting and Analysis IFT Notes for the CFA exam Contents 1. Introduction... 3 2. Scope of Financial Statement Analysis... 3 3. Major
Atrium Mortgage Investment Corporation (TSX: AI) Record Year / Shares at Attractive Entry Levels. Sector/Industry: Mortgage Investment Corporation
 Record Year / Shares at Attractive Entry Levels. Sector/Industry: Mortgage Investment Corporation") Siddharth Rajeev, B.Tech, MBA, CFA Analyst February 17, 2016 Atrium Mortgage Investment Corporation (TSX: AI) Record Year / Shares at Attractive Entry Levels Sector/Industry: Mortgage Investment Corporation
Siddharth Rajeev, B.Tech, MBA, CFA Analyst February 17, 2016 Atrium Mortgage Investment Corporation (TSX: AI) Record Year / Shares at Attractive Entry Levels Sector/Industry: Mortgage Investment Corporation
Understanding mutual fund share classes, fees and certain risk considerations
 Disclosure Understanding mutual fund share classes, fees and certain risk considerations Highlights Mutual funds may offer different share classes most commonly in retail brokerage accounts, Class A, B
In this chapter, we build on the basic knowledge of how businesses
 03-Seidman.qxd 5/15/04 11:52 AM Page 41 3 An Introduction to Business Financial Statements In this chapter, we build on the basic knowledge of how businesses are financed by looking at how firms organize
CONVERTIBLE DEBENTURES A PRIMER
 What are convertible debentures? CONVERTIBLE DEBENTURES A PRIMER They are hybrid securities, combining the features of a conventional debenture with the option of converting, under certain circumstances,
Marketing Software and Web Developer with Clients Nationwide
 Marketing Software and Web Developer with Clients Nationwide This web-development, marketing, and software company, founded in 2000, has developed a loyal, long-term client base, who appreciates its excellent
Salesforce delivered the following results for its fiscal fourth quarter and full fiscal year 2015:
 John Cummings Salesforce Investor Relations 415-778-4188 jcummings@salesforce.com Chi Hea Cho Salesforce Public Relations 415-281-5304 chcho@salesforce.com Salesforce Announces Fiscal 2015 Fourth Quarter
Background information. Changes in the shareholder structure and balance sheet. Contract with Google prolonged for two years
 A cc or # $T ypcap$ 1628 1 0 4 2 Page 1/5 Equity flash Newsflow Telecommunication HOLD (HOLD) Target EUR 4.00 (EUR 4.00) Price (last closing price) : EUR 2.84 Upside : 40 % Est. change 2015e 2016e EPS
Three Months Ended March 31, 2015 Revenues $ 15,420 $ 17,258 Increase in revenues year over year 19% 12%
 Exhibit 99.1 Google Inc. Announces First Quarter 2015 Results MOUNTAIN VIEW, Calif. April 23, 2015 - Google Inc. (NASDAQ: GOOG, GOOGL) today announced financial results for the quarter ended. Google s
OptimizeRx Corporation (OPRX) Pharma/EHR Conference Revelations Strengthen Our Long-Term Outlook; Reiterate BUY, $3.00 Target
 Pharma/EHR Conference Revelations Strengthen Our Long-Term Outlook; Reiterate BUY, $3.00 Target") MERRIMAN CAPITAL Pharma/EHR Conference Revelations Strengthen Our Long-Term Outlook; Reiterate BUY, $3.00 Target Brian Murphy (646) 292-1411 bmurphy@merrimanco.com October 3, 2014 Key Metrics Price: $1.20
MERRIMAN CAPITAL Pharma/EHR Conference Revelations Strengthen Our Long-Term Outlook; Reiterate BUY, $3.00 Target Brian Murphy (646) 292-1411 bmurphy@merrimanco.com October 3, 2014 Key Metrics Price: $1.20
Salesforce Announces Fiscal 2016 First Quarter Results Becomes First Enterprise Cloud Computing Company to Reach $6 Billion Revenue Run Rate
 John Cummings Salesforce Investor Relations 415-778-4188 jcummings@salesforce.com Chi Hea Cho Salesforce Public Relations 415-281-5304 chcho@salesforce.com Salesforce Announces Fiscal 2016 First Quarter
Global Telecom & Technology Reports Fourth Quarter and Full Year 2010 Results
 Global Telecom & Technology Reports Fourth Quarter and Full Year 2010 Results MCLEAN, Va. (BUSINESS WIRE Global Telecom & Technology, Inc. ( GTT, (OTCBB: GTLT, a global telecommunications carrier and leading
Verifone Reports Results for the Second Quarter of Fiscal 2016
 Verifone Reports Results for the Second Quarter of Fiscal 2016 SAN JOSE, Calif. (BUSINESS WIRE) Verifone (NYSE: PAY), a world leader in payments and commerce solutions, today announced financial results
JPMORGAN CHASE & CO FORM FWP. (Free Writing Prospectus - Filing under Securities Act Rules 163/433) Filed 07/16/14
 Filed 07/16/14") JPMORGAN CHASE & CO FORM FWP (Free Writing Prospectus - Filing under Securities Act Rules 163/433) Filed 07/16/14 Address 270 PARK AVE 38TH FL NEW YORK, NY 10017 Telephone 2122706000 CIK 0000019617 Symbol
JPMORGAN CHASE & CO FORM FWP (Free Writing Prospectus - Filing under Securities Act Rules 163/433) Filed 07/16/14 Address 270 PARK AVE 38TH FL NEW YORK, NY 10017 Telephone 2122706000 CIK 0000019617 Symbol
SunGard Brokerage & Securities Services, LLC Unaudited Statement of Financial Condition June 30, 2013
 Unaudited Statement of Financial Condition Index Page(s) Financial Statements Statement of Financial Condition... 3 Notes to the Financial Statements... 4 9 Statement of Financial Condition Assets Note(s)
Imperial Holdings, Inc.
 Imperial Holdings, Inc. NYSE: IFT July 2011 1 Legal Disclaimer Neither Imperial Holdings, Inc. ( Imperial ) nor its affiliates ( the Company ) make any representations or warranties, express or implied,
Greg Flower Wealth Management. Discretionary Wealth Management
 Greg Flower Wealth Management Discretionary Wealth Management Disclaimer The information included in this document, including any opinion, is based on various sources believed to be reliable, but its accuracy
SUMMARY PROSPECTUS. TCW High Yield Bond Fund FEBRUARY 29 I SHARE: TGHYX N SHARE: TGHNX
 TCW High Yield Bond Fund I SHARE: TGHYX N SHARE: TGHNX 20 6 FEBRUARY 29 SUMMARY PROSPECTUS Before you invest, you may want to review the Fund s Prospectus which contain more information about the Fund
Consolidated Financial Results for Fiscal Year 2013 (April 1, 2013 March 31, 2014)
") Consolidated Financial Results for Fiscal Year 2013 (April 1, 2013 March 31, 2014) 28/4/2014 Name of registrant: ShinMaywa Industries, Ltd. Stock Exchange Listed: Tokyo Code number: 7224 (URL: http://www.shinmaywa.co.jp
Consolidated Financial Results for Fiscal Year 2013 (April 1, 2013 March 31, 2014) 28/4/2014 Name of registrant: ShinMaywa Industries, Ltd. Stock Exchange Listed: Tokyo Code number: 7224 (URL: http://www.shinmaywa.co.jp
Market Linked Certificates of Deposit
 Market Linked Certificates of Deposit This material was prepared by Wells Fargo Securities, LLC, a registered brokerdealer and separate non-bank affiliate of Wells Fargo & Company. This material is not
The Kansai Electric Power Company, Incorporated and Subsidiaries
 The Kansai Electric Power Company, Incorporated and Subsidiaries Consolidated Financial Statements for the Years Ended March 31, 2003 and 2002 and for the Six Months Ended September 30, 2003 and 2002 The
1. Basis of Preparation. 2. Summary of Significant Accounting Policies. Principles of consolidation. (a) Foreign currency translation.
 Foreign currency translation.") Nitta Corporation and Subsidiaries Notes to Consolidated Financial Statements March 31, 1. Basis of Preparation The accompanying consolidated financial statements of Nitta Corporation (the Company ) and
Nitta Corporation and Subsidiaries Notes to Consolidated Financial Statements March 31, 1. Basis of Preparation The accompanying consolidated financial statements of Nitta Corporation (the Company ) and
TITAN MEDICAL INC. Unaudited Condensed Interim Financial Statements Three and Nine Months Ended September 30, 2014 and 2013 (IN UNITED STATES DOLLARS)
") Unaudited Condensed Interim Financial Statements and 2013 (IN UNITED STATES DOLLARS) Unaudited Condensed Interim Balance Sheets As at September 30, 2014 and December 31, 2013 ASSETS CURRENT September 30,
Unaudited Condensed Interim Financial Statements and 2013 (IN UNITED STATES DOLLARS) Unaudited Condensed Interim Balance Sheets As at September 30, 2014 and December 31, 2013 ASSETS CURRENT September 30,
Consolidated Balance Sheets
 Consolidated Balance Sheets March 31 2015 2014 2015 Assets: Current assets Cash and cash equivalents 726,888 604,571 $ 6,057,400 Marketable securities 19,033 16,635 158,608 Notes and accounts receivable:
BBIF Government Securities Fund BBIF Tax-Exempt Fund. Shareholders should retain this Supplement for future reference.
 BBIF Government Securities Fund BBIF Tax-Exempt Fund Supplement dated April 22, 2016 to the Prospectus, Summary Prospectuses and Statement of Additional Information of the Funds, dated January 4, 2016
Morningstar Document Research
 Morningstar Document Research FORM8-K PAYCHEX INC - PAYX Filed: March 25, 2015 (period: March 25, 2015) Report of unscheduled material events or corporate changes. The information contained herein may
Pioneer Funds. Supplement to the Summary Prospectuses, as in effect and as may be amended from time to time, for: May 1, 2015
 Pioneer Funds May 1, 2015 Supplement to the Summary Prospectuses, as in effect and as may be amended from time to time, for: Fund Pioneer Absolute Return Bond Fund Pioneer AMT-Free Municipal Fund Pioneer
INFORMATION CIRCULAR: ALPS ETF TRUST
 INFORMATION CIRCULAR: ALPS ETF TRUST TO: FROM: Head Traders, Technical Contacts, Compliance Officers, Heads of ETF Trading, Structured Products Traders Nasdaq / BX / PHLX Listing Qualifications Department
SPHERIX INCORPORATED (Exact name of registrant as specified in its charter)
") UNITED STATES SECURITIES AND EXCHANGE COMMISSION Washington, D.C. 20549 FORM 8-K CURRENT REPORT Pursuant to Section 13 OR 15(d) of The Securities Exchange Act of 1934 Date of Report (Date of earliest event
UNITED STATES SECURITIES AND EXCHANGE COMMISSION Washington, D.C. 20549 FORM 8-K CURRENT REPORT Pursuant to Section 13 OR 15(d) of The Securities Exchange Act of 1934 Date of Report (Date of earliest event
APPLICATION FOR CONTRACTS FOR DIFFERENCE (CFD) TRADING FACILITY
 TRADING FACILITY") Version No: V002/201100606 APPLICATION FOR CONTRACTS FOR DIFFERENCE (CFD) TRADING FACILITY A Customer s Particulars Customer Name NRIC Trading A/C No Trading Representative (TR) Code Telephone No (Home)
Version No: V002/201100606 APPLICATION FOR CONTRACTS FOR DIFFERENCE (CFD) TRADING FACILITY A Customer s Particulars Customer Name NRIC Trading A/C No Trading Representative (TR) Code Telephone No (Home)
DATRON AG. Investor day supports our positive view. Buy (Buy) 12.50 EUR (12.50 EUR ) BANKHAUS LAMPE // 1 17/09/2015
 12.50 EUR (12.50 EUR ) BANKHAUS LAMPE // 1 17/09/2015") BANKHAUS LAMPE // 1 DATRON AG Investor day supports our positive view 17/09/2015 Buy (Buy) 12.50 EUR (12.50 EUR ) Close 15/09/2015 9.75 EUR Bloomberg: DAR GY WKN: A0V9LA Sector Engineering Share price
BANKHAUS LAMPE // 1 DATRON AG Investor day supports our positive view 17/09/2015 Buy (Buy) 12.50 EUR (12.50 EUR ) Close 15/09/2015 9.75 EUR Bloomberg: DAR GY WKN: A0V9LA Sector Engineering Share price
Wells Fargo Enhanced Stock Market CIT COLLECTIVE FUND DISCLOSURE
 Wells Fargo Enhanced Stock Market CIT COLLECTIVE FUND DISCLOSURE Wells Fargo Enhanced Stock Market CIT This disclosure summarizes information about the Enhanced Stock Market CIT N and N20 classes that
EATON VANCE HEXAVEST GLOBAL EQUITY FUND Supplement to Summary Prospectus dated December 1, 2015
 EATON VANCE HEXAVEST GLOBAL EQUITY FUND Supplement to Summary Prospectus dated December 1, 2015 1. The following replaces Fees and Expenses of the Fund : Fees and Expenses of the Fund This table describes
OptimizeRx Corporation (OPRX)
") MERRIMAN CAPITAL The Fragmented EHR Landscape Is Ripe For Intermediation, OPRX Is Positioned Well; Reiterate BUY Brian Murphy (646) 292-1411 bmurphy@merrimanco.com March 27, 2015 Key Metrics Price: $1.37
MERRIMAN CAPITAL The Fragmented EHR Landscape Is Ripe For Intermediation, OPRX Is Positioned Well; Reiterate BUY Brian Murphy (646) 292-1411 bmurphy@merrimanco.com March 27, 2015 Key Metrics Price: $1.37
Trends and Technology A Capital Markets Perspective
 EQUITY I RESEARCH Trends and Technology A Capital Markets Perspective RBC Capital Markets, LLC Jonathan Atkin (Analyst) (415) 633-8589 jonathan.atkin@rbccm.com January 2013 All values in U.S. dollars unless
TITAN MEDICAL INC. Unaudited Condensed Interim Financial Statements Three and Six Months Ended June 30, 2013 and 2012
 Unaudited Condensed Interim Financial Statements Three and and 2012 Unaudited Condensed Interim Balance Sheets As at June 30, 2013 and December 31, 2012 ASSETS CURRENT June 30, 2013 December 31, 2012 Cash
PAYCHEX, INC. REPORTS THIRD QUARTER RESULTS
 PAYCHEX, INC. REPORTS THIRD QUARTER RESULTS March 25, 2015 THIRD QUARTER FISCAL 2015 HIGHLIGHTS Total service revenue increased 8% to $693.6 million for the third quarter; 9% for the nine months. Payroll
Consolidated Balance Sheets March 31, 2001 and 2000
 Financial Statements SEIKAGAKU CORPORATION AND CONSOLIDATED SUBSIDIARIES Consolidated Balance Sheets March 31, 2001 and 2000 Assets Current assets: Cash and cash equivalents... Short-term investments (Note
Small to Mid Cap Stock Funds
 Wells Fargo Advantage Funds August 1, 2014 Small to Mid Cap Stock Funds Prospectus Institutional Class Intrinsic Small Cap Value Fund WFSSX Small Cap Value Fund WFSVX Small/Mid Cap Value Fund WWMSX Special
ico Therapeutics Inc. Condensed Interim Financial Statements (Unaudited) September 30, 2012 and 2011 (in Canadian dollars)
 September 30, 2012 and 2011 (in Canadian dollars)") Condensed Interim Financial Statements (Unaudited) September 30, 2012 and 2011 Balance Sheet (Unaudited) Assets Note September 30, 2012 December 31, 2011 Current assets Cash and cash equivalents 1,478,167
Condensed Interim Financial Statements (Unaudited) September 30, 2012 and 2011 Balance Sheet (Unaudited) Assets Note September 30, 2012 December 31, 2011 Current assets Cash and cash equivalents 1,478,167
Reverse Convertible Notes Linked to the Common Stock of Best Buy Co., Inc.
 REVERSE CONVERTIBLE NOTES I RBC STRUCTURED NOTES Reverse Convertible Notes Linked to the Common Stock of KEY TERMS POTENTIAL RETURNS IF THE REFERENCE STOCK FALLS BELOW THE BARRIER PRICE BEFORE THE MATURITY
USAA Investment Management Company USAA Managed Portfolios - UMP Program (Appendix 1)
") USAA Investment Management Company USAA Managed Portfolios - UMP Program (Appendix 1) 9800 Fredericksburg Road San Antonio, TX 78288-0227 877-314-2255 usaa.com June 1, 2016 This wrap fee program brochure
USAA Investment Management Company USAA Managed Portfolios - UMP Program (Appendix 1) 9800 Fredericksburg Road San Antonio, TX 78288-0227 877-314-2255 usaa.com June 1, 2016 This wrap fee program brochure
Performance Food Group Company Reports First-Quarter Fiscal 2016 Earnings
 NEWS RELEASE For Immediate Release November 4, 2015 Investors: Michael D. Neese VP, Investor Relations (804) 287-8126 michael.neese@pfgc.com Media: Joe Vagi Manager, Corporate Communications (804) 484-7737
FINANCIAL SUMMARY. (All financial information has been prepared in accordance with U.S. generally accepted accounting principles)
") FINANCIAL SUMMARY FY2015 First Quarter (April 1, 2014 through June 30, 2014) English translation from the original Japanese-language document TOYOTA MOTOR CORPORATION FY2015 First Quarter Consolidated
FINANCIAL SUMMARY FY2015 First Quarter (April 1, 2014 through June 30, 2014) English translation from the original Japanese-language document TOYOTA MOTOR CORPORATION FY2015 First Quarter Consolidated
Media Contact: Mike Conway Director, Corporate Communications Sherwin-Williams Direct: 216.515.4393 Pager: 216.422.3751 mike.conway@sherwin.
 The Sherwin-Williams Company Reports First Quarter 2012 Financial Results Consolidated net sales increased 15.1% to a record $2.14 billion Diluted net income per common share increased 50.8% to a record
Clime Capital Limited (CAM)
") Clime Capital Limited (CAM) Listed Managed Investments September 2012 Quarterly Review WHO IS IIR? Independent Investment Research Pty Ltd, IIR is an independent investment research house in Australia.
Clime Capital Limited (CAM) Listed Managed Investments September 2012 Quarterly Review WHO IS IIR? Independent Investment Research Pty Ltd, IIR is an independent investment research house in Australia.
Zebra Technologies Announces Record Sales for Second Quarter of 2006
 FOR IMMEDIATE RELEASE Zebra Technologies Announces Record Sales for Second Quarter of 2006 Vernon Hills, IL, July 26, 2006 Zebra Technologies Corporation (NASDAQ: ZBRA) today announced that net income
TransUnion Reports Third Quarter 2014 Results
 TransUnion Reports Third Quarter 2014 Results Revenue of $338 million, an increase of 13 percent on a GAAP basis (14 percent on a constant currency basis) compared with the third quarter of 2013 Adjusted
Review Notes Linked to the Lesser Performing of the S&P 500 Index and the Russell 2000 Index due September 23, 2019
 Registration Statement No. 333-199966; Rule 433 August 27, 2015 JPMorgan Chase & Co. Structured Investments Review Notes Linked to the Lesser Performing of the S&P 500 Index and due September 23, 2019
Large Cap Stock Funds
 Wells Fargo Advantage Funds December 1, 2014 Large Cap Stock Funds Prospectus Class R4* Capital Growth Fund WCGRX Intrinsic Value Fund EIVRX Large Cap Growth Fund SLGRX Premier Large Company Growth Fund
The Merchant Securities FTSE 100. Hindsight II Note PRIVATE CLIENT ADVISORY
 The Merchant Securities FTSE 100 Hindsight II Note Our first FTSE-100 Hindsight Note is now fully subscribed; however, as a result of exceptional investor demand we are launching the FTSE- 100 Hindsight
Consolidated Interim Earnings Report
 Consolidated Interim Earnings Report For the Six Months Ended 30th September, 2003 23th Octorber, 2003 Hitachi Capital Corporation These financial statements were prepared for the interim earnings release
Consolidated and Non-Consolidated Financial Statements
 May 13, 2016 Consolidated and Non-Consolidated Financial Statements (For the Period from April 1, 2015 to March 31, 2016) 1. Summary of Operating Results (Consolidated) (April 1,
General Cable Corporation (Exact name of registrant as specified in its charter)
") UNITED STATES SECURITIES AND EXCHANGE COMMISSION WASHINGTON, D.C. 20549 FORM 8-K/A CURRENT REPORT PURSUANT TO SECTION 13 OR 15(d) OF THE SECURITIES EXCHANGE ACT OF 1934 Date of Report (Date of earliest
UNITED STATES SECURITIES AND EXCHANGE COMMISSION WASHINGTON, D.C. 20549 FORM 8-K/A CURRENT REPORT PURSUANT TO SECTION 13 OR 15(d) OF THE SECURITIES EXCHANGE ACT OF 1934 Date of Report (Date of earliest
UNITED STATES SECURITIES AND EXCHANGE COMMISSION Washington, D.C. 20549 FORM 8-K
 UNITED STATES SECURITIES AND EXCHANGE COMMISSION Washington, D.C. 20549 FORM 8-K CURRENT REPORT PURSUANT TO SECTION 13 OR 15(d) OF THE SECURITIES EXCHANGE ACT OF 1934 May 8, 2014 Date of Report (Date of
NORWEGIAN CRUISE LINE HOLDINGS LTD. CONSOLIDATED STATEMENTS OF OPERATIONS (unaudited, in thousands, except share and per share data)
") CONSOLIDATED STATEMENTS OF OPERATIONS (unaudited, in thousands, except share and per share data) Revenue Passenger ticket $ 583,923 $ 490,322 $ 1,400,470 $ 1,257,871 Onboard and other 213,962 184,089 569,479
CONSOLIDATED STATEMENTS OF OPERATIONS (unaudited, in thousands, except share and per share data) Revenue Passenger ticket $ 583,923 $ 490,322 $ 1,400,470 $ 1,257,871 Onboard and other 213,962 184,089 569,479
STRUCTURED INVESTMENTS Opportunities in U.S. Equities
 STRUCTURED INVESTMENTS Opportunities in U.S. Equities Trigger PLUS Based on the Value of the S&P 500 Index due November 27, 2023 November 2013 Preliminary Terms No. 1,134 Registration Statement No. 333-178081
GeoResources, Inc. Reports First Quarter Financial and Operational Results
 GeoResources, Inc. Reports First Quarter Financial and Operational Results Reports First Quarter Adjusted Net Income of $11.5 Million or $0.44 Per Share and Adjusted EBITDAX of $30.4 Million Houston, Texas,
Important Information about Closed-End Funds and Unit Investment Trusts
 Robert W. Baird & Co. Incorporated Important Information about Closed-End Funds and Unit Investment Trusts Baird has prepared this document to help you understand the characteristics and risks associated
Fidelity Bankshares, Inc.
 Savings & Loans October 19, 2005 Gary P. Tenner, CFA 404 926-5156 Ö~êó íéååéê]êüåçkåçã= Lauren M. Johnson 404-926-5438 ä~ìêéå àçüåëçå]êüåçkåçã= ==== Summary Fidelity Bankshares, Inc. Rating: Neutral Estimate
STATEMENT OF FINANCIAL CONDITION
 STATEMENT OF FINANCIAL CONDITION First Clearing, LLC (A wholly owned limited liability company of Wells Fargo Advisors, LLC) (With Report from Independent Registered Public Accounting Firm Thereon) (A
Daily Income Fund Retail Class Shares ( Retail Shares )
") Daily Income Fund Retail Class Shares ( Retail Shares ) Money Market Portfolio Ticker Symbol: DRTXX U.S. Treasury Portfolio No Ticker Symbol U.S. Government Portfolio Ticker Symbol: DREXX Municipal Portfolio
Daily Income Fund Retail Class Shares ( Retail Shares ) Money Market Portfolio Ticker Symbol: DRTXX U.S. Treasury Portfolio No Ticker Symbol U.S. Government Portfolio Ticker Symbol: DREXX Municipal Portfolio
Alphabet Announces Fourth Quarter and Fiscal Year 2015 Results
 Exhibit 99.1 Alphabet Announces Fourth Quarter and Fiscal Year 2015 Results MOUNTAIN VIEW, Calif. February 1, 2016 Alphabet Inc. (NASDAQ: GOOG, GOOGL) today announced financial results for the quarter
The Options Clearing Corporation
 PROSPECTUS M The Options Clearing Corporation PUT AND CALL OPTIONS This prospectus pertains to put and call security options ( Options ) issued by The Options Clearing Corporation ( OCC ). Certain types
FORWARD-LOOKING STATEMENTS
 This Management s Discussion and Analysis ( MD&A ) has been prepared as of February 3, 2016, and should be read in conjunction with the audited consolidated financial statements of EEStor Corporation (the
Management Discussion and Analysis as of March 31, 2015
 THE ATTACHED AUDITED YEAR END FINANCIAL STATEMENTS FORM AN INTEGRAL PART OF THIS MANAGEMENT DISCUSSION AND ANALYSIS AND ARE HEREBY INCLUDED BY REFERENCE Management Discussion and Analysis as of March 31,
Contact: Ken Bond Karen Tillman Oracle Investor Relations Oracle Corporate Communications 1.650.607.0349 1.650.607.0326
 For Immediate Release Contact: Ken Bond Karen Tillman Oracle Investor Relations Oracle Corporate Communications 1.650.607.0349 1.650.607.0326 ken.bond@oracle.com karen.tillman@oracle.com ORACLE REPORTS
Vision. Options Supplement
 Vision Options Supplement If you wish to trade options in your Securities Account, please read, fill out, sign and return this Options Supplement. Please carefully read the information included in this
Audit Report of Independent Certified Public Accountants
 Audit Report of Independent Certified Public Accountants The Board of Directors Acer Incorporated: We have audited the non-consolidated balance sheets of Acer Incorporated (the Company ) as of June 30,
! "#$ %&!& "& ' - 3+4 &*!&-.,,5///2!(.//+ & $!- )!* & % +, -).//0)& 7+00///2 *&&.4 &*!&- 7.00///2 )!*.//+ 8 -!% %& "#$ ) &!&.
!* & % +, -).//0)& 7+00///2 *&&.4 &*!&- 7.00///2 )!*.//+ 8 -!% %& #$ ) &!&.") ! "#!""#$%$#$#$"& $'"()*+,$-).,/ 012! "#$ %&!& "& '!(&)!*&%+,-).//0 -#$#3-4' &,'1$1# $!-!(.//0)& +01+///2 *&& - 3+4 &*!&-.,,5///2!(.//+ &!(!-6%(!(.//.$(!(.//0)& 01,///2 //+2% &*!&- 5,0///2 //32%!(.//+
! "#!""#$%$#$#$"& $'"()*+,$-).,/ 012! "#$ %&!& "& '!(&)!*&%+,-).//0 -#$#3-4' &,'1$1# $!-!(.//0)& +01+///2 *&& - 3+4 &*!&-.,,5///2!(.//+ &!(!-6%(!(.//.$(!(.//0)& 01,///2 //+2% &*!&- 5,0///2 //32%!(.//+
FREQUENTLY ASKED QUESTIONS ABOUT RULE 10b - 18 AND STOCK REPURCHASE PROGRAMS
 FREQUENTLY ASKED QUESTIONS ABOUT RULE 10b - 18 AND STOCK REPURCHASE PROGRAMS The Regulation What is Rule 10b-18? Rule 10b-18 provides an issuer (and its affiliated purchasers ) with a non-exclusive safe
HARMONIC DRIVE SYSTEMS INC. AND CONSOLIDATED SUBSIDIARIES CONSOLIDATED FINANCIAL STATEMENTS MARCH 31, 2013
 HARMONIC DRIVE SYSTEMS INC. AND CONSOLIDATED SUBSIDIARIES CONSOLIDATED FINANCIAL STATEMENTS MARCH 31, 2013 HARMONIC DRIVE SYSTEMS INC. AND CONSOLIDATED SUBSIDIARIES CONSOLIDATED BALANCE SHEETS ASSETS
GUIDE TO INVESTING IN MARKET LINKED CERTIFICATES OF DEPOSIT
 GUIDE TO INVESTING IN MARKET LINKED CERTIFICATES OF DEPOSIT What you should know before you buy What are Market Linked CDs? are a particular type of structured investment issued by third-party banks. A
BlackBerry Reports 2015 Fiscal First Quarter GAAP Profitability
 NEWS RELEASE FOR IMMEDIATE RELEASE June 19, BlackBerry Reports 2015 Fiscal First Quarter GAAP Profitability Waterloo, ON BlackBerry Limited (NASDAQ: BBRY; TSX: BB), a global leader in mobile communications,
Tetragon Financial Group Limited ( TFG )
") Tetragon Financial Group Limited ( TFG ) 12 August 2014 THE INFORMATION CONTAINED HEREIN DOES NOT CONSTITUTE AN OFFER TO SELL OR A SOLICITATION OF AN OFFER TO PURCHASE ANY SECURITY OF TFG. THIS INFORMATION
Tetragon Financial Group Limited ( TFG ) 12 August 2014 THE INFORMATION CONTAINED HEREIN DOES NOT CONSTITUTE AN OFFER TO SELL OR A SOLICITATION OF AN OFFER TO PURCHASE ANY SECURITY OF TFG. THIS INFORMATION
Guggenheim Securities, LLC
 Guggenheim Securities, LLC General Information No one associated with Guggenheim Securities, LLC ( Guggenheim Securities ) is authorized to render tax or legal advice, and you should not rely upon such
Thomas A. Bessant, Jr. (817) 335-1100
 335-1100") Additional Information: Thomas A. Bessant, Jr. (817) 335-1100 For Immediate Release ********************************************************************************** CASH AMERICA FIRST QUARTER NET INCOME
Additional Information: Thomas A. Bessant, Jr. (817) 335-1100 For Immediate Release ********************************************************************************** CASH AMERICA FIRST QUARTER NET INCOME
FREQUENTLY ASKED QUESTIONS ABOUT RIGHTS OFFERINGS
 FREQUENTLY ASKED QUESTIONS ABOUT RIGHTS OFFERINGS Background What is a rights offering? A rights offering typically provides an issuer s existing shareholders the opportunity to purchase a pro rata portion
Kingdee (268 HK) Buy (maintained) Target price: HK$3.58. Solidifying leadership in cloud services; maintain Buy but revise TP down to HK$3.
 Buy (maintained) Target price: HK$3.58. Solidifying leadership in cloud services; maintain Buy but revise TP down to HK$3.") Equity Research Information Technology Aug 2, 21 Kingdee (28 HK) Buy (maintained) Target price: HK$.8 Solidifying leadership in cloud services; maintain Buy but revise TP down to HK$.8 Lower-than-expected
Equity Research Information Technology Aug 2, 21 Kingdee (28 HK) Buy (maintained) Target price: HK$.8 Solidifying leadership in cloud services; maintain Buy but revise TP down to HK$.8 Lower-than-expected
Head Traders, Technical Contacts, Compliance Officers, Heads of ETF Trading, Structured Products Traders. Exchange-Traded Fund Symbol CUSIP #
 Information Circular: Reality Shares ETF Trust To: From: Head Traders, Technical Contacts, Compliance Officers, Heads of ETF Trading, Structured Products Traders NASDAQ / BX / PHLX Listing Qualifications
PWM Structured Solutions. May 2011
 PWM Structured Solutions May 2011 Payout at (%) Euro Put Option Iterations Key Features Hypothetical Payoff at (assuming 5.64% premium) Trade: Client Buys European Style OTC Put Option Underlyer: EURUSD
Property and equipment, net 1,043 167 Goodwill, net 59,169 - Other intangibles, net 3,005 - Other assets 892 744
 U.S. SECURITIES AND EXCHANGE COMMISSION WASHINGTON, D.C. 20549 ------------------------------- FORM 10-QSB Quarterly Report under Section 13 or 15(d) of the Securities Exchange Act of 1934 For the quarterly
Indian Accounting Standard (Ind AS) 7 Statement of Cash Flows
 7 Statement of Cash Flows") Contents Indian Accounting Standard (Ind AS) 7 Statement of Cash Flows Paragraphs OBJECTIVE SCOPE 1 3 BENEFITS OF CASH FLOW INFORMATION 4 5 DEFINITIONS 6 9 Cash and cash equivalents 7 9 PRESENTATION OF
Contents Indian Accounting Standard (Ind AS) 7 Statement of Cash Flows Paragraphs OBJECTIVE SCOPE 1 3 BENEFITS OF CASH FLOW INFORMATION 4 5 DEFINITIONS 6 9 Cash and cash equivalents 7 9 PRESENTATION OF
RISK DISCLOSURE STATEMENT
 RISK DISCLOSURE STATEMENT You should note that there are significant risks inherent in investing in certain financial instruments and in certain markets. Investment in derivatives, futures, options and
MGC Diagnostics Corporation Reports Fiscal Year 2015 Financial Results
 MGC Diagnostics Corporation 350 Oak Grove Parkway Saint Paul, MN 55127 Telephone: (651) 484-4874 Facsimile: (651) 484-4826 FOR IMMEDIATE RELEASE MGC Diagnostics Corporation Reports Fiscal Year 2015 Financial
FIRESWIRL TECHNOLOGIES INC.
 FIRESWIRL TECHNOLOGIES INC. Management Discussion and Analysis of the Financial Condition and Results of Operation, for the three months ended March 31, 2007 and 2006. 1 MANAGEMENT DISCUSSION AND ANALYSIS
Paylocity Announces Second Quarter Fiscal Year 2016 Financial Results
 Paylocity Announces Second Quarter Fiscal Year 2016 Financial Results Q2 2016 Total Revenue of $55.2 million, up 61% year-over-year Q2 2016 Recurring Revenue of $52.3 million, up 61% year-over-year ARLINGTON
LPL Financial Announces Fourth Quarter and Full Year 2015 Results
 Exhibit 99.1 Investor Relations - Chris Koegel, (617) 897-4574 For Immediate Release Media Relations - Brett Weinberg, (980) 321-1904 investor.lpl.com/contactus.cfm LPL Financial Announces Fourth Quarter
Capmark Financial Group Inc. Announces Stand Alone Third Quarter 2014 Earnings Results for its Wholly Owned Subsidiary, Bluestem Brands, Inc.
 Capmark Financial Group Inc. Announces Stand Alone Third Quarter 2014 Earnings Results for its Wholly Owned Subsidiary, Bluestem Brands, Inc. Horsham, PA December 23, 2014 Capmark Financial Group Inc.
Notes to Consolidated Financial Statements Year ended March 31, 2014
 Notes to Consolidated Financial Statements Year ended March 31, 2014 Mitsui Oil Exploration Co., Ltd. and Consolidated Subsidiaries 1. Basis of Presenting Consolidated Financial Statements The accompanying
Retirement Chapters 10 SM Fixed Index Annuity
 Retirement Chapters 10 SM Fixed Index Annuity Personalized Hypothetical Annuity Illustration Prepared For Im A. Client Prepared On May 1, 2015 Prepared By Im A. Producer Producer Firm 123 Any Street Anyplace,
Graphite Electrodes. Imposition of antidumping duty augurs well. Sector Update. ICICI Securities Ltd Retail Equity Research.
 Sector Update Rating matrix Target price Company Old New CMP Potential Upside HEG 225 275 238 19% Graphite India 85 15 91 18% Target period 12-15 months Price performance (%) Return % 1M 3M 6M 12M HEG
Fortinet Reports Strong Third Quarter 2015 Financial Results. Record billings growth of 41% year over year
 Press Release Investor Contact: Media Contact: Michelle Spolver Sandra Wheatley Fortinet, Inc. Fortinet, Inc. 408-486-7837 408-391-9408 mspolver@fortinet.com swheatley@fortinet.com Fortinet Reports Strong