RIVER CROSSINGS: SILVERTOWN TUNNEL
|
|
|
- Rachel Houston
- 10 years ago
- Views:
Transcription
1 TRANSPORT FOR LONDON RIVER CROSSINGS: SILVERTOWN TUNNEL SUPPORTING TECHNICAL DOCUMENTATION BASE YEAR MODEL AUDIT Steer Davies Gleave October 2014 This report provides an independent review of TfL s 2012 base year assignment model. The main purpose of the review was to determine the suitability of the base year model in assessing the impacts of potential river crossing schemes in East and South East London. This report is part of a wider suite of documents which outline our approach to traffic, environmental, optioneering and engineering disciplines, amongst others. We would like to know if you have any comments on our approach to this work. To give us your views, please respond to our consultation at Please note that consultation on the Silvertown Tunnel is running from October December 2014.

2 River Crossings Modelling Review Base Year Model Audit Report May 2014 Prepared for: Transport for London Windsor House Victoria Street London SW1H 0TL Prepared by: Steer Davies Gleave Upper Ground London SE1 9PD +44 (0)
20 7910 5000 www.")
3

4 CONTENTS 1 INTRODUCTION... 1 Study Background... 1 Objectives of this Study MODEL DEVELOPMENT... 3 Model Parameters... 4 Count Data MODEL CALIBRATION & VALIDATION... 9 Matrix Estimation... 9 Model Validation Criteria Model Flow Calibration Journey Time Validation Independent Flow Validation MODEL PERFORMANCE STUDY CONCLUSIONS Future use of the model FIGURES Figure 2.1 Traffic Count Data Screenline Locations... 7 Figure 3.1 Journey Time Routes Map Figure 3.2 Validation Results Journey Time Comparisons Figure 3.3 Traffic Counts for Validation Figure 4.1 AM Peak RSI Data for Blackwall Tunnel Figure 4.2 AM Peak Select Link Analysis for Blackwall Tunnel (northbound). 21 Figure 4.3 Interpeak RSI Data or Blackwall Tunnel Figure 4.4 Interpeak Select Lilnk Analysis for Blackwall Tunnel (northbound) 22 Figure 4.5 PM peak RSI Data for Blackwall Tunnel Figure 4.6 PM Peak Select Link Analysis for Blackwall Tunnel (northbound). 23 Figure 4.7 AM Peak RSI Data for Woolwich Ferry Figure 4.8 AM peak Select Link Analyis for Woolwich Ferry (northbound) Figure 4.9 Interpeak RSI Data for Woolwich Ferry Figure 4.10 Interpeak Select Link Analysis for Woolwich Ferry (northbound).. 26 Figure 4.11 PM Peak RSI Data for Woolwich Ferry Contents
. 21 Figure 4.3 Interpeak RSI Data or Blackwall Tunnel.")
5 Figure 4.12 PM Peak Select Link Analysis for Woolwich ferry (northbound) TABLES Table 2.1 Generalised Cost Parameters... 6 Table 2.2 Dartford Crossing Tolls... 6 Table 2.3 Congestion Charge... 7 Table 3.1 Matrix Estimation Change in Trip Matrix Totals... 9 Table 3.2 AM Peak Comparison of Trip Length Distributions Table 3.3 Interpeak Comparison of Trip Length Distributions Table 3.4 PM Peak Comparison of Trip Length Distributions Table 3.5 Link Flow Validation Criteria and Acceptability Guidelines Table 3.6 Screenline Flow Validation Criterion and Acceptability Guideline 11 Table 3.7 Journey Time Validation Criterion and Acceptability Guideline Table 3.8 Summary of Link Flow Calibration Results Table 3.9 Comparison of Link Flow Calibration to Other HAMS Table 3.10 Turning Flow Validation Table 4.1 Model Demand and Actual Flow through Blackwall Tunnel Table 4.2 Model Demand and Actual Flow Across Woolwich Ferry Table 4.3 Model Demand and Actual Flow Across Dartford Crossings Table 4.4 Model Demand and Actual Flow Through Rotherhithe Tunnel APPENDICES A COUNT SITE LOCATIONS B LINK FLOW CALIBRATION RESULTS (MVR TABLE 10.8) C VALIDATION RESULTS JOURNEY TIME SURVEYS EXISTING RIVER CROSSINGS Contents

6 1 Introduction 1.1 In August 2013, Steer Davies Gleave responded to the brief from Transport for London (TfL) to review the suitability of the River Crossings Model in assessing the impacts of River Crossing options in East and south-east London. 1.2 Steer Davies Gleave was successfully appointed by Transport for London, together with the London Boroughs of Barking, Bexley, Greenwich, Newham and Tower Hamlets in October 2013 to carry out an independent review the River Crossings Model, primarily developed by Mott MacDonald. Study Background 1.3 There has been a lot of development earmarked for south-east (and East) London by To support this growth, there has been substantial investment in Public Transport including the extension and improved connectivity of the Docklands Light Railway (DLR); the construction of Crossrail stations extending to Woolwich Arsenal and Abbey Wood; the Emirates Airline; improvements in London Overground and river boat services. 1.4 However, investments in improving highway capacity have not kept up with demand. As a result, the increased congestion has impacted negatively on businesses and freight movement across London. The main river crossings the Blackwall Tunnel, Rotherhithe Tunnel, the Woolwich Ferry and Dartford Crossing are operating at or close to capacity. 1.5 The Dartford Crossing (also known as the Queen Elizabeth II Bridge) connects Dartford in the south to Thurrock in the North. The crossing forms part of the M25 orbital and currently operates as a tolled crossing. The crossing is managed by an appointed agency on behalf of the Highways Agency. 1.6 The Blackwall Tunnel is a tunnelled crossing underneath the River Thames linking the Royal Borough of Greenwich with the London Borough of Tower Hamlets. The tunnel currently operates as a free crossing for traffic, and connects Central London to the south-east. The tunnel suffers severe tidal congestion, particularly in the peak periods on weekdays with queues on the northbound approach in the morning peak and vice versa in the evening peak periods. The tunnel forms part of the Transport for London Road Network (TLRN) and is managed by TfL. 1.7 The Woolwich Ferry, opened in 1889, is a free boat service linking Woolwich and North Woolwich. It provides a useful connection linking the North and South Circular. The ferry provides a useful alternative to the Blackwall Tunnel, particularly for Lorries, as the tunnel has restrictions on vehicle height. In addition, Woolwich Ferry is the only crossing to the east of Tower Bridge that vehicles carrying hazardous loads are permitted to use. The Woolwich Ferry is in the later stages of its life cycle. Objectives of this Study 1.8 The Mayor has set out proposals to improve the connectivity of River Crossings in London. The proposals include: 1

7 Constructing a new tolled tunnelled crossing linking Silvertown to the Greenwich Peninsula, Introducing a new user charge at Blackwall Tunnel, and Implementing a new toll crossing to replace the Woolwich Ferry. 1.9 Each of these options will have a significant impact on both the local and more strategic highway movements across the East London boroughs, particularly in Tower Hamlets, Newham, Greenwich, Barking and Bexley which are in immediate vicinity of the existing and proposed crossings. Clearly each of the boroughs have significant stake in understanding and evaluating what these options would mean for their residents TfL has developed a River Crossings model to assess the impacts of the proposed river crossings on the highway network. The SATURN model is based on the East London Highway Assignment Model (ELHAM). The model has been developed for the morning, inter-peak and evening peak periods The objectives of this study are to: I I I Review the robustness of the River Crossings model to forecasting demand across the crossings, Review the reliability and scope of count data collected for use in calibrating and validating the model, and Provide an independent audit to assure the affected boroughs that the model developed is fit for purpose and has been developed in accordance with standard industry guidance and best practice. Phased Audit 1.12 The model review was intended to be undertaken in two sub-phases: Phase 1a Review of the Base Year Model Phase 1b Review of the Future Year Reference Case Model 1.13 This report documents our review of the base year model i.e. for Phase 1a ONLY This document comprises five chapters of which this chapter is the introduction. The remaining chapters are as follows: I I I I Chapter Two sets out our summary and comment on model development; Chapter Three sets out our review of base year model calibration and validation; Chapter Four discusses general model performance; and Chapter Five concludes our review of the suitability of the base year River Crossings model to be used as the basis for assessment of future options. 2

8 2 Model Development 2.1 The model development and validation for the base year has been documented in a report published by Mott MacDonald in February 2014 titled Base Year Development and Validation Report (Mott MacDonald, February 2014). Steer Davies Gleave has also received the full model files for the River Crossings Model. East London Highway Assignment Model (ELHAM) 2.2 The 2009 ELHAM Base Year model (Production Version 2) was used as a starting point in developing the River Crossings Base Year. Development of ELHAM prior to Product Version 2 has not been considered as part of the current model audit. 2.3 This model was updated to a 2012 base for the River Crossings model and included the following steps: I I I I Updates to the model network to include schemes in the East London area which had been delivered since A list of changes is provided in Table 5.9 of the Model Validation Report (MVR) and consists of changes to junction operation rather than major new route opportunities. Updates to the demand matrices to include trips associated with housing and employment developments, completed since Forecasts of trip generation have been derived from a total of 10,167 new dwellings, spread over 23 sites ranging from 2,821 new dwellings at Isle of Dogs down to just 14 new homes at Euston. Similarly, trips have been added for different types of employment development, across 36 sites. In both cases, trip generation rates have been derived using TRAVL. Introduction of an adjustment to the modelled capacity of existing river crossings to match observed data. Constraints on capacity are applied to Blackwall Tunnel, Rotherhithe Tunnel, Woolwich Ferry, Dartford Crossing and Tower Bridge. Significant enhancements have been made to the original ELHAM matrices resulting in an increase from 1,471 zones to 2,448 zones. The main enhancements related to the reliability of trips with an origin within an enclosure when compared to LTS highway assignment matrices. I External to external trips, with both an origin and destination outside the M25, are taken from the assignment trip matrices of the Highways Agency M25 Assignment Model. I The resulting prior matrices were then put through a matrix estimation process, for each vehicle type separately, using all counts at all screenlines and enclosures, including the River Thames screenline. 2.4 It is worth noting that no background growth has been applied to the prior matrices between 2009 and This decision was based on observed counts at 16 sites (detailed in Table 6.10 of the MVR). 3
 was used as a starting point in developing the River Crossings Base Year.")
9 Model Parameters Peak Periods 2.5 The model time periods used are consistent with time periods for all highway assignment models developed by TfL. The time periods in the model are: I I I Morning Peak - 08:00 09:00h Inter-peak average hour 10:00h 16:00h Evening Peak 17:00 18:00h 2.6 There is no evidence provided to support that the AM and PM peaks are represented by the hours identified above, but there is no reason to doubt their suitability given the consistency with other HAMs. User Class Definitions 2.7 There are five user classes in the River Crossings model. These are consistent with the user class definitions in ELHAM. These are: I I I I I Cars in work time (IWT) Cars out of work time (OWT) Taxis Light Goods Vehicles (LGVs) Ordinary Goods Vehicles (OGVs) 2.8 The OWT user class includes the commute trip. 2.9 All user classes except OGVs have a PCU value of 1; OGVs have a PCU value of 2. Buses were assigned as fixed flows on set routes in the model. Generalised Cost Parameters & Values of Time The generalised cost parameters for distance (measured in pence per kilometre, PPK) and time (measured in pence per minute, PPM) are summarised in 4

10 2.10 Table 2.1. The generalised cost parameters are based on WebTAG values, but adjusted according to guidance to account for local vehicle occupancy and trip purpose data taken from the HAM roadside interviews, and local average speeds Having reviewed the process for adjusting values for local conditions 1, we conclude that these parameters are appropriate for the River Crossings model. 1 MVA Technical Note 64, TfL Common Approach to Gravity Modelling Generalised Cost Parameter Values (19 April 2013) 5

11 TABLE 2.1 GENERALISED COST PARAMETERS (2009 PRICES, 2012 VALUES) AM Peak Inter-peak Evening peak PPM PPK PPM PPK PPM PPK UC UC UC UC UC Tolls on the Dartford Crossing 2.12 Since November 2008, local residents who most likely need to use the Dartford Crossing on a regular basis have been able to register for reduced toll charges. An up-front annual charge (currently 10) pays for the first 50 crossings, and also allows additional crossings to be made in the same calendar year for a reduced fee (currently 20p) In addition, there are regular users who receive discounts through the DART-Tag system and some users are exempt. Furthermore, the difference in charges between light and heavy goods vehicles is not entirely consistent with the modelled user class definitions Each of these issues has been taken into account to derive adjustments to advertised toll values to apply to the model. These are indicated in Table 2.2. TABLE 2.2 DARTFORD CROSSING TOLLS (2009 PRICES, 2012 VALUES) Cars Vans Goods Vehicles Full Advertised Toll DART-Tag Modelled Values
 pays for the first 50 crossings, and also allows additional crossings to be made in the same calendar year for a reduced fee (currently 20")

12 Central London Congestion Charge 2.15 The following table shows the Congestion Charge values applied across the day. TABLE 2.3 CONGESTION CHARGE User Class Charge UC1 Cars IWT 1.35 UC2 Cars OWT 1.35 UC3 Taxis 0 UC4 LGVs 2.03 UC5 - OGVs 2.14 Count Data Count Sites 2.16 A significant amount of traffic count data has been made available for the model update, providing a comprehensive coverage of routes within East London. Counts data was collected in either 2009 or 2012, and analysis of data from long term continuous automatic counters was used to conclude that there is no reason to apply growth to the 2009 data to reflect 2012 conditions There are 28 separate screenlines, with counts in each direction, providing observed data for 627 individual links. The geographical spread of screenlines is illustrated in Figure 2.1 FIGURE 2.1 TRAFFIC COUNT DATA SCREENLINE LOCATIONS 7

13 2.18 These data are supplemented by a further 11 enclosures, again in both directions, providing count data at an additional 525 locations. Enclosures form part of the Continuous Roadside Interview Survey Programme (CRISP) These data have been used for matrix estimation, and matrix updates are carried out separately for cars, taxis, lgvs and ogvs Initially, it was the intention to hold back the River Screenline from the matrix estimation process, to use in flow validation. However, resulting comparison of River Screenline flows was poor, particularly at Rotherhithe, and it was subsequently agreed to include all data for matrix estimation, at the expense of retaining data for independent validation. Additional Counts Borough Counts 2.21 The coverage of data provided by the screenlines and enclosures was reviewed by TfL and the London Boroughs, resulting in the collection of data at a number of additional locations, referred to as Borough Counts. These reflect gap locations where the Boroughs identified important sections of route not already included as part of the screenline/enclosure data sets This added data for a further 52 location, by direction, given a total of 104 additional link counts for use in the matrix estimation A plan showing the location of all screenline and Borough Count sites, as well as enclosure definitions, is provided at Appendix A. 8

14 3 Model Calibration & Validation Matrix Estimation 3.1 As discussed briefly above, all screenline, enclosure and Borough counts were used for matrix estimation. The change in prior and post matrix estimation matrix totals is +1% across the AM peak and +4% in the Interpeak and PM peak. Table 3.1 provides a summary of numbers of trips by each user class and for each model time period. TABLE 3.1 MATRIX ESTIMATION CHANGE IN TRIP MATRIX TOTALS Car OWT Car IWT Taxi LGV OGV Total AM Peak Prior 4,574, ,316 27, ,158 92,168 5,596,241 Post 4,604, ,439 25, ,703 91,220 5,634,189 %Diff 1% 1% -7% 5% -1% 1% Interpeak Prior 3,200, ,462 36, , ,586 4, Post 3,317, ,540 37, , ,505 4,422,022 %Diff 4% 4% 1% 6% -2% 4% PM Peak Prior 4,488, ,329 41, ,922 59,278 5,310,230 Post 4,673, ,295 41, ,550 54,667 5,521,994 %Diff 4% 4% -2% 6% -8% 4% 3.2 At an individual level, we see a 7% reduction in AM peak taxi trips following matrix estimation, but it should be noted that taxis represent less than 0.05% of all vehicle trips. 3.3 In the PM peak, we get a similarly large percentage reduction in OGV trips, but it is again noted that OGVs form less than 1% of total vehicle trips. 3.4 As well as matrix totals the change in trip length distributions following matrix estimation is also considered. Tables 4 to 6 in Appendix I of the MVR provide a summary of changes in mean and standard deviation of trip length, for each time period and each user class. The tables are repeated below. 3.5 All changes are generally within 5% for both mean trip distance and standard deviation, and changes of this size are not considered significant. 9

15 TABLE 3.2 AM PEAK COMPARISON OF TRIP LENGTH DISTRIBUTIONS Car OWT Car IWT Taxi LGV OGV Total Prior Mean Standard Dev Post Mean Standard Dev %Diff Mean -2.9% -2.9% -10.2% -1.1% -1.9% -2.7% Standard Dev -1.5% -1.5% -5.2% -0.5% -1.0% -1.4% TABLE 3.3 INTERPEAK COMPARISON OF TRIP LENGTH DISTRIBUTIONS Car OWT Car IWT Taxi LGV OGV Total Prior Mean Standard Dev Post Mean Standard Dev %Diff Mean -3.0% -2.1% -4.2% -0.4% -2.8% -2.6% Standard Dev -1.5% -1.1% -2.1% -0.2% -1.4% -1.3% TABLE 3.4 PM PEAK COMPARISON OF TRIP LENGTH DISTRIBUTIONS Car OWT Car IWT Taxi LGV OGV Total Prior Mean Standard Dev Post Mean Standard Dev %Diff Mean -2.3% -2.4% -8.7% -0.7% -0.7% -2.0% Standard Dev -1.2% -1.2% -4.4% -0.4% -0.3% -1.0% 10

16 3.6 The greatest changes are seen for AM peak taxis, which reflect the change on matrix totals for this user class in Table 3.1. Although Table 3.1 also identified a significant change in OGV trips in the PM peak, average trip lengths and standard deviations retain a close relationship for this user class. 3.7 The change in the numbers of trips and trip length distributions as a result of the matrix estimation process is reasonable and offers no cause for concern. Model Validation Criteria 3.8 At the time of the model update, flow validation criteria were defined in WebTAG unit 3.19, which was replaced in October 2013 by TAG Unit M3.1. The criteria are repeated below for link flows, screenline totals and journey time comparisons and it is noted that paragraph of Unit M3.1 states that link flows that meet either criterion should be regarded as satisfactory. TABLE 3.5 GUIDELINES LINK FLOW VALIDATION CRITERIA AND ACCEPTABILITY Criteria Description of Criteria Acceptability Guideline 1 Individual flows within 100 veh/h of counts for flows less than 700 veh/h Individual flows within 15% of counts for flows from 700 to 2,700 veh/h Individual flows within 400 veh/h of counts for flows more than veh/h >85% of cases 2 GEH <5 for individual flows >85% cases TABLE 3.6 GUIDELINE Criteria SCREENLINE FLOW VALIDATION CRITERION AND ACCEPTABILITY Acceptability Guideline Differences between modelled flows and counts should be less than 5% of the counts All or nearly all screenlines TABLE 3.7 GUIDELINE Criteria JOURNEY TIME VALIDATION CRITERION AND ACCEPTABILITY Acceptability Guideline Modelled times along routes should be 15% of surveyed times (or 1 minute, if higher) >85% of routes 3.9 WebTAG notes that the acceptability guidelines should be applied to both link flow and turning counts, but acknowledges that guidelines may be difficult to achieve for turning movements. 11

17 Model Flow Calibration 3.10 The MVR provides comparisons of modelled flows to screenlines/ enclosure/ Borough count locations for both the scenario where the River Thames screenline was included or excluded from matrix estimation. It is understood that the final version of the model agreed with TfL reflects the results with all counts, including the River Thames screenline, and it is that version that is reported here Link flow comparisons are reported in section of the MVR, and particularly in Table 10.8 which is repeated in Appendix B A summary of the link flow comparisons is shown in Table 3.8, along with calculation of the overall results for all link count locations. TABLE 3.8 SUMMARY OF LINK FLOW CALIBRATION RESULTS AM IP PM Count Type No. of sites Flow criteria GEH Flow criteria GEH Flow criteria GEH Screenline % 67% 82% 78% 68% 65% Enclosure % 59% 86% 67% 72% 55% Borough % 83% 88% 85% 77% 73% All % 65% 84% 74% 71% 61% 3.13 It is seen that results are strongest for the Borough Count locations, with relatively similar results displayed for screenline and enclosure count locations Across all screenlines, the percentage of screenline flow comparisons achieving the WebTAG acceptability guideline is as follows: I AM Peak 62% I Interpeak 89% I PM Peak 74% 3.15 It is clear that the results outlined above do not meet the acceptability guidelines contained in TAG Unit M3.1. However, it could be argued that the results are as good as we might expect for a model of this size and complexity The results have been benchmarked against the results achieved for four out of the other 5 HAMs for which information is available. The comparison is shown below. It can be seen that compliance with WebTAG acceptability guidelines is rarely achieved across any of the HAMs and it is also noted that the River Crossing model results generally represent an improvement on the ELHAM results from which it has been derived For this reason, it is concluded that calibration of link flow is acceptable. 12

18 TABLE 3.9 COMPARISON OF LINK FLOW CALIBRATION TO OTHER HAMS CLoHAM WeLHAM SoLHAM ELHAM River Crossing Number of Screenlines Number of Counts AM Peak Links WebTAG Flow Criteria 84% 69% 63% 61% 75% Links GEH<5 82% 68% 57% 60% 65% Screenline Flow Diff <5% 52% 77% 69% 86% 62% Enclosure Flow Diff <5% 39% 75% 68% 73% Interpeak Links WebTAG Flow Criteria 84% 80% 73% 62% 84% Links GEH<5 81% 74% 66% 59% 74% Screenline Flow Diff <5% 48% 63% 79% 78% 89% Enclosure Flow Diff <5% 39% 56% 71% 55% PM Peak Links WebTAG Flow Criteria 85% 68% 66% 54% 71% Links GEH<5 82% 64% 60% 53% 61% Screenline Flow Diff <5% 45% 77% 75% 88% 74% Enclosure Flow Diff <5% 29% 81% 61% 68% Journey Time Validation 3.18 A comparison of modelled and observed journey times has been made across a total of 62 key routes, which are illustrated in Figure Observed journey times along each route have been derived from TrafficMaster data. The data represents 2011 conditions and there is no reason to discount the conclusion that similar conditions would be observed in 2012, on the basis that there had been no growth in traffic levels between 2009 and Key routes in relation to any study of new river crossings are Blackwall Tunnel (Routes 1&2) and Dartford Crossing (Routes 87&88). No data has been derived for cross river routes using Rotherhithe Tunnel A validation of TrafficMaster data has been carried out against Moving Car Observer (MCO) surveys along the Blackwall Tunnel routes. It is reported that correlation is good except in the PM peak in the northbound direction. As a result, the TrafficMaster data was replaced with MCO records for this particular PM northbound route. 13


19 3.22 Further evidence that TrafficMaster data is robust and is fit for using in future HAM journey time validation has been provided 2, based on detailed analysis against MCO data for 16 routes in the South London HAM model area. FIGURE 3.1 JOURNEY TIME ROUTES MAP 3.23 WebTAG guidelines for journey time acceptability state that modelled times across routes should be within 15% or one minute of observed times, or whichever is greater, for more than 85% of route comparisons Validation results are shown in Figure 3.2 for each of the AM Peak, Interpeak and PM Peak Although 90% of routes achieve the acceptability criteria in the interpeak, the results are lower for the AM peak (76%) and PM peak (68%) Having said that, the key Blackwall Tunnel and Dartford Crossing routes both meet the criteria in each direction and for each peak. 2 Comparison between TrafficMaster and Moving Car Observer Journey Time, Discussion Note TfL Planning Strategic Analysis 14
 and PM peak (68%).")


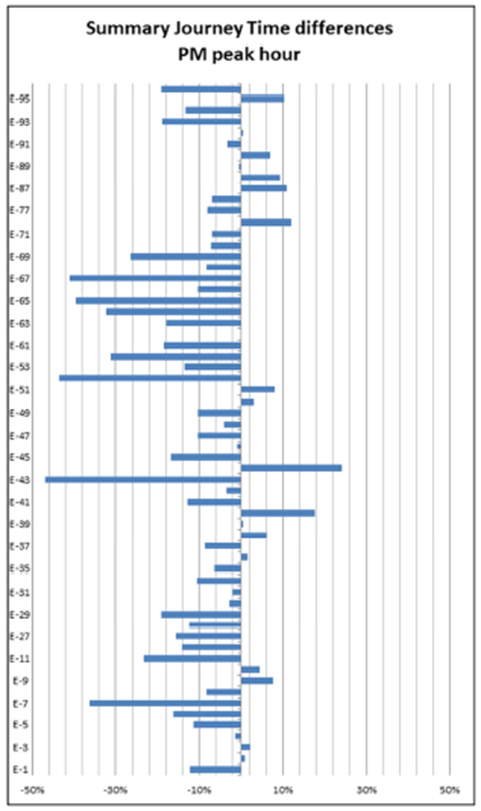
20 FIGURE 3.2 VALIDATION RESULTS JOURNEY TIME COMPARISONS 15

21
22 3.27 Plots showing the comparison of modelled times against observed times for the Blackwall Tunnel and Dartford Crossing routes are provided in Appendix L2 of the MVR, and repeated here at Appendix C For Blackwall Tunnel the match of end-to-end results is very good. Northbound, the modelled times are slightly lower throughout, but much closer in the southbound direction In the PM peak, the model appears slower for much of the southbound route, but this is a result of a specific delay early in the route, beyond which point the model is then relatively faster to the extent that the end-to-end comparison is very close A very similar pattern of results is observed for the Dartford Crossing route, even to the extent that there is a delay along the route shown in the southbound direction in the PM peak. Independent Flow Validation 3.31 Independent turning count data at major junction locations show in Figure 3.3 have been used as an additional check on model flow validation. Counts were taken on a single day and factored to an average week day using 5-day November 2012 counts on adjacent links It had been planned to include more than the 12 counts shown but as a result of camera malfunctions or other similar incidents, numerous sites had to be resurveyed and could no longer be factored to 5-day weekday averages as planned The relatively small sample still provides a relatively good coverage of approach roads to the main crossing points, however there are no validation turn counts either side of Rotherhithe, nor on the main southern approach to Blackwall Tunnel. These locations, shown as dotted circles on Figure 3.3, would have been nice to have, and would have strengthened the results Traffic counts were undertaken on the southern approach to Blackwall Tunnel but, unfortunately, these needed to be resurveyed due to reasons described in 3.32 above, and could not be consistently factored to November 2012 values. 17

23 FIGURE 3.3 TRAFFIC COUNTS FOR VALIDATION 3.35 The WebTAG acceptability criteria has been applied to turning counts as shown in Table 3.10 TABLE 3.10 TURNING FLOW VALIDATION AM IP PM Flow criteria GEH Flow criteria GEH Flow criteria GEH Turning Flows 85% 56% 88% 55% 81% 45% 3.36 Comparisons of absolute flow values are good, but the results are poor when comparing against GEH<5. Given that TAG Unit M3.1 states that the two measures (flow differences and GAH) are broadly consistent and link flows that meet either criterion should be regarded as satisfactory, these results are considered acceptable. 18
24 4 Model Performance 4.1 One key feature of a robust model is how it represents routing in the base year model in comparison to existing conditions, particularly along key corridors. Steer Davies Gleave has reviewed the routings of trips along the main river crossings in East London. 4.2 TfL has provided Road Side Interview (RSI) plots showing the origin and destination of trips using Blackwall Tunnel and Woolwich Ferry for all time periods, but in the northbound direction only. These have been used to inform and sense-check routing in the base model. It is noted that he plots represent survey responses over a 3-hour period. They are not expanded to counts and we are advised that the sample would be small if restricted to the peak hour. As such, the plots are used as a general check against distribution patterns, rather than actual numbers of trips. Blackwall Tunnel 4.3 The Blackwall Tunnel has been modelled with a capacity of 3,236pcu/hour in the northbound direction for all time periods. Southbound capacity is higher and has small variations between time periods. The southbound capacity is modelled as 3,842 pcu/hour, 3,839 pcu/hour and 3,719 pcu/hour in the AM, Interpeak and PM respectively. 4.4 The modelled capacities reflect observed conditions, derived from 5 day manual classified counts (MCC) taken in November This approach is sound, and is preferable to simple application of generic capacities. 4.5 Table 4.1 shows that cars (user classes 1 and 2) make up the largest proportion of vehicles using the tunnel. The distribution of user classes across time periods is relatively consistent, although we see a higher proportion of cars northbound in the PM peak and fewer OGVs in the PM peak in each direction. 4.6 The main areas of congestion are northbound in the AM peak and southbound in the PM peak where demand flows are significantly higher than both actual flows and modelled capacity. This is broadly consistent with observed conditions through the Tunnel. 4.7 Related to this, the model shows large flows left over from the pre-peak in the northbound morning peak and southbound evening peak. This is to be expected because of tidal flows and the level of congestion in the tunnel during these time periods. 4.8 Bus Route 108 from Lewisham to Stratford the currently the only bus route to use the tunnel. The base year model shows bus flows in the southbound direction, but bus flows are missing in the northbound direction of the tunnel. Northbound bus flows need to be added to future model versions. 19
25 TABLE 4.1 MODEL DEMAND AND ACTUAL FLOW THROUGH BLACKWALL TUNNEL (PCUS) AM Peak Interpeak PM Peak Demand Actual % Demand Demand Actual % Demand Demand Actual % Demand Northbound Fixed % % % UC % % % UC % % % UC % % % UC % % % UC % % % Total % % % Southbound Fixed % % % UC % % % UC % % % UC % % % UC % % % UC % % % Total % % % 4.9 Figures 4.1 to 4.6 show the RSI OD plots and select link analysis for each time period for cars (user class 1) which makes up the largest proportion of trips in the matrix. The flow/routing pattern across the tunnel in the northbound direction is considered reasonable across all time periods However, it is worth noting that the RSI plots show that the Isle of Dogs is a significant destination in the AM and interpeak, and although the select link plots show 18% of trips to the Isle of Dogs this is not easily reflected when shown as a bandwidth in Figure 4.2. In general the pattern of observed trips through Blackwall Tunnel is best matched in the PM peak model. 20
26 FIGURE 4.1 AM PEAK RSI DATA FOR BLACKWALL TUNNEL FIGURE 4.2 AM PEAK SELECT LINK ANALYSIS FOR BLACKWALL TUNNEL (NORTHBOUND) 21

27 FIGURE 4.3 INTERPEAK RSI DATA OR BLACKWALL TUNNEL FIGURE 4.4 INTERPEAK SELECT LILNK ANALYSIS FOR BLACKWALL TUNNEL (NORTHBOUND) 22
28 FIGURE 4.5 PM PEAK RSI DATA FOR BLACKWALL TUNNEL FIGURE 4.6 PM PEAK SELECT LINK ANALYSIS FOR BLACKWALL TUNNEL (NORTHBOUND) 23
29 Woolwich Ferry 4.11 The capacity on the Woolwich Ferry is constrained to the physical capacity of the ferry, and takes account of differing numbers of goods vehicles using the ferry during different time periods. Again, these reflect observed capacities and are higher in the PM peak. The ferry provides a crucial alternative to the Blackwall Tunnel, which has restrictions on vehicle type and height Morning peak flows across the ferry are dominated by goods vehicles, particularly in the northbound direction, whereas we see more car trips in the evening peak. The tunnel is shown to be operating at or close to capacity throughout the day and in each direction, but particularly during peak hours As expected, there are very few taxis or cars in work time, using the ferry There are no bus routes across the ferry and the base year model shows no flows in either direction on the Woolwich Ferry. TABLE 4.2 (PCUS) MODEL DEMAND AND ACTUAL FLOW ACROSS WOOLWICH FERRY AM Peak Interpeak PM Peak Demand Actual % Demand Demand Actual % Demand Demand Actual % Demand Northbound Fixed % % % UC % % % UC % % % UC % % % UC % % % UC % % % Total % % % Southbound Fixed % % % UC % % % UC % % % UC % % % UC % % % UC % % % Total % % % 24


30 4.15 Figures 4.7 to 4.12 show the RSI plots and select link analysis for the morning, evening and inter peak periods. As expected, the RSI data shows that the origin and destination of trips using the ferry are more constrained to the local area and that the ferry caters mostly for trips between the south-east and north-east of the crossing. This observation is also reflected in the select link analysis for all time periods. FIGURE 4.7 AM PEAK RSI DATA FOR WOOLWICH FERRY FIGURE 4.8 AM PEAK SELECT LINK ANALYIS FOR WOOLWICH FERRY (NORTHBOUND) 25

31 FIGURE 4.9 INTERPEAK RSI DATA FOR WOOLWICH FERRY FIGURE 4.10 INTERPEAK SELECT LINK ANALYSIS FOR WOOLWICH FERRY (NORTHBOUND) 26

32 FIGURE 4.11 PM PEAK RSI DATA FOR WOOLWICH FERRY FIGURE 4.12 PM PEAK SELECT LINK ANALYSIS FOR WOOLWICH FERRY (NORTHBOUND) 27
33 Dartford Crossing 4.16 The capacity of the crossing ranges from 4,800pcu/hour in the inter peak to 5,400 and 5,500pcu/hour in the morning and evening peak period respectively. As with other crossings, these capacities are based on observed records The model shows the crossing operating at capacity in all peaks. In fact, model flows (actual and demand) are above capacity in the PM peak. Table 4.3 shows the demand and actual flow across the Dartford Crossing The distribution of traffic by user class is very similar between the AM and interpeak hours. However, the PM peak shows a higher proportion of traffic made up of cars (OWT), largely at the expense of reduced OGVs The River Crossings base year model does not show any bus flow on the Dartford Crossing. Northbound TABLE 4.3 MODEL DEMAND AND ACTUAL FLOW ACROSS DARTFORD CROSSINGS (PCUS) AM Peak Interpeak PM Peak Demand Actual % Demand Demand Actual % Demand Demand Actual % Demand Fixed % % % UC % % % UC % % % UC % % % UC % % % UC % % % Total % % % Southbound Fixed % % % UC % % % UC % % % UC % % % UC % % % UC % % % Total % % % 28
34 Rotherhithe Tunnel 4.20 It is worth noting that the River Crossings is a large model with a wide coverage area (and over 2,400 zones). In the model, the Rotherhithe tunnel is at the boundary of the simulation area and model outputs would need to be interpreted with some caution The capacity in both north and southbound directions is 1210pcu/hour and maintained for all time periods. With the exception of the PM peak in the southbound direction, flows through Rotherhithe are within capacity. It is also noted that the difference between demand flows and actual flows is slight Anecdotal evidence suggests a high level of queuing on approaches to the tunnel, particularly on the southern side at the Jamaica Road junction, and a greater level of difference between demand and actual flows might therefore have been expected. However, further analysis has been undertaken by Mott MacDonald of journey time routes along Jamaica Road. These indicate that although modelled times are generally faster than observed, comparisons along the route pass the validation criterion in all cases except eastbound in the PM peak The demand and actual flows for the Rotherhithe Tunnel are shown in Table Vehicles wider than 1.98m are restricted from using Rotherhithe tunnel. In the model, this is reflected by the banning of OGVs (user class 5) through the use of time penalties (9999 seconds) in both directions. There is no modelled restriction for wider LGVs. This represents a sensible approach, particularly given the model s inability to distinguish between vehicles of different widths There are no bus services operating through Rotherhithe tunnel. 29
35 TABLE 4.4 MODEL DEMAND AND ACTUAL FLOW THROUGH ROTHERHITHE TUNNEL (PCUS) AM Peak Interpeak PM Peak Demand Actual % Demand Demand Actual % Demand Demand Actual % Demand Northbound Fixed % % % UC % % % UC % % % UC % % % UC % % % UC % % % Total % % % Southbound Fixed % % % UC % % % UC % % % UC % % % UC % % % UC % % % Total % % % 30
36 5 Study Conclusions 5.1 The update from ELHAM Production Version 2 to the Base Year 2012 River Crossings Model follows sound methodology. 5.2 The resulting flow validation does not meet WebTAG acceptability guidelines, but we consider both that the results are in improvement on the ELHAM model from which the new model is based, that the results compare favourably to the other HAMs for which results are available, and that the results are as good as might be expected for a model of this size and complexity. 5.3 Similarly, journey time validation does not meet the WebTAG guidelines (85% of routes should be within 15% of surveyed times), but key routes using existing crossings Blackwall Tunnel and Dartford Crossing validate well. 5.4 Considering both link flow and journey time validation together, it could be argued that the AM and Interpeak models are more reliable than the PM peak model. 5.5 The select link analysis compares well to the pattern of trips indicated by the RSI data for Blackwall Tunnel and Woolwich Ferry. Further select link analysis shows that there is little difference between patterns of trips for each user class at these sites. Future use of the model 5.6 It has been noted and agreed that there is a need to include code for northbound bus routes through Blackwall Tunnel. 5.7 Users of the model should be aware that delays on approaches to Rotherhithe Tunnel do not seem to be particularly well represented in the evening peak. Further analysis of journey time routes along Jamaica Road has been undertaken by Mott MacDonald and shows that modelled times are faster than observed in the eastbound direction in the PM peak. However, there is no specific agreement to fix this issue in future versions of the model. 5.8 Our overall conclusion is that the model is fit for the purpose of identifying changes in strategic movements in and around East London should a new crossing be introduced or, for example, if charges for use of existing crossings were to be imposed. However, we do recommend that sensitivity tests are carried out on scheme findings, to give comfort that the model is reacting to change in a defendable manner. 5.9 Furthermore, if future models are to be used to assess impacts at individual junctions, or groups of junctions, it is recommended that the focus should be on changes in model flows between given scenarios, rather than basing operational analyses directly on model output flows. This is consistent with approach used elsewhere in London based on other HAMs. 31
37
38 APPENDIX A COUNT SITE LOCATIONS Appendix A
39
40 ORMAT Base Year Model Audit Report A1 APPENDIX 1 Appendix 2 A1.1 Appendix list number Appendix A
41
42 APPENDIX B LINK FLOW CALIBRATION RESULTS (MVR TABLE 10.8) Appendix B
43
44 Base Year Model Audit Report B1 LINK FLOW CALOBRATION SUMMARY Copy of Table 10.8 of the Model Validation Report AM IP PM Screenline Direction No of Sites Within % / abs Within GEH<5 Within % / abs Within GEH<5 Within % / abs Within GEH<5 Barking E-W NB 6 50% 83% 83% 83% 67% 67% Barking E-W SB 6 100% 100% 100% 100% 50% 67% Barking N-S WB 12 75% 50% 75% 75% 67% 58% Barking N-S EB 12 92% 75% 92% 100% 75% 75% Bexley E-W NB 9 100% 89% 78% 67% 78% 78% Bexley E-W SB 10 80% 80% 60% 70% 60% 30% Bexley N-S WB 15 73% 67% 87% 73% 80% 80% Bexley N-S EB 15 73% 60% 87% 73% 60% 67% Deptford WB 5 60% 60% 100% 100% 60% 40% Deptford EB 5 60% 60% 80% 80% 20% 20% Eltham North WB 6 100% 83% 67% 67% 83% 83% Eltham North EB 6 50% 83% 100% 83% 50% 50% Eltham South WB 7 43% 57% 71% 71% 43% 43% Eltham South EB 7 57% 71% 100% 100% 43% 43% GreatEastern (east) GreatEastern (east) GreatEastern (east) except Mways GreatEastern (east) except Mways GreatEastern (west) GreatEastern (west) NB SB NB SB NB SB 25 60% 56% 76% 64% 56% 52% 25 64% 68% 80% 68% 72% 64% 24 58% 54% 75% 63% 54% 50% 24 63% 67% 79% 67% 71% 67% 14 79% 64% 93% 86% 64% 64% 15 73% 53% 87% 67% 73% 60% Hackney North WB 11 82% 55% 73% 45% 100% 82% Hackney North EB 10 90% 70% 100% 80% 70% 60% HaroldHillN-S WB 7 43% 43% 71% 71% 57% 57% HaroldHillN-S EB 7 43% 43% 71% 71% 57% 43% Homerton NB 6 67% 50% 67% 67% 50% 67% Homerton SB 6 50% 33% 50% 33% 67% 67% Inner North WB 6 83% 67% 83% 83% 67% 67% Inner North EB 6 83% 83% 83% 83% 50% 50% LewishamDartford (east) LewishamDartford (east) NB SB 14 50% 64% 93% 93% 86% 93% 14 64% 57% 79% 71% 71% 71% LewishamDartford NB 11 73% 64% 64% 91% 55% 55% Appendix B
45 ORMAT Base Year Model Audit Report (west) LewishamDartford (west) SB 11 91% 82% 73% 91% 91% 91% Ravensbourne WB 4 75% 75% 75% 75% 100% 100% Ravensbourne EB 4 100% 100% 100% 100% 100% 75% River Screenline NB 7 86% 86% 100% 100% 100% 86% River Screenline SB 7 100% 100% 100% 100% 43% 43% RiverRom WB 10 60% 60% 100% 90% 100% 90% RiverRom EB 9 67% 78% 89% 89% 89% 89% Screenline A EB 9 67% 67% 100% 100% 22% 33% Screenline A WB 9 67% 56% 56% 44% 78% 78% Screenline C NB 15 87% 73% 87% 80% 80% 60% Screenline C SB 15 87% 87% 100% 100% 60% 60% Screenline D EB 2 100% 100% 100% 100% 100% 50% Screenline D WB 2 100% 100% 100% 100% 100% 100% Screenline E NB 7 100% 57% 86% 86% 71% 71% Screenline E SB 7 86% 71% 86% 71% 71% 57% Screenline F EB 4 100% 100% 100% 100% 75% 75% Screenline F WB 4 75% 75% 100% 100% 100% 100% Screenline G NB 7 71% 57% 100% 86% 100% 86% Screenline G SB 7 100% 86% 100% 86% 100% 86% Sidcup NB 11 64% 64% 64% 73% 73% 64% Sidcup SB 11 36% 36% 45% 45% 55% 45% West of A406 WB 11 64% 64% 73% 73% 36% 45% West of A406 EB 11 55% 55% 82% 82% 45% 36% Whitechapel WB 9 78% 78% 89% 78% 78% 78% Whitechapel EB 8 100% 75% 75% 75% 63% 75% Boundary S NB 7 71% 71% 57% 57% 71% 71% Boundary Sl SB 7 86% 86% 86% 86% 57% 57% Total Screenline count sites (by direction) % 67% 82% 78% 68% 65% AM IP PM Enclosure Direction No of Sites Within % / abs Within GEH<5 Within % / abs Within GEH<5 Within % / abs Within GEH<5 Barking Barking Barkingside Barkingside Bexley In Out In Out In 28 82% 64% 89% 82% 71% 36% 29 76% 55% 83% 62% 72% 55% 27 59% 41% 81% 63% 56% 56% 27 67% 52% 89% 63% 81% 56% 11 55% 64% 82% 73% 64% 55% Appendix B
46 Base Year Model Audit Report Bexley Canary Wharf Canary Wharf Harold Hill Harold Hill Hornchurch Hornchurch Lewisham Lewisham Stepney Stepney Stratford Stratford Swanley Swanley Woolwich Woolwich Out In Out In Out In Out In Out In Out In Out In Out In Out 11 64% 55% 91% 73% 55% 55% 6 67% 50% 67% 67% 17% 33% 6 33% 33% 50% 33% 50% 33% 16 56% 50% 88% 69% 56% 38% 16 63% 56% 81% 75% 75% 69% 14 64% 64% 79% 79% 64% 64% 14 79% 71% 86% 79% 64% 64% 41 83% 59% 93% 73% 66% 56% 40 78% 68% 83% 63% 75% 58% 34 85% 62% 88% 44% 79% 44% 35 94% 60% 91% 63% 80% 54% 19 63% 53% 74% 63% 74% 53% 19 84% 68% 74% 58% 79% 63% 13 77% 62% 92% 69% 85% 54% 13 92% 69% 100% 69% 85% 69% 23 96% 74% 91% 78% 78% 61% 24 67% 50% 96% 75% 83% 75% Total Enclosure count sites (by direction) % 59% 86% 67% 72% 55% No of Sites Within % / abs AM IP PM Within GEH<5 Within % / abs Within GEH<5 Within % / abs Within GEH<5 Total Borough Counts (by direction) % 83% 88% 85% 77% 73% Appendix B
47
48 APPENDIX C VALIDATION RESULTS JOURNEY TIME SURVEYS EXISTING RIVER CROSSINGS Appendix C
49
")
50 Base Year Model Audit Report C1 JOURNEY TIME VALIDATION GRAPHS Blackwall Tunnel (northbound) Appendix C
")
51 Base Year Model Audit Report Blackwall Tunnel (southbound) Appendix C

")
52 Base Year Model Audit Report Dartford Crossing (northbound) Appendix C
")
53 Base Year Model Audit Report Dartford Crossing (southbound) Appendix C

54 CONTROL SHEET Project/Proposal Name Document Title River Crossings Modelling Review Base Year Model Audit Client Contract/Project No SDG Project/Proposal No ISSUE HISTORY Issue No. Date Details 2 20 May 2014 Final REVIEW Originator Other Contributors Review by: Steve Oliver Seyram Kumapley Steve Oliver Print Sign DISTRIBUTION Client: Transport for London Steer Davies Gleave: U:\London\Projects\226\2\10\01\Outputs\Reports\Base Year Model Audit Report4.docx Control Sheet
Why build the Silvertown Tunnel?
 Why build the Silvertown Tunnel? Over the last 30 years east London has changed with the redevelopment of former industrial areas into major commercial and residential districts. The development of Canary
Roads Task Force - Technical Note 10 What is the capacity of the road network for private motorised traffic and how has this changed over time?
 Roads Task Force - Technical Note 10 What is the capacity of the road network for private motorised traffic and how has this changed over time? Introduction This paper forms one of a series of thematic
East London River Crossings: Assessment of Need
 East London River Crossings: Assessment of Need Date: October 2012 CONTENTS 1. Strategic context... 3 2. Purpose of this report... 7 3. Background... 8 4. Statutory planning context... 12 5. Population,
Chapter 13 Route Window C11 Isle of Dogs station. Transport for London
 Chapter 13 Route Window C11 Isle of Dogs station ISLE OF DOGS STATION 13 Route Window C11 Isle of Dogs station Introduction 13.1 The Crossrail Line lies completely in tunnel through this section, just
Central London ongestion charging
 Transport for London Central London ongestion charging Impacts monitoring Fourth Annual Report, June 2006 Overview MAYOR OF LONDON Transport for London 2006 All rights reserved. Reproduction permitted
Transport for London. Travel in London, Supplementary Report: London Travel Demand Survey (LTDS)
") Transport for London Travel in London, Supplementary Report: London Travel Demand Survey (LTDS) i Transport for London 2011 All rights reserved. Reproduction permitted for research, private study and internal
Transport for London Travel in London, Supplementary Report: London Travel Demand Survey (LTDS) i Transport for London 2011 All rights reserved. Reproduction permitted for research, private study and internal
1. What are the major economic and social challenges facing London and its commuter hinterland over the next two to three decades?
 Royal Borough of Greenwich Response to the National Infrastructure Commission call for evidence 1. What are the major economic and social challenges facing London and its commuter hinterland over the next
Transport for London Policy Analysis Division. Demand Elasticities for Car Trips to Central London as revealed by the Central London Congestion Charge
 Transport for London Policy Analysis Division Demand Elasticities for Car Trips to Central London as revealed by the Central London Congestion Charge Prepared by Reg Evans for the Modelling and Evaluation
Background information for the Transport Committee s report on river services
 Background information for the Transport Committee s report on river services This document contains information received during the Transport Committee s work on river services. Contents: Page number:
Roadside Truck Survey in the National Capital Region
 1999/ 2000 Interprovincial Roadside Truck Survey in the National Capital Region Establish a comprehensive database of information Provide a basis for future studies and analysis Does not address specific
LLITM Public Transport Supply Model
 LLITM Public Transport Supply Model Paul Smith 11 th May 2011 Leicestershire County Council Public Transport in Leicestershire Sustainable transport moving from an abstract concept to necessity PT modes
Demand for Long Distance Travel
 Demand for Long Distance Travel April 2011 Demand for long distance travel 1 Structure of this paper 1.1 This paper is structured as follows: Section 2 sets out past trends in the demand for long distance
Preliminary Environmental Information Report: Appendix 16.C. Flood Warning and Evacuation Plan
 Preliminary Environmental Information Report: Appendix 16.C Flood Warning and Evacuation Plan THIS PAGE IS LEFT INTENTIONALLY BLANK Page 2 of 30 Contents SUMMARY 1. INTRODUCTION... 9 1.1 Background...
Congestion (average speed during the weekday morning peak) on Local A Roads Methodology
 on Local A Roads Methodology") Congestion (average speed during the weekday morning peak) on Local A Roads Methodology IMPORTANT NOTE This methodology document refers to the previous Congestion on local A road statistics, published
Congestion (average speed during the weekday morning peak) on Local A Roads Methodology IMPORTANT NOTE This methodology document refers to the previous Congestion on local A road statistics, published
GTA Cordon Count Program
 Transportation Trends 2001-2011 Executive Summary Project No. TR12 0722 September 2013 1.0 Introduction The Cordon Count program was established to collect traffic data as a tool for measuring travel trends
Nearly 38,000 vehicles cross the Shinnecock Canal on Sunrise Highway (NYS Route 27) daily, during peak summer months.
 daily, during peak summer months.") 2. Traffic Characteristics Traffic volumes have increased in concert with population growth in the Towns of Southampton and East Hampton. The New York State Department of Transportation (NYSDOT) maintains
2. Traffic Characteristics Traffic volumes have increased in concert with population growth in the Towns of Southampton and East Hampton. The New York State Department of Transportation (NYSDOT) maintains
ongestion charging Central London Impacts monitoring Second Annual Report
 ongestion charging Central London Impacts monitoring Second Annual Report April 2004 MAYOR OF LONDON Transport for London Contents Contents Overview The story so far 1 Congestion 2 Traffic patterns 2 Public
PERFORMANCE REPORT Quarter 2 2014/15
 PERFORMANCE REPORT Quarter 2 2014/15 CONTENTS 1. RELIABILITY... 3 2. NETWORK DISRUPTION... 9 3. TRAFFIC VOLUMES... 15 4. TRAFFIC SPEEDS... 17 5. ROAD SAFETY... 18 6. ASSET AVAILABILITY... 19 7. STATE OF
DEPARTMENT OF TRANSPORT CYCLING STRATEGY 29 February 2008
 DEPARTMENT OF TRANSPORT CYCLING STRATEGY 29 February 2008 INTRODUCTION The Department of Transport s Business Plan for the 2007/08 financial year stated the following: Government Aim: Quality Environment
Roads Task Force Technical Note 12 How many cars are there in London and who owns them?
 Roads Task Force Technical Note 12 How many cars are there in London and who owns them? Introduction ROADS TASK FORCE This paper forms one of a series of thematic analyses, produced to contribute to the
NFC in Transport for London
 NFC in Transport for London Setting a context for the role of NFC technology in TfL s ticketing strategy Brian Dobson 1 Contents Context: about Transport for London The current Oyster contactless smartcard
TDC Heavy Vehicle Forecasts - February 2010 Release 2008/09 HOUSEHOLD TRAVEL SURVEY. SUMMARY REPORT 2010 Release
 TDC Heavy Vehicle Forecasts - February 2010 Release 2008/09 HOUSEHOLD TRAVEL SURVEY SUMMARY REPORT 2010 Release 0 About the Transport Data Centre The Transport Data Centre (TDC), of Transport NSW, provides
Incorporating Peak Spreading into a WebTAG Based Demand Model
 Incorporating Peak Spreading into a WebTAG Based Demand Model Presented by: Philip Clarke Modelling Director [email protected] Contents 1. Introduction and History of the Model 2. The Full Model
Big Data for a better Customer Experience. Lauren Sager Weinstein Head of Analytics Transport for London
 Big Data for a better Customer Experience Lauren Sager Weinstein Head of Analytics Transport for London Our purpose Keep cities working and growing and make life better Plan ahead to meet the challenges
TfL s Contactless Ticketing: Oyster and Beyond Transport for London. Lauren Sager Weinstein Head of Oyster Development
 TfL s Contactless Ticketing: Oyster and Beyond Transport for London Lauren Sager Weinstein Head of Oyster Development September 2009 Contents Introduction to TfL Why a TfL Smartcard? Oyster Delivered:
Lawson Outline Plan External Traffic Analysis Working Paper
 Total Lawson Development ACTPLA 16 January 2009 Document No.: Prepared for ACTPLA Prepared by Maunsell Australia Pty Ltd Level 2, 60 Marcus Clarke Street, Canberra ACT 2600, Australia T +61 2 6201 3000
2014/15 Performance Measures and Targets
 Surface Transport Panel Date: 9 April 2014 Item 6: formance Measures and Targets This report will be considered in public 1 Summary 1.1 The purpose of this paper is to provide the Panel with an overview
Casualties in Greater London during 2013 June 2014
 Transport for London Surface Transport z Fact sheet Surface Planning Casualties in Greater London during 2013 June 2014 This fact sheet provides a summary and initial analysis of personal injury road traffic
Construction Logistics Plan Guidance
 Construction Logistics Plan Guidance For planners MAYOR OF LONDON Transport for London Section 1 Introduction Contents Section 1 Introduction 3 Section 2 Policy background 6 Section 3 Typical contents
9988 REDWOOD AVENUE PROJECT TRAFFIC IMPACT ANALYSIS. April 24, 2015
 9988 REDWOOD AVENUE PROJECT TRAFFIC IMPACT ANALYSIS April 24, 2015 Kunzman Associates, Inc. 9988 REDWOOD AVENUE PROJECT TRAFFIC IMPACT ANALYSIS April 24, 2015 Prepared by: Bryan Crawford Carl Ballard,
Fares Policy In London: Impact on Bus Patronage
 Fares Policy In London: Impact on Bus Patronage Agenda Introduction to Transport for London Overview of Bus Patronage in London Changes in Policy and patronage since 2000 Fares Strategy Ticketing Strategy
locations and outpatient centre www.lbhoutpatients.co.uk London bridge hospital 31 old broad street 120 old broad street sevenoaks
 london bridge hospital 31 old broad street London bridge hospital and outpatient centre locations www.lbhoutpatients.co.uk 120 old broad street CITY OF LONDON MEDICAL CENTRE DOCKLANDS HEALTHCARE sevenoaks
Auckland Motorways Network Performance Monitoring
 Network Performance Monitoring Anita Lin & Hanford Cheung Page 0 Auckland Motorways Network Performance Monitoring Authors Anita Lin Auckland Motorways (Presenter) Traffic Optimisation Leader BE, ME GIPENZ
Are you eligible for Congestion Charging NHS reimbursement?
 Are you eligible for Congestion Charging NHS reimbursement? Contents About the charge The central London Congestion Charging zone Reimbursements How to claim Frequently asked questions The Congestion Charging
The Mersey Gateway Project
 The Mersey Gateway Project The Mersey Gateway Project is a major scheme to build a new six-lane toll bridge over the River Mersey in the north west of England. It will link the towns of Runcorn and Widnes
Central London Congestion Charging
 Transport for London Central London Congestion Charging Impacts monitoring Sixth Annual Report, July 2008 MAYOR OF LONDON Transport for London Transport for London 2008 All rights reserved. Reproduction
DELIVERY & SERVICING PLAN. REDWOOD PARTNERSHIP Consulting Engineers Transportation Planners
 Redwood Partnership Transportation Limited Maritime House Basin Road North Portslade Brighton BN41 1WR T: 01273 414515 F: 01273 376824 E: [email protected] www.redwoodpartnership.co.uk REDWOOD
The Northumberland Estates Proposed Residential Development, Prudhoe Town Centre D/I/D/63558/603. Framework Residential Travel Plan
 The Northumberland Estates Proposed Residential Development, Prudhoe Town Centre D/I/D/63558/603 Framework Residential Travel Plan September 2013 CONTROL SHEET CLIENT: PROJECT TITLE: REPORT TITLE: THE
A SUSTAINABLE. ANNEx 9: USEr S GUIDE To TEChNICAL FoLDErS
 A SUSTAINABLE journey To work IN SoUTh yorkshire ANNEx 9: USEr S GUIDE To TEChNICAL FoLDErS CONTENTS 1. Introduction...2 1.1. The Annex Documents...2 1.2. This Document...2 2. Folder A -Walking and Cycling
Quarter 1 2014/15 (1 April 30 June 2014)
") Transport for London 2014/2015 Crime statistics bulletin Quarter 1 2014/15 (1 April 30 June 2014) Transport for London Crime and anti-social behaviour quarterly statistics bulletin Quarter 3 2012/13 (1
Transport for London 2014/2015 Crime statistics bulletin Quarter 1 2014/15 (1 April 30 June 2014) Transport for London Crime and anti-social behaviour quarterly statistics bulletin Quarter 3 2012/13 (1
Traffic Information in NYC
 Traffic Information in NYC What We Know, What We Need to Know Prepared for Transportation Alternatives January 23, 2007 Schaller Consulting 94 Windsor Place, Brooklyn, NY (718) 768-3487 [email protected]
Route Optimisation / Traffic Signals Efficiency
 Route Optimisation / Traffic Signals Efficiency Glossary Auckland Council Advanced Real-time Traffic Information System Auckland Transport Closed Circuit Television (Traffic cameras) Full Time Equivalent
Cycle Strategy 2006 2011
 Cycle Strategy 2006 2011 TABLE OF CONTENTS 1 INTRODUCTION... 1 2 POLICY BACKGROUND... 2 3 BACKGROUND... 6 4 MAIN OBJECTIVES... 8 5 TARGETS... 9 6 THE CYCLE NETWORK... 10 7 CONCLUSION... 13 Appendix A:
Construction of a pedestrian footbridge between Chiswick Business Park and Bollo Lane/Colonial Drive.
 planning report D&P/2857b/01 30 November 2015 Bollo Lane, Chiswick Business Park and Colonial Drive, Chiswick in the London Borough of Ealing planning application no. PP/2015/5442 Strategic planning application
Melbourne Airport Rail Link Study. Study overview and findings
 Melbourne Airport Rail Link Study Study overview and findings Melbourne Airport caters for 28 million air passenger trips each year and this figure is expected to double in the next 20 years. Transport
Better Bus Area Monitoring and Evaluation Framework
 Do Better Bus Area Monitoring and Evaluation Framework March 2014 The Department for Transport has actively considered the needs of blind and partially sighted people in accessing this document. The text
Transportation Management Plan Template
 DATE: TO: FROM: SUBJECT: Date Name Position Transportation Service Center Name Position Transportation Service Center Transportation Management Plan Job Number(s) Control Section(s) Route Details County
Technical note. 1. Background. 2. Document Purpose. Project: A350 Chippenham Dualling
 Project: A350 Chippenham Dualling Subject: Benefits Realisation Plan & Monitoring and Evaluation Plan Date: 14 February 2013 1. Background Restrictions to the capacity of the A350 to the north of Chippenham
London Freight Plan Data Modelling
 London Freight Plan Data Modelling Stephen Steele Friday 9 th June 2006 tfl.gov.uk/freight Contents London Freight Plan (LFP) & Proposals Vison & Aims Proposals & Critical Success Factors Freight Plan
TfL and Network Rail s consultation on Crossrail 2 Response from London First
 TfL and Network Rail s consultation on Crossrail 2 Response from London First The online consultation (including background material) can be accessed via the following link. http://www.tfl.gov.uk/corporate/projectsandschemes/27405.aspx
Transport for London. Projects and Planning Panel
 Agenda Item 5 Transport for London Projects and Planning Panel Subject: Project Monitoring Project s Date: 9 January 2014 1 Purpose 1.1 To present to the Panel the forward approval programme for projects
Pedal cyclist collisions and casualties in Greater London
 Transport for London Surface Transport Factsheet Better Routes and Places Directorate Topic Factsheet 211-1 September 211 Pedal cyclist collisions and casualties in Greater London This factsheet looks
LT McGuinness Site 10 Development, Wellington Waterfront. Construction Traffic Management Plan. 7 October 2014
 LT McGuinness Site 10 Development, Wellington Waterfront Construction Traffic Management Plan 7 October 2014 TDG Ref: 12950 141007 ltm ctmp final report.docx LT McGuinness Site 10 Development, Wellington
University of East London Tuesday 18 November 2014 10.30am Key information for graduands and guests uel.ac.uk/graduation
 University of East London School of Architecture, Computing and Engineering Tuesday 18 November 2014 10.30am Key information for graduands and guests uel.ac.uk/graduation Introduction This booklet contains
Leicestershire County Council Transport Trends in Leicestershire 2014. Transport Data and Intelligence (TDI)
") Leicestershire County Council Transport Trends in Leicestershire 2014 Transport Data and Intelligence (TDI) Table of Contents Contents List of Tables... 3 List of Figures... 3 Overview... 5 Traffic Growth...
Leicestershire County Council Transport Trends in Leicestershire 2014 Transport Data and Intelligence (TDI) Table of Contents Contents List of Tables... 3 List of Figures... 3 Overview... 5 Traffic Growth...
CAPACITY AND LEVEL-OF-SERVICE CONCEPTS
 CHAPTER 2 CAPACITY AND LEVEL-OF-SERVICE CONCEPTS CONTENTS I. INTRODUCTION...2-1 II. CAPACITY...2-2 III. DEMAND...2-2 IV. QUALITY AND LEVELS OF SERVICE...2-2 Service Flow Rates...2-3 Performance Measures...2-3
Major and Minor Schemes
 1 Major and Minor Schemes Peterborough City Council has identified a number of proposals for major transport schemes over the next five year period that will support the planned housing and employment
Transport for London. Projects and Planning Panel. The Future of London s Ticketing Technology
 Agenda Item 4 Transport for London Projects and Planning Panel Subject: The Future of London s Ticketing Technology Date: 26 February 2014 1 Purpose 1.1 The panel requested an update on the future of London's
ENGINEERING REPORT. College Street: Interstate 85 to Donahue Drive Traffic Signal System Feasibility Study Auburn, Alabama
 ENGINEERING REPORT College Street: Interstate 85 to Donahue Drive Traffic Signal System Feasibility Study Auburn, Alabama Prepared for: The City of Auburn Prepared by: 3644 Vann Road Suite 100 Birmingham,
London 2012 Travel Demand Management Chris HANLEY
 Chris HANLEY Abstract Travel Demand Management (sometimes referred to as Transport Demand Management or Transport Mobility Management) can be defined as the application of strategies to reduce demand on
Transport Construction Authority Report for Auburn Stabling Project. Traffic Impact Assessment
 Transport Construction Authority Report for Auburn Stabling Project November 2010 Contents 1. Introduction 1 2. Existing Conditions 2 2.1 Site Description 2 2.2 Existing Operations 4 2.3 Existing Road
Block C Borthwick Street, London, SE8 3JY
 AVAILABLE SPACE Block C Borthwick Street, London, SE8 3JY The property will comprise a mixed use building of steel portal frame construction arranged over eight floors with ground floor office/medical
3 Tappan Zee Bridge Rehabilitation Options
 3 Tappan Zee Bridge Rehabilitation Options 3.1 Introduction This chapter describes possible options that rehabilitate and enhance the existing Tappan Zee Bridge. Four Rehabilitation Options have been developed:
Millennium Quarter Public Realm Guidance Manual 2008
 Millennium Quarter Public Realm Guidance Manual 2008 Table of Contents Introduction Purpose of guide How to use this guide Background and Vision Studies Conservation and Heritage Biodiversity Strategic
Department of State Development, Infrastructure and Planning. State Planning Policy state interest guideline. State transport infrastructure
 Department of State Development, Infrastructure and Planning State Planning Policy state interest guideline State transport infrastructure July 2014 Great state. Great opportunity. Preface Using this state
Transport Mobility Management: Small Changes - Big Impacts
 Transport Mobility Management: Small Changes - Big Impacts Understanding TMM in the Urban Context Damian PRICE and Amy LEATHER Abstract Although Transport Mobility Management (TMM) is still considered
Effect on structures. Uniform settlement - no concerns. Angular distortion - causes damage due to tensile strain
 Effect on structures Uniform settlement - no concerns Angular distortion - causes damage due to tensile strain 1/500 - safe limit for no cracking of buildings 1/150 - potential structural damage 36 37
1 Introduction 1. 1.1 Introduction to Data Sources 1 1.2 Structure of this Unit 1. 2 Existing Data Sources 1
 Contents 1 Introduction 1 1.1 Introduction to Data Sources 1 1.2 Structure of this Unit 1 2 Existing Data Sources 1 2.1 Introduction to Existing Sources 1 2.2 Planning and Demand Data 2 2.3 Traffic Data
The Oarsome Property Challenge
 The Oarsome Property Challenge Row the River Thames from Westminster to Greenwich, raise money for a London charity Friday 19 June 2015, 7pm Oarsome Property Challenge 2015 The Oarsome Property Challenge
Review of 20 mph zones in London Boroughs. by D C Webster and R E Layfield. Published Project Report PPR243
 Review of 20 mph zones in London Boroughs by D C Webster and R E Layfield Published Project Report PPR243 Review of 20 mph zones in London Boroughs by D C Webster and R E Layfield PUBLISHED PROJECT REPORT
Chapter 3 - GPS Data Collection Description and Validation
 Chapter 3 - GPS Data Collection Description and Validation The first step toward the analysis of accuracy and reliability of AVI system was to identify a suitable benchmark for measuring AVI system performance.
RAEBURN GARAGE, 118 RAEBURN AVENUE, SURBITON
 RAEBURN GARAGE, 118 RAEBURN AVENUE, SURBITON DELIVERY AND SERVICING PLAN August 2015 Introduction This Delivery and Servicing Plan (DSP) has been prepared in relation to the proposed redevelopment of Raeburn
Ohio Standard Small/Medium MPO Travel Demand Forecasting Model. Theoretical Training May 10-11, 2006 Abridged to Freight Focus Sept 2010
 Ohio Standard Small/Medium MPO Travel Demand Forecasting Model Theoretical Training May 10-11, 2006 Abridged to Freight Focus Sept 2010 Model Overview Key Features Modeling of highway and non highway modes
48-50 Well Street Hackney London E9 7PX. Marketing History
 48-50 Well Street Hackney London E9 7PX Marketing History June 2013 Appendices 1. Instruction Letter 2. Marketing Board Instruction Letter 3. Property Details: Well Street, 48 4. Email from Landlord 14/10/2011