ENGINEERING REPORT. College Street: Interstate 85 to Donahue Drive Traffic Signal System Feasibility Study Auburn, Alabama
|
|
|
- Oswald Hodges
- 8 years ago
- Views:
Transcription
1 ENGINEERING REPORT College Street: Interstate 85 to Donahue Drive Traffic Signal System Feasibility Study Auburn, Alabama Prepared for: The City of Auburn Prepared by: 3644 Vann Road Suite 100 Birmingham, Alabama August, 2006

2 College Street: Interstate 85 to Donahue Drive AUBURN, ALABAMA TRAFFIC SIGNAL SYSTEM FEASIBILITY STUDY Prepared for: The City of Auburn 171 North Ross Street Auburn, Alabama Prepared by: Skipper Consulting, Inc Vann Road, Suite 100 Birmingham, Alabama August, 2006

3 TABLE OF CONTENTS Page Introduction...1 Background Information...4 Roadway Characteristics...4 Intersection Turning Movement Traffic Counts...4 Machine Traffic Count...7 Analysis...8 Distance Between Intersections...8 Hourly Traffic Flow Variations and Directionality...9 Historical Growth in Traffic...13 Percentage of Heavy Vehicles...15 Number of Intervening Driveways and Side Streets...15 Ratio of Through to Turning Traffic Volumes...16 Mid-Block Generated Traffic...17 Natural Cycle Compatibility...18 Intersection Delay...19 Arterial Speeds and Levels of Service...20 Prospective Green Bands and Progression Effectiveness...21 Synchro Coordinatability Factor...22 Traffic Signal Equipment Compatibility...23 Possible Future Traffic Signals...24 Future Interconnect Options...24 Recommendations...26 Appendix A Appendix B Appendix C Appendix D Appendix E APPENDICES Turning Movement Traffic Counts Machine Traffic Count Arterial Level of Service Worksheets Time-Space Diagrams Coordinatability Analysis Worksheets Skipper Consulting, Inc. Page i

4 LIST OF ILLUSTRATIONS Figure Page 1 Study Limits Existing Turning Movement Traffic Counts AM Peak Hour Existing Turning Movement Traffic Counts PM Peak Hour...6 Graph 1 Traffic Count College St. at Wal-Mart Supercenter Saturday Traffic Count College St. at Wal-Mart Supercenter Saturday Traffic Count College St. at Wal-Mart Supercenter Saturday...12 Table 1 Distances Between Intersections Historical Traffic Count Analysis Access Point Density Ratio of Through to Turning Traffic Difference Due to Mid-Block Traffic Generation Natural Cycle Lengths Intersection Delay Comparison Arterial Speeds and Levels of Service Prospective Green Bands and Progression Effectiveness Coordinatability Factors...23 Skipper Consulting, Inc. Page ii

5 INTRODUCTION This report documents a study performed to determine the feasibility of establishing a coordinated signal system on South College Street between Interstate 85 and Donahue Drive in the City of Auburn, Alabama. The study corridor is approximately 2.2 miles in length and contains six existing traffic signals. The existing signalized intersections are as follows: South College Street at Interstate 85 Northbound Ramps; South College Street at Interstate 85 Southbound Ramps; South College Street at Veteran s Boulevard; South College Street at Longleaf Drive; South College Street at East University Drive/Shug Jordan Parkway; and South College Street at Donahue Drive. The location of the study corridor and the six study intersections as related to the area roadway network is shown in Figure 1. Factors which are considered in determining the feasibility of coordination of the traffic signals on South College Street are as follows: the distance between signalized intersections; the hourly traffic flow variations and directionality; the historical growth in traffic; the percentage of heavy vehicles in the traffic stream; the number of intervening driveways and side streets between signalized intersections; the ratio of through vehicular traffic volumes to turning vehicular traffic volumes; the magnitude of mid-block generated traffic; the compatibility of the natural cycle lengths of each traffic signal; Skipper Consulting, Inc. 1

6
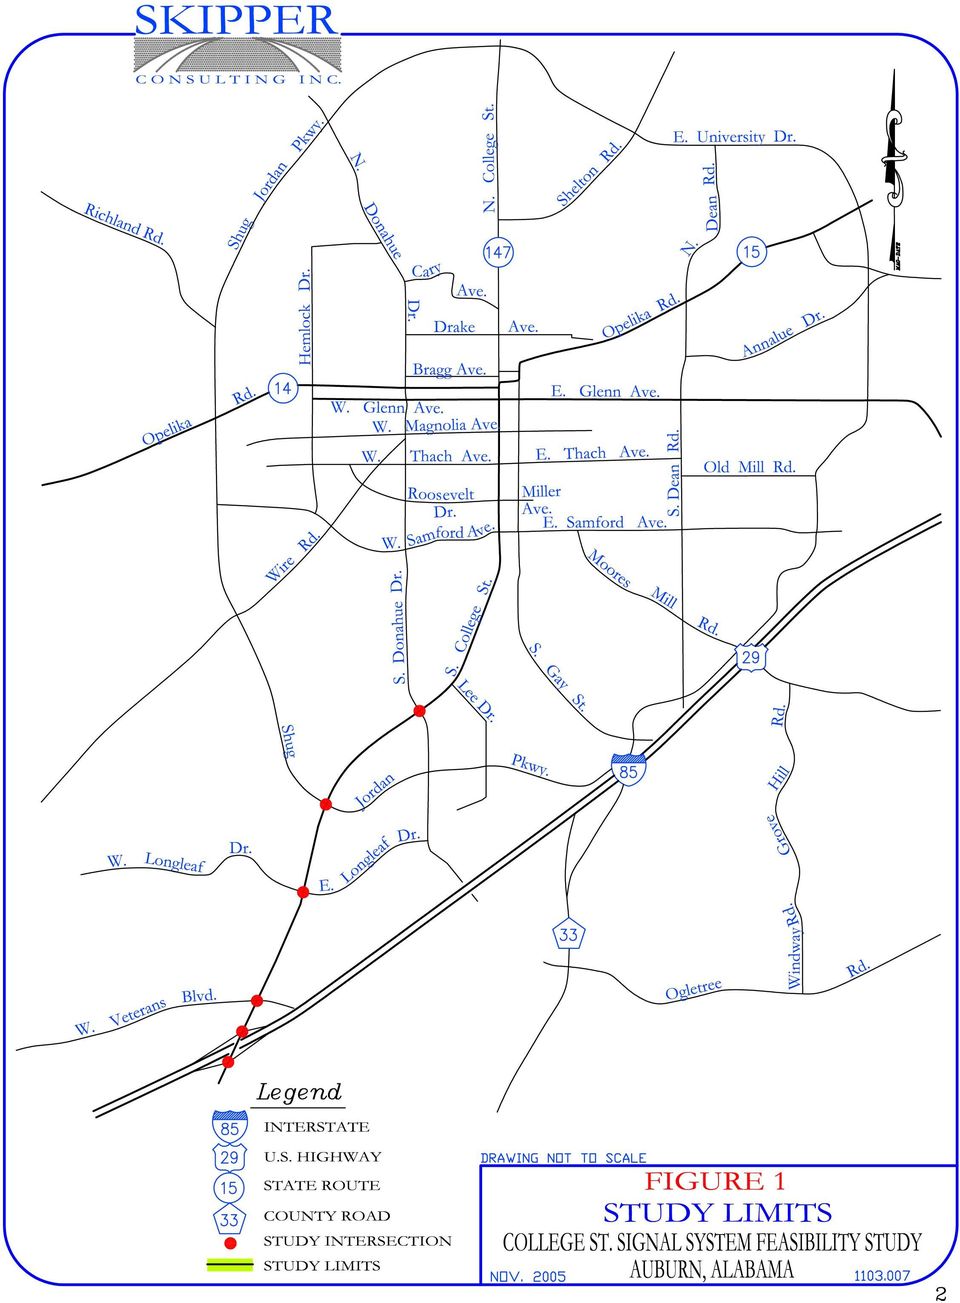
7 the change in individual intersection delays with and without traffic signal coordination; the change in arterial travel speeds and level of service with and without traffic signal coordination; the prospective green bands which could be expected if the signals were coordinated; the overall Coordinatability Factor as generated by the Synchro 6 software; the compatibility of the existing traffic signal equipment for time base and interconnected coordination; the locations of possible future traffic signals; and possible options for future traffic signal interconnection. Sources of information used in this report included the City of Auburn, the Alabama Department of Transportation, the Transportation Research Board, traffic counts conducted by Traffic Data, LLC, and office files and field reconnaissance efforts of Skipper Consulting, Inc. Skipper Consulting, Inc. 3

8 BACKGROUND INFORMATION Roadway Characteristics Within the boundary of the study area, South College Street is generally a five lane urban cross-section roadway. The posted speed limit on South College Street is 55 miles per hour from south of Interstate 85 to north of Longleaf Drive. The speed limit decreases to 50 miles per hour from north of Longleaf Drive to north of East University Drive. The speed limit further decreases to 45 miles per hour from south of Donahue Drive to south of Samford Avenue. For the purposes of this study, South College Street is considered a north-south roadway regardless of actual compass orientation. Intersection Turning Movement Traffic Counts Intersection turning movement traffic counts were performed at the six study intersections by Traffic Data, LLC on behalf of Skipper Consulting, Inc. The counts were conducted on Wednesday, August 24, 2005, Tuesday, September 6, 2005, and Tuesday, September 13, The counts were performed in fifteen (15) minute intervals during the periods of 7:00 to 9:00 a.m. and 4:00 to 6:00 p.m. The traffic count data is included in Appendix A. The a.m. and p.m. peak hour intersection turning movement traffic counts are depicted in Figures 2 and 3, respectively. All traffic counts were conducted such that Auburn University was in session but not during the week with a home football game. Skipper Consulting, Inc. 4

9
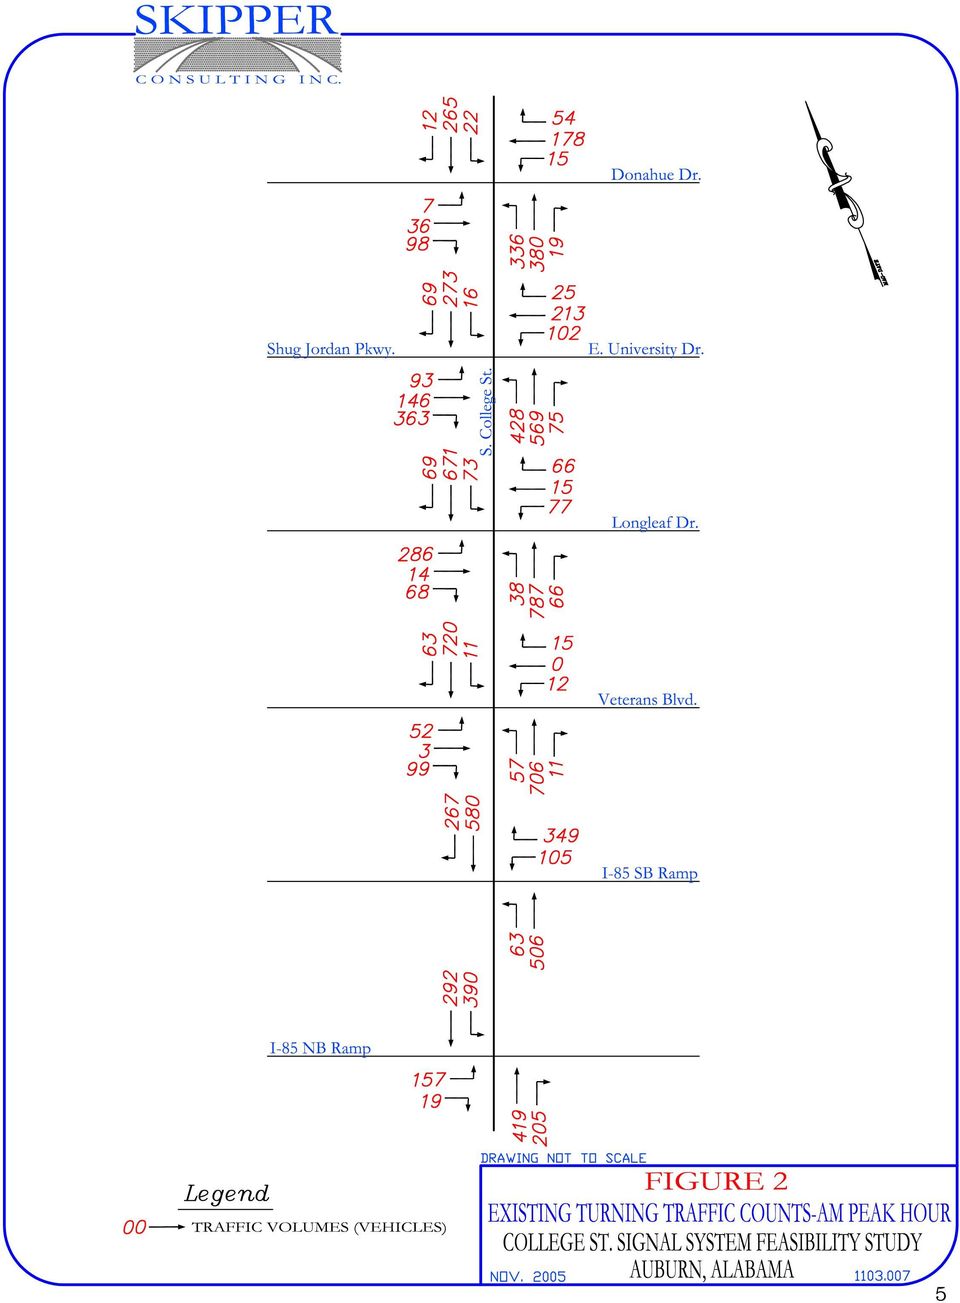
10

11 Machine Traffic Count A machine traffic count was conducted on College Street in the vicinity of the unsignalized driveway for the Wal-Mart Supercenter. The count was conducted in fifteen minute increments for 72 continuous hours on Saturday-Monday, August 20-22, The data from this traffic count is included in Appendix B. All traffic counts were conducted such that Auburn University was in session but not during the week with a home football game. Skipper Consulting, Inc. 7

12 ANALYSIS Distance Between Intersections The distance between signalized intersections is a major factor to consider in the feasibility of coordination of traffic signals. In general, the following rules-of-thumb apply: traffic signals spaced farther apart than one-half mile (2,640 feet) should rarely be coordinated; traffic signals spaced closer than one-quarter mile (1,320 feet) should generally be coordinated; and traffic signals spaced closer than 600 feet are discouraged and generally must be coordinated. Table 1 shows the distance between each study intersection from centerline of the intersections. The distances were recorded by Skipper Consulting, Inc. using a calibrated vehicle-mounted Distance Measuring Instrument (DMI). Based on the distance between signalized intersections, it appears that coordination of signals on South College Street would be feasible in the following two locations: between the Interstate 85 Northbound Ramps and Veteran s Boulevard; and between Longleaf Drive and East University Drive. Skipper Consulting, Inc. 8

13 Table 1 Distances between Intersections Intersection Interstate 85 Northbound Ramps Interstate 85 Southbound Ramps Veteran s Boulevard Longleaf Drive East University Drive Donahue Drive Cumulative Distance 0 feet 995 feet 2,041 feet 6,016 feet 7,801 feet 11,609 feet Distance Between Intersections 995 feet 1,046 feet 3,975 feet 1,785 feet 3,808 feet Hourly Traffic Flow Variations and Directionality The machine traffic count data included in Appendix B was graphed to determine the variation in hourly traffic flow and the directionality of the traffic flow by hour. The graphs are presented as Graphs 1, 2, and 3, which depict hourly traffic volumes by direction for Saturday, August 20, 2005, Sunday, August 21, 2005, and Monday, August 22, All traffic counts were conducted such that Auburn University was in session but not during the week with a home football game. While there are no general guidelines as related to hourly flow variation and directionality of traffic flow characteristics as related to the feasibility of providing coordination, there are general factors which can be examined to determine the nature of coordination should it be implemented. The following items summarize conclusions which can be drawn from the information shown in Graphs 1-3. Skipper Consulting, Inc. 9

14 Graph 1 College St. at Wal-Mart Supercenter Saturday August 20, Vehicles NB SB Total AM AM PM PM PM 10 Time

15 Graph 2 College St. at Wal-Mart Supercenter Sunday, August 21, Vehicles NB SB Total AM AM PM PM PM 11 Time

16 Graph 3 College St. at Wal-Mart Supercenter Monday, August 22, Vehicles NB SB Total AM AM PM PM PM 12 Time

17 Saturday. Traffic rises steadily on Saturday beginning at 6:00 a.m. and peaks from 12:00 noon to 3:00 p.m. Traffic then decreases slowly until 6:00 p.m., and then decreases more rapidly until 4:00 a.m. There is only a very short time, perhaps from 3:00 a.m. to 6:00 a.m., where traffic flow is low enough to indicate free operation of traffic signals which would otherwise be coordinated. There is no significant directionality in traffic flow on Saturday. Sunday. The shape of the traffic curve for Sunday is similar to that for Saturday. Sunday exhibits a sharp rise in traffic at 12:00 noon, and a more pronounced rate of decrease in traffic from 6:00 p.m. until 4:00 a.m. Monday. Traffic rises sharply on Monday (and by inference, on all weekdays), beginning at 5:00 a.m., with a sharp spike in traffic at 7:00 a.m. Directionality northbound is approximately 10% higher than southbound during the a.m. peak period. There is a lull in traffic around 8:00 to 9:00 a.m., and then traffic rises steadily, peaking from 12:00 noon to 5:00 p.m. There is a favored southbound directionality of approximately 10% during the p.m. peak period Traffic then decreases steadily from 6:00 p.m. to 2:00 a.m. There is a period of time, perhaps from midnight to 5:00 a.m., where traffic flow is low enough to indicate free operation of traffic signals which would otherwise be coordinated. Historical Growth in Traffic Historical traffic counts as available from the Alabama Department of Transportation for South College Street in the study area were collected and analyzed for the years 1994 to Three count stations are included in the study area: South College Street south of Donahue Drive; South College Street south of East University Drive; and South College Street north of Interstate 85. Skipper Consulting, Inc. 13

18 The data from these three count stations was analyzed to determine the historical rate of growth of traffic on South College Street. This information is included in Table 2. As shown in Table 2, South College Street has experienced a significant increase in traffic at all three count stations during the period 1994 to The historical growth rate in traffic has been between 8 and 13 percent per year. Traffic growth on an average highway in an urbanized area in the State of Alabama is generally 2 to 4 percent. While there are no general rules about the rate of traffic growth as related to the feasibility of establishing a coordinated signal system, this analysis indicates that traffic can be expected to grow on South College Street at an accelerated rate if the trends continue. And the greater the traffic volumes, the greater will be the need for coordination of traffic signals. Table 2 Historical Traffic Count Analysis Year Average Annual Daily Traffic Volumes - South College Street south of Donahue Dr. south of E. Univ. Dr. north of I , , , , % 15, % 14, % , % 17, % 15, % , % 18, % 16, % , % 18, % 16, % , % 20, % 18, % , % 21, % 18, % , % 20, % 18, % , % 23, % 20, % , % 24, % 21, % , % 32, % 22, % Overall Growth +8.0% +13.1% +8.4% Skipper Consulting, Inc. 14

19 Percentage of Heavy Vehicles The historical traffic count data collected from the Alabama Department of Transportation also included information on the percentage of heavy vehicles on South College Street in the study area. The three count stations had identical data. The truck percentage on a daily basis is 3 percent, and the truck percentage on a design hour basis is 2 percent. 50 percent of the trucks are classified as Heavy. Therefore, during the peak hour, it can be anticipated that approximately 20 trucks will use South College Street. It should be noted that a truck percentage of 2 percent during the design hour is low when compared to typical State highways in urbanized areas, which may have 4 to 5 percent trucks. Again, there are no general rules which relate the percentage of heavy vehicles to the feasibility of coordination of traffic signals. However, the more trucks on the roadway, the more difficult it is to coordinate traffic signals because of the difference in acceleration characteristics between passenger vehicles and trucks. Given that the heavy vehicle percentage is low on South College Street makes it a better candidate for implementation of a coordinated traffic signal system. Number of Intervening Driveways and Side Streets The 2000 Highway Capacity Manual, as published by the Transportation Research Board, shows that the ability to maintain travel speed on multi-lane highways is affected by access point density (see page 21-7). It is also true that as the number of access points increases between traffic signals, the less effective traffic signal coordination will be. There are five ranges established in the 2000 Highway Capacity Manual, for the density of access points per mile: 0, 10, 20, 30, and >40. The number of driveways and side streets intersecting South College Street between the Interstate 85 Northbound Ramps and Donahue Drive were counted and then the access density per mile was determined. The results are summarized in Table 3. Skipper Consulting, Inc. 15

20 As shown in Table 3, the access point densities for each segment/direction of travel on South College Street in the study area all fall within the lowest two categories, except for the segment of South College Street from Longleaf Drive to Veteran s Boulevard, which falls in the third category. Therefore, the density of access points could be considered relatively low, thus making South College Street a better candidate for traffic signal coordination. Table 3 Access Point Density Direction of Number of Segment Length Access Density Traffic Flow Accesses I-85 NB Ramps to Northbound 0 0 per mile.19 miles I-85 SB Ramps Southbound 0 0 per mile I-85 SB Ramps to Northbound 3 14 per mile.21 miles Veterans Blvd. Southbound 2 10 per mile Veterans Blvd. to Northbound 9 12 per mile.75 miles Longleaf Dr. Southbound per mile Longleaf Dr. to Northbound 5 15 per mile.34 miles East University Dr. Southbound 4 12 per mile East University Dr. Northbound 8 11 per mile.72 miles to Donahue Dr. Southbound 3 4 per mile Ratio of Through to Turning Traffic Volumes The quality of progression on a roadway is impacted by the number of vehicles which make left and right turns at the traffic signals as opposed to continuing on straight through the intersection. This is true because coordinated signal systems are generally set up to optimize the green band for main street through vehicles and ignore progression for turning traffic. Table 4 presents an analysis which shows the ratio of turning traffic (left and right turns) to the through traffic at each intersection for the a.m. and p.m. peak hours of traffic flow. As shown in Table 4, there are several intersections where the ratio of turning vehicles to through vehicles is significant (as highlighted in yellow), including: Skipper Consulting, Inc. 16

21 South College Street at Interstate 85 Northbound Ramps (a.m. and p.m. peak hours); South College Street at Longleaf Drive (p.m. peak hour); South College Street at East University Drive (a.m. and p.m. peak hours); and South College Street at Donahue Drive (a.m. and p.m. peak hours). This indicates that providing good coordination through these signals at these times of the day may be problematic. Table 4 Ratio of Through to Turning Traffic Intersection Direction of AM Peak Hour PM Peak Hour Traffic Flow Through % Turning % Through % Turning % I-85 NB Northbound 68% 32% 66% 34% Ramps Southbound 43% 57% 49% 51% I-85 SB Ramps Northbound 89% 11% 97% 3% Southbound 68% 32% 78% 22% Veteran s Northbound 92% 8% 92% 8% Blvd. Southbound 91% 9% 87% 13% Longleaf Dr. Northbound 89% 11% 84% 16% Southbound 83% 17% 58% 42% East University Northbound 53% 47% 58% 42% Dr. Southbound 77% 23% 76% 24% Donahue Dr. Northbound 51% 49% 59% 41% Southbound 89% 11% 87% 13% Mid-Block Generated Traffic Similar to the impact of turning traffic at the signalized intersections, traffic which is generated by the side streets and driveways on South College Street will also have a negative impact on the ability to coordinate traffic flow. While it was not possible to perform traffic counts at all side streets and driveways in the corridor limits within the confines of this study effort, an assessment of the order of magnitude of mid-block generated traffic can be determined by the difference in traffic volumes (frequently Skipper Consulting, Inc. 17
22 known as the delta ) between the signalized intersections. Table 5 shows the difference in traffic volumes between each study intersection for each direction of traffic flow for the a.m. and p.m. peak periods. Links where the difference indicated significant midblock activity are highlighted in yellow. As shown in Table 5, the only link where there is not a significant contribution of mid-block generated traffic is between the two Interstate 85 ramps. Table 5 Difference Due to Mid-Block Traffic Generation Northbound Southbound Link AM PM Link AM PM I-85 NB Ramps to Donahue Dr. to -7-2 I-85 SB Ramps East University Dr I-85 SB Ramps to East University Dr Veteran s Blvd. to Longleaf Dr Veteran s Blvd. to Longleaf Dr. to Longleaf Dr. Veteran s Blvd Longleaf Dr. to Veteran s Blvd. to East University Dr. I-85 SB Ramps East University Dr. I-85 SB Ramps to to Donahue Drive I-85 NB Ramps -3-3 Natural Cycle Compatibility When traffic signals run in an uncoordinated, or free, mode, the cycle length varies from phase to phase. However, over the course of a given period of time, typically one hour, the lengths of each cycle can be averaged. This is known as the natural cycle. If traffic signals are coordinated, and the cycle length is not close to the natural cycle length, then one of two things occurs: if the coordinated cycle length is significantly greater than the natural cycle, then the side street and left turn movements experience increased delay; or Skipper Consulting, Inc. 18
23 if the coordinated cycle length is significantly less than the natural cycle, then queue failures will occur. Table 6 shows the natural cycles for each study intersection for the a.m. and p.m. peak hours of traffic flow as calculated using the Synchro 6 software models prepared for this study. As shown in Table 6, during the a.m. peak period, the majority of the traffic signals operate at natural cycles in the 60 to 75 second range, except for the intersection of South College Street at the Interstate 85 northbound ramps, which operates at a natural cycle of 110 seconds. During the p.m. peak hour, there is wide variety and range of natural cycle lengths, from 60 seconds to 140 seconds. Table 6 Natural Cycle Lengths Intersection Natural Cycle Length AM Peak PM Peak I-85 NB Ramps 110 secs. 110 secs. I-85 SB Ramps 75 secs. 75 secs. Veteran s Blvd. 60 secs. 60 secs. Longleaf Dr. 75 secs. 90 secs. East University Dr. 75 secs. 140 secs. Donahue Dr. 65 secs. 65 secs. Intersection Delay The Synchro 6 model runs were used to determine the average delay in seconds per entering vehicle that is experienced in the a.m. and p.m. peak periods without coordination and subsequently if coordination is implemented. The delays with coordination assume a cycle length of 110 seconds during the a.m. and p.m. peak periods It should be noted that the results of coordination timings are preliminary and do not necessarily represent what would be implemented in the field. Table 7 presents the results of the delay calculations. Skipper Consulting, Inc. 19
24 Table 7 Intersection Delay Comparison Intersection I-85 NB Ramps I-85 SB Ramps Veteran s Boulevard Longleaf Drive E. University Drive Donahue Drive AM Peak Hour PM Peak Hour Uncoordinated Coordinated Difference Uncoordinated Coordinated Difference 16.4 secs secs secs secs secs secs. 9.3 secs. 8.7 secs secs. 8.3 secs. 9.2 secs secs. 7.5 secs. 4.4 secs secs. 8.6 secs. 7.1 secs secs secs secs secs secs secs secs secs secs secs secs secs secs secs secs secs secs secs secs As shown in Table 7, no intersections experience undue delay during the a.m. peak period, and coordination would provide no significant benefit or detriment to intersection delay. However, during the p.m. peak hour, two intersections experience significant delay (Longleaf Drive and East University Drive), and coordination would provide no significant benefit or detriment to intersection delay. Arterial Speeds and Levels of Service The Synchro 6 model was used to analyze the impact to travel speeds and arterial levels of service on South College Street with the implementation of a coordinated traffic signal system. The results of the analyses are included in Appendix C and are summarized in Table 8. As shown in Table 8, coordination of the traffic signals would provide a small benefit to travel speeds and levels of service on South College Street during the a.m. and p.m. peak periods of traffic flow. Skipper Consulting, Inc. 20
25 Table 8 Arterial Speeds and Levels of Service Time Period Operation Direction of Travel Average Level of Speed Service AM Peak Hour Uncoordinated Northbound 33.6 mph C Southbound 32.0 mph C Coordinated Northbound 34.1 mph B Southbound 34.8 mph B PM Peak Hour Uncoordinated Northbound 29.4 mph C Southbound 25.6 mph D Coordinated Northbound 30.1 mph C Southbound 27.7 mph C Prospective Green Bands and Progression Effectiveness A preliminary analysis was performed to estimate the potential green bands which could be experienced on South College Street with the implementation of a coordinated traffic signal system. The analyses were performed assuming 110 second cycle lengths for the a.m. and p.m. peak hours of traffic flow. The Synchro 6 software package was used to perform the analysis. Graphical depictions of the green bands are included in Appendix D. Effectiveness analysis of the possible green bands was also performed. In general, the following formula and criteria are used to evaluate the effectiveness of coordination: Efficiency = ((band A + band B) / 2) / cycle poor progression fair progression good progression great progression Table 9 displays the possible green bands during the a.m. and p.m. peak hours of traffic flow and calculations of the efficiency of progression. Skipper Consulting, Inc. 21
26 Table 9 Prospective Green Bands and Progression Effectiveness AM Peak Hour Northbound Southbound Cycle Band Band Length 12 secs. 12 secs. 110 secs. PM Peak Hour Northbound Southbound Cycle Efficiency Band Band Length % 17 secs. 17 secs. secs. Efficiency 15% As shown in Table 9, only poor progression can be anticipated during the a.m. and p.m. peak periods with the implementation of a traffic signal system the entire length of South College Street through the study area. However, it should be noted that efficiencies could be anticipated to be much higher if signal systems were implemented through only a portion of the traffic signals. Synchro Coordinatability Factor The Synchro 6 software has a feature called Coordinatability Analysis which is an empirical calculation to determine the measure of desirability for implementing traffic signal coordination. This measure combines many of the aspects already addressed in this study as scores, which when added, provide a number out of 100 which expresses the desirability for coordination. The analysis is performed on a link-by-link basis. The factors which are included in the coordinatability analysis include: the travel time between intersections; the amount of queue storage space between intersections as related to the anticipated queue; the proportion of traffic which occurs in a platoon; the main street traffic volume; comparison of the natural cycle length of the signal with the natural cycle lengths of the signals on either side. All these factors are summed together to derive the coordinatability factor. Skipper Consulting, Inc. 22
27 The results of the coordinatability analyses are included in Appendix E and are summarized in Table 10. Table 10 Coordinatability Factors Segment Coordinatability Factor Coordination AM Peak PM Peak Recommendation I-85 NB to I-85 SB Definitely Recommended I-85 SB to Veteran s Blvd Definitely Recommended Veteran s Blvd. to Longleaf Dr Probably Not Recommended Longleaf Dr. to E University Dr Definitely Recommended E University Dr. to Donahue Dr Probably Not Recommended Traffic Signal Equipment Compatibility An inventory of existing traffic signal equipment was performed by the Consultant for all traffic signals in the study area. Of the six traffic signals, five are controlled by Eagle EPAC 300 controllers. One traffic signal (at Longleaf Drive) is controlled by a Naztec 900 controller. All six controllers are capable of time base coordination, and the Eagle controllers are capable of time base coordination that is compatible with the Naztec controller. However, the Eagle controllers are not capable of communication with the Naztec controller in a master controller situation. However, if a time base signal system is implemented and includes the intersection of Longleaf Drive, it is recommended that the Naztec controller be replaced with an Eagle EPAC 300 controller so that only one software package is needed for upload/download data to all the controllers in this system. If a master controller based signal system is implemented, all controllers will have to be the same manufacture/model. It should be noted that the signal system on College Street from Mitcham Avenue to Samford Avenue is composed of Eagle EPAC 300 controllers as well. Skipper Consulting, Inc. 23
28 Possible Future Traffic Signals Currently, the only intersection proposed for signalization in the study limits know to the Consultant is the Wal-Mart driveway adjacent to Murphy Oil. This intersection is located 553 feet south of the Longleaf Drive intersection, and 3,422 feet north of the Veteran s Boulevard intersection. Based on this information and the other findings of this report, the following observations and recommendations can be made: installation of a new signal for the Wal-Mart driveway should be strongly discouraged due to proximity of the intersection to the existing traffic signal at Longleaf Drive; if a new traffic signal is installed for the Wal-Mart driveway, it should definitely be coordinated with the existing traffic signal at Longleaf Drive; and the presence of a new traffic signal at the Wal-Mart driveway would not affect any recommendations made regarding coordinating the signals at Longleaf Drive and Veteran s Boulevard due to the significant distance between the Wal-Mart driveway and the Veteran s Boulevard intersection. Future Interconnect Options In their current configuration, the six intersections in the study area cannot be interconnected. If the existing Naztec 900 controller at Longleaf Drive were changed out for an Eagle EPAC 300 controller, then the six signals would be compatible for interconnection. The methods of interconnect commonly available and available at a reasonable price for this situation include the following options. These options are listed generally in order of ascending cost. Also, it should be noted that upon interconnection, a decision would also be required regarding the use of an on-street master controller or a more advanced centrally-controlled computer system. Skipper Consulting, Inc. 24
29 Option 1 Spread Spectrum Radio. Each cabinet could be equipped with a spread spectrum radio and an antenna placed on an adjacent traffic signal pole. It is possible that these six signals could communicate with the existing on-street master located at the Auburn municipal water tank, but a path profile analysis would be needed to make sure. The traffic signal controllers would need to be upgraded with an RS-232 port 3 card. Option 2 Hardwire Interconnect. A copper twisted-pair shielded interconnect cable could be run to each traffic signal, either aerially or underground. The traffic signal controllers would need to be upgraded with an FSK modem card. Option 3 Fiber Optic Interconnect. A single or multi-mode fiber optic interconnect line could be run to each traffic signal, either aerially or underground. The traffic signal controllers would need to be upgraded with fiber optic modems. This option has significant flexibility because the number of fibers to be installed could include future uses such as cameras, dynamic signs, or municipal functions. Option 4 IEEE g. This is emerging technology with limited traffic signal applications in the region. It is a line-of-sight radio system. The City of Montgomery has experimented with camera control using g technology, and the Alabama Department of Transportation has also experimented with g technology for portable cameras for hurricane evacuation. The scheme the City of Montgomery is currently designing involves placing g repeaters on fire station radio towers. There are other available interconnect options, including Ethernet, microwave, dial-up, andtcp/ip which would have similarities to the four primary options discussed above. Skipper Consulting, Inc. 25
30 RECOMMENDATIONS Based on the information presented in this report, the following recommendations concerning traffic signal coordination on South College Street from the Interstate 85 Northbound Ramps to Donahue Drive are offered for consideration to the City of Auburn: 1. Replace the existing Naztec 900 controller at the intersection of South College Street at Longleaf Drive with a new Eagle EPAC 300 controller with a port 3 suitable for a spread spectrum radio. 2. Implement a time base coordination traffic signal system on South College Street between Longleaf Drive and East University Drive. 3. Implement a time base coordination traffic signal system on South College Street between the Interstate 85 Northbound Ramps and Veteran s Boulevard. 4. Perform a path profile analysis for the spread spectrum radio mounted on the Auburn municipal water tank to the six traffic signal locations included in this study. 5. Upgrade the cabinets at the six intersections and the Eagle EPAC 300 controllers to allow for spread spectrum communication. Set up the existing MARC 360 onstreet master at the water tank for these signals if the path profile analysis is favorable. Otherwise, perform additional path profile analyses to determine the appropriate location for a new MARC 360 on-street master. 6. Be ready to implement traffic signal coordination timing on South College Street from the Interstate 85 Northbound Ramps to Donahue Drive within the next five years. Skipper Consulting, Inc. 26
31 7. Do not install a traffic signal at the existing unsignalized intersection accessing the Wal-Mart adjacent to the Murphy Oil. 8. Evaluate future traffic signal requests in the study area in the light of the impact that they will have on traffic signal progression. Skipper Consulting, Inc. 27
9988 REDWOOD AVENUE PROJECT TRAFFIC IMPACT ANALYSIS. April 24, 2015
 9988 REDWOOD AVENUE PROJECT TRAFFIC IMPACT ANALYSIS April 24, 2015 Kunzman Associates, Inc. 9988 REDWOOD AVENUE PROJECT TRAFFIC IMPACT ANALYSIS April 24, 2015 Prepared by: Bryan Crawford Carl Ballard,
14-97. 14-97.002 Definitions. For the purposes of this rule chapter the following definitions shall apply unless the context clearly shows otherwise:
 14-97 14-97.001 Purpose. This rule chapter sets forth an access control classification system and access management standards to implement the State Highway System Access Management Act of 1988. The implementation
CAPACITY AND LEVEL-OF-SERVICE CONCEPTS
 CHAPTER 2 CAPACITY AND LEVEL-OF-SERVICE CONCEPTS CONTENTS I. INTRODUCTION...2-1 II. CAPACITY...2-2 III. DEMAND...2-2 IV. QUALITY AND LEVELS OF SERVICE...2-2 Service Flow Rates...2-3 Performance Measures...2-3
PROGRAM FOR ARTERIAL SYSTEM SYNCHRONIZATION (PASS) STANDARD SCOPE OF WORK, SCHEDULE AND BUDGET
 STANDARD SCOPE OF WORK, SCHEDULE AND BUDGET") PROGRAM FOR ARTERIAL SYSTEM SYNCHRONIZATION (PASS) STANDARD SCOPE OF WORK, SCHEDULE AND BUDGET The purpose of the Program for Arterial System Synchronization (PASS) is to provide technical and financial
PROGRAM FOR ARTERIAL SYSTEM SYNCHRONIZATION (PASS) STANDARD SCOPE OF WORK, SCHEDULE AND BUDGET The purpose of the Program for Arterial System Synchronization (PASS) is to provide technical and financial
TERMINAL 91 TRAFFIC MONITORING STUDY
 REVISED DRAFT TERMINAL 9 TRAFFIC MONITORING STUDY Prepared for: Port of Seattle Prepared by: 6544 NE 6st Street, Seattle, WA 985 ph: (26) 523-3939 fx: (26) 523-4949 NOVEMBER 22, 2 TABLE OF CONTENTS. INTRODUCTION...
TH 23 Access Management Study Richmond to Paynesville
 TH 23 Access Management Study Richmond to Paynesville Prepared For: Minnesota Department of Transportation District 8 Prepared By: Short Elliott Hendrickson Inc. July 2015 Table of Contents I. Introduction...
Section 6 Traffic Analysis
 Section 6 Traffic Analysis Traffic Operations of the Preferred Network Alternative After the Preferred Network was identified and confirmed by local policy makers and area residents, detailed traffic analysis
Accident Analysis of Sheridan Road between Isabella Street and South Boulevard
 Accident Analysis of Sheridan Road between Isabella Street and South Boulevard Prepared for TranSystems Corporation for the City of Evanston Submitted by Regina Webster & Associates, Inc. Date: 08/15/2008
3. EXISTING CONDITIONS
 3. EXISTING CONDITIONS Project alternatives were analyzed through the application of the North Jersey Regional Transportation Model - Enhanced (NJRTM-E), which projects traffic volumes and flows into the
TRAFFIC IMPACT ANALYSIS (TIA)
") GUIDELINES FOR TRAFFIC IMPACT ANALYSIS (TIA) FOR REZONING APPLICATIONS AND OTHER DEVELOPMENT APPROVALS REQUIRING TRANSPORTATION IMPACT ANALYSIS IN SUMTER COUNTY, FLORIDA July 17, 2007 PURPOSE AND APPLICABILITY
GUIDELINES FOR TRAFFIC IMPACT ANALYSIS (TIA) FOR REZONING APPLICATIONS AND OTHER DEVELOPMENT APPROVALS REQUIRING TRANSPORTATION IMPACT ANALYSIS IN SUMTER COUNTY, FLORIDA July 17, 2007 PURPOSE AND APPLICABILITY
Traffic Volume Counts
 Traffic Volume Counts Prepare 1. Communicate with other staff/departments 2. Review historical data trends 3. Review citizen input 4. Request traffic control Select Location 1. Select the proper location
FHWA Colorado Division Control of Access to the Interstate and its Right-of-Way February 2005
 FHWA Colorado Division Control of Access to the Interstate and its Right-of-Way February 2005 Background: It is in the national interest to maintain the Interstate System to provide the highest level of
CELL PHONE TRACKING. Index. Purpose. Description. Relevance for Large Scale Events. Options. Technologies. Impacts. Integration potential
 CELL PHONE TRACKING Index Purpose Description Relevance for Large Scale Events Options Technologies Impacts Integration potential Implementation Best Cases and Examples 1 of 10 Purpose Cell phone tracking
BENNINGTON LOCAL ROADWAY NETWORK TRAFFIC ANALYSIS
 Documentation for: BENNINGTON LOCAL ROADWAY NETWORK TRAFFIC ANALYSIS Bennington, VT Prepared for: Bennington County Regional Commission & Town of Bennington August 2003 TABLE OF CONTENTS 1.0 INTRODUCTION...1
Transportation Management Plan Template
 DATE: TO: FROM: SUBJECT: Date Name Position Transportation Service Center Name Position Transportation Service Center Transportation Management Plan Job Number(s) Control Section(s) Route Details County
Appendix E Traffic Impact Analysis
 Appendix E Traffic Impact Analysis 2010 Facility Master Plan Factoria Recycling and Transfer Station November 2010 2010 Facility Master Plan Factoria Recycling and Transfer Station November 2010 Department
MEMORANDUM. Robert Nichols, Acting Corridor Design Manager Northgate Link Extension
 MEMORANDUM DATE: September 23, 2014 TO: Robert Nichols, Acting Corridor Design Manager Northgate Link Extension FROM: SUBJECT: COPIES: Katherine Casseday, PE, PTOE, Casseday Consulting Tony Lo, PE, Parsons
CHALLENGES TO EFFECTIVE ARTERIAL TRAFFIC MONITORING: LESSONS FROM THE I-95 CORRIDOR COALITION S VEHICLE PROBE PROJECT ABSTRACT
 CHALLENGES TO EFFECTIVE ARTERIAL TRAFFIC MONITORING: LESSONS FROM THE I-95 CORRIDOR COALITION S VEHICLE PROBE PROJECT Stanley E. Young. P.E., Ph.D. Research Engineer, University of Maryland 2200 Technology
Downtown Louisville Two-Way Street Study
 Final Draft Report Downtown Louisville Two-Way Street Study Submitted to Downtown Development Corporation Submitted by ENTRAN, PLC Submitted October 2009 Table of Contents Introduction Study Purpose...1
SECTION 16 TRAFFIC/SAFETY SECTIONS 16.1, 16.2 AND 16.3 ARE UNDER DEVELOPMENT
 SECTION 16 TRAFFIC/SAFETY SECTIONS 16.1, 16.2 AND 16.3 ARE UNDER DEVELOPMENT 16.1-1 16.4 Intelligent Transportation Systems Introduction The ITS Engineering Unit is responsible for the design of all ITS
GUIDELINES FOR MOVEMENT OVER SOUTH CAROLINA HIGHWAYS OF OVERSIZE AND OVERWEIGHT VEHICLES AND LOADS
 GUIDELINES FOR MOVEMENT OVER SOUTH CAROLINA HIGHWAYS OF OVERSIZE AND OVERWEIGHT VEHICLES AND LOADS Statutory Authority: Section 56-5-4010 through 56-5-4230 and 57-3-130 through 57-3-160 A. Implements of
Web-Based Work Zone Traffic Analysis Tool Users Guide
 Oregon Department of Transportation TECHNICAL SERVICES TRAFFIC - ROADWAY SECTION TRAFFIC CONTROL PLANS UNIT Web-Based Work Zone Traffic Analysis Tool Users Guide Fall 2010 DATE: April 2010 TO: FROM: Work
Median Bus Lane Design in Vancouver, BC: The #98 B-Line
 Li 1 Median Bus Lane Design in Vancouver, BC: The #98 B-Line Simon Li, P.Eng. PTOE Acting Program Manager, Road and Bridge Projects TransLink (Greater Vancouver Transportation Authority) 1600 4720 Kingsway
Disputed Red Light Accidents: A Primer on Signal Control. Jon B. Landerville, MSME, PE Edward C. Fatzinger, MSME, PE Philip S.
 Disputed Red Light Accidents: A Primer on Signal Control Jon B. Landerville, MSME, PE Edward C. Fatzinger, MSME, PE Philip S. Wang, MSME Intersection Accident Statistics Intersection accidents occur on
MEMORANDUM. Stanley E. Young University of Maryland, Center for Advanced Transportation Technology seyoung@umd.edu 301-792-8180
 MEMORANDUM To: From: Vehicle Probe Project Arterial Data Quality Committee Stanley E. Young University of Maryland, Center for Advanced Transportation Technology seyoung@umd.edu 301-792-8180 Date: Subject:
Maricopa County Regional Wireless Systems An AZTech White Paper on Wireless Systems Being Used in ITS
 Prepared by Jordan Lamoreaux Maricopa County Department of Transportation Until recently, if an agency wanted communication to its traffic signals, the best method was installing fiber optic cable. Although
Ohio Department of Transportation
 Ohio Department of Transportation Office of Technical Services Ohio Certified Traffic Manual June 2007 Prepared By: Ohio Certified Traffic Manual Table of Contents Chapter 1 Introduction...1 1.1 Purpose
Evaluation Criteria and Mode Progression for RouteAhead Rapid Transit Projects
 Evaluation Criteria and Mode Progression for RouteAhead Rapid Transit Projects C2012-0684 ATTACHMENT 2 The RouteAhead draft 30-year rapid transit plan was developed in coordination with the Investing in
Transportation Impact Assessment Guidelines
 Transportation Impact Assessment Guidelines Preface The following TIA Guidelines have been developed jointly by the City s Planning and Growth Management and Public Works and Services departments in an
Route Development Plan
 WSDOT Northwest Washington Division, Planning and Policy Office Route Development Plan State Route 99 North/Aurora Avenue North From the North end of the Battery Street Tunnel (Mile Post 32.44) to N. 145th
8+ %!0"% 8+1!%"'$%,$"$
 8+ 8+ %!0"% The next step in developing recommendations for improvements to Grand Avenue was to identify, develop and evaluate alternatives to address the issues and needs identified in the previous chapter.
Chapter Forty-seven. RURAL TWO-LANE/MULTILANE STATE HIGHWAYS (New Construction/Reconstruction) BUREAU OF DESIGN AND ENVIRONMENT MANUAL
 BUREAU OF DESIGN AND ENVIRONMENT MANUAL") Chapter Forty-seven RURAL TWO-LANE/MULTILANE STATE HIGHWAYS (New Construction/Reconstruction) BUREAU OF DESIGN AND ENVIRONMENT MANUAL Illinois RURAL TWO-LANE/MULTILANE STATE HIGHWAYS December 2009 2 Illinois
Chapter Forty-seven RURAL TWO-LANE/MULTILANE STATE HIGHWAYS (New Construction/Reconstruction) BUREAU OF DESIGN AND ENVIRONMENT MANUAL Illinois RURAL TWO-LANE/MULTILANE STATE HIGHWAYS December 2009 2 Illinois
North Avenue Corridor Study. Advisory Committee Meeting #5 June 11, 2014
 North Avenue Corridor Study Advisory Committee Meeting #5 June 11, 2014 Agenda Welcome and introductions Concept refinement and evaluation: Public meeting and web survey General cross-section concepts
7.0 Transportation Management
 7.0 Transportation Management I. Introduction The Kansas City region has invested considerable effort and resources in the design and implementation of its regional multimodal transportation system. As
Hamilton Truck Route Study
 Prepared for the City of Hamilton March 2012 Pavlos S. Kanaroglou, Ph.D. Vivek Korikanthimath, Ph.D. McMaster Institute of Transportation and Logistics McMaster University Hamilton, Ontario March 2012
Development of a Traffic Management Center- Intelligent Transportation Systems Lab
 Development of a Traffic Management Center- Intelligent Transportation Systems Lab By Daniel S. Turner Professor of Civil Engineering and Director of UTCA Department of Civil and Environmental Engineering
Chapter 3 - GPS Data Collection Description and Validation
 Chapter 3 - GPS Data Collection Description and Validation The first step toward the analysis of accuracy and reliability of AVI system was to identify a suitable benchmark for measuring AVI system performance.
APPENDIX J TRAFFIC STUDY
 APPENDIX J TRAFFIC STUDY May 7, 2014 Ms. Leianne Humble Denise Duffy and Associates, Inc. 947 Cass Street, Suite 5 Monterey, CA 93940 Re: Traffic Study for the Heritage Oaks Memorial Park in San Jose,
0.0 Curb Radii Guidelines Version 1.0.2
 Background In early 2014, Transportation Services initiated a review of the Division's design guidelines and standards to move our organization in a direction consistent with the transportation departments
BlipTrack. Case Studies. ANPR vs. Bluetooth. This case describes how data from ANPR cameras match corresponding Bluetooth sensor data.
 ANPR vs. Bluetooth This case describes how data from ANPR cameras match corresponding Bluetooth sensor data. The map shows an arterial road in the city of Aalborg with a total of 4 lanes, 2 in each direction.
2013 QUALITY/ LEVEL OF SERVICE HANDBOOK
 2013 QUALITY/ LEVEL OF SERVICE HANDBOOK STATE OF FLORIDA DEPARTMENT OF TRANSPORTATION 2013 TABLE OF CONTENTS 1 Executive Summary... 1 2 Q/LOS Handbook Purpose and Scope... 3 2.1. Levels of Analysis...4
Traffic Impact Study for the 3817-45 North Broadway Mixed-Use Development Chicago, Illinois. Prepared by
 Traffic Impact Study for the Chicago, Illinois repared by March 30, 2015 1. Introduction This report summarizes the methodologies, results and findings of a traffic impact study conducted by Kenig, Lindgren,
The Northwest Arkansas Travel Demand Model
 The Northwest Arkansas Travel Demand Model Creation and Results John McLarty Northwest Arkansas Regional Planning Commission Cristina Scarlat Center for Advanced Spatial Technologies What is a Travel Demand
Stone Way N Rechannelization: Before and After Study. N 34th Street to N 50th Street
 City of Seattle Department of Transportation Stone Way N Rechannelization: Before and After Study N 34th Street to N 50th Street May, 2010 INTRODUCTION Population density in Seattle is increasing within
Illinois Tollway: Development of Incident Management Based Performance Measures. Jeff Hochmuth, PE, PTOE Wilbur Smith Associates
 Illinois Tollway: Development of Incident Management Based Performance Measures Jeff Hochmuth, PE, PTOE Wilbur Smith Associates Tollways and Data Toll authorities have always been data heavy Need to verify
 Walkable Communities Florida Department of Transportation State Safety Office Pedestrian and Bicycle Program April 1995 www.dot.state.fl.us/safety Twelve Steps for an Effective Program Page 1 Twelve Steps
First Transit Contra Flow Lane in Downtown San Francisco
 Introduction First Transit Contra Flow Lane in Downtown San Francisco Javad Mirabdal, Bond Yee Traffic congestion places a tremendous burden on transit vehicles in cities worldwide. San Francisco, located
MEASUREMENT AND ANALYSIS OF RF EME LEVELS FROM MOBILE TELEPHONE BASE STATIONS LOCATED AT LEICHHARDT, NSW
 AUSTRALIAN RADIATION PROTECTION AND NUCLEAR SAFETY AGENCY A R P N S A Lower Plenty Road YALLAMBIE VIC 3085 Phone 61 3 9433 2211 Fax 61 3 9432 1835 E-mail: arpansa@health.gov.au Web: www.arpansa.gov.au
BEFORE-AND-AFTER STUDY OF THE EFFECTIVENESS OF RECTANGULAR RAPID-FLASHING BEACONS USED WITH SCHOOL SIGN IN GARLAND, TEXAS
 BEFORE-AND-AFTER STUDY OF THE EFFECTIVENESS OF RECTANGULAR RAPID-FLASHING BEACONS USED WITH SCHOOL SIGN IN GARLAND, TEXAS Marcus A. Brewer (corresponding author) Associate Research Engineer Texas Transportation
Data Services Engineering Division. Traffic Monitoring System Program
 Data Services Engineering Division Traffic Monitoring System Program July 2015 Table of Contents Table of Contents Chapter 1: Introduction... 1-1 Chapter 2: Automatic Traffic Recorders (ATRs)... 2-1 ATRs
INVESTIGATION OF ASIM 29X, CANOGA, RTMS, SAS-1, SMARTSENSOR, TIRTL & OTHER SENSORS FOR AUTOMATIC VEHICLE CLASSIFICATION
 INVESTIGATION OF ASIM 29X, CANOGA, RTMS, SAS-1, SMARTSENSOR, TIRTL & OTHER SENSORS FOR AUTOMATIC VEHICLE CLASSIFICATION RESEARCH NEED This research will add to the national and local state-of-the-art on
ELMHURST SPEEDWAY A STUDY OF LAWBREAKING IN ELMHURST
 ELMHURST SPEEDWAY A STUDY OF LAWBREAKING IN ELMHURST INTRODUCTION TWENTY-THIRD AVENUE IS AN EAST-WEST FOUR-LANE ARTERIAL ROAD running through East Elmhurst, Queens. With two lanes of traffic in either
Mobility Management Plan Study of the Busch Boulevard Corridor
 Mobility Management Plan Study of the Busch Boulevard Corridor March 2000 Hillsborough County Metropolitan Planning Organization 601 E. Kennedy, 18th Floor Tampa, Florida 33602-5117 813/272-5940 FAX NO:
Lawson Outline Plan External Traffic Analysis Working Paper
 Total Lawson Development ACTPLA 16 January 2009 Document No.: Prepared for ACTPLA Prepared by Maunsell Australia Pty Ltd Level 2, 60 Marcus Clarke Street, Canberra ACT 2600, Australia T +61 2 6201 3000
Pedestrian and Bicycle Crash Data Analysis: 2005-2010
 MICHIGAN DEPARTMENT OF TRANSPORTATION Pedestrian and Bicycle Crash Data Analysis: 2005-2010 FINAL REPORT Prepared by: T.Y. Lin International and Western Michigan University 4/3/2012 TABLE OF CONTENTS List
V. SHORT-TERM PROGRAM
 V. SHORT-TERM PROGRAM SHORT-TERM MONITORING SITES Short-Term Monitoring Sites provide roadway segment-specific traffic count information on a cyclical basis. Short-Term counts are sometimes called seasonal,
Access Management Manual
 Access Management Manual July 2011 2011 by Texas Department of Transportation (512) 302-2453 all rights reserved Manual Notice 2011-1 From: Manual: Mark A Marek, P.E. Access Management Manual Effective
Intersection Cost Comparison Spreadsheet User Manual ROUNDABOUT GUIDANCE VIRGINIA DEPARTMENT OF TRANSPORTATION
 Intersection Cost Comparison Spreadsheet User Manual ROUNDABOUT GUIDANCE VIRGINIA DEPARTMENT OF TRANSPORTATION Version 2.5 i Virginia Department of Transportation Intersection Cost Comparison Spreadsheet
Surface Transportation Program (STP)
") Project Name: Project Sponsor: FEDERAL FUNDS PROJECT APPLICATION TRANSPORTATION IMPROVEMENT PROGRAM 2008-2013 SALT LAKE and OGDEN/ LAYTON URBAN AREAS Surface Transportation Program (STP) Urban Surface
Project Name: Project Sponsor: FEDERAL FUNDS PROJECT APPLICATION TRANSPORTATION IMPROVEMENT PROGRAM 2008-2013 SALT LAKE and OGDEN/ LAYTON URBAN AREAS Surface Transportation Program (STP) Urban Surface
FINAL REPORT DEVELOPMENT OF CONGESTION PERFORMANCE MEASURES USING ITS INFORMATION. Sarah B. Medley Graduate Research Assistant
 FINAL REPORT DEVELOPMENT OF CONGESTION PERFORMANCE MEASURES USING ITS INFORMATION Sarah B. Medley Graduate Research Assistant Michael J. Demetsky, Ph.D., P.E. Faculty Research Scientist and Professor of
Simulating Traffic for Incident Management and ITS Investment Decisions
 1998 TRANSPORTATION CONFERENCE PROCEEDINGS 7 Simulating Traffic for Incident Management and ITS Investment Decisions MICHAEL D. ANDERSON AND REGINALD R. SOULEYRETTE UTPS-type models were designed to adequately
Addendum to the Arterial Transitway Corridors Study
 January 2013 1 Addendum to the Arterial Transitway Corridors Study The Arterial Transitway Corridors Study (ATCS) evaluated and prioritized arterial bus rapid transit (BRT) improvements to nine corridors
Traffic. Analysis. Traffic Operations Analysis Tool Guidebook Version 1.1. Traffic Engineering Division
 Traffic Analysis Traffic Engineering Division August 2013 Traffic Operations Analysis Tool Guidebook Copyright 2013 by the Virginia Department of Transportation All rights reserved VDOT Traffic Engineering
COUNTY OF ALBEMARLE PLANNING STAFF REPORT SUMMARY. Staff: Claudette Grant
 COUNTY OF ALBEMARLE PLANNING STAFF REPORT SUMMARY Project Name: ZMA 2013-00004 Hollymead Town Center Block VI Planning Commission Public Hearing: July 29, 2014 Staff: Claudette Grant Board of Supervisors
TECHNIQUES FOR MANUALLY ESTIMATING ROAD USER COSTS ASSOCIATED WITH CONSTRUCTION PROJECTS
 TECHNIQUES FOR MANUALLY ESTIMATING ROAD USER COSTS ASSOCIATED WITH CONSTRUCTION PROJECTS by Ginger Daniels, P.E. Associate Research Engineer Texas Transportation Institute David R. Ellis, Ph.D. Associate
ITS Deployment Analysis System (IDAS) Version 2.2, developed by Cambridge Systematics under contract to the Federal Highway Administration, 2002.
 Version 2.2, developed by Cambridge Systematics under contract to the Federal Highway Administration, 2002.") Chapter 8: BENEFITS ANALYSIS 8.1 INTRODUCTION Historically, benefits associated with ITS have been reported based on results of previous ITS deployments either within the particular region or around the
Chapter 8: BENEFITS ANALYSIS 8.1 INTRODUCTION Historically, benefits associated with ITS have been reported based on results of previous ITS deployments either within the particular region or around the
Guidelines for the Preparation of Transportation Impact Studies 8 th Revision
 Guidelines for the Preparation of Transportation Impact Studies 8 th Revision Halifax Regional Municipality Traffic and Right of Way Transportation and Public Works P.O. Box 1749 Halifax, Nova Scotia B3J
Appendix A - Cost Estimate Spreadsheet
 CCTV Camera, PTZ Per Each $18,500 $1,250 12 $33,500 Closed circuit television (CCTV) camera with pan, tilt, zoom (PTZ) functionality in a dome enclosure. CCTV Camera, Fixed Per Each $14,000 $1,250 12 $29,000
1. REPORT CONTEXT Description of the development (include all of the following that are known at the time of the application):
:") Transportation Assessment and Management Study Guidelines for Consultants INTRODUCTION This document is intended to provide guidelines for transportation consultants who produce Transportation reports
Transportation Assessment and Management Study Guidelines for Consultants INTRODUCTION This document is intended to provide guidelines for transportation consultants who produce Transportation reports
City of Kamloops Notre Dame Corridor Access Plan
 FINAL REPORT This report is prepared for the sole use of ICBC. No representations of any kind are made by Urban Systems Ltd. or its employees to any party with whom Urban Systems Ltd. does not have a contract.
How To Use Vehicle Gps Data To Understand Travel Time And Speed In Delaware
 USE OF STATE FLEET VEHICLE GPS DATA FOR TRAVEL TIME ANALYSIS David P. Racca Center for Applied Demography and Survey Research (CADSR) University of Delaware Graham Hall, Rm 284, Newark, Delaware 19716
Boston Traffic Management Center Activity Report for FY 2013 Real-time Traffic Signal Adjustments
 Boston Traffic Management Center Activity Report for FY 2013 Real-time Traffic Signal Adjustments The mission of the Traffic Management Center (TMC) within the Boston Transportation Department is to monitor,
Transportation Policy and Design Strategies. Freight Intensive. Level of Freight Presence
 Appendix G Transportation Policy and Design Strategies CONTEXT SENSITIVE SOLUTIONS To address the need to describe freight systems which account for the population distress which may result, an analysis
SAN DIEGO GAS & ELECTRIC COMPANY SOUTH BAY SUBSTATION RELOCATION PROJECT TRAFFIC MANAGEMENT PLAN SEPTEMBER 2014
 SAN DIEGO GAS & ELECTRIC COMPANY SOUTH BAY SUBSTATION RELOCATION PROJECT TRAFFIC MANAGEMENT PLAN SEPTEMBER 2014 Traffic Management Plan TABLE OF CONTENTS 1 INTRODUCTION... 1 2 OBJECTIVES... 1 3 APPLICABLE
TABLE OF CONTENTS TABLES FIGURES
 TABLE OF CONTENTS Introduction...1 1. On-Site Stacking...2 2. Number of School Driveways...2 3. School Driveway Standards...3 3A. Driveway Spacing...3 3B. Driveway Location...4 3C. Driveway Lane Widths
Texas Case Studies in Access Management. Ed Hard, TTI
 Texas Case Studies in Access Management Ed Hard, TTI 8 th National Conference on Access Management August 15, 2006 Presentation Overview TxDOT Arterial Widenings, College Station, TX Processes for Median
Advantages and Disadvantages of One Way Streets October 30, 2007
 Advantages and Disadvantages of One Way Streets October 30, 2007 0 P age Background As the revitalization of the Central Waterfront area moves forward, one issue that might need closer analysis is the
The data can be transmitted through a variety of different communications platforms such as:
 COMMUNICATION NETWORK General Overview of SCADA Communications Without a properly designed communication network system, a SCADA system cannot exist. All supervisory control and data acquisition aspects
3 Tappan Zee Bridge Rehabilitation Options
 3 Tappan Zee Bridge Rehabilitation Options 3.1 Introduction This chapter describes possible options that rehabilitate and enhance the existing Tappan Zee Bridge. Four Rehabilitation Options have been developed:
Chapter 5. Transportation. Decatur County Comprehensive Plan. Introduction. Goals and Objectives. Goal. Objectives. Goal.
 Chapter 5 Transportation Chapter 5: Transportation Introduction The transportation system forms the backbone of a community. I-74 connects Decatur County with the large metropolitan areas of Cincinnati
Western Boulevard (NC 53) Corridor Study
 Corridor Study") Western Boulevard (NC 53) Corridor Study, North Carolina PREPARED FOR Jacksonville Urban Area MPO PREPARED BY January 26, 2015 Final Report Acknowledgements Oversight Team / Jacksonville Urban Area MPO
Western Boulevard (NC 53) Corridor Study, North Carolina PREPARED FOR Jacksonville Urban Area MPO PREPARED BY January 26, 2015 Final Report Acknowledgements Oversight Team / Jacksonville Urban Area MPO
Section 2: Overview of Wireless Broadband Networks
 Section 2: Overview of Wireless Broadband Networks 2.1 Introduction to Broadband Network Elements Over the past decade, technological innovation and a motivation to deploy broadband in new, efficient ways
TRANSPORTATION IMPACT ANALYSIS (TIA) Guidelines
 Guidelines") TRANSPORTATION IMPACT ANALYSIS (TIA) Guidelines Methodology For Development Applications Requiring a TIA in Volusia County, Florida TIA Guidelines As adopted on November 24, 2009 (The Volusia Transportation
TRANSPORTATION IMPACT ANALYSIS (TIA) Guidelines Methodology For Development Applications Requiring a TIA in Volusia County, Florida TIA Guidelines As adopted on November 24, 2009 (The Volusia Transportation
Wireless Traffic Management System
 Wireless Traffic Management System 1 Introduction The County of Los Angeles Department of Public Works (LADPW) manages surface street traffic flow in one of the world s largest metropolitan areas. The
Transportation Component
 Final Report Transportation Component Institutional Master Plan Brown University Prepared for Brown University Providence, Rhode Island Prepared by /Vanasse Hangen Brustlin, Inc. Transportation, Land Development,
Caledon Transportation Needs Study. Study Report
 Caledon Transportation Needs Study Study Report March 2009 PROJECT SUMMARY PROJECT NAME:...CALEDON TRANSPORTATION NEEDS STUDY UPDATE CLIENT:... THE TOWN OF CALEDON & THE REGIONAL MUNICIPALITY OF PEEL CALEDON
A Comparative Study of Speed Humps, Speed Slots and Speed Cushions
 A Comparative Study of Speed Humps, Speed Slots and Speed Cushions LaToya Johnson and A.J. Nedzesky Abstract. The primary objective of this study was to compare speed humps with two newer traffic calming
Multi Modal Roadway Transportation Impact Fees and Asset Value
 January 2010 SB 360 Article Series: Factors to be Considered in Transitioning from a Road Impact Fee to a Mobility Fee Contributing Authors: Steven A. Tindale, P.E., AICP Robert P. Wallace, P.E., AICP
BANGKOK TRAFFIC MONITORING SYSTEM
 BANGKOK TRAFFIC MONITORING SYSTEM Sorawit NARUPITI Associate Professor Transportation Research Laboratory, Department of Civil Engineering, Chulalongkorn University Phayathai Road, Bangkok 10330 Thailand
Robichaud K., and Gordon, M. 1
 Robichaud K., and Gordon, M. 1 AN ASSESSMENT OF DATA COLLECTION TECHNIQUES FOR HIGHWAY AGENCIES Karen Robichaud, M.Sc.Eng, P.Eng Research Associate University of New Brunswick Fredericton, NB, Canada,
Performance Measures for RIDOT s Traffic Management Center
 Performance Measures for RIDOT s Traffic Management Center Catherine Burns, EIT Transportation Engineer Sudhir Murthy, PE, PTOE President 5/2011 Presentation Outline RIDOT Performance Measures Public Outreach
Table of Contents. Traffic Control Devices (Signs, Channelizing Devices, Lighting Devices, Pavement Markings) 2-7
 2-7") 1 Table of Contents Introduction 2 Traffic Control Devices (Signs, Channelizing Devices, Lighting Devices, Pavement Markings) 2-7 Five Parts of a Traffic Control Zone 8 Buffer Space Guidance 9 Taper Length
1 Table of Contents Introduction 2 Traffic Control Devices (Signs, Channelizing Devices, Lighting Devices, Pavement Markings) 2-7 Five Parts of a Traffic Control Zone 8 Buffer Space Guidance 9 Taper Length
REGIONAL TRANSPORTATION SAFETY INFORMATION MANAGEMENT SYSTEM (RTSIMS) Phase II UPWP Project: 600-0180-09 Task Order SA09-1 Goal
 Phase II UPWP Project: 600-0180-09 Task Order SA09-1 Goal") REGIONAL TRANSPORTATION SAFETY INFORMATION MANAGEMENT SYSTEM (RTSIMS) Phase II UPWP Project: 600-0180-09 Task Order SA09-1 Goal The overall goal of the RTSIMS project is to develop an information management
REGIONAL TRANSPORTATION SAFETY INFORMATION MANAGEMENT SYSTEM (RTSIMS) Phase II UPWP Project: 600-0180-09 Task Order SA09-1 Goal The overall goal of the RTSIMS project is to develop an information management
TRAFFIC IMPACT ANALYSIS HANDBOOK VOLUME I METHODOLOGIES & REQUIREMENTS
 TRAFFIC IMPACT ANALYSIS HANDBOOK VOLUME I METHODOLOGIES & REQUIREMENTS Downtown panoramic photo provided by 1stACT Silicon Valley (blank below this line) Volume I Methodologies and Requirements TABLE OF
Nearly 38,000 vehicles cross the Shinnecock Canal on Sunrise Highway (NYS Route 27) daily, during peak summer months.
 daily, during peak summer months.") 2. Traffic Characteristics Traffic volumes have increased in concert with population growth in the Towns of Southampton and East Hampton. The New York State Department of Transportation (NYSDOT) maintains
2. Traffic Characteristics Traffic volumes have increased in concert with population growth in the Towns of Southampton and East Hampton. The New York State Department of Transportation (NYSDOT) maintains
Is Encouraging More Bike Ridership On El Camino Real A Good Idea?
 Is Encouraging More Bike Ridership On El Camino Real A Good Idea? In the above illustration there is a shared right turn lane on southbound El Camino Real at the intersection with Santa Cruz Avenue. Turning
ARCHITECT - ENGINEER QUALIFICATIONS
 ARCHITECT - ENGINEER QUALIFICATIONS PART I - CONTRACT-SPECIFIC QUALIFICATIONS A. CONTRACT INFORMATION 1. TITLE AND LOCATION (City and State): 2. PUBLIC NOTICE DATE: 3. SOLICITATION OR PROJECT NUMBER: B.
The partnership has selected three intersections where enforcement, education, and engineering initiatives are being implemented to improve safety:
 Hamilton-Finn Suite 310 Tel. (403) 207-6000 Road Safety 3016 5th Avenue N.E. Fax. (403) 273-3440 Consultants Ltd. Calgary, Alberta dawatt.dawatt.com www.hamiltonfinn.ca January 19, 2005 Mr. Don Szarko,
Highway 138 Corridor Solutions Study Roseburg, Oregon. Technical Memorandum #4: Concept Development and Screening DRAFT
 Highway 138 Corridor Solutions Study Roseburg, Oregon Technical Memorandum #4: DRAFT Prepared for Oregon Department of Transportation, Region 3 3500 NW Stewart Parkway Roseburg, Oregon 97470 Prepared by