Transforming Geodata for Immersive Visualisation
|
|
|
- Griffin Denis Todd
- 9 years ago
- Views:
Transcription

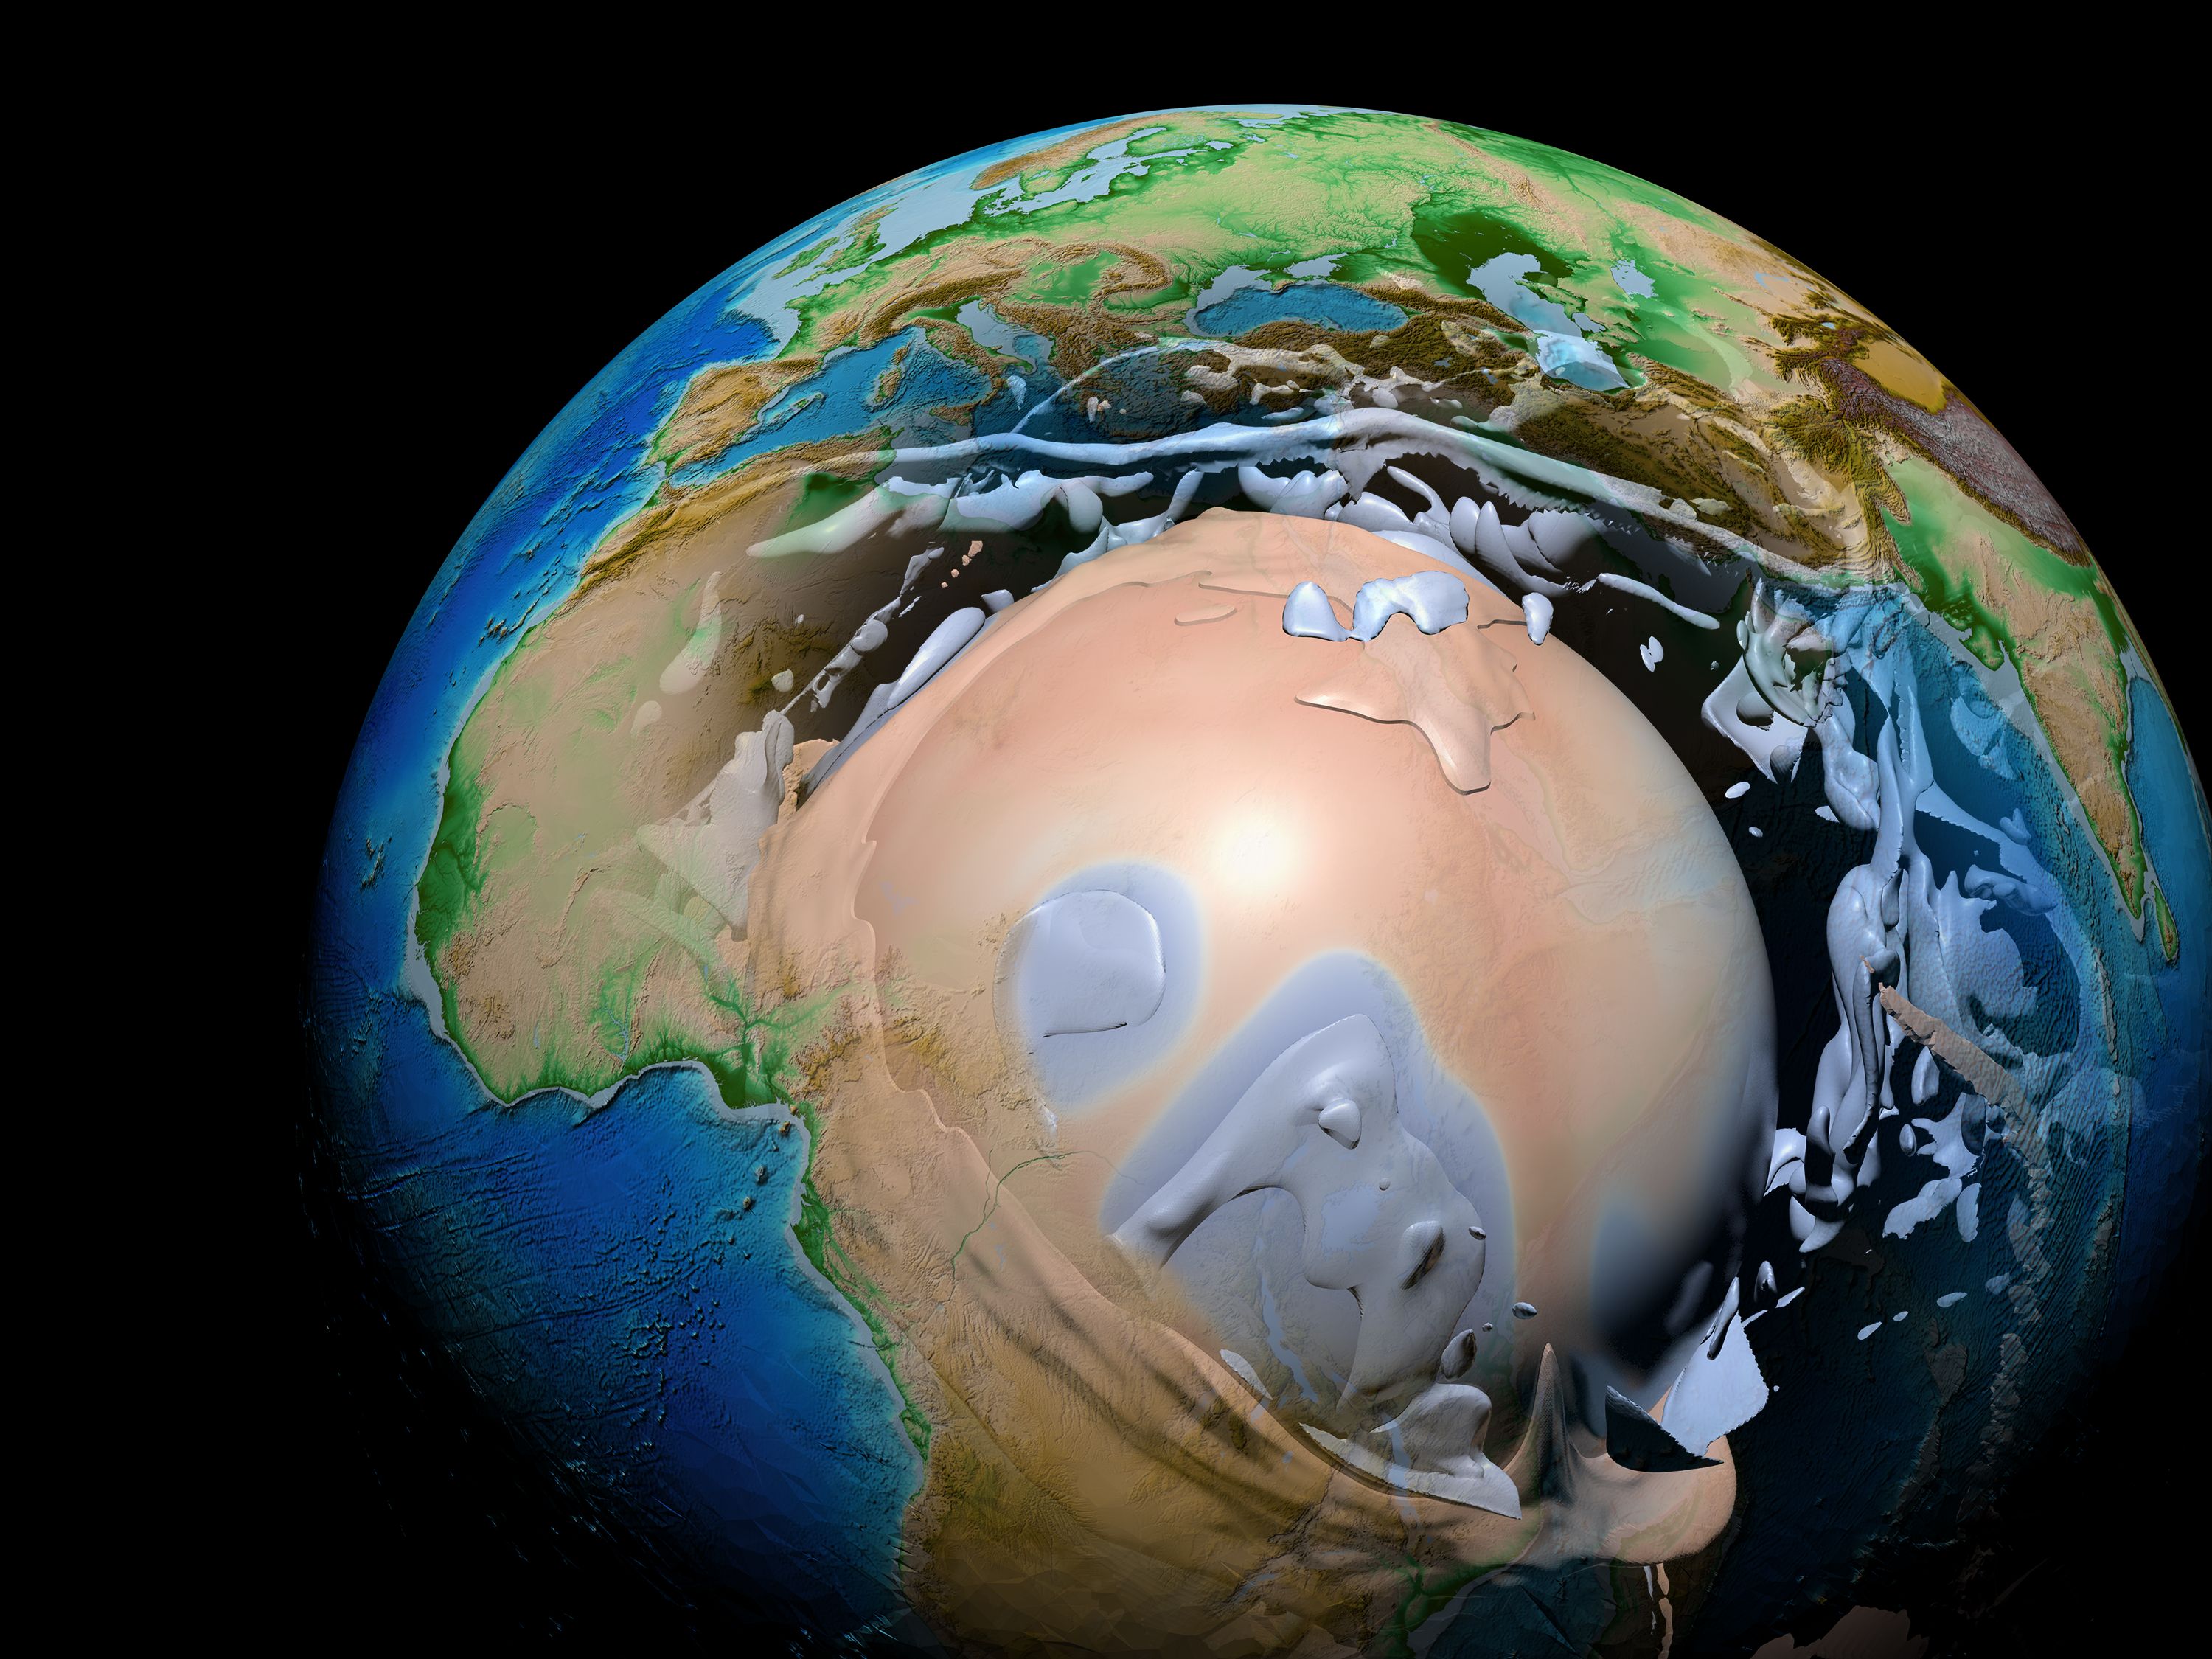
1 Transforming Geodata for Immersive Visualisation
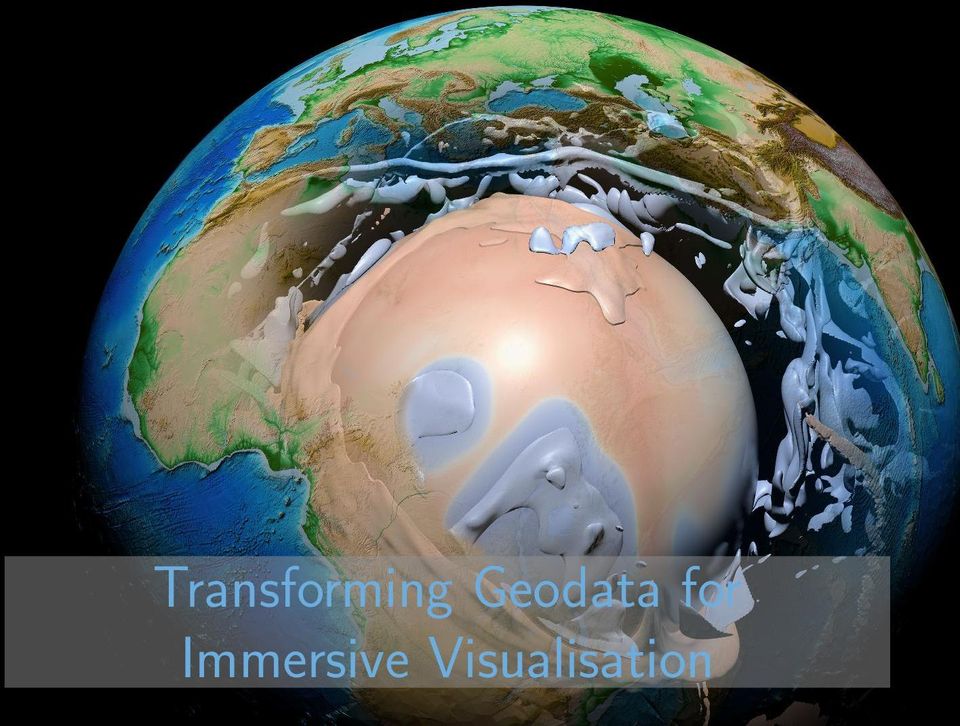

2 Transforming Geodata for Immersive Visualisation M. Wiedemann 1 C. Anthes 1 H.-P. Bunge 2 B.S.A. Schuberth 2 D. Kranzlmüller 1 1 Centre for Virtual Reality and Visualisation Leibniz Supercomputing Centre 2 Department of Earth and Environmental Sciences Ludwig Maximilians Universität escience, 2015

3 What is Immersive Visualisation? What does it mean? Using Virtual Reality (VR) technology for scientific or information visualisation VR characteristics Real-time interactive User centered Typically stereoscopic Head tracking leads to intuitive and playful analysis Combination of stereoscopy and head motion fosters construction of mental spatial image

4 Hardware Requirements Potential displays Head-Mounted-Displays (HMD): Oculus Rift, HTC Vive,... Projection displays: Tracked Powerwalls, Curved Screens,... Spatially immersive displays: CAVE Environments Potential input devices Tracking system: Optical, inertial sensors Wand: Controller, Joypad Mobile devices: Tablet, Smartphone Source: https: //www1.oculus.com/order/ Source: ar-tracking.com/products/ interaction/flystick3/ Source: gfx/news/2012/nexus10.jpg

5 Spatially Immersive Displays I Based on concepts by Carolina Cruz-Neira I 3 walls, floor and ceiling back-projected I Optical position tracking Source: Schema_CAVE_en.png Immersive Visualisation Visualisation Application Present Visualisation Summary

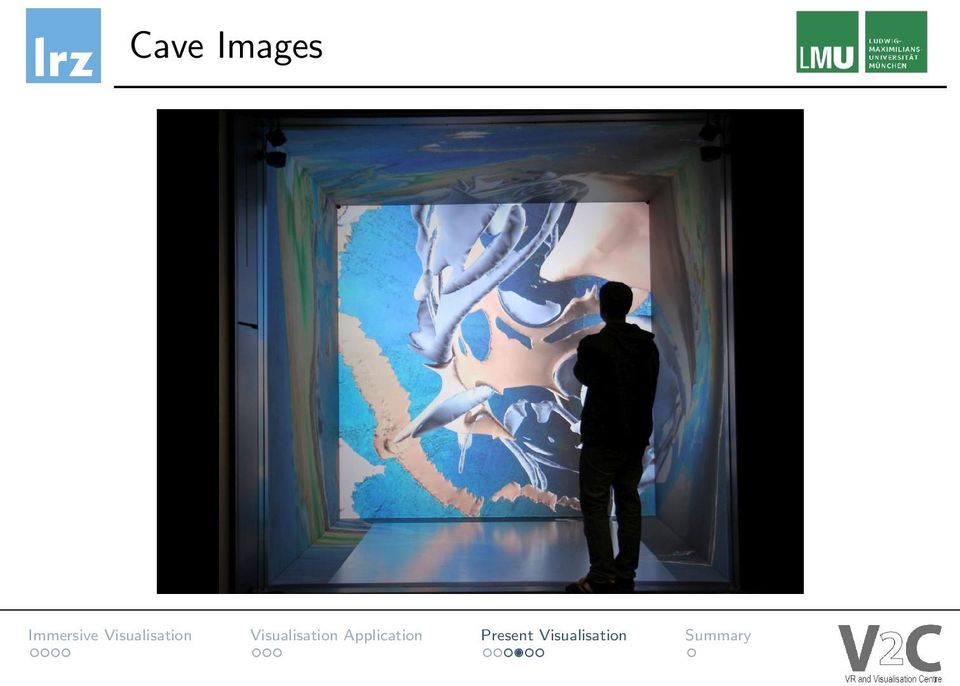
6 Using CAVE-like Environments Why CAVE-like environments? Close to full field of view Walk within the data (locomotion) Multi-user Self perception Source: wp-content/uploads/2014/08/mount-fov.png

7 General Workflow Abstract Overview Interaction Input Input Input Display I/O Optimise I/O Display Display.. Map multiple inputs to multiple outputs

8 Input Simulation Data Mantle circulation model for simulation of Earth s mantle (calculated on SuperMUC) Simulation data including large-scale thermal structure 90 million points ETOPO1 topography dataset Additional 233 million points Visualisation of thermal data

9 Necessity for Optimisation Challenges Real-time requirement (120 frames per second: 60 per eye) Image synchronisation Current setup allows rendering of 1 million triangles Visual clutter Data reduction needed

10 Implementation 3ds Max ETOPO1 Temperature Distribution I/O Optimisation I/O OpenSG Application Interaction

11 Optimisation Iso surfacing Decimation Clustering

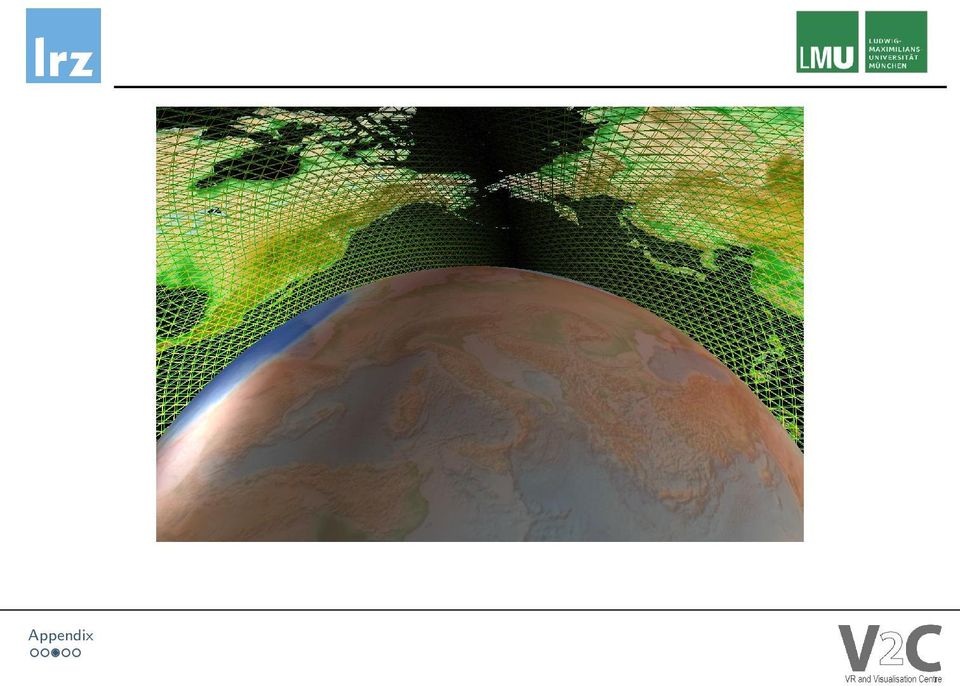
12 Rendered Images

13 Cave Images
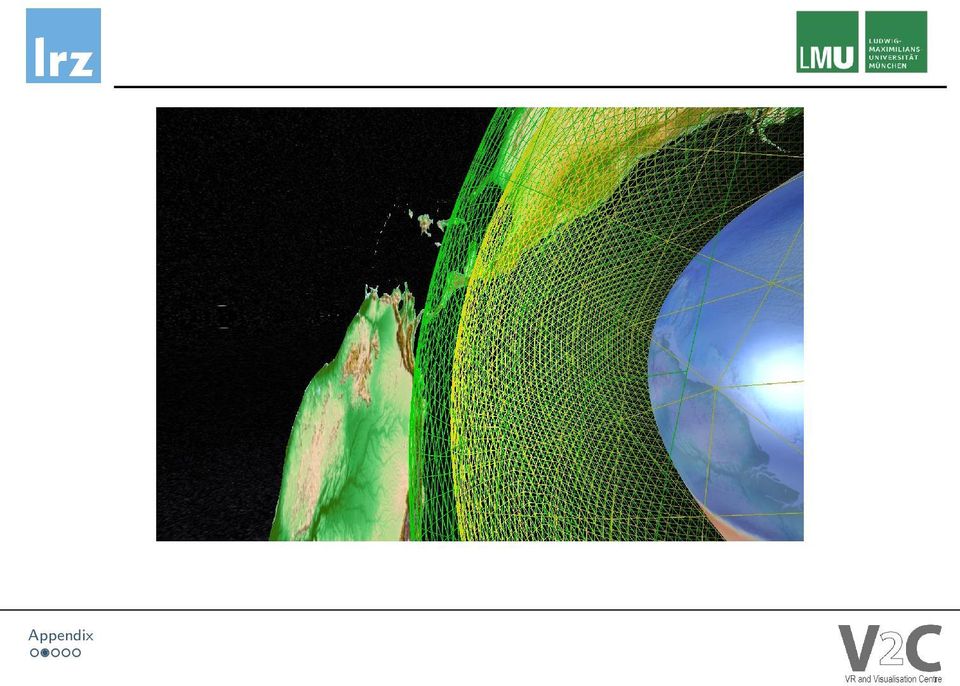
14 Additional features Visual Helpers I Spherical grid at 410km and 660km below surface I Visualisation of Earth s core I Projection of surface texture on core I Phong shader for emphasis of structure Immersive Visualisation Visualisation Application Present Visualisation Summary

15 Video Source: Bayerischer Rundfunk - Rundschau

16 Summary Data optimisation enabling immersive visualisation Intuitive insight for scientists Better understanding of simulation data Outlook Time dependent data visualisation Beachball representation for seismic events Visualise lithosphere Source: content/92/1/376/f8.large.jpg

17 For Further Reading B. S. A. Schuberth, H.-P. Bunge, G. Steinle-Neumann, C. Moder, and J. Oeser, Thermal versus elastic heterogeneity in high-resolution mantle circulation models with pyrolite composition: High plume excess temperatures in the lowermost mantle, Geochemistry, Geophysics, Geosystems, vol. 10, no. 1, p. Q01W01, Jan C. Cruz-Neira, D. J. Sandin, T. A. Defanti, R. V. Kenyon, and J. C. Hart, The cave: Audio visual experience automatic virtual environment, Communications of the ACM, vol. 35, no. 6, pp , June D. Reiners, Opensg: A scene graph system for flexible and efficient realtime rendering for virtual and augmented reality applications, Ph.D. dissertation, Technische Universität Darmstadt, Mai Appendix

18 Appendix
19 Appendix
20 Appendix

21 Appendix
Study of Large-Scale Data Visualization
 Study of Large-Scale Data Visualization Project Representative Fumiaki Araki The Earth Simulator Center, Japan Agency for Marine-Earth Science and Technology Authors Fumiaki Araki 1, Shintaro Kawahara
DEVELOPMENT OF A COLLABORATIVE DESIGN TOOL FOR STRUCTURAL ANALYSIS IN AN IMMERSIVE VIRTUAL ENVIRONMENT
 Seventh International IBPSA Conference Rio de Janeiro, Brazil August 13-15, 2001 DEVELOPMENT OF A COLLABORATIVE DESIGN TOOL FOR STRUCTURAL ANALYSIS IN AN IMMERSIVE VIRTUAL ENVIRONMENT Mehdi Setareh 1,
3D U ser I t er aces and Augmented Reality
 3D User Interfaces and Augmented Reality Applications Mechanical CAD 3D Animation Virtual Environments Scientific Visualization Mechanical CAD Component design Assembly testingti Mechanical properties
Virtual Environments - Basics -
 Virtual Environments - Basics - What Is Virtual Reality? A Web-Based Introduction Version 4 Draft 1, September, 1998 Jerry Isdale http://www.isdale.com/jerry/vr/whatisvr.html Virtual Environments allow
Virtual Reality. man made. reality. sense. world. What is Virtual Reality?
 Virtual Reality man made reality sense world What is Virtual Reality? Dipl.-Ing. Indra Kusumah Process Technology Fraunhofer IPT Steinbachstrasse 17 D-52074 Aachen [email protected] www.ipt.fraunhofer.de
INTERACTIVE 3D SIMULATION SYSTEM IN GAME ENGINE BASED COLLABORATIVE VIRTUAL ENVIRONMENT FOR ARCHITECTURAL DESIGN COMMUNICATION
 INTERACTIVE 3D SIMULATION SYSTEM IN GAME ENGINE BASED COLLABORATIVE VIRTUAL ENVIRONMENT FOR ARCHITECTURAL DESIGN COMMUNICATION PRITTIPORN LOPKERD, PINTO JINUNTUYA Faculty of Architecture and Planning,
Visualization and Simulation for Research and Collaboration. An AVI-SPL Tech Paper. www.avispl.com (+01).866.559.8197
.866.559.8197") Visualization and Simulation for Research and Collaboration An AVI-SPL Tech Paper www.avispl.com (+01).866.559.8197 1 Tech Paper: Visualization and Simulation for Research and Collaboration (+01).866.559.8197
Visualization and Simulation for Research and Collaboration An AVI-SPL Tech Paper www.avispl.com (+01).866.559.8197 1 Tech Paper: Visualization and Simulation for Research and Collaboration (+01).866.559.8197
Virtual Reality finally getting reality. Martin Schrader, Nokia Technologies
 Virtual Reality finally getting reality Martin Schrader, Nokia Technologies Overview Two examples of current VR applications Defining the scope The promise of the immersive experience Some recent moves
Modelling 3D Avatar for Virtual Try on
 Modelling 3D Avatar for Virtual Try on NADIA MAGNENAT THALMANN DIRECTOR MIRALAB UNIVERSITY OF GENEVA DIRECTOR INSTITUTE FOR MEDIA INNOVATION, NTU, SINGAPORE WWW.MIRALAB.CH/ Creating Digital Humans Vertex
massive aerial LiDAR point clouds
 Visualization, storage, analysis and distribution of massive aerial LiDAR point clouds Gerwin de Haan and Hugo Ledoux Data Visualization group GIS technology group GeoWeb 2010, Vancouver July 28 2010 1
3D Client Software - Interactive, online and in real-time
 3D Client Software - Interactive, online and in real-time Dipl.Inform.Univ Peter Schickel CEO Bitmanagement Software Vice President Web3D Consortium, Mountain View, USA OGC/Web3D liaison manager Presentation
Immersed 3D Visualization of the University of Chicago Campus. Scott Stocking, GISP Facilities Services Department
 Immersed 3D Visualization of the University of Chicago Campus Scott Stocking, GISP Facilities Services Department Discussion Outline - Objectives of the Project - Data Utilized - Methods Used to build
THE FLATWORLD SIMULATION CONTROL ARCHITECTURE (FSCA): A FRAMEWORK FOR SCALABLE IMMERSIVE VISUALIZATION SYSTEMS
: A FRAMEWORK FOR SCALABLE IMMERSIVE VISUALIZATION SYSTEMS") THE FLATWORLD SIMULATION CONTROL ARCHITECTURE (FSCA): A FRAMEWORK FOR SCALABLE IMMERSIVE VISUALIZATION SYSTEMS Anton Treskunov, Jarrell Pair*, and Bill Swartout Institute for Creative Technologies University
THE FLATWORLD SIMULATION CONTROL ARCHITECTURE (FSCA): A FRAMEWORK FOR SCALABLE IMMERSIVE VISUALIZATION SYSTEMS Anton Treskunov, Jarrell Pair*, and Bill Swartout Institute for Creative Technologies University
From BIM to VR. Integrating immersive visualizations in the current design process
 From BIM to VR Integrating immersive visualizations in the current design process Mikael Johansson 1, Mattias Roupé 2, Mikael Viklund Tallgren 3 1,2,3 Chalmers University of Technology, Sweden 1,2,3 {jomi
Go to contents 18 3D Visualization of Building Services in Virtual Environment
 3D Visualization of Building Services in Virtual Environment GRÖHN, Matti Gröhn; MANTERE, Markku; SAVIOJA, Lauri; TAKALA, Tapio Telecommunications Software and Multimedia Laboratory Department of Computer
Service-Oriented Visualization of Virtual 3D City Models
 Service-Oriented Visualization of Virtual 3D City Models Authors: Jan Klimke, Jürgen Döllner Computer Graphics Systems Division Hasso-Plattner-Institut, University of Potsdam, Germany http://www.hpi3d.de
MEng, BSc Applied Computer Science
 School of Computing FACULTY OF ENGINEERING MEng, BSc Applied Computer Science Year 1 COMP1212 Computer Processor Effective programming depends on understanding not only how to give a machine instructions
Computer Graphics with OpenGL 3e
 Computer Graphics with OpenGL 3e Chapter1 A surveys of Computer Graphics Computer Graphics Applications Graphs and Charts Computer-Aided Design Virtual-Reality Environments Data Visualizations Educations
NVIDIA IndeX Enabling Interactive and Scalable Visualization for Large Data Marc Nienhaus, NVIDIA IndeX Engineering Manager and Chief Architect
 SIGGRAPH 2013 Shaping the Future of Visual Computing NVIDIA IndeX Enabling Interactive and Scalable Visualization for Large Data Marc Nienhaus, NVIDIA IndeX Engineering Manager and Chief Architect NVIDIA
MEng, BSc Computer Science with Artificial Intelligence
 School of Computing FACULTY OF ENGINEERING MEng, BSc Computer Science with Artificial Intelligence Year 1 COMP1212 Computer Processor Effective programming depends on understanding not only how to give
Instructor. Goals. Image Synthesis Examples. Applications. Computer Graphics. Why Study 3D Computer Graphics?
 Computer Graphics Motivation: Why do we study 3D Graphics? http://www.cs.ucsd.edu/~ravir Instructor http://www.cs.ucsd.edu/~ravir PhD Stanford, 2002. PhD thesis developed Spherical Harmonic Lighting widely
OMIQ srl. Advanced Post-Processing of Flow3D Calculations using Ensight. Federico Monterosso. Ingegneria di componenti e sistemi industriali
 OMIQ srl Ingegneria di componenti e sistemi industriali Advanced Post-Processing of Flow3D Calculations using Ensight Federico Monterosso Agenda A brief introduction of OMIQ A not-so-brief introduction
Faculty of Computer Science Computer Graphics Group. Final Diploma Examination
 Faculty of Computer Science Computer Graphics Group Final Diploma Examination Communication Mechanisms for Parallel, Adaptive Level-of-Detail in VR Simulations Author: Tino Schwarze Advisors: Prof. Dr.
Development of Simulation Tools Software
 Development of Simulation Tools Software Vincent Luboz Department of Biosurgery and Surgical Technology Imperial College London BSc VR Surgical Simulation Software Slide 1 Contents Virtual Reality VR Surgical
REGULATIONS FOR THE DEGREE OF MASTER OF SCIENCE IN COMPUTER SCIENCE (MSc[CompSc])
![REGULATIONS FOR THE DEGREE OF MASTER OF SCIENCE IN COMPUTER SCIENCE (MSc[CompSc])](/thumbs/24/2595933.jpg "REGULATIONS FOR THE DEGREE OF MASTER OF SCIENCE IN COMPUTER SCIENCE (MSc[CompSc])") 244 REGULATIONS FOR THE DEGREE OF MASTER OF SCIENCE IN COMPUTER SCIENCE (MSc[CompSc]) (See also General Regulations) Any publication based on work approved for a higher degree should contain a reference
244 REGULATIONS FOR THE DEGREE OF MASTER OF SCIENCE IN COMPUTER SCIENCE (MSc[CompSc]) (See also General Regulations) Any publication based on work approved for a higher degree should contain a reference
A Study of Immersive Game Contents System Design and Modeling for Virtual Reality Technology
 , pp.411-418 http://dx.doi.org/10.14257/ijca.2014.7.10.38 A Study of Immersive Game Contents System Design and Modeling for Virtual Reality Technology Jung-Yoon Kim 1 and SangHun Nam 2 1 Graduate School
Parallel Analysis and Visualization on Cray Compute Node Linux
 Parallel Analysis and Visualization on Cray Compute Node Linux David Pugmire, Oak Ridge National Laboratory and Hank Childs, Lawrence Livermore National Laboratory and Sean Ahern, Oak Ridge National Laboratory
Software Tools for Virtual Reality Application Development
 Software Tools for Virtual Reality Application Development SIGGRAPH 98 Course 14 Applied Virtual Reality Allen Bierbaum and Christopher Just (allenb, [email protected]) Iowa Center for Emerging Manufacturing
Chapter 00. Introduction to Crime Scene Reconstruction using Real-Time Interactive 3D Technology. Phillip M. Sauter
 Chapter 00 Introduction to Crime Scene Reconstruction using Real-Time Interactive 3D Technology by Phillip M. Sauter NAME: Phillip M. Sauter PROFESSIONAL ACTIVITIES: President and CEO, PMS Microdesign,
XDS-1000. Multi-windowing display management system
 XDS-1000 Multi-windowing display management system The powerful XDS-1000 manages multi-channel, high-resolution display walls easily with keyboard and mouse. On its integrated Windows XP desktop, it seamlessly
High speed 3D capture for Configuration Management DOE SBIR Phase II Paul Banks [email protected]
 High speed 3D capture for Configuration Management DOE SBIR Phase II Paul Banks [email protected] Advanced Methods for Manufacturing Workshop September 29, 2015 1 TetraVue does high resolution 3D
Advantages of using a virtual reality tool in shipbuilding
 Advantages of using a virtual reality tool in shipbuilding Verónica Alonso, SENER, Madrid/Spain, [email protected] Rodrigo Pérez, SENER, Madrid/Spain, [email protected] Luis Sánchez, SENER,
1. Which of the following best describes your organisation? (check only one)
") Initial Report Last Modified: 12/04/2015 1. Which of the following best describes your organisation? (check only one) 1 Architectural Design Practice 56 36% 2 Interior Design Practice 17 11% 3 Engineering
Initial Report Last Modified: 12/04/2015 1. Which of the following best describes your organisation? (check only one) 1 Architectural Design Practice 56 36% 2 Interior Design Practice 17 11% 3 Engineering
AR in architectural and urban planning. søren s. sørensen, architect / assistant professor the oslo school of architecture and design, norway.
 AR in architectural and urban planning. søren s. sørensen, architect / assistant professor the oslo school of architecture and design, norway. AHO aho is an independent higher education institution within
Technical Specifications: tog Live
 s: tog Live TEXT AND TICKERS SPORTS INSERTION VIRTUAL STUDIOS AUGMENTED REALITY tog Live: the playout engine for all RT Software tog products tog 3d Live is RT Software s core render technology responsible
BUILDING TELEPRESENCE SYSTEMS: Translating Science Fiction Ideas into Reality
 BUILDING TELEPRESENCE SYSTEMS: Translating Science Fiction Ideas into Reality Henry Fuchs University of North Carolina at Chapel Hill (USA) and NSF Science and Technology Center for Computer Graphics and
VIRTUAL REALITY GAME CONTROLLED WITH USER S HEAD AND BODY MOVEMENT DETECTION USING SMARTPHONE SENSORS
 VIRTUAL REALITY GAME CONTROLLED WITH USER S HEAD AND BODY MOVEMENT DETECTION USING SMARTPHONE SENSORS Herman Tolle 1, Aryo Pinandito 2, Eriq Muhammad Adams J. 3 and Kohei Arai 4 1,2,3 Multimedia, Game
Introduction to Computer Graphics
 Introduction to Computer Graphics Torsten Möller TASC 8021 778-782-2215 [email protected] www.cs.sfu.ca/~torsten Today What is computer graphics? Contents of this course Syllabus Overview of course topics
Field Force Operational Data Visualization What s So Smart About It?
 Field Force Operational Data Visualization What s So Smart About It? John J. Simmins, Ph.D. Electric Power Research Institute Smart Grid Information Sharing Call November 27, 2012 The self healing grid
CG: Computer Graphics
 CG: Computer Graphics CG 111 Survey of Computer Graphics 1 credit; 1 lecture hour Students are exposed to a broad array of software environments and concepts that they may encounter in real-world collaborative
The Visualization Pipeline
 The Visualization Pipeline Conceptual perspective Implementation considerations Algorithms used in the visualization Structure of the visualization applications Contents The focus is on presenting the
OctaVis: A Simple and Efficient Multi-View Rendering System
 OctaVis: A Simple and Efficient Multi-View Rendering System Eugen Dyck, Holger Schmidt, Mario Botsch Computer Graphics & Geometry Processing Bielefeld University Abstract: We present a simple, low-cost,
Deep Learning Meets Heterogeneous Computing. Dr. Ren Wu Distinguished Scientist, IDL, Baidu [email protected]
 Deep Learning Meets Heterogeneous Computing Dr. Ren Wu Distinguished Scientist, IDL, Baidu [email protected] Baidu Everyday 5b+ queries 500m+ users 100m+ mobile users 100m+ photos Big Data Storage Processing
ADVANCED VISUALIZATION
 Cyberinfrastructure Technology Integration (CITI) Advanced Visualization Division ADVANCED VISUALIZATION Tech-Talk by Vetria L. Byrd Visualization Scientist November 05, 2013 THIS TECH TALK Will Provide
How To Create A Flood Simulator For A Web Browser (For Free)
") Interactive Web-based Flood Simulation System for Realistic Experiments of Flooding and Flood Damage Ibrahim Demir Big Data We are generating data on a petabyte scale through observations and modeling
Interactive Web-based Flood Simulation System for Realistic Experiments of Flooding and Flood Damage Ibrahim Demir Big Data We are generating data on a petabyte scale through observations and modeling
PETROBRAS R&D CENTER (CENPES)
") PETROBRAS R&D CENTER (CENPES) Luciano Pereira dos Reis CENPES / PDP /GR SIBGRAPI 2009: Workshop on Applications of Graphics for the Petroleum Industry TECHNOLOGICAL PROGRAMS New Exploratory Frontiers Basin
PETROBRAS R&D CENTER (CENPES) Luciano Pereira dos Reis CENPES / PDP /GR SIBGRAPI 2009: Workshop on Applications of Graphics for the Petroleum Industry TECHNOLOGICAL PROGRAMS New Exploratory Frontiers Basin
An interactive 3D visualization system for displaying fieldmonitoring
 icccbe 2010 Nottingham University Press Proceedings of the International Conference on Computing in Civil and Building Engineering W Tizani (Editor) An interactive 3D visualization system for displaying
The Limits of Human Vision
 The Limits of Human Vision Michael F. Deering Sun Microsystems ABSTRACT A model of the perception s of the human visual system is presented, resulting in an estimate of approximately 15 million variable
Republic Polytechnic School of Information and Communications Technology C391 Animation and Visual Effect Automation.
 Republic Polytechnic School of Information and Communications Technology C391 Animation and Visual Effect Automation Module Curriculum This document addresses the content related abilities, with reference
Augmented Reality to Supplement Work Instructions. Model-Based Enterprise Summit 2013 December 18-19, 2013, Gaithersburg, MD Rafael Radkowski
 Augmented Reality to Supplement Work Instructions Model-Based Enterprise Summit 2013 December 18-19, 2013, Gaithersburg, MD Rafael Radkowski Augmented Reality to Supplement Work Instructions Augmented
Three Methods for Making of Character Facial Animation based on Game Engine
 Received September 30, 2014; Accepted January 4, 2015 Three Methods for Making of Character Facial Animation based on Game Engine Focused on Scene Composition of Machinima Game Walking Dead Chanho Jeong
Building Information Modeling Integration of BIM/Revit, Virtual Reality and Simulations. Dr. Uwe Wössner, Prof. Joachim Kieferle
 Building Information Modeling Integration of BIM/Revit, Virtual Reality and Simulations Dr. Uwe Wössner, Prof. Joachim Kieferle 1. Combination of BIM, VR and Simulation 2. VR-Environments and their integration
INTRAFOCUS. DATA VISUALISATION An Intrafocus Guide
 DATA VISUALISATION An Intrafocus Guide September 2011 Table of Contents What is Data Visualisation?... 2 Where is Data Visualisation Used?... 3 The Market View... 4 What Should You Look For?... 5 The Key
Visualization methods for patent data
 Visualization methods for patent data Treparel 2013 Dr. Anton Heijs (CTO & Founder) Delft, The Netherlands Introduction Treparel can provide advanced visualizations for patent data. This document describes
Master of Science Graphics, Multimedia and Virtual Reality. Courses description
 Master of Science Graphics, Multimedia and Virtual Reality Courses description Advanced graphics programming techniques The course presents methods for complex 3D scenes rendering using GPU advanced programming
HPC technology and future architecture
 HPC technology and future architecture Visual Analysis for Extremely Large-Scale Scientific Computing KGT2 Internal Meeting INRIA France Benoit Lange [email protected] Toàn Nguyên [email protected]
SAN DIEGO COMMUNITY COLLEGE DISTRICT MESA COLLEGE ASSOCIATE DEGREE COURSE OUTLINE
 MULT 130 CIC Approval: 03/12/2015 BOT APPROVAL: 04/16/2015 STATE APPROVAL: EFFECTIVE TERM: Fall 2015 SECTION I SAN DIEGO COMMUNITY COLLEGE DISTRICT MESA COLLEGE ASSOCIATE DEGREE COURSE OUTLINE SUBJECT
Visualization. For Novices. ( Ted Hall ) University of Michigan 3D Lab Digital Media Commons, Library http://um3d.dc.umich.edu
 University of Michigan 3D Lab Digital Media Commons, Library http://um3d.dc.umich.edu") Visualization For Novices ( Ted Hall ) University of Michigan 3D Lab Digital Media Commons, Library http://um3d.dc.umich.edu Data Visualization Data visualization deals with communicating information about
Visualization For Novices ( Ted Hall ) University of Michigan 3D Lab Digital Media Commons, Library http://um3d.dc.umich.edu Data Visualization Data visualization deals with communicating information about
FINANCIAL BACKING GLOBAL INTEREST A WAVE OF CONTENT ON THE WAY RETAIL VALUE
 EXCERPTEDFROM THEORI GI NAL:Seei ns i dec ov erf ordet a i l s. FINANCIAL BACKING GLOBAL INTEREST SHIPPING OUT SELLING OUT INTEREST IN THE PAST READY TO BUILD A WAVE OF CONTENT ON THE WAY RETAIL VALUE
A Conceptual Approach to Data Visualization for User Interface Design of Smart Grid Operation Tools
 A Conceptual Approach to Data Visualization for User Interface Design of Smart Grid Operation Tools Dong-Joo Kang and Sunju Park Yonsei University [email protected], [email protected] Abstract
ICS : 435. Computer Graphics Applications. Instructor : Da'ad Albalawneh
 ICS : 435 Computer Graphics Applications Instructor : Da'ad Albalawneh Course Outline Applications CAD/CAM, Art, Entertainment, Education, Training, Visualization, GUI, Image Processing. Overview of Computer
Visualizing and Analyzing Massive Astronomical Datasets with Partiview
 Visualizing and Analyzing Massive Astronomical Datasets with Partiview Brian P. Abbott 1, Carter B. Emmart 1, Stuart Levy 2, and Charles T. Liu 1 1 American Museum of Natural History & Hayden Planetarium,
Computer Aided Liver Surgery Planning Based on Augmented Reality Techniques
 Computer Aided Liver Surgery Planning Based on Augmented Reality Techniques Alexander Bornik 1, Reinhard Beichel 1, Bernhard Reitinger 1, Georg Gotschuli 2, Erich Sorantin 2, Franz Leberl 1 and Milan Sonka
Data Visualization and Exploration via Virtual Reality - An Overview
 Data Visualization and Exploration via Virtual Reality - An Overview Jürgen Symanzik* Utah State University, Logan, UT Edward J. Wegman George Mason University, Fairfax, VA *e-mail: symanzik@sunfs sunfs.math..math.usu.edu
3D Engineering Solutions from Iowa State University CTRE. Center for Transportation Research and Education
 VIRTUAL REALITY & LASER SCANNING APPLICATIONS 3D Engineering Solutions from Iowa State University Center for Transportation Research and Education Iowa State University Edward Jaselskis Associate Professor
Virtual Reality Ladder Climbing for Mine Safety Training
 Virtual Reality Ladder Climbing for Mine Safety Training Chengyuan Lai and Ryan P. McMahan Department of Computer Science, University of Texas at Dallas, Richardson, TX, USA ABSTRACT: Safety is an important
Big Data Visualization for Genomics. Luca Vezzadini Kairos3D
 Big Data Visualization for Genomics Luca Vezzadini Kairos3D Why GenomeCruzer? The amount of data for DNA sequencing is growing Modern hardware produces billions of values per sample Scientists need to
Interactive Visualization of Magnetic Fields
 JOURNAL OF APPLIED COMPUTER SCIENCE Vol. 21 No. 1 (2013), pp. 107-117 Interactive Visualization of Magnetic Fields Piotr Napieralski 1, Krzysztof Guzek 1 1 Institute of Information Technology, Lodz University
GRAPHICS PROCESSING REQUIREMENTS FOR ENABLING IMMERSIVE VR
 GRAPHICS PROCESSING REQUIREMENTS FOR ENABLING IMMERSIVE VR By David Kanter Sponsored by AMD Over the last three decades, graphics technology has evolved and revolutionized the way that people interact
REGULATIONS FOR THE DEGREE OF MASTER OF SCIENCE IN COMPUTER SCIENCE (MSc[CompSc])
![REGULATIONS FOR THE DEGREE OF MASTER OF SCIENCE IN COMPUTER SCIENCE (MSc[CompSc])](/thumbs/33/16674036.jpg "REGULATIONS FOR THE DEGREE OF MASTER OF SCIENCE IN COMPUTER SCIENCE (MSc[CompSc])") 305 REGULATIONS FOR THE DEGREE OF MASTER OF SCIENCE IN COMPUTER SCIENCE (MSc[CompSc]) (See also General Regulations) Any publication based on work approved for a higher degree should contain a reference
305 REGULATIONS FOR THE DEGREE OF MASTER OF SCIENCE IN COMPUTER SCIENCE (MSc[CompSc]) (See also General Regulations) Any publication based on work approved for a higher degree should contain a reference
IMMERSIVE 3D USER INTERFACE FOR COMPUTER ANIMATION CONTROL
 ICCVG 2002 Zakopane, 25-29 Sept. 2002 Tommi Ilmonen Helsinki University of Technology Telecommunications Software and Multimedia Laboratory [email protected] IMMERSIVE 3D USER INTERFACE FOR COMPUTER
Computer Graphics in Real World Applications
 Innovation in Theory Computer Graphics in Real World Applications scientists researchers publications patents developers at companies solutions for the real world, stable products Werner Purgathofer Institute
Data Visualization Study at Earth Simulator Center
 Chapter 4 Visualization Data Visualization Study at Earth Simulator Center Project Representative Akira Kageyama The Earth Simulator Center, Japan Agency for Marine-Earth Science and Technology Authors
How To Teach Computer Graphics
 Computer Graphics Thilo Kielmann Lecture 1: 1 Introduction (basic administrative information) Course Overview + Examples (a.o. Pixar, Blender, ) Graphics Systems Hands-on Session General Introduction http://www.cs.vu.nl/~graphics/
Course Overview. CSCI 480 Computer Graphics Lecture 1. Administrative Issues Modeling Animation Rendering OpenGL Programming [Angel Ch.
 CSCI 480 Computer Graphics Lecture 1 Course Overview January 14, 2013 Jernej Barbic University of Southern California http://www-bcf.usc.edu/~jbarbic/cs480-s13/ Administrative Issues Modeling Animation