A PARADIGM FOR DEVELOPING BETTER MEASURES OF MARKETING CONSTRUCTS
|
|
|
- Anthony Norman
- 10 years ago
- Views:
Transcription
1 A PARADIGM FOR DEVELOPING BETTER MEASURES OF MARKETING CONSTRUCTS Gilber A. Churchill (1979) Introduced by Azra Dedic in the course of Measurement in Business Research

2 Introduction 2 Measurements are rules for assigning numbers to objects to represent qualities of attributes. What is measured? ATTRIBUTES of objects. NOT objects themselves. What is the goal? To have measures that are RELIABLE and VALID

3 Construct 3 Construct, e.g. customer satisfaction True level of satisfaction (True score) denoted Xt Observed score X0, rarely similar to Xt due to differences in stable characteristics, transient personal factors, situational factors etc.

4 Validity and Reliability 4 X0 = Xt + Xs + Xr, where Xs systematic source of error Xr random source of error Validity: X0 = Xt Perfect reliability: Xr = 0 Validity => Reliability Reliability is necessary but not sufficient for Validity

5 Validity and Reliability (2) 5 Objective: find X0 that approximate Xt Measures are inferences, their goodness is supported by the evidence, that is based on reliability or validity index Reliability forms: split-half, test-retest etc. Validity forms: face, content, predictive, concurrent, pragmatic, construct, convergent, discriminant.

6 Procedure for developing measures 6 1. Specify domain of construct 6. Assess reliability 7. Assess validity 2. Generate sample of items 5. Collect data 8. Develop norm 3. Collect data 4. Purify measure

7 Specify domain of the construct 7 Exactly defining what is included in the definition and what is excluded Consulting the literature Widely varying definitions should be avoided Example: to measure customer satisfaction Measure both expectations at the time of purchase and reactions at some time after the purchase Expectations: cost, durability, quality, operating performance, aesthetic features, sales assistance, advertising, availability of competitor s alternatives,

8 Generate sample of items 8 Literature searches Experience surveys Insight-stimulating examples Critical incidents and focus groups

9 Purify the measure 9 Domain sampling model: purpose of any particular measurement is to estimate the score that would be obtained if all the items in the domain were used In practice use of SAMPLE of items Measurement error due to inadequate sampling Correlation matrix of the items in the domain Average correlation in the matrix Dispersion of the correlation about the average Assumption: all items, if they belong to the domain of the concept, have an equal amount of common core

10 Coefficient Alpha 10 Measure of internal consistency of a set of items Low coefficient alpha indicates that the sample of items badly describes the construct which motivated the measure Procedure by low alpha: some items should be eliminated. Calculate correlation of each item with total score Plot the correlations by decreasing order of magnitude Items with correlations near zero should be eliminated Items of substantial drop in the item-to-total correlations also deleted Mistake to do split-half reliability

11 Purify the measure (2) 11 Desirable outcome: high coefficient alpha, dimensions agree with the conceptualized. Then, additional testing with a new sample of data. Second outcome: Factor analysis suggests the overlapping dimensions. Items with pure loadings on the new factor are retained, new alpha calculated. Non-desirable outcome: alpha coefficient is low and restructuring of items forming each dimension is unproductive. Loop back to 1. and 2.

12 Procedure for developing measures Specify domain of construct 6. Assess reliability 7. Assess validity 2. Generate sample of items 5. Collect data 8. Develop norm 3. Collect data 4. Purify measure

13 Assess reliability with new data 13 Source of error within a test or measure is the sampling of items. Coefficient alpha is the basic statistic for determining the reliability of a measure based on internal consistency, but it does not estimate errors external to the instrument. Collect additional data to rule our the chance possibility of previous findings Do not use test-retest reliability

14 Assess Construct Validity 14 Face or content valid measure has an appropriate sample To establish construct validity Determine the extent to which the measure correlates with other measures designed to measure the same thing Determine whether the measure behaves as expected

15 Correlations with Other Measures 15 Any construct or trait should be measurable by at least two different methods Convergent validity extent to which it correlates highly with other methods designed to measure the same construct Discriminant validity the extent to which a measure a novel Multitrait-multimethod matrix: methods and traits generating it should be as independent as possible


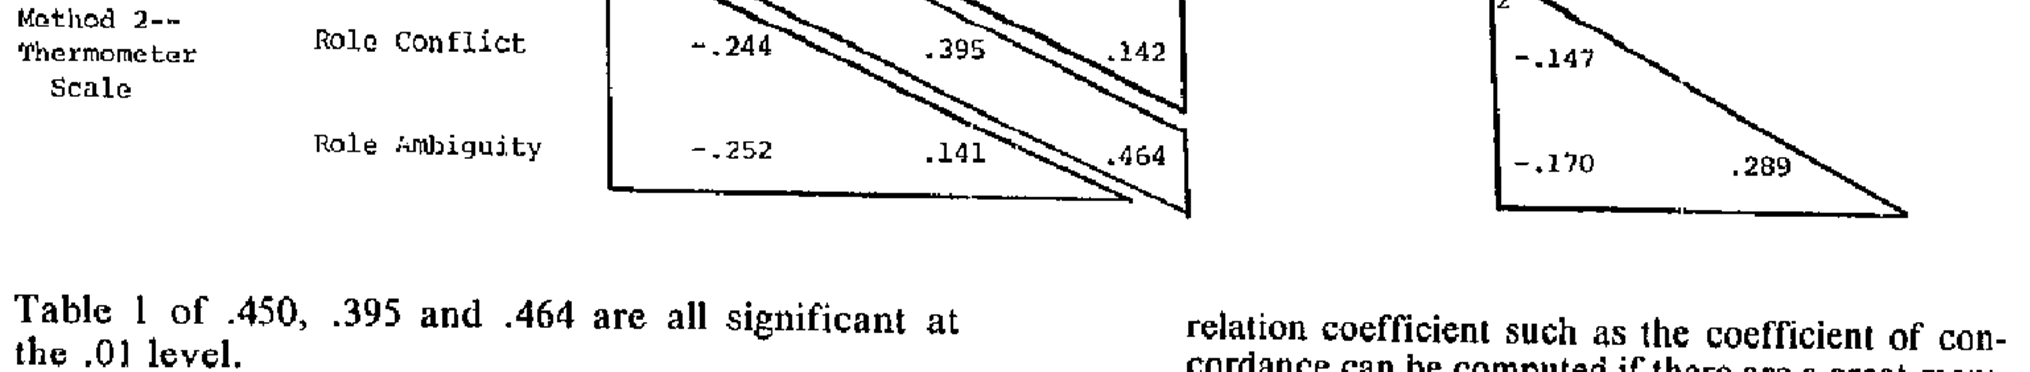
16 Multitrait-multimethod matrix 16

17 Does the measure behave as expected? 17 Internal consistency is insufficient condition for construct validity Assess whether scale correctly predicts criterion measure (criterion validity) The constructs job satisfaction (A) and likelihood of quitting the job (B) are related. The scale X provides a measure of A. Y provides a measure of B. X and Y correlate positively. Establish the validity by relating the measure to a number of other constructs and not only one

18 Procedure for developing measures Specify domain of construct 6. Assess reliability 7. Assess validity 2. Generate sample of items 5. Collect data 8. Develop norm 3. Collect data 4. Purify measure

19 Developing Norms 19 Assessing the position of the individual on the characteristic is to compare the person s score with the scores achieved by other people Norm quality depends on both the number of cases on which the average is based and their representativeness

RESEARCH METHODS IN I/O PSYCHOLOGY
 RESEARCH METHODS IN I/O PSYCHOLOGY Objectives Understand Empirical Research Cycle Knowledge of Research Methods Conceptual Understanding of Basic Statistics PSYC 353 11A rsch methods 01/17/11 [Arthur]
RESEARCH METHODS IN I/O PSYCHOLOGY
 RESEARCH METHODS IN I/O PSYCHOLOGY Objectives Understand Empirical Research Cycle Knowledge of Research Methods Conceptual Understanding of Basic Statistics PSYC 353 11A rsch methods 09/01/11 [Arthur]
X = T + E. Reliability. Reliability. Classical Test Theory 7/18/2012. Refers to the consistency or stability of scores
 Reliability It is the user who must take responsibility for determining whether or not scores are sufficiently trustworthy to justify anticipated uses and interpretations. (AERA et al., 1999) Reliability
Glossary of Terms Ability Accommodation Adjusted validity/reliability coefficient Alternate forms Analysis of work Assessment Battery Bias
 Glossary of Terms Ability A defined domain of cognitive, perceptual, psychomotor, or physical functioning. Accommodation A change in the content, format, and/or administration of a selection procedure
Correlational Research
 Correlational Research Chapter Fifteen Correlational Research Chapter Fifteen Bring folder of readings The Nature of Correlational Research Correlational Research is also known as Associational Research.
Validity and Reliability in Social Science Research
 Education Research and Perspectives, Vol.38, No.1 Validity and Reliability in Social Science Research Ellen A. Drost California State University, Los Angeles Concepts of reliability and validity in social
Test Reliability Indicates More than Just Consistency
 Assessment Brief 015.03 Test Indicates More than Just Consistency by Dr. Timothy Vansickle April 015 Introduction is the extent to which an experiment, test, or measuring procedure yields the same results
CLUSTER ANALYSIS FOR SEGMENTATION
 CLUSTER ANALYSIS FOR SEGMENTATION Introduction We all understand that consumers are not all alike. This provides a challenge for the development and marketing of profitable products and services. Not every
Concepts in Investments Risks and Returns (Relevant to PBE Paper II Management Accounting and Finance)
") Concepts in Investments Risks and Returns (Relevant to PBE Paper II Management Accounting and Finance) Mr. Eric Y.W. Leung, CUHK Business School, The Chinese University of Hong Kong In PBE Paper II, students
Concepts in Investments Risks and Returns (Relevant to PBE Paper II Management Accounting and Finance) Mr. Eric Y.W. Leung, CUHK Business School, The Chinese University of Hong Kong In PBE Paper II, students
a. Will the measure employed repeatedly on the same individuals yield similar results? (stability)
") INTRODUCTION Sociologist James A. Quinn states that the tasks of scientific method are related directly or indirectly to the study of similarities of various kinds of objects or events. One of the tasks
INTRODUCTION Sociologist James A. Quinn states that the tasks of scientific method are related directly or indirectly to the study of similarities of various kinds of objects or events. One of the tasks
WHAT IS A JOURNAL CLUB?
 WHAT IS A JOURNAL CLUB? With its September 2002 issue, the American Journal of Critical Care debuts a new feature, the AJCC Journal Club. Each issue of the journal will now feature an AJCC Journal Club
Benchmark Assessment in Standards-Based Education:
 Research Paper Benchmark Assessment in : The Galileo K-12 Online Educational Management System by John Richard Bergan, Ph.D. John Robert Bergan, Ph.D. and Christine Guerrera Burnham, Ph.D. Submitted by:
Simple Linear Regression Inference
 Simple Linear Regression Inference 1 Inference requirements The Normality assumption of the stochastic term e is needed for inference even if it is not a OLS requirement. Therefore we have: Interpretation
Fixed-Effect Versus Random-Effects Models
 CHAPTER 13 Fixed-Effect Versus Random-Effects Models Introduction Definition of a summary effect Estimating the summary effect Extreme effect size in a large study or a small study Confidence interval
Exploring Graduates Perceptions of the Quality of Higher Education
 Exploring Graduates Perceptions of the Quality of Higher Education Adee Athiyainan and Bernie O Donnell Abstract Over the last decade, higher education institutions in Australia have become increasingly
Assessment, Case Conceptualization, Diagnosis, and Treatment Planning Overview
 Assessment, Case Conceptualization, Diagnosis, and Treatment Planning Overview The abilities to gather and interpret information, apply counseling and developmental theories, understand diagnostic frameworks,
Marketing Mix Modelling and Big Data P. M Cain
 1) Introduction Marketing Mix Modelling and Big Data P. M Cain Big data is generally defined in terms of the volume and variety of structured and unstructured information. Whereas structured data is stored
White House 806 West Franklin Street P.O. Box 842018 Richmond, Virginia 23284-2018
 Monroe Campus Department of Psychology White House 806 West Franklin Street P.O. Box 842018 Richmond, Virginia 23284-2018 804 828-6754 Fax: 804 828-2237 TDD: 1-800-828-1120 Dear Colleague, The trait Mindful
Chapter 3 Psychometrics: Reliability & Validity
 Chapter 3 Psychometrics: Reliability & Validity 45 Chapter 3 Psychometrics: Reliability & Validity The purpose of classroom assessment in a physical, virtual, or blended classroom is to measure (i.e.,
Measurement: Reliability and Validity
 Measurement: Reliability and Validity Y520 Strategies for Educational Inquiry Robert S Michael Reliability & Validity-1 Introduction: Reliability & Validity All measurements, especially measurements of
17. SIMPLE LINEAR REGRESSION II
 17. SIMPLE LINEAR REGRESSION II The Model In linear regression analysis, we assume that the relationship between X and Y is linear. This does not mean, however, that Y can be perfectly predicted from X.
MULTIPLE REGRESSION AND ISSUES IN REGRESSION ANALYSIS
 MULTIPLE REGRESSION AND ISSUES IN REGRESSION ANALYSIS MSR = Mean Regression Sum of Squares MSE = Mean Squared Error RSS = Regression Sum of Squares SSE = Sum of Squared Errors/Residuals α = Level of Significance
Introduction to industrial/organizational psychology
 Introduction to industrial/organizational psychology Chapter 1 Industrial/Organizational Psychology: A branch of psychology that applies the principles of psychology to the workplace I/O psychologists
Measurement: Reliability and Validity Measures. Jonathan Weiner, DrPH Johns Hopkins University
 This work is licensed under a Creative Commons Attribution-NonCommercial-ShareAlike License. Your use of this material constitutes acceptance of that license and the conditions of use of materials on this
Chapter 8 Hypothesis Testing Chapter 8 Hypothesis Testing 8-1 Overview 8-2 Basics of Hypothesis Testing
 Chapter 8 Hypothesis Testing 1 Chapter 8 Hypothesis Testing 8-1 Overview 8-2 Basics of Hypothesis Testing 8-3 Testing a Claim About a Proportion 8-5 Testing a Claim About a Mean: s Not Known 8-6 Testing
Chapter 9 Experience rating
 0 INTRODUCTION 1 Chapter 9 Experience rating 0 Introduction The rating process is the process of deciding on an appropriate level of premium for a particular class of insurance business. The contents of
Vector Spaces; the Space R n
 Vector Spaces; the Space R n Vector Spaces A vector space (over the real numbers) is a set V of mathematical entities, called vectors, U, V, W, etc, in which an addition operation + is defined and in which
http://www.jstor.org This content downloaded on Tue, 19 Feb 2013 17:28:43 PM All use subject to JSTOR Terms and Conditions
 A Significance Test for Time Series Analysis Author(s): W. Allen Wallis and Geoffrey H. Moore Reviewed work(s): Source: Journal of the American Statistical Association, Vol. 36, No. 215 (Sep., 1941), pp.
II. DISTRIBUTIONS distribution normal distribution. standard scores
 Appendix D Basic Measurement And Statistics The following information was developed by Steven Rothke, PhD, Department of Psychology, Rehabilitation Institute of Chicago (RIC) and expanded by Mary F. Schmidt,
HYPOTHESIS TESTING: CONFIDENCE INTERVALS, T-TESTS, ANOVAS, AND REGRESSION
 HYPOTHESIS TESTING: CONFIDENCE INTERVALS, T-TESTS, ANOVAS, AND REGRESSION HOD 2990 10 November 2010 Lecture Background This is a lightning speed summary of introductory statistical methods for senior undergraduate
Overview of Factor Analysis
 Overview of Factor Analysis Jamie DeCoster Department of Psychology University of Alabama 348 Gordon Palmer Hall Box 870348 Tuscaloosa, AL 35487-0348 Phone: (205) 348-4431 Fax: (205) 348-8648 August 1,
English Summary 1. cognitively-loaded test and a non-cognitive test, the latter often comprised of the five-factor model of
 English Summary 1 Both cognitive and non-cognitive predictors are important with regard to predicting performance. Testing to select students in higher education or personnel in organizations is often
Capital budgeting & risk
 Capital budgeting & risk A reading prepared by Pamela Peterson Drake O U T L I N E 1. Introduction 2. Measurement of project risk 3. Incorporating risk in the capital budgeting decision 4. Assessment of
Sample Size and Power in Clinical Trials
 Sample Size and Power in Clinical Trials Version 1.0 May 011 1. Power of a Test. Factors affecting Power 3. Required Sample Size RELATED ISSUES 1. Effect Size. Test Statistics 3. Variation 4. Significance
PATTERN RECOGNITION AND MACHINE LEARNING CHAPTER 4: LINEAR MODELS FOR CLASSIFICATION
 PATTERN RECOGNITION AND MACHINE LEARNING CHAPTER 4: LINEAR MODELS FOR CLASSIFICATION Introduction In the previous chapter, we explored a class of regression models having particularly simple analytical
ECE 333: Introduction to Communication Networks Fall 2002
 ECE 333: Introduction to Communication Networks Fall 2002 Lecture 14: Medium Access Control II Dynamic Channel Allocation Pure Aloha In the last lecture we began discussing medium access control protocols
CCNY. BME I5100: Biomedical Signal Processing. Linear Discrimination. Lucas C. Parra Biomedical Engineering Department City College of New York
 BME I5100: Biomedical Signal Processing Linear Discrimination Lucas C. Parra Biomedical Engineering Department CCNY 1 Schedule Week 1: Introduction Linear, stationary, normal - the stuff biology is not
Indices of Model Fit STRUCTURAL EQUATION MODELING 2013
 Indices of Model Fit STRUCTURAL EQUATION MODELING 2013 Indices of Model Fit A recommended minimal set of fit indices that should be reported and interpreted when reporting the results of SEM analyses:
THE ACT INTEREST INVENTORY AND THE WORLD-OF-WORK MAP
 THE ACT INTEREST INVENTORY AND THE WORLD-OF-WORK MAP Contents The ACT Interest Inventory........................................ 3 The World-of-Work Map......................................... 8 Summary.....................................................
Statistics, Research, & SPSS: The Basics
 Statistics, Research, & SPSS: The Basics SPSS (Statistical Package for the Social Sciences) is a software program that makes the calculation and presentation of statistics relatively easy. It is an incredibly
College Readiness LINKING STUDY
 College Readiness LINKING STUDY A Study of the Alignment of the RIT Scales of NWEA s MAP Assessments with the College Readiness Benchmarks of EXPLORE, PLAN, and ACT December 2011 (updated January 17, 2012)
Example: Credit card default, we may be more interested in predicting the probabilty of a default than classifying individuals as default or not.
 Statistical Learning: Chapter 4 Classification 4.1 Introduction Supervised learning with a categorical (Qualitative) response Notation: - Feature vector X, - qualitative response Y, taking values in C
Machine Learning in Statistical Arbitrage
 Machine Learning in Statistical Arbitrage Xing Fu, Avinash Patra December 11, 2009 Abstract We apply machine learning methods to obtain an index arbitrage strategy. In particular, we employ linear regression
Quantitative Research: Reliability and Validity
 Quantitative Research: Reliability and Validity Reliability Definition: Reliability is the consistency of your measurement, or the degree to which an instrument measures the same way each time it is used
Organizational Factors Affecting E-commerce Adoption in Small and Medium-sized Enterprises
 Tropical Agricultural Research Vol. 22 (2): 204-210 (2011) Short communication Organizational Factors Affecting E-commerce Adoption in Small and Medium-sized Enterprises R.P.I.R. Senarathna and H.V.A.
You buy a TV for $1000 and pay it off with $100 every week. The table below shows the amount of money you sll owe every week. Week 1 2 3 4 5 6 7 8 9
 Warm Up: You buy a TV for $1000 and pay it off with $100 every week. The table below shows the amount of money you sll owe every week Week 1 2 3 4 5 6 7 8 9 Money Owed 900 800 700 600 500 400 300 200 100
Chapter 6: The Information Function 129. CHAPTER 7 Test Calibration
 Chapter 6: The Information Function 129 CHAPTER 7 Test Calibration 130 Chapter 7: Test Calibration CHAPTER 7 Test Calibration For didactic purposes, all of the preceding chapters have assumed that the
COMPARISONS OF CUSTOMER LOYALTY: PUBLIC & PRIVATE INSURANCE COMPANIES.
 277 CHAPTER VI COMPARISONS OF CUSTOMER LOYALTY: PUBLIC & PRIVATE INSURANCE COMPANIES. This chapter contains a full discussion of customer loyalty comparisons between private and public insurance companies
One of the serious problems being faced by every society today is drug
 One of the serious problems being faced by every society today is drug abuse. The incidence of drug abuse has almost doubled during the last two decades and is a matter of deep concern as the age of initiation
Statistical Machine Learning
 Statistical Machine Learning UoC Stats 37700, Winter quarter Lecture 4: classical linear and quadratic discriminants. 1 / 25 Linear separation For two classes in R d : simple idea: separate the classes
Technical Information
 Technical Information Trials The questions for Progress Test in English (PTE) were developed by English subject experts at the National Foundation for Educational Research. For each test level of the paper
1/27/2013. PSY 512: Advanced Statistics for Psychological and Behavioral Research 2
 PSY 512: Advanced Statistics for Psychological and Behavioral Research 2 Introduce moderated multiple regression Continuous predictor continuous predictor Continuous predictor categorical predictor Understand
Chapter 4: Vector Autoregressive Models
 Chapter 4: Vector Autoregressive Models 1 Contents: Lehrstuhl für Department Empirische of Wirtschaftsforschung Empirical Research and und Econometrics Ökonometrie IV.1 Vector Autoregressive Models (VAR)...
CHAPTER 8 FACTOR EXTRACTION BY MATRIX FACTORING TECHNIQUES. From Exploratory Factor Analysis Ledyard R Tucker and Robert C.
 CHAPTER 8 FACTOR EXTRACTION BY MATRIX FACTORING TECHNIQUES From Exploratory Factor Analysis Ledyard R Tucker and Robert C MacCallum 1997 180 CHAPTER 8 FACTOR EXTRACTION BY MATRIX FACTORING TECHNIQUES In
User Manual for the COPING STRATEGIES INVENTORY
 User Manual for the COPING STRATEGIES INVENTORY David L. Tobin 1984, 2001 2 Scale Format The Coping Strategies Inventory is a 72-item self-report questionnaire designed to assess coping thoughts and behaviors
Measurement and Metrics Fundamentals. SE 350 Software Process & Product Quality
 Measurement and Metrics Fundamentals Lecture Objectives Provide some basic concepts of metrics Quality attribute metrics and measurements Reliability, validity, error Correlation and causation Discuss
Instrument Validation Study. Regarding Leadership Circle Profile. By Industrial Psychology Department. Bowling Green State University
 Instrument ValidationStudy RegardingLeadershipCircleProfile ByIndustrialPsychologyDepartment BowlingGreenStateUniversity InstrumentValidationStudy ExecutiveSummaryandResponsetotheRecommendations ThefollowingvaliditystudyonTheLeadershipCircleProfile(TLCP)isanindependentstudy.It
MISSING DATA TECHNIQUES WITH SAS. IDRE Statistical Consulting Group
 MISSING DATA TECHNIQUES WITH SAS IDRE Statistical Consulting Group ROAD MAP FOR TODAY To discuss: 1. Commonly used techniques for handling missing data, focusing on multiple imputation 2. Issues that could
CORRELATIONAL ANALYSIS: PEARSON S r Purpose of correlational analysis The purpose of performing a correlational analysis: To discover whether there
 CORRELATIONAL ANALYSIS: PEARSON S r Purpose of correlational analysis The purpose of performing a correlational analysis: To discover whether there is a relationship between variables, To find out the
Linear Classification. Volker Tresp Summer 2015
 Linear Classification Volker Tresp Summer 2015 1 Classification Classification is the central task of pattern recognition Sensors supply information about an object: to which class do the object belong
NCSS Statistical Software Principal Components Regression. In ordinary least squares, the regression coefficients are estimated using the formula ( )
") Chapter 340 Principal Components Regression Introduction is a technique for analyzing multiple regression data that suffer from multicollinearity. When multicollinearity occurs, least squares estimates
Chapter 340 Principal Components Regression Introduction is a technique for analyzing multiple regression data that suffer from multicollinearity. When multicollinearity occurs, least squares estimates
How Much Equity Does the Government Hold?
 How Much Equity Does the Government Hold? Alan J. Auerbach University of California, Berkeley and NBER January 2004 This paper was presented at the 2004 Meetings of the American Economic Association. I
TF-IDF. David Kauchak cs160 Fall 2009 adapted from: http://www.stanford.edu/class/cs276/handouts/lecture6-tfidf.ppt
 TF-IDF David Kauchak cs160 Fall 2009 adapted from: http://www.stanford.edu/class/cs276/handouts/lecture6-tfidf.ppt Administrative Homework 3 available soon Assignment 2 available soon Popular media article
Paper No 19. FINALTERM EXAMINATION Fall 2009 MTH302- Business Mathematics & Statistics (Session - 2) Ref No: Time: 120 min Marks: 80
 Ref No: Time: 120 min Marks: 80") Paper No 19 FINALTERM EXAMINATION Fall 2009 MTH302- Business Mathematics & Statistics (Session - 2) Ref No: Time: 120 min Marks: 80 Question No: 1 ( Marks: 1 ) - Please choose one Scatterplots are used
Paper No 19 FINALTERM EXAMINATION Fall 2009 MTH302- Business Mathematics & Statistics (Session - 2) Ref No: Time: 120 min Marks: 80 Question No: 1 ( Marks: 1 ) - Please choose one Scatterplots are used
Analysis of Bayesian Dynamic Linear Models
 Analysis of Bayesian Dynamic Linear Models Emily M. Casleton December 17, 2010 1 Introduction The main purpose of this project is to explore the Bayesian analysis of Dynamic Linear Models (DLMs). The main
15.401 Finance Theory
 Finance Theory MIT Sloan MBA Program Andrew W. Lo Harris & Harris Group Professor, MIT Sloan School Lecture 13 14 14: : Risk Analytics and Critical Concepts Motivation Measuring Risk and Reward Mean-Variance
How to Win the Stock Market Game
 How to Win the Stock Market Game 1 Developing Short-Term Stock Trading Strategies by Vladimir Daragan PART 1 Table of Contents 1. Introduction 2. Comparison of trading strategies 3. Return per trade 4.
Reliability and validity, the topics of this and the next chapter, are twins and
 Research Skills for Psychology Majors: Everything You Need to Know to Get Started Reliability Reliability and validity, the topics of this and the next chapter, are twins and cannot be completely separated.
Mehtap Ergüven Abstract of Ph.D. Dissertation for the degree of PhD of Engineering in Informatics
 INTERNATIONAL BLACK SEA UNIVERSITY COMPUTER TECHNOLOGIES AND ENGINEERING FACULTY ELABORATION OF AN ALGORITHM OF DETECTING TESTS DIMENSIONALITY Mehtap Ergüven Abstract of Ph.D. Dissertation for the degree
This chapter will demonstrate how to perform multiple linear regression with IBM SPSS
 CHAPTER 7B Multiple Regression: Statistical Methods Using IBM SPSS This chapter will demonstrate how to perform multiple linear regression with IBM SPSS first using the standard method and then using the
Tutorial 5: Hypothesis Testing
 Tutorial 5: Hypothesis Testing Rob Nicholls [email protected] MRC LMB Statistics Course 2014 Contents 1 Introduction................................ 1 2 Testing distributional assumptions....................
STRONG INTEREST INVENTORY ASSESSMENT
 Technical Brief for the Newly Revised STRONG INTEREST INVENTORY ASSESSMENT Content, Reliability, and Validity David A.C. Donnay Richard C. Thompson Mike L. Morris Nancy A. Schaubhut 1055 Joaquin Road,
FACTOR ANALYSIS NASC
 FACTOR ANALYSIS NASC Factor Analysis A data reduction technique designed to represent a wide range of attributes on a smaller number of dimensions. Aim is to identify groups of variables which are relatively
Missing Data. Katyn & Elena
 Missing Data Katyn & Elena What to do with Missing Data Standard is complete case analysis/listwise dele;on ie. Delete cases with missing data so only complete cases are le> Two other popular op;ons: Mul;ple
Development of an Evaluation Model for Question Answering Systems
 Development of an Evaluation Model for Question Answering Systems Chorng-Shyong Ong 1, Min-Yuh Day 1, 2, and Wen-Lian Hsu 2, Fellow, IEEE 1 Department of Information Management, National Taiwan University,
Environmental Remote Sensing GEOG 2021
 Environmental Remote Sensing GEOG 2021 Lecture 4 Image classification 2 Purpose categorising data data abstraction / simplification data interpretation mapping for land cover mapping use land cover class
Financial Assets Behaving Badly The Case of High Yield Bonds. Chris Kantos Newport Seminar June 2013
 Financial Assets Behaving Badly The Case of High Yield Bonds Chris Kantos Newport Seminar June 2013 Main Concepts for Today The most common metric of financial asset risk is the volatility or standard
Older People s Quality of Life Questionnaire (OPQOL) summed scoring and reverse coding:
 summed scoring and reverse coding:") Older People s Quality of Life Questionnaire (OPQOL) summed scoring and reverse coding: OPQOL items coded 1-5; scoring = reverse coding of positive items; sum sub-scales names as marked in table headers;
Older People s Quality of Life Questionnaire (OPQOL) summed scoring and reverse coding: OPQOL items coded 1-5; scoring = reverse coding of positive items; sum sub-scales names as marked in table headers;
Glossary of Testing, Measurement, and Statistical Terms
 Glossary of Testing, Measurement, and Statistical Terms 425 Spring Lake Drive Itasca, IL 60143 www.riversidepublishing.com Glossary of Testing, Measurement, and Statistical Terms Ability - A characteristic
Validation of Internal Rating and Scoring Models
 Validation of Internal Rating and Scoring Models Dr. Leif Boegelein Global Financial Services Risk Management [email protected] 07.09.2005 2005 EYGM Limited. All Rights Reserved. Agenda 1. Motivation
CORRELATED TO THE SOUTH CAROLINA COLLEGE AND CAREER-READY FOUNDATIONS IN ALGEBRA
 We Can Early Learning Curriculum PreK Grades 8 12 INSIDE ALGEBRA, GRADES 8 12 CORRELATED TO THE SOUTH CAROLINA COLLEGE AND CAREER-READY FOUNDATIONS IN ALGEBRA April 2016 www.voyagersopris.com Mathematical
5. Multiple regression
 5. Multiple regression QBUS6840 Predictive Analytics https://www.otexts.org/fpp/5 QBUS6840 Predictive Analytics 5. Multiple regression 2/39 Outline Introduction to multiple linear regression Some useful
AN ANALYSIS OF FOOD SAFETY MANAGEMENT SYSTEMS CERTIFICATION: THE PORTUGUESE CASE
 AN ANALYSIS OF FOOD SAFETY MANAGEMENT SYSTEMS CERTIFICATION: THE PORTUGUESE CASE Sofia Teixeira, MSc Student, University of Porto, [email protected] Paulo Sampaio, University of Minho, [email protected]
STATISTICA Formula Guide: Logistic Regression. Table of Contents
 : Table of Contents... 1 Overview of Model... 1 Dispersion... 2 Parameterization... 3 Sigma-Restricted Model... 3 Overparameterized Model... 4 Reference Coding... 4 Model Summary (Summary Tab)... 5 Summary
True Score Theory Measurement Error Theory of Reliability Types of Reliability Reliability & Validity
 Reliability [ Home ] [ Construct Validity ] [ Reliability ] [ Levels of Measurement ] [ Survey Research ] [ Scaling ] [ Qualitative Measures ] [ Unobtrusive Measures ] True Score Theory Measurement Error
Time Series Analysis
 JUNE 2012 Time Series Analysis CONTENT A time series is a chronological sequence of observations on a particular variable. Usually the observations are taken at regular intervals (days, months, years),
Statistics. Measurement. Scales of Measurement 7/18/2012
 Statistics Measurement Measurement is defined as a set of rules for assigning numbers to represent objects, traits, attributes, or behaviors A variableis something that varies (eye color), a constant does
1 Portfolio mean and variance
 Copyright c 2005 by Karl Sigman Portfolio mean and variance Here we study the performance of a one-period investment X 0 > 0 (dollars) shared among several different assets. Our criterion for measuring
APPLIED MISSING DATA ANALYSIS
 APPLIED MISSING DATA ANALYSIS Craig K. Enders Series Editor's Note by Todd D. little THE GUILFORD PRESS New York London Contents 1 An Introduction to Missing Data 1 1.1 Introduction 1 1.2 Chapter Overview
Correlation. What Is Correlation? Perfect Correlation. Perfect Correlation. Greg C Elvers
 Correlation Greg C Elvers What Is Correlation? Correlation is a descriptive statistic that tells you if two variables are related to each other E.g. Is your related to how much you study? When two variables