The Final Four Formula: A Binary Choice Logit Model to Predict the Semi-Finalists of the NCAA Division I Men s Basketball Tournament
|
|
|
- Lesley Reeves
- 8 years ago
- Views:
Transcription
1 The Final Four Formula: A Binary Choice Logit Model to Predict the Semi-Finalists of the NCAA Division I Men s Basketball Tournament Cameron Fuqua * ABSTRACT. The NCAA Division I men s basketball tournament is one of the most popular sporting events in America. This paper dissects the tournament and attempts to accurately predict the four semi-finalists ( the final four ) using a binary choice logit model. The model does better than any current rating system at predicting these four teams. This paper also examines some common issues about predicting college basketball as a whole. Overall, this paper provides a insights for selection committees, participants in office pools, and coaches to help them achieve their own individual goals. I. Introduction This year Warren Buffet offered 1 billion dollars if someone correctly predicted all 63 games of the NCAA Division I Men s basketball tournament, affectionately known as March Madness. That sounds pretty good, but most estimates put the probability of predicting a perfect bracket at 1 in 128 billion (Woodruff 2012). A 2012 article in Business Insider estimates that 80 to 90 million dollars are gambled legally every year for March Madness. This ranks second to the Superbowl in terms of betting on sporting events (Woodruff 2012). Time magazine also reported the intangible cost to businesses of lost time due to employees being preoccupied with March Madness. Time estimated the cost in 2013 at $134 million, with an average worker watching 1-3 hours of college basketball during work hours in just the first two days (Sanburn 2013). While the promise of $1 billion is quite alluring, this paper does not attempt to perfectly predict the NCAA basketball tournament bracket. It attempts to determine the factors that are most important for a team to reach the semi-finals of the NCAA Division I basketball tournament by using a binomial choice logit model. *Thank you to Professor Ken Brown, Ken Pomeroy, and Professor Mark Glickman for their assistance and guidance on this paper. 31

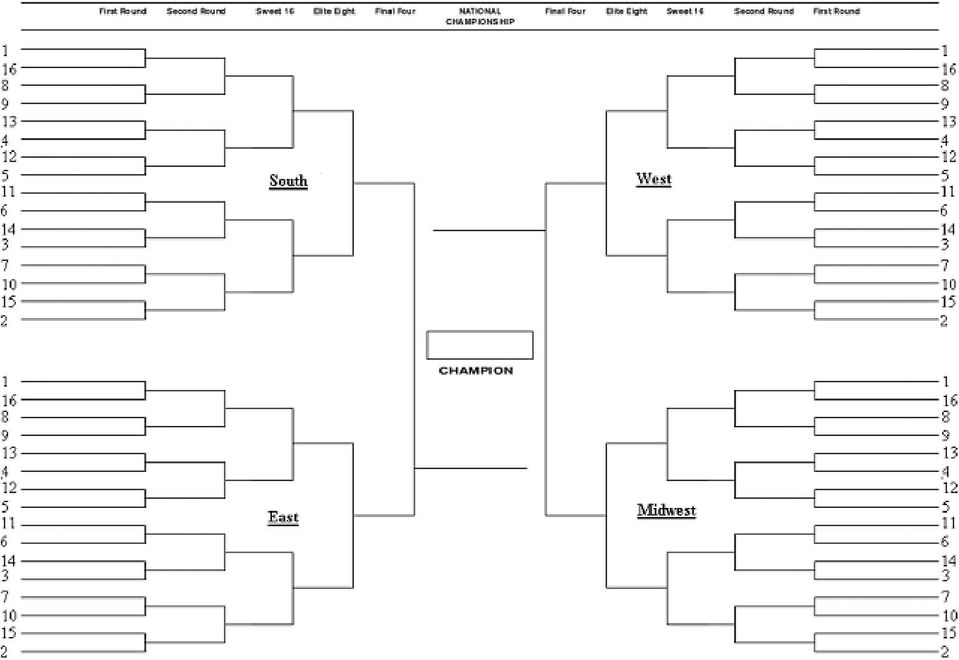
2 32 Major Themes in Economics, Spring 2014 II. The NCAA Basketball Tournament Structure Tournament Structure and Seeding The NCAA basketball tournament consists of 68 teams divided into 4 regions playing in a single elimination format. These regions are commonly labelled the Midwest, West, East, and South. Each region is set up so that the 1 seed will not face the 2 seed in its respective region until the regional finals. There are 4 play-in games called the First Four. These games consist of the four lowest seeded at-large bids, and the four lowest seeded automatic bids. The seeding and region of these play-in games vary year to year. For 2014 the four play-in games were: 11 seed Tennessee vs 11 Seed Iowa in the Midwest region, 12 Seed Xavier vs 12 Seed North Carolina State in the Midwest Region, 16 Seed Texas Southern vs 16 Seed California Polytechnic University in the Midwest Region, and 16 Seed Mount St. Mary s vs 16 Seed Albany in the South Region. Due to available data, and increased complexity this paper will ignore these games and consider them merely regular season games. The second round consists of 32 games. The third round is referred to as the regional quarterfinals and consists of 16 games. The fourth round is referred to as the Sweet Sixteen or the regional semi-finals and consists of 8 games. The fifth round is the Elite Eight, or the Regional Finals, and consists of 4 games. The winner of the Elite Eight games advance to the final four. This paper attempts to consistently predict the teams that advance to the final four better than other models.

3
4 34 Major Themes in Economics, Spring 2014 Selection Committee The NCAA Division I men s basketball tournament is controlled directly by the NCAA Division I men s basketball selection committee. This committee is comprised of 10 individuals who serve five year terms. These individuals are athletic directors and conference commissioners in Division I athletics. The NCAA attempts to have these representatives evenly distributed geographically. The primary principle of the selection committee is to ensure that fair and equitable criteria are used to select the most deserving at-large teams, while also focusing on administering a fair and equitable tournament by creating a nationally-balanced bracket comprised of the most deserving at-large teams and automatic-qualifiers chosen by conferences, while assigning institutions to sites as near to their campuses as possible (NCAA 2014). Selection Process The 68 teams must be selected prior to seeding. There are 32 automatic bids. These 32 bids are each of the individual conference tournament champions. (See Table 1) This leaves 36 teams that will receive an atlarge bid determined by the selection committee. The committee relies on strength of schedule, winning percentage, RPI (Ratings Percentage Index, a measure of a team s overall quality), and several subjective factors to properly seed teams (NCAA 2014). TABLE 1 NCAA Division I Basketball Conferences Major Conference Mid-Major Conference Small Conference Atlantic Coast American Athletic America East Big 12 Atlantic 10 Atlantic Sun Big East Colonial Big Sky Big 10 Conference USA Big South Pacific-12 Horizon League Big West Southeastern Mid-American Ivy League 1 Missouri Valley Metro Atlantic Mountain West Mid-Eastern West Coast Northeast Western Ohio Valley Patriot League Southland Southwestern Sun Belt Summit League 1 The Ivy League does not have a conference tournament; the regular season champion earns an automatic bid.

5 Fuqua: The Final Four Formula 35 Seeding The selection committee has three goals when seeding teams; it aims to have all four regions evenly balanced, it aims to reduce travel costs for higher-seeded teams, and it aims to limit the possibility of regular season rematches. Attempting to fulfill all three of these criteria often creates tradeoffs in seeding. The selection committee first ranks the teams from 1 to 68, with 1 being the best and 68 being the worst. This is called true seeding. After seeding teams 1-68, the committee attempts to place teams on an S-curve. This is so each region will be equally balanced. For example the region with the best one seed will have the worst 4 seed. While this is a starting point for the selection committee it does not always hold true. Occasionally, travel expenses, avoiding in-conference matchups and other subjective factors may play a role in seeding teams (NCAA 2014). III. Who Cares? There are several useful applications of a predictive NCAA basketball tournament model. The three primary uses are improving seeding efficiency, improving bracket selections for better success in general office pools, and improving a coach s knowledge about what style of basketball increases the chance of tournament success. Inefficient Seeding If the NCAA tournament were efficiently seeded, then the final four would always have the highest seeded team from each region (all one seeds). Only once in the history of the tournament have all four number one seeds reached the final four (2008). If all four number one seeds reach the final four the sum of these seeds would be four ( ). Over the past eight years the sum of the seeds of the final four has averaged This is far above a perfectly efficient bracket. Second, if a bracket were seeded efficiently, there would be zero upsets. Due to the nature of sports and college basketball it is not likely to have a tournament with zero upsets. While there is no standard number of upsets that is considered acceptable, there are some startling statistics about upsets in the NCAA tournament over the past eight years that may point towards inefficient seeding. On average there are 8.6 second round

6 36 Major Themes in Economics, Spring 2014 upsets. That means 26.9 percent of the time the lower seed wins. Over the second, third, fourth, and fifth rounds in the past eight years, the lower seed won 140 times (29%). Most startling is that in the fifth round alone, the lower seed has won percent of the time. While there may not be a rule of thumb to the number of acceptable upsets these figures appear to be high. Office Pools The primary purpose of this paper is not to correctly predict all 63 NCAA games of the tournament. But this paper can be a foundation when filling out brackets for an office pool. This paper attempts to determine what statistics are most important to a team s probability of reaching the final four. In most office pools, correctly predicting a final four team is very valuable and the person who correctly predicts the most final four teams will usually win. Style of Play Except for 2010, Duke has been performing relatively poorly in the NCAA tournament. In 2012 as a two seed it lost to fifteen-seeded Lehigh (one of only six times a 15 seed has beaten a 2 seed). In 2011 and 2006 as a one seed Duke made the sweet sixteen only to lose to fifth-seed Arizona and fourth-seed LSU respectively. In 2008 as a two seed Duke lost to seventh-seeded West Virginia in only the second round. In 2007 Duke lost in the first round as a six seed to eleventh seeded Virginia Commonwealth. Why has a school with four national championships, a winning percentage in the tournament of 75%, and 15 final-four appearances been underperforming in the past 8 years? One possible explanation may be a lack of rebounding prowess. Except for 2010 when Duke won the national championship, it has been 5th, 45th, 12th, 21st, 31st, 26th, and 5th worst in rebounding rate for the tournament years 2006, 2007, 2008, 2009, 2011, 2012, and 2013 respectively. Duke has been in the bottom half of the tournament teams in rebounding in six of the past eight years. Duke has also struggled in the past 8 year in defensive efficiency. It has ranked 16th, 15th, 16th, 29th, 28th, 12th, 42nd, and 23rd in allowing the most points per 100 possessions among tournament teams from 2006

7 Fuqua: The Final Four Formula 37 through This is far below the level needed for tournament success. Focusing on a high scoring, volume shooting, non-defensive, nonrebounding style of basketball has not seemed to benefit Duke in recent years and may be one of the reasons for its recent lack of success. This paper provides statistical backing to this claim, and may provide insight for college coaches on which style of basketball is best suited for tournament success. IV. Current Literature Despite the current popularity of predicting the outcome of sports and the effort to create an ultimate predictive statistic, there has been very little academic research published on the topic. The research that does exist seems to focus on professional sports, primarily baseball. There are very few published articles on predicting the NCAA tournament. This may be because people who have found credible results may not want to publish their results and instead use them for their own personal good. Also, there may not be any significant results produced due to a lack of available data. There are primarily two approaches to predict the NCAA tournaments. One is through a capture-all statistic such as Ratings Percentage Index, Basketball Power Index, KenPom ratings, and Jeff Sagarin s strength rating. The second is through limited published research. Commonly Used Power Rankings ESPN created the Basketball Power Index (BPI) in 2012 in an attempt to accurately predict what teams would receive at-large bids by the selection committee. ESPN claims the BPI adjusts a team s score based on pace of the game, unlike other power rankings. One of the most unique aspects of the BPI is that it accounts for performance due to missing players (injuries, suspensions, etc.). This allows a team not to be punished when it loses a game if their star player has a sprained ankle and is unable to contribute (Oliver 2012). The Ratings Percentage Index (RPI) is a tool the NCAA has developed to rate several different sports. The selection committee relies heavily on the RPI because of its simplicity. The RPI uses only three components: winning percentage, opponents winning percentage, and your opponents -opponents winning percentage. Winning percentage is

8 38 Major Themes in Economics, Spring 2014 weighted by a factor of.25, opponents winning percentage by a factor of.5, and your opponents -opponents winning percentage by a factor of.25. Winning percentage is weighted for home wins and losses, away wins and losses, and neutral site wins and losses differently. A home win is equal to.6 wins; an away win is equal to 1.4 wins. Conversely, a home loss is equal to 1.4 losses, and a road loss is equal to.6 losses. All neutral site games are weighted as 1 win or 1 loss (NCAA 2014). Jeff Sagarin created his own power rating index in the 1980 s and his metrics have been published in USA Today since Most of his formula is shrouded in secrecy. Sagarin claims to put weight on margin of victory, an adjustment for blowouts, location of games, and strength of schedule. The exact weights and formulas are unknown (Sagarin 2014). Like Sagarin, Ken Pomeroy has created his own power rating to predict tournament games. His statistics go back to 2003 and are primarily focused on adjusting outcomes and statistics for the pace of a game. Like Sagarin, his formula has not been released and the exact weights to these statistics are unknown (Pomeroy 2014). Includes RPI BPI Sagarin Kenpom Scoring margin No Yes Yes Yes Diminishing returns for blowouts No Yes Yes No Pace of game matters No Yes No Yes Home/Neutral/Road Yes Yes Yes Yes SOS beyond Opponent's opponents' W-L All wins are better than losses (before Opp Adj) De-weighting games with missing key players No Yes Yes Yes Yes Yes No No No Yes No No

9 Fuqua: The Final Four Formula 39 Published Articles Shi, Moorthy, and Zimmerman examined the predictive capabilities of current NCAA basketball ranking methods. They predominantly focused on the fact that there is a glass ceiling of 75% predictive capabilities. They examined the predictive capabilities of the models employed by Ken Pomeroy, Daryl Morey, John Hollinger, and Dean Oliver. They come to the conclusion that the limited predictive capabilities of the current models is in the choice of variables, not in the models themselves. In theory, selecting the correct variables, may lead to a proverbial busting of the glass ceiling (Shi, Moorthy and Zimmerman 2013). Most predictive research on basketball has been focused on the NBA. This is because of longer and more consistent schedules. The NBA typically plays a schedule of 82 games with a schedule set by the league. Lee and Berri have recently approached this topic by using production functions to measure positional productivity in the NBA (i.e. Are guards, centers, or forwards more valuable?). They build their model on the premise that wins in the NBA are determined by how efwciently one scores per possession employed, relative to one s opponent s ability to use possessions efwciently. Lee and Berri calculate the effectiveness of each position on each team. They then use a Cobb-Douglas production function to estimate a log-log econometric model that breaks down the positional quality of each team and how it contributes to wins. Ultimately they discovered that big men have a greater impact on team wins than small forwards or guards (Lee and Berri 2008). On average the higher seed wins 71 percent of the time. This led Carlin (1996) to use seed difference, Sagarin Rating difference, and betting point spreads to predict which teams would reach the final four. His model used two linear regressions. For both models the betting point spread was used as the dependent variable. For their first regression the lone independent variable was the seed difference squared. In the second regression the independent variable was the difference in Sagarin ratings. They applied both of these models to the 1994 NCAA basketball tournament and correctly predicted one of the four regional champions. They state that the model they developed requires only elementary ideas in probability theory, statistical graphics, and linear regression analysis, and as such should provide an interesting and instructive exercise for students (Carlin 1996).

10 40 Major Themes in Economics, Spring 2014 V. Model Except for Carlin, the current literature does not address the issue of predicting the regional champions of the NCAA Division I basketball tournament. Carlin s model is very rudimentary and outdated but can provide a useful foundation for predicting the final four. The model presented in this paper tries to expand on the use of production functions in the NBA as laid out by Lee and Berri and apply the same principles to a binomial logit model. The focus on defensive and offensive efficiencies in this paper is mostly derived from Shi, Moorthy, and Zimmerman. A binomial logit model can be used to predict success in the NCAA basketball tournament. A logit model result is constrained to a number between 0 and 1. This can be a useful tool in predicting success, as long as success is properly defined. For this model success is defined as winning your respective region and thus making the Final Four. In this logit model the dependent variable is either a 1 for a team reaching the final four or a 0 for teams that do not. Explanatory variables are: points per 100 possessions (PtsPer100Poss) to account for offensive prowess, points per100 possessions allowed (PtsPer100PossAllowed) for defensive effectiveness, rebounding rate (RBSRate) as a measure of ball control, strength of schedule (SOS) in order to normalize statistics based on level of competition, and regional strength (REGSTR) to account for variations in the strength of regions. VI. Data and Variables Data Data were collected on the 510 tournament teams from 2006 to 2013 from BasketballReference.com and randomly cross-referenced against NCAA.org to ensure accuracy. All regressions were run using Gnu Regression, Econometrics, and Time-Series Library (GRETL). Dependent Variable The nature of a binomial logit model is that the dependent variable is

11 Fuqua: The Final Four Formula 41 binary, taking on a value of either 1 or 0. In this model a 1 will indicate the team made the final four while a 0 will indicate a team did not make the final four. Strength of Schedule (SOS) There are many calculations for strength of schedule. For example, NCAA.org typically calculates it based on your opponent s winning percentage and your opponent s-opponents winning percentage. This paper chose to use basketballreference.com s strength of schedule. That calculation is based on an average offensive and defensive NCAA Division I team. If a team typically plays statistically above average teams, then its strength of schedule will be higher. Strength of schedule of 0 would mean over the course of a season the teams you played were a statistically average NCAA Division I team. The purpose of using strength of schedule statistics is three-fold. Strength of schedule normalizes a team s statistics based on competition level, indicates that a team plays in a more competitive conference, and may indicate that a team has been battle tested. There is a difference between scoring 70 points per game against a really good defensive team and scoring 70 points per game against an extremely weak defensive team. In order to normalize a team s statistics, the strength of schedule variable is used. There are 32 NCAA Division I basketball conferences. The teams that play in the major conferences (See Table 1) typically make the final four more frequently. Teams in one of these six power conferences will innately have a higher strength of schedule and therefore be more likely to reach the final four. When a team reaches the tournament and has played a very weak schedule it is more susceptible to upsets. It has not been challenged at the highest level yet. Playing a weak schedule is not good preparation for entering a tournament consisting of the 64 best teams in the country. The lowest strength of schedule for the 512 tournament teams was 2013 s Southern University at The highest strength of schedule for the 512 tournament teams was 2011 s Michigan State at The average strength of schedule for the 512 tournament teams is

12 42 Major Themes in Economics, Spring 2014 Points per Possessions Earned (PTSPE) In order to account for a team s offensive efficiency this model uses the statistic points per possessions earned. The equation used is directly from Lee and Berri s paper on the NBA. Unlike points per game this statistic adjusts for the pace of a game. A team can score a large number of points simply by increasing its number of possessions. By adjusting for the pace of the game this statistic can indicate how effective a team will be when their possessions in a game are limited. As points per 100 possessions increases, so should a team s chance of reaching the final four. The maximum, minimum, and average points per possessions earned for the 512 tournament teams was 1.22 for Missouri in 2012,.93 for Arizona in 2006, and 1.09, respectively. Points Allowed Per Possessions Allowed (DPTSPA) Like points per possessions earned, this equation comes directly from Lee and Berri s work on the NBA. This statistic indicates how effective a team is at preventing their opponent from scoring while holding possessions constant. Even if a team slows a game down in order to prevent high scoring, it does not necessarily mean it is efficient defensively. As a team s points allowed per possession allowed decreases, its chance of reaching the final four will increase. In 2008 Oregon had the worst points allowed per possession allowed of the 512 tournament teams at Stephen F. Austin in 2009 had the best points allowed per possession allowed of the 512 tournament teams at.85. The average for the 512 tournament teams from was.97. Rebounds Rate (RBSRate) RBSRate=100(ReboundsPerGame)/((FGAtt - FGMade) + (FTAtt - FTMade) + (OppFGAtt - OppFGMade) + (OppFTAtt - OppFTMade))

13 Fuqua: The Final Four Formula 43 Rebounds Rate is a statistic that determines what percentage of available rebounds in a game a team gets. Instead of simply using rebounds per game, this statistic adjusts for how many available rebounds there are. Having 40 rebounds per game when there are 100 available rebounds is not as good as having 40 rebounds per game when there are only 50 available rebounds. As rebounding rate increases, a team s chances to reach the final four should increase as well. The minimum rebounding rate for the 512 tournament is 42.54% by West Virginia in The maximum rebounding rate for the 512 tournament teams is 58.65% by Old Dominion in The overall average rebounding rate for the 512 tournament teams is 51.99%. Regional Strength (REGSTR) Not all regions are created equally. Despite the selection committee s attempt to make all regions equally competitive, it is rarely achieved. This statistic attempts to account for any discrepancies in the overall strength of regions. It also will account for the quality of opponents a team must face in its region to reach the final four. This statistic is created by first running a binary choice logit model excluding regional strength. This results in a predicted probability ( ) for each of the 512 tournament teams to reach the final four. Then for each individual team I sum the s for the other 15 teams in its region. For example: In order to calculate the regional strength for 2012 Kentucky (located in the South region) you would sum the s for each of the other 15 teams in the South region. The highest regional strength was for North Carolina A&T in the Midwest region in 2013 with a regional strength of This means that the sum of the s of the other 15 teams in the Midwest region in 2013 was over 163 percent. The lowest regional strength was for Villanova in 2006 with a regional strength of.304. This would be that the sum of the s of the other 15 teams in the 2006 Midwest region was just over 30 percent. The average regional strength is.9385.

14 44 Major Themes in Economics, Spring 2014 VII. Econometric Results Variable Coefficient P-Value Constant SOS DPTSPA PTSPE RBSRATE Region Strength The primary econometric results to note are the sign of the coefficients, and the p-values of the coefficients. As expected, the coefficient on strength of schedule is positive. It is also statistically significant at the one percent level. This would indicate that a team from a more prominent conference and is battle tested would have an increased chance to reach the final four. Points allowed per possession allowed has a negative coefficient as predicted. It is also statistically significant at the one percent level. Next, points per possessions earned was hypothesized to have a positive coefficient and this turned out to be true. The coefficient is significant at the five percent level. Rebounding rate was also hypothesized to have positive effect. Due to a large p-value one cannot conclusively determine if rebounding rate is statistically different from zero. In other words, rebounding rate may not influence a team s chance of reaching the final four. Finally, regional strength would be expected to be negative. This is because the tougher a region is and the more difficult the opponents a team faces on its way to the final four, the less likely it is to reach the final four. This hypothesis is confirmed at the five percent level. Common econometric measures of fit may not be relevant to this model. Adjusted R2 for this model is calculated as This means that the model is explaining 25 percent of the variation in the dependent variable. Later in this paper it will be apparent that this is a gross underestimation. Also, GRETL produces a measure of fit by determining

15 Fuqua: The Final Four Formula 45 the number of cases correctly predicted. GRETL uses the decision rule that if an observation is greater than.5 that observation will be predicted as a 1. Conversely, GRETL predicts that any observation less than.5 will be a 0. This is not always the best decision rule for this model because a team could have a predicted probability under.5 and still be the best team in its region. For example: In 2013 Louisville would have a predicted probability of reaching the Final Four of 39.2 percent. While GRETL would predict Louisville to not reach the Final Four, in the Midwest region Louisville had the highest predicted probability and therefore would be correctly predicted to reach the Final Four. One other item to note about the coefficients of the variables is the distinct magnitude difference between points per possessions earned and points allowed per possession allowed. The average of points per possession earned is 1.09 and the average for points allowed per possession allowed is.97. Despite the closeness of these averages, the coefficient of points allowed per possession allowed is nearly double that of points per possession earned. This would indicate that perhaps defense does truly win championships. VIII. Application to Tournaments In order to determine the quality of this model it is best to compare its predictive capabilities to that of other current power ratings. Most pretournament data is unavailable for current power ratings. Therefore the comparative analysis is limited to the tournament years Peter Tiernan of Bracket Science and John Ezekowitz of Harvard Sports Analysis Collective have calculated the predictive capabilities of the previously referred to RPI, BPI (limited information), and KenPom Ratings. (There is no data on the predictive capabilities of Jeff Sagarin s model) They also analyze the predictive capabilities of the true-seed method. This method assumes that the higher seed will always win. A good measure for overall bracket prediction is that of games correctly predicted. This is a measure of how many of the 63 tournament games a model would correctly predict if one were to fill out their bracket pre-tournament. The Fuqua Statistic correctly predicts 42.7 (67.2 percent) games on average. This is first among all other power ratings but only by an average of approximately 1 game per year. A good predictive indicator of a power rating is how a bracket filled out prior to the tournament would do on ESPN s bracket challenge.

16 46 Major Themes in Economics, Spring 2014 ESPN s bracket challenge awards 1 point for correctly predicting a first round game, 2 points for each sweet sixteen team correctly predicted, 4 points for each elite eight team correctly predicted, 8 points for correctly predicting a final four team, 16 points for correctly predicting a championship game team, and 32 points for correctly predicting the national champion. Using these numbers the Fuqua statistic was third among current power ratings. The best rating system according to this method would be the true seed method. On average the true seed method would score 13 points better per year on ESPN than the Fuqua statistic. The Fuqua statistic struggles to predict the ultimate national champion and therefore takes a hit in this scoring system. KenPom s rating and the true seed method predict three and five national champions respectively over a six year period. The Fuqua Statistic only predicts two national champions. Up to just the final four however the Fuqua statistic would score the most points on ESPN. It is only the games after the final four that it seems other power ratings have an advantage. One final indicator of predictive success would be its ability to predict matchups. This would mean predicting the first 32 games of the NCAA tournament and then once the next round matchups are determined, predict the next 16 games. For example: In 2012 Duke played Lehigh and Notre Dame played Xavier. The winner of these two games would face each other. This model would have predicted Xavier to beat Notre Dame (Xavier won) and Duke to beat Lehigh (Lehigh won). Then it would have predicted Duke to beat Xavier. By filling out the bracket prior to the tournament this model would have correctly predicted only one game of three correct. If after the first round, however, I examined the Lehigh vs. Xavier matchup my model would have correctly predicted Xavier to advance. Therefore, at predicting matchups this model would have predicted two of the three matchups correctly. The premise of this measure is flawed because one cannot change one s predictions once the tournament begins. However, it seems that this is a popular measure of predictive capabilities. In this category the Fuqua statistic is second to the BPI by.6 percent. While these overall tournament measures are useful, the purpose this paper is to provide a method of predicting the final four. In this category, over a six year period (24 possible final four teams), KenPom, RPI, and the true seed method would have predicted ten, nine, and ten final four teams respectively. The Fuqua statistc would have correctly predicted 14 final four teams over this same period. This is forty percent better than

17 Fuqua: The Final Four Formula 47 any of the current models. It appears that this model is superior to all other current ratings in the category in which it is designed to be best. FuquaStatistic ESPN BPI NCAA RPI True Seed KenPom Games Correctly Predicted Points on ESPN Bracket Challenge Points on ESPN Bracket Challenge 2 % of games Correctly Predicted % of Matchups Correctly Predicted Final Four Teams Correctly Predicted 1 - estimated number based on available data 2 - Calculated up to the final four and not beyond IX. Issues and Further Research Shi, Moorthy, Zimmerman claim that there is a glass ceiling when it comes to predicting NCAA basketball games. They claim this glass ceiling is around percent. This model seems to reach this percentage but is unable to break through it. Shi, Moorthy, and Zimmerman attribute this to the attributes (variables) we and others use. There are four primary reasons for this ceiling. First, much of the relevant data in a basketball game is unavailable. For example, the number of passes per possession may be relevant to basketball success but no such statistic exists and would be extremely difficult to measure. Second, there are several immeasurable aspects to a basketball game. Specifically, college basketball games involve 18 to 22 year old kids with

18 48 Major Themes in Economics, Spring 2014 large variations in emotion. There is no way to measure the effect on a key player s psyche if his girlfriend breaks up with him the night before. Next, the structure of NCAA Division I basketball creates a challenging setting for predictive analysis. There are 351 teams, and each team has a large range of resources. Each team is also able to select most of its opponents, (only a certain number of conference games are required) and each team only plays roughly 30 games (a small sample size). These factors don t allow for a good statistical sample for modeling. Finally, there is a large level of randomness involved in basketball. There are ten players on a 94 foot by 50 foot court and one wet spot on the floor, one bad call by a referee, or one underinflated basketball, may have a large impact on the game. Further research is possible but highly tedious. There are two main statistics that could be calculated and may significantly affect a team s probability of reaching the final four. First, a statistic for consistency may be useful. The best way of calculating this would be by taking the standard deviation of statistics. The larger a standard deviation a team has, the more inconsistent a team is, and the less likely they are to reach the final four. Secondly, it may be useful to calculate a team s tournament and game experience. This may be calculated by using the number of tournament minutes played by a team s roster. There is bound to be a breakthrough in the research of predicting sporting events. As our technology increases we are able to calculate and record more statistics and therefore have more precise models. X. Conclusion Is this just another mediocre attempt at predicting the NCAA tournament or have any earth shattering discoveries been made? The simple answer is no. The independent variables found to be significant are commonly agreed on by all basketball pundits. The proverbial glass ceiling determined by Shi, Moorthy and Zimmerman of percent prediction accuracy was not broken through. It appears that despite being better than the current power ratings in almost all predictive measures it is only by a slight margin. The only true indicator of this being a superior model is that over the span of six years this model correctly predicted four more Final Four teams than other current power ratings. Overall it may be just another run of the mill model.

19 Fuqua: The Final Four Formula 49 References BasketballReference.com. Accessed April2, Carlin, Bradley "Improved NCAA Basketball Tournament Modeling via Point Spread and Team Strength." The American Statistician, 50: Lee, Young, and David Berri "A Re-Examination of Production Functions and Efficiency Estimates for the National Basketball Association." Scottish Journal of Political Economy, 55: NCAA.com. Accessed April 2, NCAA.com " NCAA Division I Men's Basketball Championship Principles and Procedures for Establishing the Bracket." Accessed April 2, Oliver, Dean "Introducing the BPI." Accessed April 2, Pomeroy, Ken. kenpom.com. Accessed April 2, Sagarin, Jeff. January 06, USAtoday.com. Accessed April 2, Sanburn, Josh "March Madness Will Cost Employers $134 Million." Accessed April 02, Shi, Zifan, Sruthi Moorthy, and Albrecht Zimmerman. Accessed April 2, "Predicting NCAAB match outcomes using ML techniques-some results and lessons learned." Woodruff, Mandi "You've Got A 1 in 35 Billion Chance At Filling Out The Perfect March Madness Bracket". Accessed April 2,

How To Predict Seed In A Tournament
 Wright 1 Statistical Predictors of March Madness: An Examination of the NCAA Men s Basketball Championship Chris Wright Pomona College Economics Department April 30, 2012 Wright 2 1. Introduction 1.1 History
Predicting March Madness
 THE OHIO STATE UNIVERSITY Predicting March Madness A Statistical Evaluation of the Men s NCAA Basketball Tournament Emily Toutkoushian Advisor: Dr. Brian A. Turner 5/19/2011 Abstract In men s college basketball,
Making Sense of the Mayhem: Machine Learning and March Madness
 Making Sense of the Mayhem: Machine Learning and March Madness Alex Tran and Adam Ginzberg Stanford University atran3@stanford.edu ginzberg@stanford.edu I. Introduction III. Model The goal of our research
Seed Distributions for the NCAA Men s Basketball Tournament: Why it May Not Matter Who Plays Whom*
 Seed Distributions for the NCAA Men s Basketball Tournament: Why it May Not Matter Who Plays Whom* Sheldon H. Jacobson Department of Computer Science University of Illinois at Urbana-Champaign shj@illinois.edu
REPORT OF THE NCAA DIVISION I BASEBALL COMMITTEE JULY 29, 2014, TELECONFERENCE. a. Baseball Umpire Improvement Program Budget Increase.
 SUPPLEMENT NO. REPORT OF THE NCAA DIVISION I BASEBALL COMMITTEE JULY 29, 2014, TELECONFERENCE ACTION ITEMS. 1. Legislative Items. None. 2. Nonlegislative Items. a. Baseball Umpire Improvement Program Budget
Anomalies in Tournament Design: The Madness of March Madness
 Working Paper Series, Paper No. 09-10 Anomalies in Tournament Design: The Madness of March Madness Robert Baumann, Victor A. Matheson, and Cara Howe October 2009 Abstract Tournament design is of crucial
March Madness: The Racket in Regional Brackets. Christopher E. Fanning, Kyle H. Pilkington, Tyler A. Conrad and Paul M. Sommers.
 March Madness: The Racket in Regional Brackets by Christopher E. Fanning, Kyle H. Pilkington, Tyler A. Conrad and Paul M. Sommers June, 2002 MIDDLEBURY COLLEGE ECONOMICS DISCUSSION PAPER NO. 02-28 DEPARTMENT
Calculating Strength of Schedule, and Choosing Teams for March Madness
 Calculating Strength of Schedule, and Choosing Teams for March Madness Paul Fearnhead and Benjamin M Taylor Department of Mathematics and Statistics, Lancaster University, UK Abstract We propose a new
International Statistical Institute, 56th Session, 2007: Phil Everson
 Teaching Regression using American Football Scores Everson, Phil Swarthmore College Department of Mathematics and Statistics 5 College Avenue Swarthmore, PA198, USA E-mail: peverso1@swarthmore.edu 1. Introduction
arxiv:1310.3607v1 [cs.lg] 14 Oct 2013
![arxiv:1310.3607v1 [cs.lg] 14 Oct 2013](/thumbs/39/19319181.jpg "arxiv:1310.3607v1 [cs.lg] 14 Oct 2013") Predicting NCAAB match outcomes using ML techniques some results and lessons learned Zifan Shi, Sruthi Moorthy, Albrecht Zimmermann arxiv:1310.3607v1 [cs.lg] 14 Oct 2013 KU Leuven, Belgium Abstract. Most
Predicting NCAAB match outcomes using ML techniques some results and lessons learned Zifan Shi, Sruthi Moorthy, Albrecht Zimmermann arxiv:1310.3607v1 [cs.lg] 14 Oct 2013 KU Leuven, Belgium Abstract. Most
Rider University Baseball
 Rider University Baseball 2008 NCAA Regional Championship Notes #1 Cal-State Fullerton (37-19) #2 UCLA (31-25) #3 Virginia (38-21) #4 Rider (29-26) Fullerton, California Tournament Field Tournament Schedule
Tennis Tournaments
 2012 RIVIERA/ITA WOMEN S ALL-AMERICAN CHAMPIONSHIPS Hosted by the Riviera Tennis Club Pacific Palisades, California October 2-7, 2012 Pre-Qualifying Rounds September 29-30 at UCLA Site: All matches of
Artificial Intelligence Beating Human Opponents in Poker
 Artificial Intelligence Beating Human Opponents in Poker Stephen Bozak University of Rochester Independent Research Project May 8, 26 Abstract In the popular Poker game, Texas Hold Em, there are never
CONFERENCE USA SPORT FORMATS FOR 2013-14
 BASEBALL 2014 Teams (13): Charlotte, East Carolina, FIU, Florida Atlantic, Louisiana Tech, Marshall, Middle Tennessee, Old Dominion, Rice, Southern Miss, Tulane, UAB, UTSA Scheduling Format: Teams will
2015 Adjusted Graduation Gap Report: NCAA Women s and Men s Basketball
 Websites: Twitter: Phone: Email: csri- sc.org csriconference.org @csrisouthall; @csriconference (803) 777-0658 / (803) 777-5550 csri@mailbox.sc.edu Media Contacts: Dr. Mark S. Nagel, Associate Director:
SPORTS WAGERING RULES EDUCATION SESSION. SMC Compliance Office 2012-13
 SPORTS WAGERING RULES EDUCATION SESSION SMC Compliance Office 2012-13 1. Which of the following groups are not prohibited from placing bets on NCAA sponsored sports? A. Student-Athletes B. Staff Members
2015 Adjusted Graduation Gap Report: NCAA Softball and Baseball
 Websites: csri-sc.org csriconference.org Twitter: @csrisouthall; @csriconference Phone: (803) 777-0658 / (803) 777-5550 Email: csri@mailbox.sc.edu Media Contacts: Dr. Mark S. Nagel, Associate Director:
Beating the NCAA Football Point Spread
 Beating the NCAA Football Point Spread Brian Liu Mathematical & Computational Sciences Stanford University Patrick Lai Computer Science Department Stanford University December 10, 2010 1 Introduction Over
How To Predict The Outcome Of The Ncaa Basketball Tournament
 A Machine Learning Approach to March Madness Jared Forsyth, Andrew Wilde CS 478, Winter 2014 Department of Computer Science Brigham Young University Abstract The aim of this experiment was to learn which
Volume 30, Issue 4. Market Efficiency and the NHL totals betting market: Is there an under bias?
 Volume 30, Issue 4 Market Efficiency and the NHL totals betting market: Is there an under bias? Bill M Woodland Economics Department, Eastern Michigan University Linda M Woodland College of Business, Eastern
Wesley Pasfield Northwestern University William.pasifield2016@u.northwestern.edu
 March Madness Prediction Using Big Data Technology Wesley Pasfield Northwestern University William.pasifield2016@u.northwestern.edu Abstract- - This paper explores leveraging big data technologies to create
The Math. P (x) = 5! = 1 2 3 4 5 = 120.
 = 5! = 1 2 3 4 5 = 120.") The Math Suppose there are n experiments, and the probability that someone gets the right answer on any given experiment is p. So in the first example above, n = 5 and p = 0.2. Let X be the number of correct
The Math Suppose there are n experiments, and the probability that someone gets the right answer on any given experiment is p. So in the first example above, n = 5 and p = 0.2. Let X be the number of correct
SEEDING IN THE NCAA MEN S BASKETBALL TOURNAMENT: WHEN IS A HIGHER SEED BETTER?
 The Journal of Gambling Business and Economics (009) 3 63-87 SEEDING IN THE NCAA MEN S BASKETBALL TOURNAMENT: WHEN IS A HIGHER SEED BETTER? Sheldon H. Jacobson Ph.D University of Illinois Department of
Testing Efficiency in the Major League of Baseball Sports Betting Market.
 Testing Efficiency in the Major League of Baseball Sports Betting Market. Jelle Lock 328626, Erasmus University July 1, 2013 Abstract This paper describes how for a range of betting tactics the sports
A Contrarian Approach to the Sports Betting Marketplace
 A Contrarian Approach to the Sports Betting Marketplace Dan Fabrizio, James Cee Sports Insights, Inc. Beverly, MA 01915 USA Email: dan@sportsinsights.com Abstract Actual sports betting data is collected
Forecasting Accuracy and Line Changes in the NFL and College Football Betting Markets
 Forecasting Accuracy and Line Changes in the NFL and College Football Betting Markets Steven Xu Faculty Advisor: Professor Benjamin Anderson Colgate University Economics Department April 2013 [Abstract]
Improved NCAA Basketball Tournament Modeling. Several models for estimating the probability that a given team in an NCAA basketball tournament
 Abstract Improved NCAA Basketball Tournament Modeling via Point Spread and Team Strength Information Bradley P. Carlin University of Minnesota October 25, 1994 Several models for estimating the probability
College Football Rankings: Do the Computers Know Best? Joseph Martinich. College of Business Administration. University of Missouri - St.
 College Football Rankings: Do the Computers Know Best? By Joseph Martinich College of Business Administration University of Missouri - St. Louis 8001 Natural Bridge Road St. Louis, MO 63121 e-mail: joseph.martinich@umsl.edu
Conference Commissioners Association
 Commissioners Association Summary Report of Miscellaneous Operational Items Academic Year: 2012-13 Prepared by: Scott Crawford, Ph.D. Chair CCA Executive Committee Todd Brittingham Intern Kansas Collegiate
How ToPlay Oce Pools If You Must: Maximizing Expected Gain In Tournament Models
 Abstract How ToPlay Oce Pools If You Must: Maximizing Expected Gain In Tournament Models David Breiter and Bradley P. Carlin University of Minnesota August 26, 1996 The increasing attention paid in recent
2015-2016 COLLEGE BASKETBALL SCHEDULE
 2015-2016 COLLEGE BASKETBALL SCHEDULE OVER 220 GAMES INCLUDING... DATE GAME TIME (ET) Fri 11/13 Quicken Loans Veterans Classic Temple vs. North Carolina 7:00 Florida vs. Navy 9:30 Sun 11/15 Wake Forest
The NCAA Basketball Betting Market: Tests of the Balanced Book and Levitt Hypotheses
 The NCAA Basketball Betting Market: Tests of the Balanced Book and Levitt Hypotheses Rodney J. Paul, St. Bonaventure University Andrew P. Weinbach, Coastal Carolina University Kristin K. Paul, St. Bonaventure
Texas Hold em. From highest to lowest, the possible five card hands in poker are ranked as follows:
 Texas Hold em Poker is one of the most popular card games, especially among betting games. While poker is played in a multitude of variations, Texas Hold em is the version played most often at casinos
Student-Athletes. Guide to. College Recruitment
 A Student-Athletes Guide to College Recruitment 2 Table of Contents Welcome Letter 3 Guidelines for Marketing Yourself as an Athlete 4 Time Line for Marketing Yourself as an Athlete 4 6 Questions to Ask
U.S. Culture Series: American Sports. Scott Manley
 U.S. Culture Series: American Sports Scott Manley Sports in the U.S. Sports in the U.S. are an important part of the culture. The sporting culture is different from that of other countries, with a unique
EXAMINING NCAA/NFL MARKET EFFICIENCY
 EXAMINING NCAA/NFL MARKET EFFICIENCY Gerald Kohers, Sam Houston State University Mark Tuttle, Sam Houston State University Donald Bumpass, Sam Houston State University ABSTRACT Page 67 Billions of dollars
We never talked directly about the next two questions, but THINK about them they are related to everything we ve talked about during the past week:
 ECO 220 Intermediate Microeconomics Professor Mike Rizzo Third COLLECTED Problem Set SOLUTIONS This is an assignment that WILL be collected and graded. Please feel free to talk about the assignment with
In Pursuit of Perfection: An Ensemble Method for Predicting March Madness Match-Up Probabilities
 In Pursuit of Perfection: An Ensemble Method for Predicting March Madness Match-Up Probabilities Sara Stoudt Loren Santana Ben Baumer Abstract In pursuit of the perfect March Madness bracket we aimed to
During the course of our research on NBA basketball, we found out a couple of interesting principles.
 After mining all the available NBA data for the last 15 years, we found the keys to a successful basketball betting system: If you follow this system exactly, you can expect to hit 90% of your NBA bets.
SPORTS FORECASTING. There have been an enormous number of studies involving various aspects of sports. We
 SPORTS FORECASTING There have been an enormous number of studies involving various aspects of sports. We will concentrate only on the economic aspects. For example, Econ Lit has over 3700 entries while
Golf League Formats and How to Run Them
 Golf League Formats and How to Run Them Contents Running a Golf League... 3 Starting your Golf League... 3 The Players... 3 League Format... 3 Points... 4 Match Play... 4 Points Per hole... 4 Points per
Combining player statistics to predict outcomes of tennis matches
 IMA Journal of Management Mathematics (2005) 16, 113 120 doi:10.1093/imaman/dpi001 Combining player statistics to predict outcomes of tennis matches TRISTAN BARNETT AND STEPHEN R. CLARKE School of Mathematical
PLAYING RULES & FORMAT
 WDF EUROPE CUP PLAYING RULES & FORMAT Seventh revised edition A Full Member of the SPORTACCORD and committed to compliance with the WADA Code on Anti-Doping. Random drug testing could occur in this event
Keeping Score When It Counts: Sweet 16 Men s and Women s Teams A Look at Their Academic Success
 Media Contact: Kelvin Ang Kelvinangjy@knights.ucf.edu, 315-450-1420 Keeping Score When It Counts: Sweet 16 Men s and Women s Teams A Look at Their Academic Success Orlando, FL March 23, 2011 If the Sweet
VALIDATING A DIVISION I-A COLLEGE FOOTBALL SEASON SIMULATION SYSTEM. Rick L. Wilson
 Proceedings of the 2005 Winter Simulation Conference M. E. Kuhl, N. M. Steiger, F. B. Armstrong, and J. A. Joines, eds. VALIDATING A DIVISION I-A COLLEGE FOOTBALL SEASON SIMULATION SYSTEM Rick L. Wilson
HOW TO BET ON TENNIS. Gambling can be addictive. Please play responsibly. http://responsiblegambling.betfair.com
 HOW TO BET ON TENNIS Gambling can be addictive. Please play responsibly. http://responsiblegambling.betfair.com Tennis is great for Betfair customers as it takes place over 11 months of the year, which
Sport Hedge Millionaire s Guide to a growing portfolio. Sports Hedge
 Sports Hedge Sport Hedging for the millionaire inside us, a manual for hedging and profiting for a growing portfolio Congratulations, you are about to have access to the techniques sports books do not
Does NFL Spread Betting Obey the E cient Market Hypothesis?
 Does NFL Spread Betting Obey the E cient Market Hypothesis? Johannes Harkins May 2013 Abstract In this paper I examine the possibility that NFL spread betting does not obey the strong form of the E cient
Team Announcement Teleconference
 CHARLIE FISS: Good afternoon, everyone. Welcome to our media teleconference for the College Football Playoffs Semifinal at the Goodyear Cotton Bowl Classic. Those participating on today's teleconference
Sam Schaefer April 2011
 Football Betting Trends Sam Schaefer April 2011 2 Acknowledgements I would like to take this time to thank all of those who have contributed to my learning the past four years. This includes my parents,
Pick Me a Winner An Examination of the Accuracy of the Point-Spread in Predicting the Winner of an NFL Game
 Pick Me a Winner An Examination of the Accuracy of the Point-Spread in Predicting the Winner of an NFL Game Richard McGowan Boston College John Mahon University of Maine Abstract Every week in the fall,
An Exploration into the Relationship of MLB Player Salary and Performance
 1 Nicholas Dorsey Applied Econometrics 4/30/2015 An Exploration into the Relationship of MLB Player Salary and Performance Statement of the Problem: When considering professionals sports leagues, the common
 Additional information >>> HERE
 Beating the MLB Moneyline
 Beating the MLB Moneyline Leland Chen llxchen@stanford.edu Andrew He andu@stanford.edu 1 Abstract Sports forecasting is a challenging task that has similarities to stock market prediction, requiring time-series
A Logistic Regression/Markov Chain Model For NCAA Basketball
 A Logistic Regression/Markov Chain Model For NCAA Basketball Paul Kvam 1 and Joel S. Sokol 1,2 Abstract: Each year, more than $3 billion is wagered on the NCAA Division I men s basketball tournament. Most
FIBA vs North American Rules Comparison
 FIBA vs North American Rules Comparison by Anthony Reimer During his officiating career of over 20 years, Anthony Reimer became known in the province of Alberta, Canada, for his expertise in basketball
Sports Forecasting. H.O. Stekler. RPF Working Paper No. 2007-001 http://www.gwu.edu/~forcpgm/2007-001.pdf. August 13, 2007
 Sports Forecasting H.O. Stekler RPF Working Paper No. 2007-001 http://www.gwu.edu/~forcpgm/2007-001.pdf August 13, 2007 RESEARCH PROGRAM ON FORECASTING Center of Economic Research Department of Economics
Donald R. Reed, PhD. 59 Moorgate Court East Amherst, NY 14051 716-810-9029 (H) 716-341-7088 (C) donald.r.reed@gmail.com
 716-341-7088 (C) donald.r.reed@gmail.com") SUMMARY OF QUALIFICATIONS Donald R. Reed, PhD 59 Moorgate Court East Amherst, NY 14051 716-810-9029 (H) 716-341-7088 (C) donald.r.reed@gmail.com Professional athletics administrator and educator with extensive
SUMMARY OF QUALIFICATIONS Donald R. Reed, PhD 59 Moorgate Court East Amherst, NY 14051 716-810-9029 (H) 716-341-7088 (C) donald.r.reed@gmail.com Professional athletics administrator and educator with extensive
THE UPA MANUAL OF CHAMPIONSHIP SERIES TOURNAMENT FORMATS
 THE UPA MANUAL OF CHAMPIONSHIP SERIES TOURNAMENT FORMATS Version 4.3 January 17, 2008 Original submitted by Eric Simon Revised in 8/2003 by: Brian Canniff Jin Ding Hank Ibser AJ Iwaszko Florian Pfender
Live Betting Extra Rules
 Live Betting Extra Rules Rules for General Main Live Lines The following rules apply for Live Betting: Markets do not include overtime unless otherwise stated. Lines are offered at the provider s discretion.
Beating Roulette? An analysis with probability and statistics.
 The Mathematician s Wastebasket Volume 1, Issue 4 Stephen Devereaux April 28, 2013 Beating Roulette? An analysis with probability and statistics. Every time I watch the film 21, I feel like I ve made the
University of Pennsylvania Football and Basketball
 University of Pennsylvania Football and Basketball Nelligan Sports Marketing, Inc. 150 Clove Road Little Falls, NJ 07424 Mike Felici: 215.746.7625 Diana LePore: 973.812.5900 1 NSM is dedicated to building
NATIONAL CHRISTIAN COLL
 NATIONAL CHRISTIAN COLLEGE ATHLETIC ASSOCIATION Men s Basketball Division I Men s Basketball I 95 Division I Men s Basketball I. GENERAL ADMINISTRATION OF THE NATIONAL CHAMPIONSHIP A. Administration In
2012 NCAA Hints for Volleyball Stat Takers at Matches
 2012 NCAA Hints for Volleyball Stat Takers at Matches Review plays and learn more with the volleyball statistician s instruction video online at: http://s3.amazonaws.com/ncaa/web_video/volleyball/statistics/index.html
FIVB WORLD LEAGUE PREVIEWS WEEK 1 JUNE 17-19, 2016
 Pool A1: Australia Belgium (17 June) Belgium have won all of their four World League matches against Australia, all in group 2 in the 2014 edition. The Belgian team won twice by 3-1 and twice in straight
22-Nov Duke -4.5 over Minnesota 89-71 Win 4 $400 22-Nov Oklahoma -3 over UTEP 68-61 Win 3 $300 7 $700 12 $940
 2012-2013 Doc's Sports College Basketball Complete Season Record By Game Daily Season To Date Date Game / pick Score W / L Units $$$ Units $$$ Units $$$ 17-Nov Milwaukee +6 over Davidson 73-68 Win 4 $400
Numerical Algorithms for Predicting Sports Results
 Numerical Algorithms for Predicting Sports Results by Jack David Blundell, 1 School of Computing, Faculty of Engineering ABSTRACT Numerical models can help predict the outcome of sporting events. The features
5 mistakes athletes make when creating their college list
 2011 5 mistakes athletes make when creating their college list Rex Grayner & Zack Walz Student Athlete Showcase, LLC 12/7/2011 Five mistakes athletes make when creating their college list So your dream
Twins hope to provide depth
 Twins hope to provide depth Stephanie and Natalie Yanasov want to help bring tennis championship to Cherry Hill East By MIKE MONOSTRA The Sun 1 FREE FREE FREE Small Cone or Water Ice! Bu 3rd y 2 Items,
College Football Rankings: Do the Computers Know Best?
 : Do the Computers Know Best? Joseph Martinich College of Business Administration, University of Missouri St. Louis, 8001 Natural Bridge Road, St. Louis, Missouri 63121 joseph.martinich@umsl.edu This paper
PEACHTREE CONFERENCE CONSTITUTION AND BY-LAWS. (Rev. 2001) ARTICLE I -NAME
 ARTICLE I -NAME") PEACHTREE CONFERENCE CONSTITUTION AND BY-LAWS (Rev. 2001) ARTICLE I -NAME Section I -The name of this organization shall be the Peachtree Conference. ARTICLE II - PURPOSE Section I - The purpose of this
PEACHTREE CONFERENCE CONSTITUTION AND BY-LAWS (Rev. 2001) ARTICLE I -NAME Section I -The name of this organization shall be the Peachtree Conference. ARTICLE II - PURPOSE Section I - The purpose of this
2015-2016 TSSAA Handbook FOOTBALL REGULATIONS
 FOOTBALL REGULATIONS I. CLASSIFICATION PLAN In Division I, TSSAA schools shall be divided into six classes for football; in Division II, TSSAA schools shall be divided into two classes for football. (See
After 3 races the player with the highest winnings has won that day s racing.
 Jockey 2-6 players Ravensburg Games Contents: 1 playing board 54 jockey cards 4 horses 1 pad of betting sheets play money This exciting game conveys all the suspense of the racetrack. In Jockey the players
Quality perception and the championship effect: Do collegiate sports influence academic rankings?
 Quality perception and the championship effect: Do collegiate sports influence academic rankings? Steven R. Cox Indiana University Kokomo Dianne M. Roden Indiana University Kokomo Abstract This study finds
SHOOTING FUNDAMENTALS
 SHOOTING FUNDAMENTALS BY ROB BABCOCK GENERAL MANAGER, TORONTO RAPTORS BASKETBALL CLUB I strongly believe that the most successful basketball teams are the teams that play the game for the true values the
WIN AT ANY COST? How should sports teams spend their m oney to win more games?
 Mathalicious 2014 lesson guide WIN AT ANY COST? How should sports teams spend their m oney to win more games? Professional sports teams drop serious cash to try and secure the very best talent, and the
ADVICE FOR THE COLLEGE BOUND WATER POLO PLAYER by Dante Dettamanti Water Polo Coach Stanford University, 1977-2001
 ADVICE FOR THE COLLEGE BOUND WATER POLO PLAYER by Dante Dettamanti Water Polo Coach Stanford University, 1977-2001 CHOOSING A COLLEGE IS ONE OF THE IMPORTANT DECISIONS THAT A STUDEN-ATHLETE WILL EVER MAKE.
RULES AND REGULATIONS OF FIXED ODDS BETTING GAMES
 RULES AND REGULATIONS OF FIXED ODDS BETTING GAMES Project: Royalhighgate Public Company Ltd. 04.04.2014 Table of contents SECTION I: GENERAL RULES... 6 ARTICLE 1 GENERAL REGULATIONS...6 ARTICLE 2 THE HOLDING
The Determinants of Scoring in NFL Games and Beating the Over/Under Line. C. Barry Pfitzner*, Steven D. Lang*, and Tracy D.
 FALL 2009 The Determinants of Scoring in NFL Games and Beating the Over/Under Line C. Barry Pfitzner*, Steven D. Lang*, and Tracy D. Rishel** Abstract In this paper we attempt to predict the total points
Rating Systems for Fixed Odds Football Match Prediction
 Football-Data 2003 1 Rating Systems for Fixed Odds Football Match Prediction What is a Rating System? A rating system provides a quantitative measure of the superiority of one football team over their
HOW TO RUN A TENNIS ON CAMPUS SERIES TOURNAMENT
 HOW TO RUN A TENNIS ON CAMPUS SERIES TOURNAMENT Before The Tournament Planning a tournament can be stressful at times, but with preparation the actual running of the tournament should be fairly easy. There
How To Bet On An Nfl Football Game With A Machine Learning Program
 Beating the NFL Football Point Spread Kevin Gimpel kgimpel@cs.cmu.edu 1 Introduction Sports betting features a unique market structure that, while rather different from financial markets, still boasts
THE DETERMINANTS OF SCORING IN NFL GAMES AND BEATING THE SPREAD
 THE DETERMINANTS OF SCORING IN NFL GAMES AND BEATING THE SPREAD C. Barry Pfitzner, Department of Economics/Business, Randolph-Macon College, Ashland, VA 23005, bpfitzne@rmc.edu, 804-752-7307 Steven D.
College Football Rankings and Market Efficiency
 College Football Rankings and Market Efficiency Ray C. Fair a and John F. Oster b March 2005 a Cowles Foundation and International Center for Finance, Yale University, New Haven, CT 06520-8281. Voice:
Non Farm Payroll Employment Developments among States during the Great Recession and Jobless Recovery
 Non Farm Payroll Employment Developments among States during the Great Recession and Jobless Recovery Prepared by: Paul E. Harrington and Neeta P. Fogg Center for Labor Markets and Policy, Drexel University
Herd Behavior and Underdogs in the NFL
 Herd Behavior and Underdogs in the NFL Sean Wever 1 David Aadland February 2010 Abstract. Previous research has failed to draw any clear conclusions about the efficiency of the billion-dollar gambling
Pool Play Brackets 3 TEAM POOL PLAY FORMAT. Game 1 1 vs. 2* Game 2 2 vs. 3* Game 3 3 vs. 1* Example 3 Team Pool Play 4 TEAM POOL PLAY FORMAT
 Pool Play Brackets Game 1 Game 2 Game 3 Team 1 Iowa Team 2 Kansas Team 3 Missouri Iowa vs. Kansas* Kansas vs. Missouri* Missouri vs. Iowa* Note: Games may be played in any order 3 TEAM POOL PLAY FORMAT
LEAST SQUARES MODEL FOR PREDICTING COLLEGE FOOTBALL SCORES. Michael B. Reid
 LEAST SQUARES MODEL FOR PREDICTING COLLEGE FOOTBALL SCORES by Michael B. Reid M.Stat., University of Utah, 23 SUBMITTED IN PARTIAL FULFILLMENT OF THE REQUIREMENTS FOR THE DEGREE OF MASTERS OF STATISTICS,
Division I FIELD HOCKEY 2012
 Association for the Protection of Collegiate Athletes SCHOOL RANKING REPORT For Division I FIELD HOCKEY 2012 2013 Association for the Protection of Collegiate Athletes TABLE OF CONTENTS Introduction 1
Game Theory and Poker
 Game Theory and Poker Jason Swanson April, 2005 Abstract An extremely simplified version of poker is completely solved from a game theoretic standpoint. The actual properties of the optimal solution are
TEAM TENNIS TOURNAMENT *The following rules provided by Purdue Intramural Sports are not meant to be all encompassing.*
 TEAM TENNIS TOURNAMENT *The following rules provided by Purdue Intramural Sports are not meant to be all encompassing.* SECTION 1. LEAGUE FORMAT I. Tournament Overview A. The tournament will consist of
Lotto Master Formula (v1.3) The Formula Used By Lottery Winners
 The Formula Used By Lottery Winners") Lotto Master Formula (v.) The Formula Used By Lottery Winners I. Introduction This book is designed to provide you with all of the knowledge that you will need to be a consistent winner in your local lottery
Lotto Master Formula (v.) The Formula Used By Lottery Winners I. Introduction This book is designed to provide you with all of the knowledge that you will need to be a consistent winner in your local lottery
An Unconvered Roulette Secret designed to expose any Casino and make YOU MONEY spin after spin! Even in the LONG Run...
 An Unconvered Roulette Secret designed to expose any Casino and make YOU MONEY spin after spin! Even in the LONG Run... The UNFAIR Casino advantage put BACK into the HANDS of every Roulette player! INTRODUCTION...2
Breathe and give it all you've got: How mindful athletes raise their game
 Breathe and give it all you've got: How mindful athletes raise their game By Washington Post, adapted by Newsela staff on 06.16.15 Word Count 660 In this Oct. 1, 2014, file photo, students meditate during
South Carolina. 180 The Proficiency Illusion
 South Carolina Introduction This study linked data from the 02 and 06 administrations of South Carolina s reading and math tests to the Northwest Evaluation Association s Measures of Academic Progress
LIVE BETTING ULTRA RULES
 LIVE BETTING ULTRA RULES I. General Rules 1. Placement of wagers All wagers for Prematch Ultra and Live In Play Ultra must be placed online and are final once confirmed with the password. 2. Specificity
Journal of Quantitative Analysis in Sports
 An Article Submitted to Journal of Quantitative Analysis in Sports Manuscript 1115 A New Application of Linear Modeling in the Prediction of College Football Bowl Outcomes and the Development of Team Ratings
Sin City. In poker, the facility to buy additional chips in tournaments. Total payout liability of a casino during any one game.
 gambling glossary Words & phrases to help you out with your dealings at The Paramount Casino A Action: Active Player: Added Game: Add-on: Aggregate Limit: A bet or wager. In poker, one who is still in
SPORTS ECONOMICS B30.2360.00
 SPORTS ECONOMICS B30.2360.00 PROFESSOR SIMON BOWMAKER SPRING 2010 Description and Scope This MBA elective course applies microeconomic theory and econometric analysis to sport and explores some public
Simbabet. Tip Code League Time MBS Home 1 X 2 Away 1234 UEFA 16:45 1 Barcelona 1.25 5.00 7.25 Arsenal
 Sport Betting Sports betting is a form of gaming which is based on sports (Soccer, basketball, cricket etc.). The challenge lies in predicting a win or a tie for a home game, or a win for an away game