What s New in IBM SPSS Statistics 20
|
|
|
- Brittany Porter
- 9 years ago
- Views:
Transcription
1 Myrto Setzi Associate Sales Engineer What s New in IBM SPSS Statistics 20 Editable Text Editable Text Editable Text Business Analytics software

2 Agenda Themes of the release Demonstration Questions 2

3 Themes of IBM SPSS Statistics 20 Mapping Adding geographic dimensions to analysis and reporting capabilities to gain better insight into data Improved Analytics Improvements to existing analytics, gives users more options to improve the accuracy of their analysis Increased Productivity Faster output and flexible technology allow users to increase production and not be restricted by software limitations 3


4 Mapping Plot analysis results on geographic maps o Enhance your ability to target, forecast, and plan by geographic area projected product revenue by county graduation rate by region or population by country Areas where crime is more prevalent o Expand your reporting capabilities Use prebuilt templates to create map types Convert ESRI files and import them as templates 4

5 Mapping 5
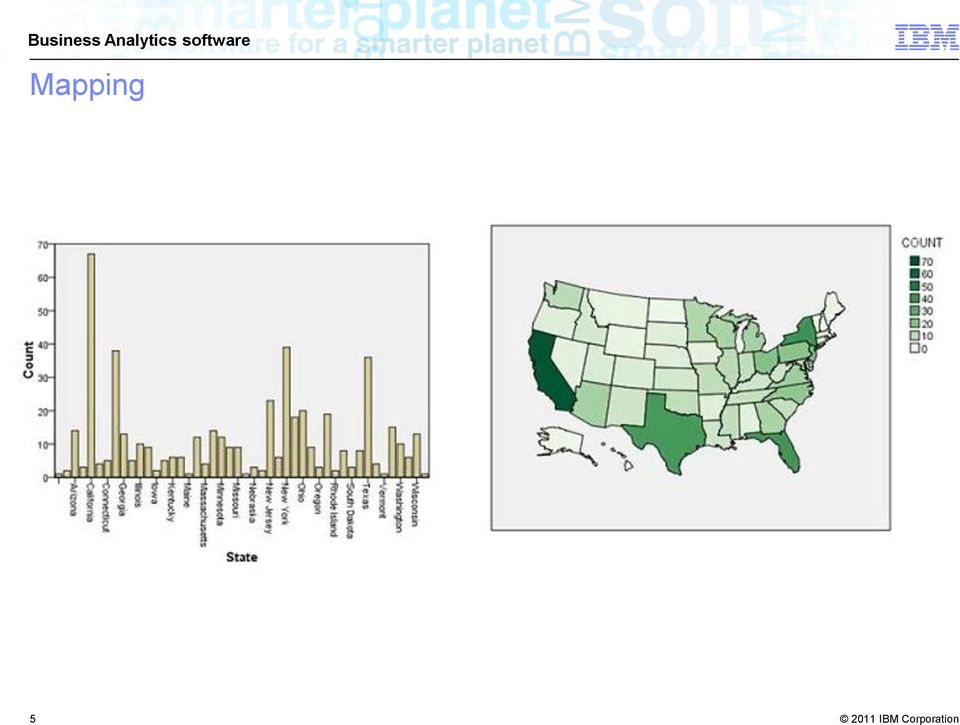
6 Mapping 4 types of maps: Choropleth Coordinates Minicharts Overlays 6


7 Choropleth Represents data by colouring the regions of a map 7

8 Coordinates Coordinates displayed on a map Requires Longitude and Latitude variables in the data Templates: Points Arrows 8

9 Minicharts Panels small charts on a map Templates: Bars Lines Pies 9

10 Overlay Combines two maps into a single output. 10

11 Improved Analytics Generalized linear mixed models for ordinal targets Extends the linear model so that: The target is linearly related to the factors and covariates through a specified link function The target can have a non-normal distribution The observations can be correlated Combination of Generalized Linear (GENLIN) and Linear Mixed (MIXED) models Simplified user interface (For subjects, repeated measures, effects) Role use (for targets and fixed effects) New kinds of visualizations in output 11
 Role use (for targets and fixed effects) New kinds of visualizations in")

12 Improved Generalized Linear Mixed Models On the Fields & Effects tab select the Target sidebar Select an ordinal target. By default, ordinal targets use multinomial logistic regression with a cumulative logit link function 12


13 Improved Generalized Linear Mixed Models The custom option now provides several link functions for multinomial distribution, in the case of an ordinal target. 13


14 Improved Generalized Linear Mixed Models For ordinal targets, the predicted probabilities are cumulative probabilities 14


15 Improved Analytics Non-graphical method of model specification in IBM SPSS Amos Improves accessibility Useful for large, complicated models Helpful if you need to generate a lot of similar models that differ only in some details. 15

16 Increase Productivity Faster tables output No longer have to wait while the output table renders Goal is to be 5x faster that existing tabular generation Other faster activities activation, pivoting, printing, exporting. From 3 to 30 times faster. Tables are interactive and fully editable Can be exported to other applications Scriptable 16

17 Increased Productivity Running server jobs disconnected Disconnect Statistics Client from the network Work uninterrupted or leave for the day, without sacrificing the successful processing of their jobs (including getting output) on the Server 17


18 Increased Productivity Improved file saving and sorting The Save is performed within the sort command without taking extra passes Brazilian Portuguese user interface 18


19 DEMONSTRATION Source: If applicable, describe source origin 19

20 QUESTIONS 20

MicroStrategy Desktop
 MicroStrategy Desktop Quick Start Guide MicroStrategy Desktop is designed to enable business professionals like you to explore data, simply and without needing direct support from IT. 1 Import data from
WebFOCUS RStat. RStat. Predict the Future and Make Effective Decisions Today. WebFOCUS RStat
 Information Builders enables agile information solutions with business intelligence (BI) and integration technologies. WebFOCUS the most widely utilized business intelligence platform connects to any enterprise
Quick Start Guide. Microsoft Access 2013 looks different from previous versions, so we created this guide to help you minimize the learning curve.
 Quick Start Guide Microsoft Access 2013 looks different from previous versions, so we created this guide to help you minimize the learning curve. Change the screen size or close a database Click the Access
Data exploration with Microsoft Excel: analysing more than one variable
 Data exploration with Microsoft Excel: analysing more than one variable Contents 1 Introduction... 1 2 Comparing different groups or different variables... 2 3 Exploring the association between categorical
Technical white paper. www.la-con.com
 Business Intelligence applications developed with IBM s Cognos Technical white paper www.la-con.com Table of contents: BUSINESS INTELLIGENCE 3 SUCCEED BI 3 LIFELINE 4 REPORT AND CHART FEATURES 5 2 Business
MANUAL of the DASHBOARD of SUSTAINABILITY
 MANUAL of the DASHBOARD of SUSTAINABILITY Short introduction to the dashboard... 1 Dashboard installation... 3 Main view options of the dashboard... 3 Four pie-charts view... 4 Rankings view... 4 Linkage
Beyond Traditional Management Reporting. 2013 IBM Corporation
 Beyond Traditional Management Reporting 1 Agenda From Reporting to Business Analytics Expanding your capabilities set Workspace Authoring Statistical Analysis Predictive Modeling What-if analysis and planning
CHAPTER 11: SALES REPORTING
 Chapter 11: Sales Reporting CHAPTER 11: SALES REPORTING Objectives Introduction The objectives are: Understand the tools you use to evaluate sales data. Use default sales productivity reports to review
Data Visualization Handbook
 SAP Lumira Data Visualization Handbook www.saplumira.com 1 Table of Content 3 Introduction 20 Ranking 4 Know Your Purpose 23 Part-to-Whole 5 Know Your Data 25 Distribution 9 Crafting Your Message 29 Correlation
Dealing with continuous variables and geographical information in non life insurance ratemaking. Maxime Clijsters
 Dealing with continuous variables and geographical information in non life insurance ratemaking Maxime Clijsters Introduction Policyholder s Vehicle type (4x4 Y/N) Kilowatt of the vehicle Age Age of the
Our Raison d'être. Identify major choice decision points. Leverage Analytical Tools and Techniques to solve problems hindering these decision points
 Analytic 360 Our Raison d'être Identify major choice decision points Leverage Analytical Tools and Techniques to solve problems hindering these decision points Empowerment through Intelligence Our Suite
TIBCO Spotfire Business Author Essentials Quick Reference Guide. Table of contents:
 Table of contents: Access Data for Analysis Data file types Format assumptions Data from Excel Information links Add multiple data tables Create & Interpret Visualizations Table Pie Chart Cross Table Treemap
Excel Charts & Graphs
 MAX 201 Spring 2008 Assignment #6: Charts & Graphs; Modifying Data Due at the beginning of class on March 18 th Introduction This assignment introduces the charting and graphing capabilities of SPSS and
What is GIS. What is GIS? University of Tsukuba. What do you image of GIS? Copyright(C) ESRI Japan Corporation. All rights reserved.
 ESRI Japan Corporation. All rights reserved.") What is GIS University of Tsukuba Graduate School of Life and Environmental Science April 21 st, 2011 What is GIS? What do you image of GIS? Gas Insulated Switch Groupe Interventional Speciale Geographic
What is GIS University of Tsukuba Graduate School of Life and Environmental Science April 21 st, 2011 What is GIS? What do you image of GIS? Gas Insulated Switch Groupe Interventional Speciale Geographic
IBM Social Media Analytics
 IBM Social Media Analytics Analyze social media data to better understand your customers and markets Highlights Understand consumer sentiment and optimize marketing campaigns. Improve the customer experience
Advanced analytics at your hands
 2.3 Advanced analytics at your hands Neural Designer is the most powerful predictive analytics software. It uses innovative neural networks techniques to provide data scientists with results in a way previously
Market Pricing Override
 Market Pricing Override MARKET PRICING OVERRIDE Market Pricing: Copy Override Market price overrides can be copied from one match year to another Market Price Override can be accessed from the Job Matches
Silvermine House Steenberg Office Park, Tokai 7945 Cape Town, South Africa Telephone: +27 21 702 4666 www.spss-sa.com
 SPSS-SA Silvermine House Steenberg Office Park, Tokai 7945 Cape Town, South Africa Telephone: +27 21 702 4666 www.spss-sa.com SPSS-SA Training Brochure 2009 TABLE OF CONTENTS 1 SPSS TRAINING COURSES FOCUSING
VERSION NINE. Be A Better Auditor. You Have The Knowledge. We Have The Tools. NEW FEATURES AND ENHANCEMENTS
 VERSION NINE Be A Better Auditor. You Have The Knowledge. We Have The Tools. NEW FEATURES AND ENHANCEMENTS IDEA VERSION NINE NEW FEATURES ENHANCEMENTS CaseWare, the global leader in audit analytics software,
Combination Chart Extensible Visualizations. Product: IBM Cognos Business Intelligence Area of Interest: Reporting
 Combination Chart Extensible Visualizations Product: IBM Cognos Business Intelligence Area of Interest: Reporting Combination Chart Extensible Visualizations 2 Copyright and Trademarks Licensed Materials
ecw Weekly Users Tip: My Settings: Template-Friendly Settings & My Favorites: Templates
 ecw Weekly Users Tip: My Settings: Template-Friendly Settings & My Favorites: Templates Templates, regardless of how basic or how comprehensive, can make your notes overwhelming and visually harder to
Data Mining mit der JMSL Numerical Library for Java Applications
 Data Mining mit der JMSL Numerical Library for Java Applications Stefan Sineux 8. Java Forum Stuttgart 07.07.2005 Agenda Visual Numerics JMSL TM Numerical Library Neuronale Netze (Hintergrund) Demos Neuronale
Create Cool Lumira Visualization Extensions with SAP Web IDE Dong Pan SAP PM and RIG Analytics Henry Kam Senior Product Manager, Developer Ecosystem
 Create Cool Lumira Visualization Extensions with SAP Web IDE Dong Pan SAP PM and RIG Analytics Henry Kam Senior Product Manager, Developer Ecosystem 2015 SAP SE or an SAP affiliate company. All rights
SalesLogix Advanced Analytics
 SalesLogix Advanced Analytics SalesLogix Advanced Analytics Benefits Snapshot Increase organizational and customer intelligence by analyzing data from across your business. Make informed business decisions
Easily Identify Your Best Customers
 IBM SPSS Statistics Easily Identify Your Best Customers Use IBM SPSS predictive analytics software to gain insight from your customer database Contents: 1 Introduction 2 Exploring customer data Where do
ALTAIR SOFTWARE ASSET OPTIMIZATION USER GUIDE
 ALTAIR SOFTWARE ASSET OPTIMIZATION USER GUIDE Table Of Contents What is Altair SAO?... 6 System Architecture... 7 Report Navigation Chart... 8 Report Navigation Chart Dashboard... 9 Report Navigation Chart
What s New in SPSS 16.0
 SPSS 16.0 New capabilities What s New in SPSS 16.0 SPSS Inc. continues its tradition of regularly enhancing this family of powerful but easy-to-use statistical software products with the release of SPSS
for Sage 100 ERP Business Insights Overview Document
 for Sage 100 ERP Business Insights Document 2012 Sage Software, Inc. All rights reserved. Sage Software, Sage Software logos, and the Sage Software product and service names mentioned herein are registered
More Than a Map: Location Intelligence with SAS Visual Analytics Falko Schulz and Anand Chitale, SAS Institute Inc., Cary, NC
 Paper SAS021-2014 More Than a Map: Location Intelligence with SAS Visual Analytics Falko Schulz and Anand Chitale, SAS Institute Inc., Cary, NC ABSTRACT More organizations are understanding the importance
The power of IBM SPSS Statistics and R together
 IBM Software Business Analytics SPSS Statistics The power of IBM SPSS Statistics and R together 2 Business Analytics Contents 2 Executive summary 2 Why integrate SPSS Statistics and R? 4 Integrating R
INTRODUCING ORACLE APPLICATION EXPRESS. Keywords: database, Oracle, web application, forms, reports
 INTRODUCING ORACLE APPLICATION EXPRESS Cristina-Loredana Alexe 1 Abstract Everyone knows that having a database is not enough. You need a way of interacting with it, a way for doing the most common of
DataPA OpenAnalytics End User Training
 DataPA OpenAnalytics End User Training DataPA End User Training Lesson 1 Course Overview DataPA Chapter 1 Course Overview Introduction This course covers the skills required to use DataPA OpenAnalytics
Quick Start. Creating a Scoring Application. RStat. Based on a Decision Tree Model
 Creating a Scoring Application Based on a Decision Tree Model This Quick Start guides you through creating a credit-scoring application in eight easy steps. Quick Start Century Corp., an electronics retailer,
Consumption of OData Services of Open Items Analytics Dashboard using SAP Predictive Analysis
 Consumption of OData Services of Open Items Analytics Dashboard using SAP Predictive Analysis (Version 1.17) For validation Document version 0.1 7/7/2014 Contents What is SAP Predictive Analytics?... 3
Best Practices in Data Visualizations. Vihao Pham January 29, 2014
 Best Practices in Data Visualizations Vihao Pham January 29, 2014 Agenda Best Practices in Data Visualizations Why We Visualize Understanding Data Visualizations Enhancing Visualizations Visualization
Best Practices in Data Visualizations. Vihao Pham 2014
 Best Practices in Data Visualizations Vihao Pham 2014 Agenda Best Practices in Data Visualizations Why We Visualize Understanding Data Visualizations Enhancing Visualizations Visualization Considerations
Get to Know the IBM SPSS Product Portfolio
 IBM Software Business Analytics Product portfolio Get to Know the IBM SPSS Product Portfolio Offering integrated analytical capabilities that help organizations use data to drive improved outcomes 123
Welcome to the delta topic on adding actions to dashboards in SAP Business One, release 9.1 version for SAP HANA.
 Welcome to the delta topic on adding actions to dashboards in SAP Business One, release 9.1 version for SAP HANA. 1 In this topic, you will learn how to design a pervasive dashboard for the HTML5 (or role-based)
TIBCO Spotfire Web Player Release Notes
 Software Release 7.0 February 2015 Two-Second Advantage 2 Important Information SOME TIBCO SOFTWARE EMBEDS OR BUNDLES OTHER TIBCO SOFTWARE. USE OF SUCH EMBEDDED OR BUNDLED TIBCO SOFTWARE IS SOLELY TO ENABLE
R Graphics Cookbook. Chang O'REILLY. Winston. Tokyo. Beijing Cambridge. Farnham Koln Sebastopol
 R Graphics Cookbook Winston Chang Beijing Cambridge Farnham Koln Sebastopol O'REILLY Tokyo Table of Contents Preface ix 1. R Basics 1 1.1. Installing a Package 1 1.2. Loading a Package 2 1.3. Loading a
Figure 1. An embedded chart on a worksheet.
 8. Excel Charts and Analysis ToolPak Charts, also known as graphs, have been an integral part of spreadsheets since the early days of Lotus 1-2-3. Charting features have improved significantly over the
Automating FP&A Analytics Using SAP Visual Intelligence and Predictive Analysis
 September 9 11, 2013 Anaheim, California Automating FP&A Analytics Using SAP Visual Intelligence and Predictive Analysis Varun Kumar Learning Points Create management insight tool using SAP Visual Intelligence
Using the Bluemix Analytics for Hadoop Service to Analyse Data
 Lab 1: Using the Bluemix Analytics for Hadoop Service to Analyse Data Using the Bluemix Analytics for Hadoop Service to Analyse Data Hands-On Lab Lab 1: Using the Bluemix Analytics for Hadoop Service to
IBM SPSS Statistics 20 Part 4: Chi-Square and ANOVA
 CALIFORNIA STATE UNIVERSITY, LOS ANGELES INFORMATION TECHNOLOGY SERVICES IBM SPSS Statistics 20 Part 4: Chi-Square and ANOVA Summer 2013, Version 2.0 Table of Contents Introduction...2 Downloading the
Create Mobile, Compelling Dashboards with Trusted Business Warehouse Data
 SAP Brief SAP BusinessObjects Business Intelligence s SAP BusinessObjects Design Studio Objectives Create Mobile, Compelling Dashboards with Trusted Business Warehouse Data Increase the value of data with
The Microsoft Access 2007 Screen
 1 of 1 Office Button The Microsoft Access 2007 Screen Title Bar Help Ribbon Quick Access Toolbar Database Components Active Component NOTE: THIS HELP DOCUMENT EXPLAINS THE LAYOUT OF ACCESS. FOR MORE INFORMATION
Data representation and analysis in Excel
 Page 1 Data representation and analysis in Excel Let s Get Started! This course will teach you how to analyze data and make charts in Excel so that the data may be represented in a visual way that reflects
When to use Excel. When NOT to use Excel 9/24/2014
 Analyzing Quantitative Assessment Data with Excel October 2, 2014 Jeremy Penn, Ph.D. Director When to use Excel You want to quickly summarize or analyze your assessment data You want to create basic visual
Reporting. Microsoft Dynamics GP 2010. enterpri se. Dynamics GP. Christopher Liley. Create and manage business reports with.
 Microsoft Dynamics GP 2010 Reporting Create and manage business reports with Dynamics GP David Duncan Christopher Liley [ PUBLISHING J enterpri se - BIRMINGHAM MUMBAI Preface 1 Chapter 1: Meeting the Reporting
PROJECTS. onepoint PROJECTS 13. Group Server and. Enterprise Cloud/Server. Tutorial
 onepoint PROJECTS 13 Group Server and Enterprise Cloud/Server Tutorial 1 1 Introduction onepoint PROJECTS is the first open source project leadership software integrating project planning, controlling,
Instructions for SPSS 21
 1 Instructions for SPSS 21 1 Introduction... 2 1.1 Opening the SPSS program... 2 1.2 General... 2 2 Data inputting and processing... 2 2.1 Manual input and data processing... 2 2.2 Saving data... 3 2.3
SAP Crystal Solutions. What s New in SAP Crystal Dashboard Design Create Superior Data Visualizations Faster with New Features
 SAP Crystal Solutions What s New in SAP Crystal Dashboard Design Create Superior Data Visualizations Faster with New Features CONTENT 4 Key Features of SAP Crystal Dashboard Design 4 New in SAP Crystal
Application Express Web Application Development
 Application Express Web Application Development Agenda What is Oracle Application Express Demonstration Features and benefits Customer examples Conclusion Next steps Q&A Does Your Organization: Use spreadsheets
IBM SPSS Direct Marketing 23
 IBM SPSS Direct Marketing 23 Note Before using this information and the product it supports, read the information in Notices on page 25. Product Information This edition applies to version 23, release
Microsoft Excel 2010 Pivot Tables
 Microsoft Excel 2010 Pivot Tables Email: [email protected] Web Page: http://training.health.ufl.edu Microsoft Excel 2010: Pivot Tables 1.5 hours Topics include data groupings, pivot tables, pivot
Using Excel in Research. Hui Bian Office for Faculty Excellence
 Using Excel in Research Hui Bian Office for Faculty Excellence Data entry in Excel Directly type information into the cells Enter data using Form Command: File > Options 2 Data entry in Excel Tool bar:
IBM SPSS Direct Marketing 22
 IBM SPSS Direct Marketing 22 Note Before using this information and the product it supports, read the information in Notices on page 25. Product Information This edition applies to version 22, release
SPSS (Statistical Package for the Social Sciences)
") SPSS (Statistical Package for the Social Sciences) What is SPSS? SPSS stands for Statistical Package for the Social Sciences The SPSS home-page is: www.spss.com 2 What can you do with SPSS? Run Frequencies
SPSS (Statistical Package for the Social Sciences) What is SPSS? SPSS stands for Statistical Package for the Social Sciences The SPSS home-page is: www.spss.com 2 What can you do with SPSS? Run Frequencies
Better decision making under uncertain conditions using Monte Carlo Simulation
 IBM Software Business Analytics IBM SPSS Statistics Better decision making under uncertain conditions using Monte Carlo Simulation Monte Carlo simulation and risk analysis techniques in IBM SPSS Statistics
Creating Web and Mobile Maps Using ArcGIS Online. SCO Technical Paper
 Creating Web and Mobile Maps Using ArcGIS Online SCO Technical Paper Version History Version Date Notes Author/Contact 1.0 February, 2012 Initial document created. John J Czaplewski Copyright 2012 The
Microsoft Axapta Financial Management consists of several individually packaged offerings: Microsoft Axapta Financials I and Financials II
 Microsoft Business Solutions Axapta Financial Management helps you effectively increase your business while maintaining control over your financial management processes. Key Benefits: Helps you increase
Microsoft SharePoint 2010 End User Quick Reference Card
 Microsoft SharePoint 2010 End User Quick Reference Card Microsoft SharePoint 2010 brings together the people, documents, information, and ideas of the University into a customizable workspace where everyone
From The Little SAS Book, Fifth Edition. Full book available for purchase here.
 From The Little SAS Book, Fifth Edition. Full book available for purchase here. Acknowledgments ix Introducing SAS Software About This Book xi What s New xiv x Chapter 1 Getting Started Using SAS Software
Quick and Easy Web Maps with Google Fusion Tables. SCO Technical Paper
 Quick and Easy Web Maps with Google Fusion Tables SCO Technical Paper Version History Version Date Notes Author/Contact 1.0 July, 2011 Initial document created. Howard Veregin 1.1 Dec., 2011 Updated to
GIS III: GIS Analysis Module 1a: Network Analysis Tools
 *** Files needed for exercise: MI_ACS09_cty.shp; USBusiness09_MI.dbf; MI_ACS09_trt.shp; and streets.sdc (provided by Street Map USA) Goals: To learn how to use the Network Analyst tools to perform network-based
An Introduction to SAS Enterprise Miner and SAS Forecast Server. André de Waal, Ph.D. Analytical Consultant
 SAS Analytics Day An Introduction to SAS Enterprise Miner and SAS Forecast Server André de Waal, Ph.D. Analytical Consultant Agenda 1. Introduction to SAS Enterprise Miner 2. Basics 3. Enterprise Miner
GIS III: GIS Analysis Module 2a: Introduction to Network Analyst
 *** Files needed for exercise: nc_cty.shp; target_stores_infousa.dbf; streets.sdc (provided by street map usa); NC_tracts_2000sf1.shp Goals: To learn how to use the Network analyst tools to perform network
A GENERAL TAXONOMY FOR VISUALIZATION OF PREDICTIVE SOCIAL MEDIA ANALYTICS
 A GENERAL TAXONOMY FOR VISUALIZATION OF PREDICTIVE SOCIAL MEDIA ANALYTICS Stacey Franklin Jones, D.Sc. ProTech Global Solutions Annapolis, MD Abstract The use of Social Media as a resource to characterize
An introduction to IBM SPSS Statistics
 An introduction to IBM SPSS Statistics Contents 1 Introduction... 1 2 Entering your data... 2 3 Preparing your data for analysis... 10 4 Exploring your data: univariate analysis... 14 5 Generating descriptive
IBM Cognos Statistics
 Cognos 10 Workshop Q2 2011 IBM Cognos Statistics Business Analytics software Cognos 10 Spectrum of Business Analytics Users Personas Capabilities IT Administrators Capabilities : Administration, Framework
Tutorial: Get Running with Amos Graphics
 Tutorial: Get Running with Amos Graphics Purpose Remember your first statistics class when you sweated through memorizing formulas and laboriously calculating answers with pencil and paper? The professor
Arena Tutorial 1. Installation STUDENT 2. Overall Features of Arena
 Arena Tutorial This Arena tutorial aims to provide a minimum but sufficient guide for a beginner to get started with Arena. For more details, the reader is referred to the Arena user s guide, which can
NEXT Analytics Business Intelligence User Guide
 NEXT Analytics Business Intelligence User Guide This document provides an overview of the powerful business intelligence functions embedded in NEXT Analytics v5. These functions let you build more useful
Withdrawal Tracker: Analysis and Reporting Tool
 Withdrawal Tracker: Analysis and Reporting Tool Contents Contents... 1 Introduction... 2 Accessing the Application... 2 General... 2 Data... 2 Colours... 2 Standard Filters... 3 YTD Filters... 3 Location
BAT Smart View for Budget Users. Miami-Dade County. BAT Smart View Training Activity Guide
 Miami-Dade County BAT Smart View Training Activity Guide 1 Table of Contents Activity 1: Launch Microsoft Excel, Check User Options and Use the Connection Panel.... 3 Activity 2: Opening BAT Web Forms
The following are two things that cannot be done with a lead until it has been converted to a prospect or account:
 Customer Management Work with the Leads Database & Lead Entry The Oasis-CRM Leads Database is quarantined from the main Oasis-CRM accounts and contacts database until they are converted to a prospect or
SAS VISUAL ANALYTICS AN OVERVIEW OF POWERFUL DISCOVERY, ANALYSIS AND REPORTING
 SAS VISUAL ANALYTICS AN OVERVIEW OF POWERFUL DISCOVERY, ANALYSIS AND REPORTING WELCOME TO SAS VISUAL ANALYTICS SAS Visual Analytics is a high-performance, in-memory solution for exploring massive amounts
Introduction to SPSS 16.0
 Introduction to SPSS 16.0 Edited by Emily Blumenthal Center for Social Science Computation and Research 110 Savery Hall University of Washington Seattle, WA 98195 USA (206) 543-8110 November 2010 http://julius.csscr.washington.edu/pdf/spss.pdf
IBM SPSS Data Preparation 22
 IBM SPSS Data Preparation 22 Note Before using this information and the product it supports, read the information in Notices on page 33. Product Information This edition applies to version 22, release
Using SPSS, Chapter 2: Descriptive Statistics
 1 Using SPSS, Chapter 2: Descriptive Statistics Chapters 2.1 & 2.2 Descriptive Statistics 2 Mean, Standard Deviation, Variance, Range, Minimum, Maximum 2 Mean, Median, Mode, Standard Deviation, Variance,
9.2 User s Guide SAS/STAT. Introduction. (Book Excerpt) SAS Documentation
 SAS Documentation") SAS/STAT Introduction (Book Excerpt) 9.2 User s Guide SAS Documentation This document is an individual chapter from SAS/STAT 9.2 User s Guide. The correct bibliographic citation for the complete manual
SAS/STAT Introduction (Book Excerpt) 9.2 User s Guide SAS Documentation This document is an individual chapter from SAS/STAT 9.2 User s Guide. The correct bibliographic citation for the complete manual
Predictive analytics with System z
 Predictive analytics with System z Faster, broader, more cost effective access to critical insights Highlights Optimizes high-velocity decisions that can consistently generate real business results Integrates
RESCO MOBILE CRM USER GUIDE. Access your CRM data on any mobile platform ipad, iphone, Android, Windows Phone or Win XP/Vista/7/8
 RESCO MOBILE CRM USER GUIDE Access your CRM data on any mobile platform ipad, iphone, Android, Windows Phone or Win XP/Vista/7/8 Contents Synchronization... 1 1.1. How to synchronize your device... 1 1.2.
Accountable Care Organization Quality Explorer. Quick Start Guide
 Accountable Care Organization Quality Explorer Quick Start Guide 1 P age Background HealthLandscape (a division of the American Academy of Family Physicians [AAFP]) and the Robert Graham Center for Policy
WebSphere Business Monitor
 WebSphere Business Monitor Dashboards 2010 IBM Corporation This presentation should provide an overview of the dashboard widgets for use with WebSphere Business Monitor. WBPM_Monitor_Dashboards.ppt Page
Introduction Course in SPSS - Evening 1
 ETH Zürich Seminar für Statistik Introduction Course in SPSS - Evening 1 Seminar für Statistik, ETH Zürich All data used during the course can be downloaded from the following ftp server: ftp://stat.ethz.ch/u/sfs/spsskurs/
ArcGIS online Introduction... 2. Module 1: How to create a basic map on ArcGIS online... 3. Creating a public account with ArcGIS online...
 Table of Contents ArcGIS online Introduction... 2 Module 1: How to create a basic map on ArcGIS online... 3 Creating a public account with ArcGIS online... 3 Opening a Map, Adding a Basemap and then Saving
Tutorial: Get Running with Amos Graphics
 Tutorial: Get Running with Amos Graphics Purpose Remember your first statistics class when you sweated through memorizing formulas and laboriously calculating answers with pencil and paper? The professor
Practical applications of Predictive Modelling Overview of the process, the techniques and the applications
 Practical applications of Predictive Modelling Overview of the process, the techniques and the applications Jean-Yves Rioux CIA 2014 Annual Meeting, June 19, 2014 Agenda What it is and why do it 2 Process
DASHBOARD VISUALIZATIONS IN ORACLE BAM 12.1.3 ORACLE WHITE PAPER SEPTEMBER 2014
 DASHBOARD VISUALIZATIONS IN ORACLE BAM 12.1.3 ORACLE WHITE PAPER SEPTEMBER 2014 Disclaimer The following is intended to outline our general product direction. It is intended for information purposes only,