Practical Analysis of Proteome Data Using Bioinformatics and Statistics
|
|
|
- Ashley Newton
- 10 years ago
- Views:
Transcription
1 Practical Analysis of Proteome Data Using Bioinformatics and Statistics Simon Barkow-Oesterreicher Functional Genomics Center Zurich Dr. Jonas Grossmann Functional Genomics Center Zurich 1

2 Outline Challenges in proteomics data analysis Protein identification --> visualization and validation Scaffold software More than one search engine Quantitative proteomics Beyond protein lists --> Pathway mapping, over-representation 2

3 Challenges in Proteomics Sample are usually very complex -> proteins differ widely (size, 3D-structure, chemical groups) -> dynamic range (different abundances) of proteins (e.g. Rubisco in plants makes up to 50% of the total protein amount in green tissues) Unlike in transcriptomics, only most abundant proteins are detected Because of complexity, samples are usually fractionated (no clear cut) Random-component in DDA experiments (data dependent acquisition) makes reproducibility challenging Genomic sequence and annotation (predicted proteins) is essential Mass spectrometers are complex machines and do not perform always as good (day-to-day variation) 3
 Random-component in DDA experiments (data dependent acquisition) makes reproducibility challenging")
4 Protein Identification Algorithms (using protein sequence databases) wet lab b-ions y-ions tryps 1st MS selection 2nd MS protein of interest peptides of convenient size MS spectrum fragmentation MS/MS spectrum in silico >Ath_Chr1 ACGTTTAG GAGTTAGG ACCACCA genome sequence gene prediction >At1g1120 >At1g1110 MDASISTOK MDASISTALK ADELIKAPPL ADELIKAPPL EISTK EISTK protein sequences MPVCLLSTVK MDASISTALK ELIK ADELIK APPLEISTK APPLEISTK in silico tryptic Peptides in silico theoretical sectrum Scheme for protein identification... describe all quite in detail!! 4

5 Protein Identification Algorithms (using protein sequence databases) wet lab b-ions y-ions tryps 1st MS selection 2nd MS protein of interest peptides of convenient size MS spectrum fragmentation MS/MS spectrum in silico >Ath_Chr1 ACGTTTAG GAGTTAGG ACCACCA genome sequence gene prediction >At1g1120 >At1g1110 MDASISTOK MDASISTALK ADELIKAPPL ADELIKAPPL EISTK EISTK protein sequences MPVCLLSTVK MDASISTALK ELIK ADELIK APPLEISTK APPLEISTK in silico tryptic Peptides in silico theoretical sectrum Scheme for protein identification... describe all quite in detail!! 4

6 Protein Identification Algorithms (using protein sequence databases) wet lab b-ions y-ions tryps 1st MS selection 2nd MS protein of interest peptides of convenient size MS spectrum fragmentation MS/MS spectrum in silico >Ath_Chr1 ACGTTTAG GAGTTAGG ACCACCA genome sequence gene prediction >At1g1120 >At1g1110 MDASISTOK MDASISTALK ADELIKAPPL ADELIKAPPL EISTK EISTK protein sequences MPVCLLSTVK MDASISTALK ELIK ADELIK APPLEISTK APPLEISTK in silico tryptic Peptides in silico theoretical sectrum Scheme for protein identification... peptide identification 4 protein inference describe all quite in detail!!

7 Peptide Identification An example: human mitogen-activated protein kinase-8 (MAPK8), 427 aa MS-compatible peptides tryptic & in MS range (mass) observed peptides good flight properties proteotypic peptides unambigous & observed frequently One example of a protein... MAPK8 from human... 5 Nat Rev Mol Cell Biol, 6(7):577 83, 2005 Nat Biotechnol, 25: , 2007 when we check which tryptic peptides are in the range of the MS it looks like this... (colored means... MS-compatible) next... Which peptides are actually observed... because they have a good flight properties... and finally... which are unambigous and frequently observed
 next... Which peptides are actually observed... because they have a good flight properties... and finally.")
8 Peptide Identification An example: human mitogen-activated protein kinase-8 (MAPK8), 427 aa MS-compatible peptides tryptic & in MS range (mass) observed peptides good flight properties proteotypic peptides unambigous & observed frequently One example of a protein... MAPK8 from human... 5 Nat Rev Mol Cell Biol, 6(7):577 83, 2005 Nat Biotechnol, 25: , 2007 when we check which tryptic peptides are in the range of the MS it looks like this... (colored means... MS-compatible) next... Which peptides are actually observed... because they have a good flight properties... and finally... which are unambigous and frequently observed
 next... Which peptides are actually observed... because they have a good flight properties... and finally.")
9 Peptide Identification An example: human mitogen-activated protein kinase-8 (MAPK8), 427 aa MS-compatible peptides tryptic & in MS range (mass) observed peptides good flight properties proteotypic peptides unambigous & observed frequently One example of a protein... MAPK8 from human... 5 Nat Rev Mol Cell Biol, 6(7):577 83, 2005 Nat Biotechnol, 25: , 2007 when we check which tryptic peptides are in the range of the MS it looks like this... (colored means... MS-compatible) next... Which peptides are actually observed... because they have a good flight properties... and finally... which are unambigous and frequently observed
 next... Which peptides are actually observed... because they have a good flight properties... and finally.")
10 Output after peptide identification step An incomplete list of peptides which were presumably in the sample The identified peptides point to corresponding proteins Some peptides are ambiguous (protein inference problem) Some proteins are identified with several peptides, others only with a single peptide The peptides and also the proteins have some score associated with them how well they are identified 6

11 Why validate? Every database search generates false positives and false negatives Search Algorithm Prediction True False Downstream steps can cost a lot of time and money True True Positive False Negative Get the most accurate protein hit list with a known false discovery rate (FDR) Reality False False True Positive Negative 7

12 FPR vs FDR False positive rate (FPR): e.g. FPR = 5% means that on average 5% of the true false in the study will be called positive total 500 true positives false means 500 false positives (50% of total positives) False discovery rate (FDR): e.g FDR = 5% means that among all the features called positive, 5% are true negatives on average. 500 positves, 25 false positives (5%) source: 8 PNAS; Storey and Tibshirani 100 (16): (2003) There is a confusion in the proteomics-community -> FDR and FPR are often used for the same thing.. and as biologists sometimes are not too picky this leads to this confusion --> so here a definition in words.
 source: 8 PNAS; Storey and Tibshirani 100 (16): 9440.")
13 Validation of Peptide Identification & Protein inference Protein Prophet Peptide Prophet From Nesvizhskii et al, Anal. Chem.2003, 75, Simon Barkow & Jonas Grossmann FGCZ Proteomics

14 Validation of Peptide Identification & Protein inference Protein Prophet Issue #1 Peptide Prophet From Nesvizhskii et al, Anal. Chem.2003, 75, Simon Barkow & Jonas Grossmann FGCZ Proteomics

15 Peptide validation by algorithm Key question: how to determine which identifications are valid Typical method: accept all identifications above a chosen discriminant score of a search engine (e. g. Mascot Ion Score) Choosing an threshold is problematic, depending on sample, search database, etc. Use a validation algorithm that is based on experience: PeptideProphet 10
 Choosing an threshold is problematic, depending on sample, search")
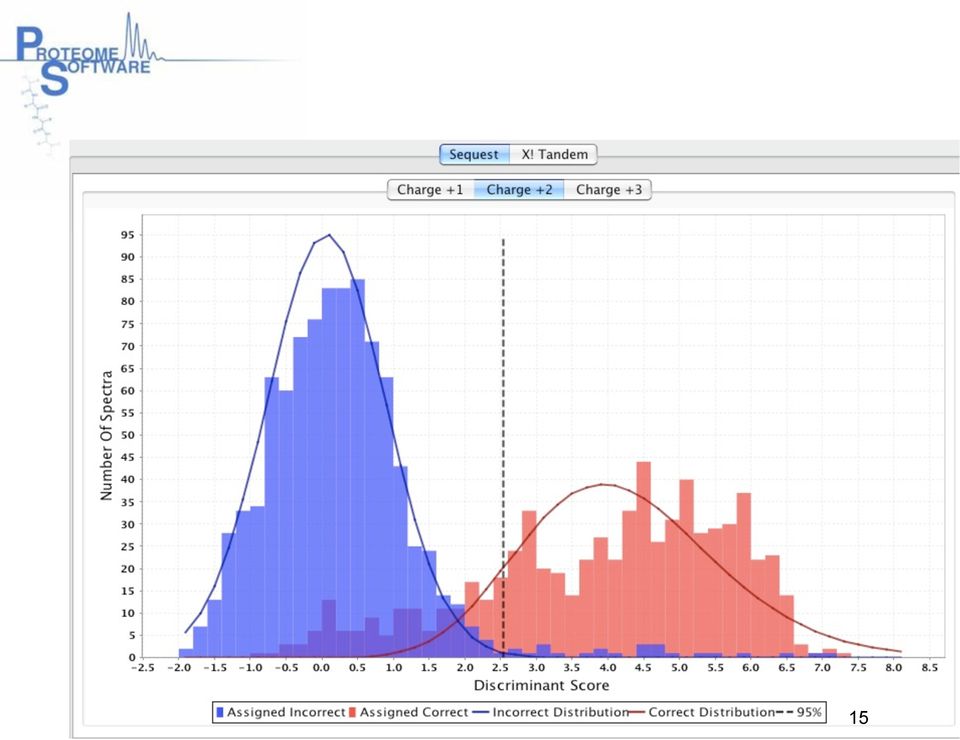
16 Histogram of scores Once the discriminant scores for all the spectra in a sample are calculated, Peptide Prophet makes a histogram of these discriminant scores. For example, in the sample shown here, 70 spectra have scores around 2.5. Number of spectra in each bin Discriminant score (D) 11

17 Number of spectra in each bin Mixture of distributions incorrect This histogram shows the distributions of correct This Histogram and incorrect shows matches. the standard PeptideProphet distributions of assumes correct and that these incorrect distributions matches, validated are standard manually statistical in a distributions. sample with a known set of 18 proteins. Using curve-fitting, PeptideProphet draws the correct and incorrect distributions. correct Discriminant score (D) 12

18 Number of spectra in each bin Bayesian statistics incorrect Once correct and incorrect distributions are drawn, PeptideProphet uses Bayesian statistics to compute the probability p(+ D) that a match is correct, given a discriminant score D. correct Discriminant score (D) 13

19 Probability of a correct match The statistical formula looks fierce, but relating it to the histogram shows that the prob of a score of 2.5 being correct is Number of spectra in each bin incorrect correct Discriminant score (D) 14

20 15
21 How to get even more confidence? Compare peptide patterns seen in each replicate for the same protein Manually examine the spectrum for critical or characteristic fragment ions (especially single hits) Compare scores from various search engines (Mascot, SEQUEST, x!tandem, etc.) Compare other characteristics for identified peptides (NTT, MCS...) 16
22 Peptide Prophet features Combines database search scores Number of tryptic termini (NTT) Number of missed cleavage sites (NMC) Mass difference between theoretical mass and measured mass Peptide retention time (expected vs measured) 17
23 Scaffold Workflow 18
24 Experimental Design Three hierachies: 1. Sample Category: disease vs. control, treated vs, untreated, etc. 2. Biosample: drop of blood, tissue sample, etc. 3. MS Sample: each individual spot (MALDI), or one LC fraction 19
25 Scaffold Sample Window Overview for comparisons Lists and summarizes the proteins identified in each biosample or MS sample Identification probability Number of unique peptides on which the identification is based Percentage of the total spectra that this number represents Number of unique spectra associated with this protein 20
26 Scaffold Protein Window All Information about a single protein Sequence coverage for this and similar proteins Peptide sequence, with identified peptides highlighted in yellow and modifications highlighted in green The spectra used to identify each peptide Lots of data about the Peptides that can be revised to get confidence 21
27 Scaffold Quantify Window View spectral count numbers for biosamples (same color) and categories (different color) Scatterplots pane shows degree of error associated with the spectral count Venn diagram shows relationship between categories of proteins, unique peptides, or unique spectra identifications GO (Gene Ontology) mesh terms pane 22
28 Scaffold Statistics Window Check whether your data meets Scaffold s assumptions Statistical information for each MS sample in your analysis Relationship between peptide and protein probabilities Histogram demonstrating correct and incorrect peptide assignments (used by the Peptide Prophet) Scatterplot comparing two or more search engine results 23
29 Search Algorithms 24
30 Search Algorithms MASCOT SEQUEST X!TANDEM OMSSA Spectrum Mill 24
31 Search Algorithms MASCOT SEQUEST X!TANDEM OMSSA Spectrum Mill All of them can be combined with Scaffold 24
32 Why Overlap Small The reason that they identify different spectra is because each program has different strengths. SEQUEST 9% considers intensities 22% 4% 34% X!Tandem semi-tryptic, no neutral loss fragments 19% 7% 5% Mascot probability based scoring 25
33 Decoy searches applicable everywhere >sp Q4U9M9 104K_THEAN 104 kda microneme/rhoptry antigen OS=Theileria annulata GN=TA08425 PE=3 SV=1 MKFLVLLFNILCLFPILGADELVMSPIPTTDVQPKVTFDINSEVSSGPLYLNPVEMAGVK YLQLQRQPGVQVHKVVEGDIVIWENEEMPLYTCAIVTQNEVPYMAYVELLEDPDLIFFLK EGDQWAPIPEDQYLARLQQLRQQIHTESFFSLNLSFQHENYKYEMVSSFQHSIKMVVFTP KNGHICKMVYDKNIRIFKALYNEYVTSVIGFFRGLKLLLLNIFVIDDRGMIGNKYFQLLD DKYAPISVQGYVATIPKLKDFAEPYHPIILDISDIDYVNFYLGDATYHDPGFKIVPKTPQ CITKVVDGNEVIYESSNPSVECVYKVTYYDKKNESMLRLDLNHSPPSYTSYYAKREGVWV TSTYIDLEEKIEELQDHRSTELDVMFMSDKDLNVVPLTNGNLEYFMVTPKPHRDIIIVFD GSEVLWYYEGLENHLVCTWIYVTEGAPRLVHLRVKDRIPQNTDIYMVKFGEYWVRISKTQ YTQEIKKLIKKSKKKLPSIEEEDSDKHGGPPKGPEPPTGPGHSSSESKEHEDSKESKEPK EHGSPKETKEGEVTKKPGPAKEHKPSKIPVYTKRPEFPKKSKSPKRPESPKSPKRPVSPQ RPVSPKSPKRPESLDIPKSPKRPESPKSPKRPVSPQRPVSPRRPESPKSPKSPKSPKSPK VPFDPKFKEKLYDSYLDKAAKTKETVTLPPVLPTDESFTHTPIGEPTAEQPDDIEPIEES VFIKETGILTEEVKTEDIHSETGEPEEPKRPDSPTKHSPKPTGTHPSMPKKRRRSDGLAL STTDLESEAGRILRDPTGKIVTMKRSKSFDDLTTVREKEHMGAEIRKIVVDDDGTEADDE DTHPSKEKHLSTVRRRRPRPKKSSKSSKPRKPDSAFVPSIIFIFLVSLIVGIL 26
34 Decoy searches applicable everywhere >sp REV_Q4U9M9 REV_104K_THEAN 104 kda microneme/rhoptry antigen OS=Theileria annulata GN=TA08425 PE=3 SV=1 LIGVILSVLFIFIISPVFASDPKRPKSSKSSKKPRPRRRRVTSLHKEKSPHTDEDDAETG DDDVVIKRIEAGMHEKERVTTLDDFSKSRKMTVIKGTPDRLIRGAESELDTTSLALGDSR RRKKPMSPHTGTPKPSHKTPSDPRKPEEPEGTESHIDETKVEETLIGTEKIFVSEEIPEI DDPQEATPEGIPTHTFSEDTPLVPPLTVTEKTKAAKDLYSDYLKEKFKPDFPVKPSKPSK PSKPSKPSEPRRPSVPRQPSVPRKPSKPSEPRKPSKPIDLSEPRKPSKPSVPRQPSVPRK PSKPSEPRKPSKSKKPFEPRKTYVPIKSPKHEKAPGPKKTVEGEKTEKPSGHEKPEKSEK SDEHEKSESSSHGPGTPPEPGKPPGGHKDSDEEEISPLKKKSKKILKKIEQTYQTKSIRV WYEGFKVMYIDTNQPIRDKVRLHVLRPAGETVYIWTCVLHNELGEYYWLVESGDFVIIID RHPKPTVMFYELNGNTLPVVNLDKDSMFMVDLETSRHDQLEEIKEELDIYTSTVWVGERK AYYSTYSPPSHNLDLRLMSENKKDYYTVKYVCEVSPNSSEYIVENGDVVKTICQPTKPVI KFGPDHYTADGLYFNVYDIDSIDLIIPHYPEAFDKLKPITAVYGQVSIPAYKDDLLQFYK NGIMGRDDIVFINLLLLKLGRFFGIVSTVYENYLAKFIRINKDYVMKCIHGNKPTFVVMK ISHQFSSVMEYKYNEHQFSLNLSFFSETHIQQRLQQLRALYQDEPIPAWQDGEKLFFILD PDELLEVYAMYPVENQTVIACTYLPMEENEWIVIDGEVVKHVQVGPQRQLQLYKVGAMEV PNLYLPGSSVESNIDFTVKPQVDTTPIPSMVLEDAGLIPFLCLINFLLVLFKM 26
35 1) Sequest & TPP, No decoy search, PeptideProphet > 0.9 # of proteins # of peps # of MS/MS fw proteins single hits REV proteins REV single hits Total: 3176 proteins 36% Overall ath % The regular procedure: -> only one search engine is taken into account (sometimes even without decoy db) --> TPP for statistical evaluation --> the difference between decoy & non_decoy searches.. -> a different fitting of the probability function results in a little bit more stringency on the cutoff in terms of fewer peptide identification 27
36 1) Sequest & TPP, No decoy search, PeptideProphet > 0.9 # of proteins # of peps # of MS/MS fw proteins single hits REV proteins REV single hits Total: 3176 proteins 2) Sequest & TPP, w/ decoy search, PeptideProphet > % Overall ath 801 Overall ath % # of proteins # of peps # of MS/MS fw proteins single hits REV proteins REV single hits FDR 3.76% 1.17% 0.68% Total: 2943 proteins 32% 3% 0% 64% 104 / ( ) 27 The regular procedure: -> only one search engine is taken into account (sometimes even without decoy db) --> TPP for statistical evaluation --> the difference between decoy & non_decoy searches.. -> a different fitting of the probability function results in a little bit more stringency on the cutoff in terms of fewer peptide identification
37 Decoy searches - Limitations Decoy searches can be applied everywhere BUT the calculation of FDRs only makes sense if a large number of proteins are identified (more than ~200) If the calculated FDR is very high.. there is a good chance that some search parameters are wrong or maybe some PTMs are not specified Reversed databases are favored over scrambled ones Low FDR doesn t mean perfect results 28
38 Quantitative Proteomics - my critical view Is what everybody is looking for Is what many people claim to do Is definitely the right way to go in the future Is absolutely necessary for Systems Biology Is essential to really understand the dynamics of the proteome Is not really straightforward 29
39 Quantitative Proteomics - What is it? Find relative changes of protein abundance from 2 similar samples (wild type VS mutant // condition_1 VS condition_2) Determine absolute protein concentrations in a sample (conclude on copy numbers and translation efficiency) -> AQUA peptides.. Find regulatory proteins and elucidate regulatory pathways 30
40 Quantitative Proteomics - How can it be achieved? Labeling strategy for differential expression (ICAT, itraq, TMT, SILAC --> wet lab) Label-free approaches for differential expression (--> Software solutions) Targeted approaches (SRM, MRM --> mass spec approach) 31
41 Quantitative Proteomics (differential expression) label strategy only ONE run is acquired label-free 2 individual runs are acquired sample prep solution software solution itraq/tmt icat SILAC Progenesis SuperHirn -> problematic is sample prep -> problematic are aligning and run to run variation 32
42 ICAT labels have different weights Quantification is done on the MSone level 33
43 itraq all labels have the same weight --> all parent ions are the same Quantification is done on the MS/MS level 34
44 Beyond Protein Lists and Quantitation - what else Check for over/under representation of GO-terms Functional categorization Project regulated proteins onto a metabolic pathway map 35
45 Principle of - Over-representation Analysis an easy example The Principle - organism with 1000 genes - binned in 5 equal categories with 200 genes - GO-cats 1-5: transcription, translation, energy delivery, nutrients uptake, degradation The researcher decides to do proteomics (brute-force) genes are identified --> 1/5th of all - statistically you would expect to find approx. 40 genes for each category In fact you find about 100 genes from GO:energy delivery category ---> category energy delivery is significantly enriched ---> different statistics can be applied 36
46 Principle of - ORA - In case of Proteomics The number of measured and identified proteins is still far from complete Over-representation analysis allow to find pathways or systems which are regulated or involved in a certain context -> but it is important to have the correct background/universe selected Principle: - all genes of an organism are binned in categories - categories are related to gene function (e.g. GeneOntology categories) - compare your identifications to randomly drawn genes Background-problem - take as background only those proteins ever identified in this species - take as background all identified proteins and as genes of interest and those proteins which seem to be regulated as targets (e.g: itraq experiment) Tools: R-package --> TopGO Web: --> GOTreeMachine (bioinfo.vanderbilt.edu/gotm/) 37
47 Scenario (from HTP proteomics) Arabidopsis thaliana: The model plant ---> ~ genes Single-cell plant in liquid culture Grown in sugar containing solution & weekly subculturing One part grown in the dark (cardboard box) One part grown in long-day conditions (16h light) Excessive LTQ MS analysis --> 800 LC-MS runs (fractionation & replicates) A total of 7983 proteins identified from all samples (~ 30% from all genes encoded in the genome) --> Background 6547 from the cell cultures that were kept in the dark 6474 from the cell cultures that were illuminated 38
48 GO: Dark Light Proteins from CC_dark: BG: full universe of GO Proteins from CC_dark: BG: only proteins identified in CC GO: biological_process GO: biological_process GO: metabolic process GO: cellular process GO: multicellular organi... GO: developmental proces... GO: metabolic process GO: cellular process GO: localization GO: multicellular organi... GO: developmental proces... GO: macromolecule metabo... GO: biosynthetic process GO: primary metabolic pr... GO: cellular metabolic p... GO: cellular component o... GO: localization GO: multicellular organi... GO: primary metabolic pr... GO: macromolecule metabo... GO: catabolic process GO: biosynthetic process GO: cellular metabolic p... GO: nitrogen compound me... GO: macromolecule locali... GO: cellular component o... GO: multicellular organi... GO: macromolecule biosyn... GO: protein metabolic pr... GO: cellular macromolecu... GO: cellular biosyntheti... GO: nitrogen compound me... GO: amino acid and deriv... organic acid metabol... GO: organelle organizati... GO: cellular localizatio... GO: establishment of loc... GO: embryonic developmen... GO: protein metabolic pr... GO: carbohydrate metabol... GO: macromolecule biosyn... GO: cellular macromolecu... GO: macromolecule catabo... GO: cellular catabolic p... GO: alcohol metabolic pr... GO: cellular biosyntheti... GO: amine metabolic proc... GO: protein localization GO: establishment of loc... GO: cellular localizatio... GO: embryonic developmen... GO: cellular protein met... GO: nitrogen compound bi... GO: amine metabolic proc... GO: carboxylic acid meta... GO: establishment of cel... GO: transport GO: cellular protein met... GO: cellular carbohydrat... GO: carbohydrate catabol... GO: cellular macromolecu... GO: alcohol catabolic pr... GO: nitrogen compound bi... GO: establishment of pro... GO: transport GO: establishment of cel... GO: translation GO: cellular carbohydrat... GO: monosaccharide metab... GO: amine biosynthetic p... GO: protein transport GO: intracellular transp... GO: translation GO: amine biosynthetic p... GO: amino acid metabolic... GO: intracellular transp... GO: monosaccharide catab... GO: hexose metabolic pro... GO: intracellular protei... GO: amino acid biosynthe... GO: hexose catabolic pro... 39
49 GO: Dark Light Proteins from CC_dark: BG: full universe of GO Proteins from CC_dark: BG: only proteins identified in CC GO: biological_process GO: biological_process GO: metabolic process GO: cellular process GO: multicellular organi... GO: developmental proces... GO: metabolic process GO: cellular process GO: localization GO: multicellular organi... GO: developmental proces... GO: macromolecule metabo... GO: biosynthetic process GO: primary metabolic pr... GO: cellular metabolic p... GO: cellular component o... GO: localization GO: multicellular organi... GO: primary metabolic pr... GO: macromolecule metabo... GO: catabolic process GO: biosynthetic process GO: cellular metabolic p... GO: nitrogen compound me... GO: macromolecule locali... GO: cellular component o... GO: multicellular organi... GO: macromolecule biosyn... GO: protein metabolic pr... GO: cellular macromolecu... GO: cellular biosyntheti... GO: nitrogen compound me... GO: amino acid and deriv... organic acid metabol... GO: organelle organizati... GO: cellular localizatio... GO: establishment of loc... GO: embryonic developmen... GO: protein metabolic pr... GO: carbohydrate metabol... GO: macromolecule biosyn... GO: cellular macromolecu... GO: macromolecule catabo... GO: cellular catabolic p... GO: alcohol metabolic pr... GO: cellular biosyntheti... GO: amine metabolic proc... GO: protein localization GO: establishment of loc... GO: cellular localizatio... GO: embryonic developmen... GO: cellular protein met... GO: nitrogen compound bi... GO: amine metabolic proc... GO: carboxylic acid meta... GO: establishment of cel... GO: transport GO: cellular protein met... GO: cellular carbohydrat... GO: carbohydrate catabol... GO: cellular macromolecu... GO: alcohol catabolic pr... GO: nitrogen compound bi... GO: establishment of pro... GO: transport GO: establishment of cel... GO: translation GO: cellular carbohydrat... GO: monosaccharide metab... GO: amine biosynthetic p... GO: protein transport GO: intracellular transp... GO: translation GO: amine biosynthetic p... GO: amino acid metabolic... GO: intracellular transp... GO: monosaccharide catab... GO: hexose metabolic pro... GO: intracellular protei... GO: amino acid biosynthe... GO: hexose catabolic pro... 39
50 Projection onto Metabolic Pathway Maps same data (e.g. MapMan Software (Golm)) Dark Light only found in light found in both only found in dark 40
51 Q & A 41
52 Hands on your turn now feel free to ask 42
53 Scaffold hands on - Example One load your own data with Scaffold before we are going to continue Use also X!Tandem to search Have a look at the results Is it valid to calculate FDR? How high is your FDR? 43
54 More from Scaffold Q+ hands on... with itraq data 44
55 Scenario: Mouse data Liver tissue itraq data (Swiss mouse: standard diet VS high fat diet) Mouse decoy database search with Mascot -> dat-files Labels: 116 -> high fat diet /// 114, 115, 117 -> standard diet Check reproducibility (standard diet vs standard diet) Find proteins which are regulated in high fat diet / standard diet 45
56 Task with Scaffold Q+ How consistent are peptides of the same protein Find confident thresholds for proteins being over/under expressed Which proteins in this example do you consider as being over/ under expressed? Can you try making sense out of these proteins.. 46
57 What should come out.. only 2 quant categories: Histogram 2 Categories Liver Ex StDiet/StDiet HighFatDiet/StDiet 200 Frequency log2(ratio)
58 What should come out.. 4 quant categories: Histogram 4 Categories Liver Ex ratio_2 (st/st) ratio_3 (high fat / st) ratio_4 (st/st) 250 Frequency log2(ratio) 48
59 Regulated Proteins: The List 2 ways of making sense out of this data.. take the intersection of those 2 lists.. (should be most confident) 37 4 categories 48 regulated proteins 2 categories 44 regulated proteins 49
60 Make sense out of Lists: this does make sense!! 50
61 Paint it on Reactome-maps 51
62 52 ELPPAK
63 Scaffold Similarity Window Review and control the peptide/protein mapping View protein groups in which peptides are shared check or uncheck the valid box for a peptide sequence Peptides identified in particular protein groups are color coded 53
Quantitative proteomics background
 Proteomics data analysis seminar Quantitative proteomics and transcriptomics of anaerobic and aerobic yeast cultures reveals post transcriptional regulation of key cellular processes de Groot, M., Daran
Aiping Lu. Key Laboratory of System Biology Chinese Academic Society [email protected]
 Aiping Lu Key Laboratory of System Biology Chinese Academic Society [email protected] Proteome and Proteomics PROTEin complement expressed by genome Marc Wilkins Electrophoresis. 1995. 16(7):1090-4. proteomics
泛 用 蛋 白 質 體 學 之 質 譜 儀 資 料 分 析 平 台 的 建 立 與 應 用 Universal Mass Spectrometry Data Analysis Platform for Quantitative and Qualitative Proteomics
 泛 用 蛋 白 質 體 學 之 質 譜 儀 資 料 分 析 平 台 的 建 立 與 應 用 Universal Mass Spectrometry Data Analysis Platform for Quantitative and Qualitative Proteomics 2014 Training Course Wei-Hung Chang ( 張 瑋 宏 ) ABRC, Academia
ProteinScape. Innovation with Integrity. Proteomics Data Analysis & Management. Mass Spectrometry
 ProteinScape Proteomics Data Analysis & Management Innovation with Integrity Mass Spectrometry ProteinScape a Virtual Environment for Successful Proteomics To overcome the growing complexity of proteomics
Session 1. Course Presentation: Mass spectrometry-based proteomics for molecular and cellular biologists
 Program Overview Session 1. Course Presentation: Mass spectrometry-based proteomics for molecular and cellular biologists Session 2. Principles of Mass Spectrometry Session 3. Mass spectrometry based proteomics
ProteinPilot Report for ProteinPilot Software
 ProteinPilot Report for ProteinPilot Software Detailed Analysis of Protein Identification / Quantitation Results Automatically Sean L Seymour, Christie Hunter SCIEX, USA Pow erful mass spectrometers like
Tutorial for Proteomics Data Submission. Katalin F. Medzihradszky Robert J. Chalkley UCSF
 Tutorial for Proteomics Data Submission Katalin F. Medzihradszky Robert J. Chalkley UCSF Why Have Guidelines? Large-scale proteomics studies create huge amounts of data. It is impossible/impractical to
MRMPilot Software: Accelerating MRM Assay Development for Targeted Quantitative Proteomics
 MRMPilot Software: Accelerating MRM Assay Development for Targeted Quantitative Proteomics With Unique QTRAP and TripleTOF 5600 System Technology Targeted peptide quantification is a rapidly growing application
La Protéomique : Etat de l art et perspectives
 La Protéomique : Etat de l art et perspectives Odile Schiltz Institut de Pharmacologie et de Biologie Structurale CNRS, Université de Toulouse, [email protected] Protéomique et Spectrométrie de Masse
Global and Discovery Proteomics Lecture Agenda
 Global and Discovery Proteomics Christine A. Jelinek, Ph.D. Johns Hopkins University School of Medicine Department of Pharmacology and Molecular Sciences Middle Atlantic Mass Spectrometry Laboratory Global
Already said. Already said. Outlook. Look at LC-MS data. A look at data for quantitative analysis using MSight and Phenyx. What data for quantitation?
 A look at data for quantitative analysis using MSight and Phenyx Pierre-Alain Binz Institut Suisse de Bioinformatique GeneBio SA Atelier Protéomique Quantitative 25-27 Juin 2007 La Grande Motte Already
Effects of Intelligent Data Acquisition and Fast Laser Speed on Analysis of Complex Protein Digests
 Effects of Intelligent Data Acquisition and Fast Laser Speed on Analysis of Complex Protein Digests AB SCIEX TOF/TOF 5800 System with DynamicExit Algorithm and ProteinPilot Software for Robust Protein
Tutorial for proteome data analysis using the Perseus software platform
 Tutorial for proteome data analysis using the Perseus software platform Laboratory of Mass Spectrometry, LNBio, CNPEM Tutorial version 1.0, January 2014. Note: This tutorial was written based on the information
Choices, choices, choices... Which sequence database? Which modifications? What mass tolerance?
 Optimization 1 Choices, choices, choices... Which sequence database? Which modifications? What mass tolerance? Where to begin? 2 Sequence Databases Swiss-prot MSDB, NCBI nr dbest Species specific ORFS
using ms based proteomics
 quantification using ms based proteomics lennart martens Computational Omics and Systems Biology Group Department of Medical Protein Research, VIB Department of Biochemistry, Ghent University Ghent, Belgium
Challenges in Computational Analysis of Mass Spectrometry Data for Proteomics
 Ma B. Challenges in computational analysis of mass spectrometry data for proteomics. SCIENCE AND TECHNOLOGY 25(1): 1 Jan. 2010 JOURNAL OF COMPUTER Challenges in Computational Analysis of Mass Spectrometry
Protein Prospector and Ways of Calculating Expectation Values
 Protein Prospector and Ways of Calculating Expectation Values 1/16 Aenoch J. Lynn; Robert J. Chalkley; Peter R. Baker; Mark R. Segal; and Alma L. Burlingame University of California, San Francisco, San
Mass Spectrometry Based Proteomics
 Mass Spectrometry Based Proteomics Proteomics Shared Research Oregon Health & Science University Portland, Oregon This document is designed to give a brief overview of Mass Spectrometry Based Proteomics
Application Note # LCMS-81 Introducing New Proteomics Acquisiton Strategies with the compact Towards the Universal Proteomics Acquisition Method
 Application Note # LCMS-81 Introducing New Proteomics Acquisiton Strategies with the compact Towards the Universal Proteomics Acquisition Method Introduction During the last decade, the complexity of samples
Database Searching Tutorial/Exercises Jimmy Eng
 Database Searching Tutorial/Exercises Jimmy Eng Use the PETUNIA interface to run a search and generate a pepxml file that is analyzed through the PepXML Viewer. This tutorial will walk you through the
MASCOT Search Results Interpretation
 The Mascot protein identification program (Matrix Science, Ltd.) uses statistical methods to assess the validity of a match. MS/MS data is not ideal. That is, there are unassignable peaks (noise) and usually
Proteomic data analysis for Orbitrap datasets using Resources available at MSI. September 28 th 2011 Pratik Jagtap
 Proteomic data analysis for Orbitrap datasets using Resources available at MSI. September 28 th 2011 Pratik Jagtap The Minnesota http://www.mass.msi.umn.edu/ Proteomics workflow Trypsin Protein Peptides
AB SCIEX TOF/TOF 4800 PLUS SYSTEM. Cost effective flexibility for your core needs
 AB SCIEX TOF/TOF 4800 PLUS SYSTEM Cost effective flexibility for your core needs AB SCIEX TOF/TOF 4800 PLUS SYSTEM It s just what you expect from the industry leader. The AB SCIEX 4800 Plus MALDI TOF/TOF
Mascot Search Results FAQ
 Mascot Search Results FAQ 1 We had a presentation with this same title at our 2005 user meeting. So much has changed in the last 6 years that it seemed like a good idea to re-visit the topic. Just about
Introduction to Proteomics
 Introduction to Proteomics Why Proteomics? Same Genome Different Proteome Black Swallowtail - larvae and butterfly Biological Complexity Yeast - a simple proteome 6,113 proteins = 344,855 tryptic peptides
Research-grade Targeted Proteomics Assay Development: PRMs for PTM Studies with Skyline or, How I learned to ditch the triple quad and love the QE
 Research-grade Targeted Proteomics Assay Development: PRMs for PTM Studies with Skyline or, How I learned to ditch the triple quad and love the QE Jacob D. Jaffe Skyline Webinar July 2015 Proteomics and
Introduction to mass spectrometry (MS) based proteomics and metabolomics
 based proteomics and metabolomics") Introduction to mass spectrometry (MS) based proteomics and metabolomics Tianwei Yu Department of Biostatistics and Bioinformatics Rollins School of Public Health Emory University September 10, 2015 Background
Introduction to mass spectrometry (MS) based proteomics and metabolomics Tianwei Yu Department of Biostatistics and Bioinformatics Rollins School of Public Health Emory University September 10, 2015 Background
Sub menu of functions to give the user overall information about the data in the file
 Visualize The Multitool for Proteomics! File Open Opens an.ez2 file to be examined. Import from TPP Imports data from files created by Trans Proteomic Pipeline. User chooses mzxml, pepxml and FASTA files
Error Tolerant Searching of Uninterpreted MS/MS Data
 Error Tolerant Searching of Uninterpreted MS/MS Data 1 In any search of a large LC-MS/MS dataset 2 There are always a number of spectra which get poor scores, or even no match at all. 3 Sometimes, this
Building innovative drug discovery alliances. Evotec Munich. Quantitative Proteomics to Support the Discovery & Development of Targeted Drugs
 Building innovative drug discovery alliances Evotec Munich Quantitative Proteomics to Support the Discovery & Development of Targeted Drugs Evotec AG, Evotec Munich, June 2013 About Evotec Munich A leader
Advantages of the LTQ Orbitrap for Protein Identification in Complex Digests
 Application Note: 386 Advantages of the LTQ Orbitrap for Protein Identification in Complex Digests Rosa Viner, Terry Zhang, Scott Peterman, and Vlad Zabrouskov, Thermo Fisher Scientific, San Jose, CA,
Introduction to Proteomics 1.0
 Introduction to Proteomics 1.0 CMSP Workshop Tim Griffin Associate Professor, BMBB Faculty Director, CMSP Objectives Why are we here? For participants: Learn basics of MS-based proteomics Learn what s
The Scheduled MRM Algorithm Enables Intelligent Use of Retention Time During Multiple Reaction Monitoring
 The Scheduled MRM Algorithm Enables Intelligent Use of Retention Time During Multiple Reaction Monitoring Delivering up to 2500 MRM Transitions per LC Run Christie Hunter 1, Brigitte Simons 2 1 AB SCIEX,
Introduction to Proteomics
 Introduction to Proteomics Åsa Wheelock, Ph.D. Division of Respiratory Medicine & Karolinska Biomics Center [email protected] In: Systems Biology and the Omics Cascade, Karolinska Institutet, June 9-13,
Pep-Miner: A Novel Technology for Mass Spectrometry-Based Proteomics
 Pep-Miner: A Novel Technology for Mass Spectrometry-Based Proteomics Ilan Beer Haifa Research Lab Dec 10, 2002 Pep-Miner s Location in the Life Sciences World The post-genome era - the age of proteome
Thermo Scientific PepFinder Software A New Paradigm for Peptide Mapping
 Thermo Scientific PepFinder Software A New Paradigm for Peptide Mapping For Conclusive Characterization of Biologics Deep Protein Characterization Is Crucial Pharmaceuticals have historically been small
Chapter 14. Modeling Experimental Design for Proteomics. Jan Eriksson and David Fenyö. Abstract. 1. Introduction
 Chapter Modeling Experimental Design for Proteomics Jan Eriksson and David Fenyö Abstract The complexity of proteomes makes good experimental design essential for their successful investigation. Here,
MaxQuant User s Guide Version 1.2.2.5
 MaxQuant User s Guide Version 1.2.2.5 Jűrgen Cox and Matthias Mann Nature Biotechnology 26, 1367-1372 (2008) Sara ten Have 2012 http://www.lamondlab.com/ http://greproteomics.lifesci.dundee.ac.uk/ References
In-Depth Qualitative Analysis of Complex Proteomic Samples Using High Quality MS/MS at Fast Acquisition Rates
 In-Depth Qualitative Analysis of Complex Proteomic Samples Using High Quality MS/MS at Fast Acquisition Rates Using the Explore Workflow on the AB SCIEX TripleTOF 5600 System A major challenge in proteomics
PeptidomicsDB: a new platform for sharing MS/MS data.
 PeptidomicsDB: a new platform for sharing MS/MS data. Federica Viti, Ivan Merelli, Dario Di Silvestre, Pietro Brunetti, Luciano Milanesi, Pierluigi Mauri NETTAB2010 Napoli, 01/12/2010 Mass Spectrometry
Mass Spectrometry Signal Calibration for Protein Quantitation
 Cambridge Isotope Laboratories, Inc. www.isotope.com Proteomics Mass Spectrometry Signal Calibration for Protein Quantitation Michael J. MacCoss, PhD Associate Professor of Genome Sciences University of
Interpretation of MS-Based Proteomics Data
 Interpretation of MS-Based Proteomics Data Yet-Ran Chen, 陳 逸 然 Agricultural Biotechnology Research Center Academia Sinica Brief Overview of Protein Identification Workflow Protein Sample Specific Protein
Quan%ta%ve proteomics. Maarten Altelaar, 2014
 Quan%ta%ve proteomics Maarten Altelaar, 2014 Proteomics Altelaar et al. Nat Rev Gen 14, 2013, 35-48 Quan%ta%ve proteomics Quan%ta%ve proteomics Control Diseased, s%mulated, Knock down, etc. How quan%ta%ve
ProSightPC 3.0 Quick Start Guide
 ProSightPC 3.0 Quick Start Guide The Thermo ProSightPC 3.0 application is the only proteomics software suite that effectively supports high-mass-accuracy MS/MS experiments performed on LTQ FT and LTQ Orbitrap
Increasing the Multiplexing of High Resolution Targeted Peptide Quantification Assays
 Increasing the Multiplexing of High Resolution Targeted Peptide Quantification Assays Scheduled MRM HR Workflow on the TripleTOF Systems Jenny Albanese, Christie Hunter AB SCIEX, USA Targeted quantitative
Statistical Analysis Strategies for Shotgun Proteomics Data
 Statistical Analysis Strategies for Shotgun Proteomics Data Ming Li, Ph.D. Cancer Biostatistics Center Vanderbilt University Medical Center Ayers Institute Biomarker Pipeline normal shotgun proteome analysis
Accurate Mass Screening Workflows for the Analysis of Novel Psychoactive Substances
 Accurate Mass Screening Workflows for the Analysis of Novel Psychoactive Substances TripleTOF 5600 + LC/MS/MS System with MasterView Software Adrian M. Taylor AB Sciex Concord, Ontario (Canada) Overview
Pinpointing phosphorylation sites using Selected Reaction Monitoring and Skyline
 Pinpointing phosphorylation sites using Selected Reaction Monitoring and Skyline Christina Ludwig group of Ruedi Aebersold, ETH Zürich The challenge of phosphosite assignment Peptides Phosphopeptides MS/MS
When you install Mascot, it includes a copy of the Swiss-Prot protein database. However, it is almost certain that you and your colleagues will want
 1 When you install Mascot, it includes a copy of the Swiss-Prot protein database. However, it is almost certain that you and your colleagues will want to search other databases as well. There are very
Master course KEMM03 Principles of Mass Spectrometric Protein Characterization. Exam
 Exam Master course KEMM03 Principles of Mass Spectrometric Protein Characterization 2010-10-29 kl 08.15-13.00 Use a new paper for answering each question! Write your name on each paper! Aids: Mini calculator,
Proteomic Analysis using Accurate Mass Tags. Gordon Anderson PNNL January 4-5, 2005
 Proteomic Analysis using Accurate Mass Tags Gordon Anderson PNNL January 4-5, 2005 Outline Accurate Mass and Time Tag (AMT) based proteomics Instrumentation Data analysis Data management Challenges 2 Approach
MultiQuant Software 2.0 for Targeted Protein / Peptide Quantification
 MultiQuant Software 2.0 for Targeted Protein / Peptide Quantification Gold Standard for Quantitative Data Processing Because of the sensitivity, selectivity, speed and throughput at which MRM assays can
Retrospective Analysis of a Host Cell Protein Perfect Storm: Identifying Immunogenic Proteins and Fixing the Problem
 Retrospective Analysis of a Host Cell Protein Perfect Storm: Identifying Immunogenic Proteins and Fixing the Problem Kevin Van Cott, Associate Professor Dept. of Chemical and Biomolecular Engineering Nebraska
MarkerView Software 1.2.1 for Metabolomic and Biomarker Profiling Analysis
 MarkerView Software 1.2.1 for Metabolomic and Biomarker Profiling Analysis Overview MarkerView software is a novel program designed for metabolomics applications and biomarker profiling workflows 1. Using
Development of computational methods for analysing proteomic data for genome annotation
 Development of computational methods for analysing proteomic data for genome annotation University of Cambridge Darwin College A thesis submitted for the degree of Doctor of Philosophy Markus Brosch The
AGILENT S BIOINFORMATICS ANALYSIS SOFTWARE
 ACCELERATING PROGRESS IS IN OUR GENES AGILENT S BIOINFORMATICS ANALYSIS SOFTWARE GENESPRING GENE EXPRESSION (GX) MASS PROFILER PROFESSIONAL (MPP) PATHWAY ARCHITECT (PA) See Deeper. Reach Further. BIOINFORMATICS
Frequently Asked Questions Next Generation Sequencing
 Frequently Asked Questions Next Generation Sequencing Import These Frequently Asked Questions for Next Generation Sequencing are some of the more common questions our customers ask. Questions are divided
Un (bref) aperçu des méthodes et outils de fouilles et de visualisation de données «omics»
 aperçu des méthodes et outils de fouilles et de visualisation de données «omics»") Un (bref) aperçu des méthodes et outils de fouilles et de visualisation de données «omics» Workshop «Protéomique & Maladies rares» 25 th September 2012, Paris [email protected] CEA Grenoble irtsv
Un (bref) aperçu des méthodes et outils de fouilles et de visualisation de données «omics» Workshop «Protéomique & Maladies rares» 25 th September 2012, Paris [email protected] CEA Grenoble irtsv
Quantitative mass spec based proteomics
 Quantitative mass spec based proteomics Tuula Nyman Institute of Biotechnology [email protected] Proteomics is the large-scale study of proteins Proteomics provides information on: -protein expression
Searching Nucleotide Databases
 Searching Nucleotide Databases 1 When we search a nucleic acid databases, Mascot always performs a 6 frame translation on the fly. That is, 3 reading frames from the forward strand and 3 reading frames
Mass Spectra Alignments and their Significance
 Mass Spectra Alignments and their Significance Sebastian Böcker 1, Hans-Michael altenbach 2 1 Technische Fakultät, Universität Bielefeld 2 NRW Int l Graduate School in Bioinformatics and Genome Research,
Preprocessing, Management, and Analysis of Mass Spectrometry Proteomics Data
 Preprocessing, Management, and Analysis of Mass Spectrometry Proteomics Data M. Cannataro, P. H. Guzzi, T. Mazza, and P. Veltri Università Magna Græcia di Catanzaro, Italy 1 Introduction Mass Spectrometry
Quantitative mass spectrometry in proteomics: a critical review
 Anal Bioanal Chem (2007) 389:1017 1031 DOI 10.1007/s00216-007-1486-6 REVIEW Quantitative mass spectrometry in proteomics: a critical review Marcus Bantscheff & Markus Schirle & Gavain Sweetman & Jens Rick
CPAS Overview. Josh Eckels LabKey Software [email protected]
 CPAS Overview Josh Eckels LabKey Software [email protected] CPAS Web-based system for processing, storing, and analyzing results of MS/MS experiments Key goals: Provide a great analysis front-end for
LAGUARDIA COMMUNITY COLLEGE CITY UNIVERSITY OF NEW YORK DEPARTMENT OF MATHEMATICS, ENGINEERING, AND COMPUTER SCIENCE
 LAGUARDIA COMMUNITY COLLEGE CITY UNIVERSITY OF NEW YORK DEPARTMENT OF MATHEMATICS, ENGINEERING, AND COMPUTER SCIENCE MAT 119 STATISTICS AND ELEMENTARY ALGEBRA 5 Lecture Hours, 2 Lab Hours, 3 Credits Pre-
BBSRC TECHNOLOGY STRATEGY: TECHNOLOGIES NEEDED BY RESEARCH KNOWLEDGE PROVIDERS
 BBSRC TECHNOLOGY STRATEGY: TECHNOLOGIES NEEDED BY RESEARCH KNOWLEDGE PROVIDERS 1. The Technology Strategy sets out six areas where technological developments are required to push the frontiers of knowledge
Absolute quantification of low abundance proteins by shotgun proteomics
 Absolute quantification of low abundance proteins by shotgun proteomics Dr. Stefanie Wienkoop www.proteomefactory.com In cooperation with: Max-Planck-Institut für Molekulare Pflanzenphysiologie Stable
Shotgun Proteomic Analysis. Department of Cell Biology The Scripps Research Institute
 Shotgun Proteomic Analysis Department of Cell Biology The Scripps Research Institute Biological/Functional Resolution of Experiments Organelle Multiprotein Complex Cells/Tissues Function Expression Analysis
Challenges and Opportunities in Proteomics Data Analysis*
 Perspectives Challenges and Opportunities in Proteomics Data Analysis* Bruno Domon and Ruedi Aebersold Accurate, consistent, and transparent data processing and analysis are integral and critical parts
Thermo Scientific SIEVE Software for Differential Expression Analysis
 m a s s s p e c t r o m e t r y Thermo Scientific SIEVE Software for Differential Expression Analysis Automated, label-free, semi-quantitative analysis of proteins, peptides, and metabolites based on comparisons
A Primer of Genome Science THIRD
 A Primer of Genome Science THIRD EDITION GREG GIBSON-SPENCER V. MUSE North Carolina State University Sinauer Associates, Inc. Publishers Sunderland, Massachusetts USA Contents Preface xi 1 Genome Projects:
MassMatrix Web Server User Manual
 MassMatrix Web Server User Manual Version 2.2.3 or later Hua Xu, Ph. D. Center for Proteomics & Bioinformatics Case Western Reserve University August 2009 Main Navigation Bar of the Site MassMatrix Web
Unit I: Introduction To Scientific Processes
 Unit I: Introduction To Scientific Processes This unit is an introduction to the scientific process. This unit consists of a laboratory exercise where students go through the QPOE2 process step by step
Functional Data Analysis of MALDI TOF Protein Spectra
 Functional Data Analysis of MALDI TOF Protein Spectra Dean Billheimer [email protected]. Department of Biostatistics Vanderbilt University Vanderbilt Ingram Cancer Center FDA for MALDI TOF
Learning Objectives:
 Proteomics Methodology for LC-MS/MS Data Analysis Methodology for LC-MS/MS Data Analysis Peptide mass spectrum data of individual protein obtained from LC-MS/MS has to be analyzed for identification of
SimGlycan Software*: A New Predictive Carbohydrate Analysis Tool for MS/MS Data
 SimGlycan Software*: A New Predictive Carbohydrate Analysis Tool for MS/MS Data Automated Data Interpretation for Glycan Characterization Jenny Albanese 1, Matthias Glueckmann 2 and Christof Lenz 2 1 AB
Master's projects at ITMO University. Daniil Chivilikhin PhD Student @ ITMO University
 Master's projects at ITMO University Daniil Chivilikhin PhD Student @ ITMO University General information Guidance from our lab's researchers Publishable results 2 Research areas Research at ITMO Evolutionary
Computational analysis of unassigned high-quality MS/MS spectra in proteomic data sets
 2712 DOI 10.1002/pmic.200900473 Proteomics 2010, 10, 2712 2718 TECHNICAL BRIEF Computational analysis of unassigned high-quality MS/MS spectra in proteomic data sets Kang Ning 1, Damian Fermin 1 and Alexey
MassHunter for Agilent GC/MS & GC/MS/MS
 MassHunter for Agilent GC/MS & GC/MS/MS Next Generation Data Analysis Software Presented by : Terry Harper GC/MS Product Specialist 1 Outline of Topics Topic 1: Introduction to MassHunter Topic 2: Data
Mass Frontier 7.0 Quick Start Guide
 Mass Frontier 7.0 Quick Start Guide The topics in this guide briefly step you through key features of the Mass Frontier application. Editing a Structure Working with Spectral Trees Building a Library Predicting
Statistical Analysis. NBAF-B Metabolomics Masterclass. Mark Viant
 Statistical Analysis NBAF-B Metabolomics Masterclass Mark Viant 1. Introduction 2. Univariate analysis Overview of lecture 3. Unsupervised multivariate analysis Principal components analysis (PCA) Interpreting
Name: Hour: Elements & Macromolecules in Organisms
 Name: Hour: Elements & Macromolecules in Organisms Most common elements in living things are carbon, hydrogen, nitrogen, and oxygen. These four elements constitute about 95% of your body weight. All compounds
Investigating Biological Variation of Liver Enzymes in Human Hepatocytes
 Investigating Biological Variation of Liver Enzymes in Human Hepatocytes MS/MS ALL with SWATH Acquisition on the TripleTOF Systems Xu Wang 1, Hui Zhang 2, Christie Hunter 1 1 AB SCIEX, USA, 2 Pfizer, USA
BIOINF 525 Winter 2016 Foundations of Bioinformatics and Systems Biology http://tinyurl.com/bioinf525-w16
 Course Director: Dr. Barry Grant (DCM&B, [email protected]) Description: This is a three module course covering (1) Foundations of Bioinformatics, (2) Statistics in Bioinformatics, and (3) Systems
Modeling and Simulation of Gene Regulatory Networks
 Modeling and Simulation of Gene Regulatory Networks Hidde de Jong INRIA Grenoble - Rhône-Alpes [email protected] http://ibis.inrialpes.fr INRIA Grenoble - Rhône-Alpes and IBIS IBIS: systems biology
University of Glasgow - Programme Structure Summary C1G5-5100 MSc Bioinformatics, Polyomics and Systems Biology
 University of Glasgow - Programme Structure Summary C1G5-5100 MSc Bioinformatics, Polyomics and Systems Biology Programme Structure - the MSc outcome will require 180 credits total (full-time only) - 60
Enzyme Response Profiling: Integrating proteomics and genomics with xenobiotic metabolism and cytotoxicity
 Enzyme Response Profiling: Integrating proteomics and genomics with xenobiotic metabolism and cytotoxicity Proteomics high throughput separation and characterization of expressed proteins in tissue and
Biochemistry of Cells
 Biochemistry of Cells 1 Carbon-based Molecules Although a cell is mostly water, the rest of the cell consists mostly of carbon-based molecules Organic chemistry is the study of carbon compounds Carbon
Biochemistry Major Talk 2014-15. Welcome!!!!!!!!!!!!!!
 Biochemistry Major Talk 2014-15 August 14, 2015 Department of Biochemistry The University of Hong Kong Welcome!!!!!!!!!!!!!! Introduction to Biochemistry A four-minute video: http://www.youtube.com/watch?v=tpbamzq_pue&l
Activity 7.21 Transcription factors
 Purpose To consolidate understanding of protein synthesis. To explain the role of transcription factors and hormones in switching genes on and off. Play the transcription initiation complex game Regulation
Chapter 5: The Structure and Function of Large Biological Molecules
 Name Period Concept 5.1 Macromolecules are polymers, built from monomers 1. The large molecules of all living things fall into just four main classes. Name them. 2. Circle the three classes that are called
Elements & Macromolecules in Organisms
 Name: Date: Per: Table # Elements & Macromolecules in rganisms Most common elements in living things are carbon, hydrogen, nitrogen, and oxygen. These four elements constitute about 95% of your body weight.
Protein Protein Interaction Networks
 Functional Pattern Mining from Genome Scale Protein Protein Interaction Networks Young-Rae Cho, Ph.D. Assistant Professor Department of Computer Science Baylor University it My Definition of Bioinformatics
Biological Sciences Initiative. Human Genome
 Biological Sciences Initiative HHMI Human Genome Introduction In 2000, researchers from around the world published a draft sequence of the entire genome. 20 labs from 6 countries worked on the sequence.
is a knowledge based expert decision support tool for predicting the metabolic fate of chemicals in mammals.
 is a knowledge based expert decision support tool for predicting the metabolic fate of chemicals in mammals. Reference 08/15 Features and Benefits Summary Efficient Metabolite Structure Elucidation Early