Metes and Bounds Help
|
|
|
- Poppy Paul
- 10 years ago
- Views:
Transcription
1 Metes and Bounds Help Topics: Drawing Wizard Data Entry o Entering Metes and Bounds Data o Entering Section Call Data Layers o Layer Options o Analyze Layer Closing Error Tabs Drawing Options o Drawing Labels and Captioning Pictures o Background Picture o Floating Pictures o Snapshots 3rd Party Imaging Opening, Saving, Printing, Importing and Exporting Calculations Menu Tools Menu Window Menu Conversion Table Preferences Registering, Upgrading and Renewing Copyright (c) by Sandy Knoll Software, LLC
 2001-2015 by Sandy Knoll Software,")
2 Drawing Wizard The Drawing Wizard is an optional way to start a new drawing and can be found under the File menu. It will ask you several questions about what type of drawing you plan on creating. Based on your answers to these questions, the wizard will preset some of the drawing values to help you accomplish your goals. Using the wizard does not lock you into a particular workflow; it only presets a few options. You can always change any of the drawing options to better suit your needs. Simple o This option is optimized for working with a single layer. It will keep the drawing centered in the middle of your screen. It is very similar to the blank drawing that you get when you do not use the wizard.

3 Drawing Wizard (Continued) Complex o This option is optimized for working with multiple layers/plots/tracts in a single drawing. It also provides the option of using a scaled background image, such as a section or topographical map. Section Based o This option will start your drawing using the Section Finder. It allows for easy entry of section calls such as "The northwest quarter of the southeast quarter". Lat / Long o This option will start your drawing using the Lat/Long to Layer tool. Use this option to turn a list of Lat/Long coordinates into a series of metes and bounds calls. If the Show New Drawing Wizard at Startup checkbox is checked, the wizard will appear each time you start Metes and Bounds. If you uncheck this box, you can still access the wizard from the File menu.

4 Entering Data Data can be entered either manually or by using the Data Entry form. To enter data manually, enter the call into the entry field and press the Add button. The data should be entered as {N/S} {DD:MM:SS} {E/W} {Distance}. Example: N 44:30:25 E 100. You can also enter "due" north/south/east/west by entering just the direction and the distance. Example: N 100 would be due north 100 feet. Line calls can also be entered in the following format: {N/S}{DD.MMSS}{E/W} {Distance}. Example: n e 100. Distances entered manually are assumed to be feet. To have the software assume a unit of measurement other than feet choose Data Entry Mode from the Tools menu. This will activate a menu button that can be used to change the unit of measurement to that which is being entered. Values entered in this way will be converted to feet. This menu button can be seen below. In most cases, a "v" or "m" can be added to the distance to indicate that the value being entered is either a vara or meter. Example: N 45 E 100v would indicate 100 varas. The full text of the unit type can also be used, such as N 45 E 100 Yards. Additional Call Entries: Curve - Brings up the curve editor. Line - Brings up the line editor. Draw - Enters call drawing mode. POB - Creates a call that returns from the end of the last call to the - Creates a new - Creates a new layer with the specified name. / - Adding this slash before a call will create in invisible call.

5 Data Entry Form To enter data using the Data Entry form, press the Enter Data button. This will bring up the Data Entry form. You can also bring up this form by right-clicking in the main drawing area or the call list and choosing Enter Data from the popup menu.

6 Entering Line Data: To add a line to the drawing, make sure that the Line tab is selected. Then, enter the call data and press the Add Line button. If the Call Visible box is unchecked, then the call will not be drawn on the screen, nor will it be used in calculations such as area. An invisible call will be shaded in red in the call list. Calls can be made visible/invisible by right-clicking on the call in the main window. To delete the last line of the drawing, press the Delete Last button. You can edit any line by choosing it from the Edit Line menu button. You can bring up a unit conversion calculator by pressing the menu. popup menu arrow next to the distance unit popup If the call's angle is expressed as a decimal or compass direction, you can press the degree box to bring up one of the angle converters. popup menu arrow next to the

7 Entering Curve Data: To enter a curve, select the Curve tab. Choose which direction the curve is facing, either Left or Right. Enter the Radius of the curve.

8 Choose the correct tab to enter the curve data in the format that you are using. Arc Length (ft)

9 Central Angle
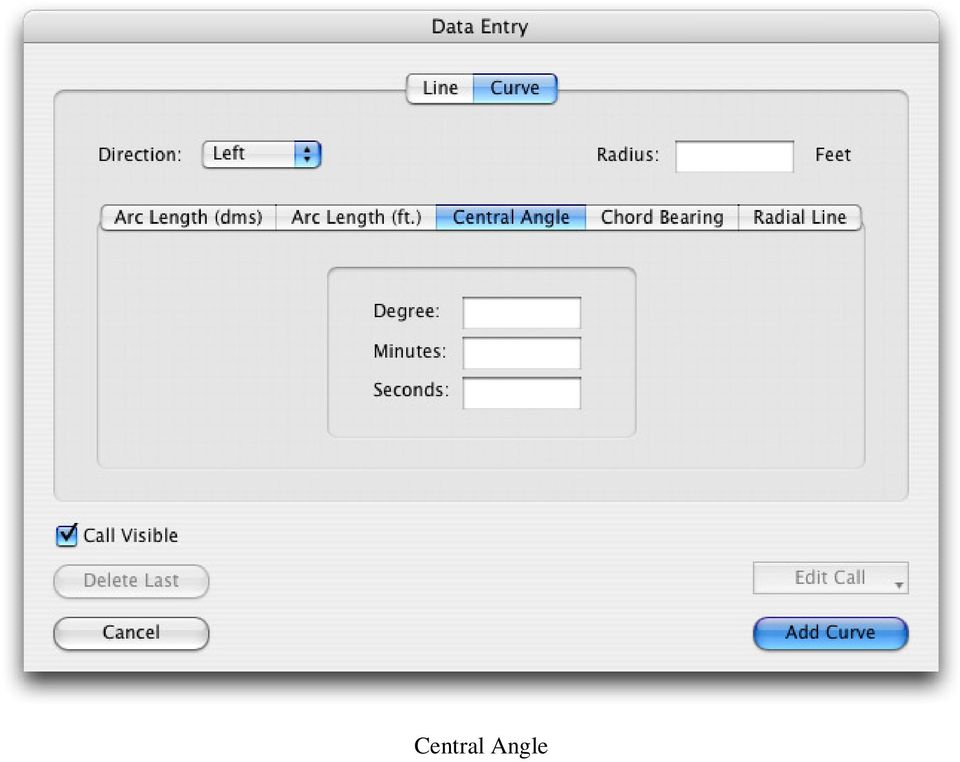
10 Chord Bearing
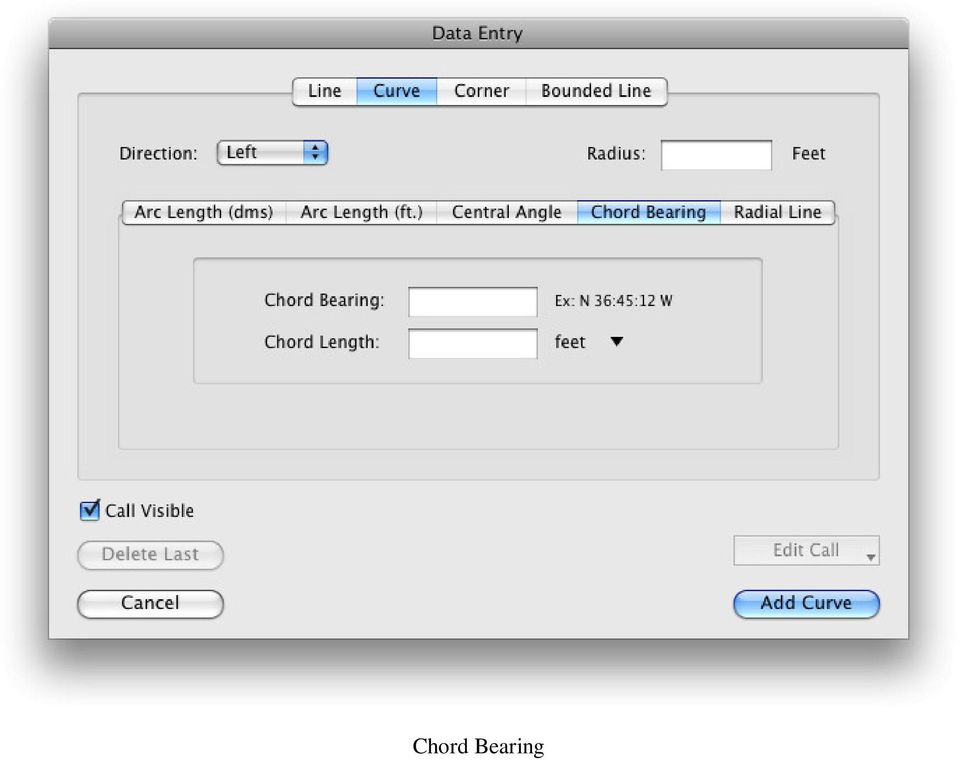
11 Press the Add Curve button to add the curve. Radial Line


12 You can convert a Chord Length and Radius to Arc Length by pressing the Length field. This the button will bring up the conversion form: popup menu arrow next to the Arc Enter the Radius and Chord Length. Pressing the Convert button will enter the Arc Length into the appropriate field on the main data entry form. To enter non-tangent curves, enter the deflection as a line with a length of 0 feet, then enter the curve call. To enter curve data manually: On the main window, enter Right or Left, space, Radius, space, arc length in degree. For example, to enter a left facing curve, with a radius of 50 feet and an arc length of 30 degrees, 25 minutes enter "L 50 30:25". Then press the Add button.

13 Entering Corner Call Data Entering a Corner Call simplifies the process of setting layers to use the same starting point. The Corner Call line is an invisible line from the drawing's origin to a section corner. For example, if your layer's description starts something like "Beginning at a point South feet from the northwest corner of the northeast quarter of Section 19", you could create an invisible call from the drawing's origin to the section corner as described. Then you would create another invisible line call for South 300 feet. This allows all of the layers to share the same origin, thus facilitating the automatic scaling and placement of each layer within a section. If the drawing s origin is not one of the corners, you will have to choose a corner to calculate the Corner Call from. Use this same corner for any additional layers. This call should be the first call in the call list. If not, you can move it to the top of the call list using the Moving Calls feature outline below.

14 Bounded Line: This tab allows you to enter a call that will be cropped at the boundary of another layer. Or it allows you to enter a bearing with an unknown length that will be cropped at the boundary of another layer. First choose the bounding layer, then enter either the call or bearing. If entering a bearing with an unknown length, use an * asterisks for the length. Note: This option cannot be used if the drawing's origin is set to Auto-Center. It also requires that the drawing contain at least two layers - one for the bounding layer and the layer for which the call is being entered.

15 Entering Calls Via Text Editor Calls can also be entered via a text editor interface by pressing the Text Entry button on the Data Entry form. Any calls that can be entered in the call entry box on the main window can also be entered here.


16 Entering Missing, Incomplete or Vague Calls: An incomplete or poorly written description may be missing part or all of a call. The software can help solve for these bad calls with several caveats. There can only be one bad call per layer. The layer will now close completely, even if it wouldn't have otherwise. The resulting call will be a line and not a curve. To use this feature, enter a question mark (?) in place of the call. The question mark can only be entered using the manual entry field. Moving Calls: You can move calls up or down in the call list by right-clicking on the call and choosing Move Up or Move Down from the popup menu. Return to Call: You can return to the endpoint of a previous call by right-clicking on the call that you want to return to in the call list and choosing Return to Call. This will create an invisible call that returns to the endpoint of the chosen call. The recommended way to return to a call is to create a new layer using the Return to Call custom layer. Using this method of Return to Call can cause some functions to act unexpectedly, such the Split Layer function and area calculations. However, depending on how you intended to use the software, this option may be the easiest way to accomplish your goals.

17 Set Call Label: You can set a custom label for an individual call by right-clicking on the call in the call list and choosing Set Call Label from the popup menu. This will bring a the Set Call Label form. Enter the call's label and press the Set Label button. The call label uses the same settings as the layer Show Call feature. Convert Unit of Measurement: You can convert the unit of measurement for a line call by right-clicking on the call and choosing Convert Unit of Measurement from the popup menu. Drawing Calls: See the Call Drawing Tool for information on drawing calls.

18 Section Finder This feature will show a graphical representation of a section description. For example: To enter a section call, enter it into the Call text box and then press the Add button. To enter a quarter, enter NW/4, NE/4, SW/4 or SE/4 To enter a half, enter N/2, S/2, E/2 or W/2 To enter in feet, enter N, S, E or W, followed by the distance in feet. For example, "the north 600 feet" would be: N600 To enter exceptions in feet, enter -N, -S, -E or -W, followed by the distance in feet. For example, "EXC N 300 feet" would be -N300 To enter exceptions in acres, enter ~N, ~S, ~E or ~W, followed by the acreage. For example, "EXC N 27 AC" would be ~N27

19 Click on the Fill Color to change the color used to draw the next added call. Slide the transparency slider to adjust the calls transparency. The far left is fully transparent. Choose the fill style to be used for the next added call by choosing the desired style from the Style popup menu. To edit a call, choose the call from the call list. Make the desired changes and then press the Edit button. To delete a call, choose the call from the call list and press the Remove button. To delete all calls for a section, press the Remove All button. Entering the Township, Range and Section is optional. You can enter data for up to 36 sections. To view all 36 sections at once, choose View All from the section popup menu. When viewing all sections, click on the desired section to edit it. Grid Overlay This popup menu will allow you to choose a grid to draw for the sections. Options are No Grid, 1/4, 1/16 and 1/64 sections. Show Area Checking this checkbox will draw area of the entered calls in the lower left hand corner of the drawing. Directions Checking this checkbox will draw North/South/East/West markers on the drawing.

20 Section Finder Options Menu Save Picture as File: This menu option allows you to save the section drawing as a picture. Save Picture as Background: This menu option allows you to set the current drawing's background picture to the current section drawing. Print: This menu option will print the current section. Create New Layer From Selected Aliquot Part: This menu option will create a series of calls in the current drawing that represent the selected section call. New Drawing from Current Section: This menu option will create a new drawing containing calls for each section part. It will also use the section picture for the drawing's background. Calls from Sections 1-36: This menu option will create metes and bounds calls for all 36 sections. The "unused" section will not be included.

21 Calculate Area of Section: This menu will calculate the area of the drawn section. Area From All Sections: This menu will calculate the drawn area of all of the sections in the selected range. View View Ranges: The software supports up to 9 ranges. Choosing this option allows you to select which range to work with. View Current Range Sections: This option shows you all of the selections in the currently selected range. This is the same as choosing View All from the section popup menu.

22 Layers Layers Menu: Add New Layer: Use this menu to create a new layer. You will be presented with a form allowing you to name the new layer. The new layer will become the drawings current layer. Checking the "Set Layer's Offset to Last Layer's Offset" checkbox will cause the new layer to have the same offset as the last layer in the layer list.
23 Add New Advanced Layer: Section Layer This option is a quick way to create a 1 to 5 mile square section. If you pick a size larger than 1 mile, you'll be given the option to include tick marks at the mile marks. You can also choose which quadrant to create the section in. This allows you to choose if the section is drawn north/south and east/west of the drawing's origin. Creating a Section Layer requires that the drawing's origin be set to something other than Auto-Center. The recommended origin setting is Center of Screen.
24 Return to Call Creating a Return to Call layer will create a new layer that starts at the endpoint of the layer and call that is chosen. It will automatically create a series of invisible calls, from the drawing's origin, to the chosen call's endpoint. This makes it easy to return to a common point when multiple tracts start at the same reference point. Creating a Return to Call layer requires that the drawing's origin be set to something other than Auto-Center. The recommended origin setting is Center of Screen. This method is the recommended way to return to a call, however, in some cases the "Return to Call" call option may also be viable.
25 Rotated Layer This option will create a new layer by rotating or flipping the selected layer. This will create a new set of calls for the new layer. The recommended origin setting is Center of Screen.
26 Compass Rule Layer This option will create a new layer by applying the Compass Rule to the selected layer. The default colors for this layer will be set to the selected color. The recommended origin setting is Center of Screen.
27 Reverse Direction Layer This option will create a new layer by reverse the direction of the calls. For example, if a plot runs clockwise, the new plot layer will run counter-clockwise. Check the Retain Leading Invisible Calls checkbox to have the new layer copy any leading invisible calls from the original layer.
28 Grid Layer This option will create a new layer. This layer will contain a grid of the specified width and the specified spacing.


29 Delete Current Layer: This menu will prompt you to delete the current layer. Rename Current Layer: This menu will bring up a form that will let you rename the current layer. Enter a new name and press the Rename button. Duplicate Current Layer: This menu will duplicate the current layer. The new layer will be placed in the center of the drawing window. The new layer will become the current layer. Set Current Layer Origin X,Y: Choosing this option will bring up the following form. It can be used to set the X,Y coordinates for the layer's origin. This has no visual effect on the drawing, but will be used when showing/saving the point coordinates, exporting the current layer as a DXF file and when viewing the endpoint X,Y. This setting also has no effect on the Offset or Origin functions. Enter the X and Y coordinates and press the Set button.
30 You can also view origin X,Y for all layers at once by selecting View All Layers from the Options menu. Doing so will bring up the following form: The X, Y values can be edited on this form by clicking in any X, Y cell and entering a new value. A set of x,y coordinates can be applied to all layers by choosing the option from the popup menu triangle.
31 Set Current Layer POB Lat/Long: Choosing this option will bring up the following form. It can be used to set the latitude and longitude coordinates for the POB. This has no visual effect on the drawing, but will be used by the various other Lat/Long functions as a starting point offset. Enter the latitude and longitude coordinates and press the Set button. You can also set the POB's lat/long based on another endpoint's lat/long. To do so, click on the menu popup triangle and choose Find POB Lat/Long From Endpoint Lat/Long from the popup menu. This will bring up the Endpoint Lat/Long to POB Lat/Long from.
32 Choose the endpoint that you know the lat/long for from the endpoint menu and enter its lat/long. Press the Find POB Lat/Long button. This will close the current form and populate the POB Lat/Long form with the POB's lat/long values. You can also choose a lat/long coordinate from any endpoint from any layer using this form: You can also choose to rotate the selected layer prior to calculating the layer's lat/long values. You can also view origin Lat/Long for all layers at once by selecting View All Layers from the Options menu. Doing so will bring up the following form:
33 Offset Current Layer * Each layer can be moved around by using the mouse. * Holding down the shift key while dragging a layer allows you to drag all of the unlocked layers at once. * Holding down the shift and control keys will bring up scrollbars that can be used to move all layers, including locked layers, at the same time. This allows you to move all of the layers even if there is no layer visible to grab. This can be useful for "scrolling" around the drawing while the scale setting is zoomed in. The Offset window can be used to nudge a layer 1 pixel at a time or it can set a layers offset to the same offset as another layer. It can also return a layer to its point of origin. The origin setting can be set in the Drawing Options. Set All Layers to Origin: This menu option will return all of the unlocked layers offsets back to zero.
34 Align Layers by Endpoints: This form will allow you to align layers via their endpoints. Note: This option is not available for drawing's with their origin set to Auto-Center. Select a base layer. This layer will not move. When you select a layer, it's endpoints will be numbered on the main drawing. Select a base endpoint. This is the endpoint that the 'move layer' will move to. Select a move layer. This is the layer that will move to the selected base endpoint. Select the move endpoint that you want to line up with the base endpoint. Press the Align Layers button.
35 Align Layers by Lat/Long: This form will allow you to align layers via their POB Lat/Long values. Note: This option is not available for drawing's with their origin set to Auto-Center. This form will create a new, invisible starting call for each selected layer from the Origin's POB to each layer's Lat/Long POB. Origin Lat/Long: This is the Lat/Long to use for the drawing's origin. You can pick this value from a layer's POB Lat/Long by clicking on the popup menu triangle. Align Layers: This popup menu lets you choose which layers to align. The checkbox lets you skip or include locked layers. X,Y Offset: This option allows you to clear each layer's existing x,y offset, keep the existing x, y offset or set the offset to a specific layer's x,y offset.
36 Convert Current Layer Offset to Call: The option will convert the current layer's offset into an invisible metes and bounds call. Current Layer Closure Tools: Convert Auto Completion to Call This command is similar to the Auto Complete layer option. But instead of just drawing the completing line, this option will create a new call that will close the plot and append it to the call list. Auto Complete Two Calls This form allows you to enter in bearings for the last two lines, even if the lengths of the last two lines are unknown. This can be useful when dividing up a plot.
37 Adjust Closing Error This form allows you to minimize a closure error by adjust the length of a line until the closure gap is at its smallest. Select the line that you want to adjust. Select an interval. The interval is how large or small of increments the software will use to close the gap. Then press the Adjust Line button.
38 Split Current Layer You can use this feature to turn a single layer into two plots. First, choose the call where you want to start the split. Next, move the slider to the desired point in the line where you would like the split to occur. A red bull's-eye will appear on the main drawing to show you where the line will be split. You can also use the popup menu arrow to set the line lengths to the desired values. Press the Next button to choose the ending marker for the split.

39 Now choose the call for the other end of the split. Move the slider to choose the second split point. Or, if you select the Find Nearest Half checkbox, the program will find the point on the 2nd line where the two new plots are closest to having the same area. You can also use the popup menu arrow to enter in precise values.
40 You can view the new plots area either in square feet or in acres. Press the Split button to create your two new plots. The two new layers will be added to your drawing if you have the Pro version, or two new windows will be created if you have the Basic version. If you press the 3rd Point button instead of pressing the Split button, the software will create a 3rd point at the center point of the new cut line. You can then create 2 lines for the cut line instead of just one line. Use the large arrows to move the 3rd point in 1 foot increments and the small arrows to move the point in 1 inch increments. The 3rd point will not be allowed to move outside of the plot's boundary.
41 Set Non-Current Layers Invisible will uncheck each layer's visibility checkbox accept for the current layer. This will cause all of the layers, other than the current layer to become invisible. Set All Layers Visible will check each layer's visibility checkbox. This will cause all of the layers to become visible. Manage Layer Visibility. Choosing this menu will bring up the Layer Visibility form where you can set all of the layers visibility in one place. Check or clear each checkbox to set that layer's visibility. Press the Check All button to make all layers visible. Press the Clear All button to make all layers invisible.

42 Lock Non-Current Layers. Choosing this option will mark all of the layers, other than the current layer, as locked. Unlock All Layers. Choosing this option will mark all of the layers, including the current layer, as unlocked. Hide Non-Current Layers. When this menu option is checked, selecting a layer from the layer popup menu will cause all of the other layers to be hidden. This makes it so that only one layer is visible at a time. The other layer's visibility setting is not effected. Hide Non-Current Layer Endpoints. When this menu option is checked, only the current layer's endpoint data is shown. This checkbox does not affect the other layer's endpoint settings. Highlight Current Layer: This option will cause the current layer to be drawn with a yellow highlight around it. You can also temporarily enable layer highlighting by holding down the shift key.
43 Selecting the Current Layer: To select a layer, choose it from the layer selection menu on the main window. When you select a new layer, it will become the current layer. All of the layer's calls will be shown in the call list and all of the layer's options will be set in the layer options area. You can also select a current layer by right clicking on the layer itself or the layers floating call list (if visible) in the drawing and choosing the Make Current Layer option. Edit Menu Layer Options: Copy Drawing as Picture - This will place a copy of the current screen picture onto the clipboard. Copy Current Layer's Description as Text - This will create a plot description for the current layer. It will show the description on the screen in a popup window as well as placing the description text onto the clipboard. Copy Current Calls - This will copy the calls of the current layer onto the clipboard. Paste Calls as New Layer - This will allow you to create a new layer and paste the copied calls into that new layer. Paste Calls into Current Layer - This will paste a set of copied calls into the current layer. The calls will be added at the insertion point. Holding down the Shift key while selecting the Edit menu will change this option to Paste Clipboard Text as Call List. This will take the text on the clipboard and paste it as a list of calls. Each call must already be formatted as a valid call. This is a quick way to paste calls from another text document that had been previously copied and pasted from Metes and Bounds. Clear Current Calls - This will clear the current layer s call list. This is the equivalent of selecting each call and pressing the Remove button.

44 Layer Order: You can change the order of the layers in the layer popup menu by right-clicking on the layer popup menu and choosing Change Layer Order. Changing the order will change the order in which the layers are rendered on the screen. The first layer in the list will be drawn first and the last layer in the list will be drawn last. To change a layer's order, select the layer in the list and press either the Up button or the Down button. Press the Save and Close button to commit any changes and to close the form.


45 Layer Options Layer Visible This will toggle the layer's visibility. Lock Offset When this box is checked, the layer's offset will be locked. This means that it cannot be moved, either by the mouse or by the offset form. If a layer is locked, it will be shown with a lock icon in the main drawing. This setting can also be set/cleared by right clicking on a layer and choosing Lock/Unlock Layer from the popup menu. Auto Complete If a plot's description does not contain a closing line, checking this box will draw the completing line.
46 Lines Pressing the Lines button will bring up the Layer Line Properties form. Set Width: This option will always draw the layer lines with a pen width of 1, 2 or 3. Scaled Width: This option will draw the layer lines with a pen width that is scaled at the selected feet. Line Color: Clicking on the colored bar will let you choose the color used to draw the layer's lines with. Dash Length: Move the slider to change the dash length that the layer's calls will be drawn with. Dash Style: Choose an option from the popup menu to change the dash style. Style options are: Dashes, Dash Dash Dot, Dash Dot, Dot Dot Dash and Dots.
47 Captions and Labels Pressing this button will bring up the Layer Captions and Labels form. The Show Lengths option will draw the line lengths on the drawing. You can choose the unit of measurement from the measurement menu. If the In-Line checkbox is checked, then the lengths will be drawn in-line with the lines. Pressing any of the Font buttons will bring up a font dialog that will allow you to choose the font style used for the chosen caption.
48 If the Show Calls checkbox is selected, the calls will be drawn on the lines. You can choose the unit of measurement from the measurement menu. If Line #s Only is selected, then only the call's line number will be drawn. If the In-Line checkbox is checked, then the calls will be drawn in-line with the lines. Show Layer Name This option will have the layer draw it's caption in the center of the plot. The angle of the layer name can be adjusted using the angle up/down buttons. The angle setting is shared with the Layer Area. Show Layer Area This option will have the layer draw it's area in the center of the plot. It will be drawn below the layer's name if visible. You can choose to show the area in acres or square feet. The angle of the layer area can be adjusted using the angle up/down buttons. The angle setting is shared with the Layer Name.
49 Point Labels The Point Labels tab is a secondary interface to adding X,Y Waypoints. It is designed to make adding layer based labels easier than using the X,Y Waypoints form directly. To add a Point Label, enter the label's caption in the text box and press the Create Layer Label button. This will create an X,Y Waypoint with no icon and set the description field to show. All labels created this way will have their X,Y points set to 0,0.
50 Call Labels Allows you to edit the label for each call. Call labels can also be edited by right-clicking on the call in the main call list and selecting Set Call Label from the popup menu. Check the "Only show calls with labels" checkbox to limit the calls shown to only the calls that already have a label defined.
51 Fill Color Pressing this button will bring up the Fill Layer Form. When Show Fill is checked, the plot area will be filled with the selected color. To select a different color, click on the color rectangle. A color selection window will appear. Choose the desired color. To change the fill pattern, choose a new pattern from the fill pattern popup menu. The transparency of each layer's fill can be set using the Fill Transparency slider. Checking the Use Gradient checkbox will cause the layer to be filled with a slight gradient instead a plain, solid color.
52 End Points Pressing this button will bring up the following form: Checking Show Point Number will draw the point number next to each end point. Checking Show X,Y will show the X,Y coordinates next to each end point. You can choose to show the X,Y coordinates in any of the supported units. Checking Show Lat/Long will show the Lat/Long coordinates next to each end point. Checking as DMS will show the Lat/Long coordinates as Degrees/Minutes/Seconds instead of in decimal. The line popup menu allows you to choose if the lat/long values are on the same line or separate lines. You can create new X,Y Points that contain the Lat/Long values by choosing an option from the popup menu arrow.

53 Checking Show Point Angles will show the interior and exterior angles of the end points. The line popup menu allows you to choose if the angles are on the same line or separate lines or to show internal angles only. You can create new X,Y Points that contain the angle values by choosing an option from the popup menu arrow. Checking Show End Points will highlight the end points of each line on the layer. Select the endpoint style from the style popup menu. The options are circles or plus signs. Click the color bar to change the color of this layer's end points. Checking the Show Sweeping Arcs checkbox will cause sweeping arcs to be drawn at each corner. The size and color of the arcs can be adjusted using the color and radius settings. Checking the Show Last End Point checkbox will cause the last end point to draw its information as well. This option is helpful for drawing endpoints when a plot closes and when it doesn't.
54 Floating Lists Pressing this button will bring up the Floating Lists form. Call List: Checking the Show Floating Call List option will draw a call list on the drawing. You can move the call list by clicking on it and dragging it to a new location. You can also make this call list's layer the current layer by right-clicking on it and choosing Make Current Layer from the popup menu. The popup menu will also allow you to hide the call list. Checking the Include Layer Name checkbox will include the layer's name at the top of the call list. Checking the Include Call Numbers will include the call number of each call. Checking the Include Call Labels will include the call labels in the call list.
55 Checking the Shaded checkbox will cause the call list to be drawn shaded instead of with a plain black box. Checking the Use Fill Color checkbox will cause the call lists shading to be drawn in the same color as the layer's fill color. You can turn on layer's fill option by clicking on the popup menu arrow. You can control how invisible calls are displayed in the call list by choosing one of the options from the Invisible Calls popup menu. Show Call Lengths As allows you to choose the unit of measurement used when showing the calls. Floating Call Lists can also be set to be Single Column or Double Column. Show Call Lengths As allows you to choose the unit of measurement used when showing the calls.
56 Endpoint List: Checking the Show Endpoint List box will draw a list of endpoints on the drawing. This list can include the layer's name as well as each endpoint's x,y, Lat/Long and angles. Lat/Long can be displayed as either DMS or decimals.
57 Layer Information: Checking the Show Layer Information checkbox will draw a floating list that contains the information that is also checked.
58 Waypoints Pressing this button will bring up a popup menu with the choice of entering Lat/Long based waypoints or X,Y based waypoints. Lat/ Long Waypoints Choosing the Lat/Long popup menu will bring up the Waypoints and Tracks form. This form can be used to enter miscellaneous points and lines using latitude and longitude settings. Enter the latitude and longitude coordinates into the appropriate fields. You can change the icon used by clicking on the icon and choosing a new icon from the icon picker form. You can enter an optional description as well (label placeholders are also supported).press the Add button to add this point to the list. To edit a point, click on the appropriate cell and change the data accordingly. To delete a point, select it from the list and then press the Delete button. Checking the Display as DMS box will cause the coordinates to be displayed in Degree/Minute/Second form instead of decimal form. Latitude and Longitude values can be entered as either decimal are DMS values.
59 Right-Clicking on a line will present you with a menu for copying a point to either Point 1 or Point 2 of the line tab. You can also delete the point by selecting Delete Point from the menu. Clicking on the icon column will bring up a form allowing you to change the icon used to mark the lat/long waypoint. Checking the checkbox for a waypoint will show that waypoint s description on the drawing. Use the Visible checkbox to turn on/off the visibility of all of the waypoints. Click on the Font icon to change the font used for a particular waypoint description. Entering a Radius value will draw a circle around the waypoint with the given radius. Importing Waypoints Waypoints can be imported from a GPX, KML or CSV files by choosing Import from the File menu. Exporting Waypoints Waypoints can be exported to a GPX file by choosing the Export Waypoints as GPX menu from the File menu. Create Points From Endpoints This will create lat/long waypoints for each endpoint of the current layer. Project Waypoint You can choose this option from the Options menu. This will take the current value in the Lat/Long fields and prompt you for an angle and a distance (in feet). It will then create a new waypoint at that location. Create Layer From Waypoints This feature is found under the Options menu. Choosing this will send all of the waypoints to the Lat/Long to Layer converter.
60 Tracks Enter the two sets of latitude and longitude coordinates. You can enter an option description as well. Press the Add button to add the line. A black line will be drawn between the two points on the drawing after pressing the Save and Close button. Checking the "Move Point 2 to Point 1 after Add" checkbox will move the latitude and longitude values from the Point 2 fields into the Point 1 fields and then set the focus to the Point 2 fields. This is useful when entering data that produces a continuous line made up of multiple segments. Pressing the Cancel button will close the form without saving any of the point or line changes. You can delete all of the waypoints or tracks by choosing the appropriate menu from the File menu. Use the Visible checkbox to turn on/off the visibility of all of the tracks.
61 X,Y Waypoints Choosing the X,Y popup menu will bring up the X,Y Points form. This form can be used to enter miscellaneous points using x,y settings. These points can be used similar to lat/long waypoints or they can be used as a labeling system for a given layer. If you know the specific x,y coordinates that you want to use for the waypoint: Choose Custom X,Y from the Placement popup menu. Enter in the x and y values. Choose the desired Icon. Make sure that the Show Description box is not checked. Press the Add button.
62 If you want to use the x,y waypoints as a layer labeling system: Description - Enter your label caption here. Label Placeholders are also supported. X,Y and Placement o You can enter in custom x,y values. You can later use the mouse to move the label. o If you choose one of the endpoints from the Placement popup, you can then choose an option from the popup menu triangle at the end of the description text field. Choosing an option from this menu will fill in the description field with the appropriate values. Icon - Picker the desired icon. Show Description - If this is meant to be a label, make sure that this box is checked. Press the Add button. You can change any value be selecting it in the list and making the appropriate changes. The dx,dy fields are used to offset the description when it is displayed on the drawing. Alternately, you can use the mouse to move the icons and descriptions/labels on the drawing. To delete a X,Y Waypoint, select it from the list and press the Delete button. Click on the Font icon to change the font used for a particular waypoint description. Changing the Rotation value will cause the text to be drawn at that degree of angle. Note: This function is not available in the Linux version. Entering a Radius value will draw a circle around the waypoint with the given radius. Clicking on the icon column will produce the icon picker form, allowing you to change the icon used to mark the waypoint. Checking the checkbox for a waypoint will show that waypoint s description on the drawing. Use the Visible checkbox to turn on/off the visibility of all of the waypoints.
63 Options Delete All Point Choosing this option will delete all x,y points. Show All Descriptions Choosing this option will check the Show Description checkbox for each point. Hide All Descriptions Choosing this option will uncheck the Show Description checkbox for each point. Set All Icons to Currently Selected Icon Choosing this option will set the icon for each x,y point to the currently selected icon. Create Points From Endpoints Choosing this menu option will create an x,y point based on the x,y of each end point on the current layer. Create Points From Endpoints with Lat/Long o o o o Decimal on 1 Line Creates a point with the Lat/Long in decimal as the description. Decimal on 2 Lines Creates two points for each endpoint. The Lat value in decimal for the 1st description and the Long value in decimal for the 2nd description. DMS on 1 Line Creates a point with the Lat/Long in DMS as the description. DMS on 2 Lines Creates two points for each endpoint. The Lat value in DMS for the 1st description and the Long value in DMS for the 2nd description. Create Points From Endpoints with Angles o o On 1 Line Creates a point with the endpoint's angles as the description. On 2 Lines Creates two points for each endpoint. One point contains the interior angle and the other point contains the exterior angle. Create Points From Line Midpoints Choosing this menu option will create an x,y point based on the x,y of the midpoint of each line in the current layer.
64 Create Points From Line Midpoints with Calls Choosing this menu option will create an x,y point based on the x,y of the midpoint of each line in the current layer and pre-populate the description field with the line's call. It will also check the show description checkbox. If the layer's Show Calls In-line checkbox is checked, this option will set the waypoints rotation to match. Create Points From Layer Name and Area Settings Choosing this menu option will create am x,y point for the layer name and layer area at the center of the layer. Create Layer From Points Choosing this menu will take you to the X,Y to Layer form and pre-populate the form with the x,y waypoints.
65 Analyze Layer Closing Error This utility will examine a layer that doesn't close completely for common errors that may have caused the closing error. An example of this would be a curve that should have gone to the left but was entered in as a curve to the right. The utility will present you with a list of possible errors along with a potential solution for the error. You can press Previous Change or Next Change to look at the different potential solutions the utility found. Press the Apply Change button to apply the selected change to the call. Press the slider arrows to see the original layer side by side with the suggested layer change.
66 Tabs Tabs can be used to create additional views from the same layer and call data. Each tab is based on the same layer calls, but can have its own scale, background picture, fill options, etc. This allows for multiple views of the same data to be saved within a single file. Every drawing has a main tab. The main tab cannot be deleted. To create a new tab, press the New Tab button. The new tab will be a copy of the tab that was selected when the new tab button was pressed. To switch between tabs, click on the desired tab in the tab bar. To delete a tab press the red X button on the tab that you wish to delete. Deleting a tab deletes all of the view configurations associated with that tab. Deleting a tab cannot be undone. Deleting a tab will not remove any of the layers or call data, even if the calls or layers where added while viewing the deleted tab. The tab bar can be hidden by un-checking the Show Tabs menu found under the Windows menu. The default for showing tabs can be set in the preferences.
67 Drawing Options Scale The scale can be adjusted by moving the slider control. Clicking on the scale indicator will toggle it between 1"=X' and 1:X formats. Clicking on the popup menu arrow will present you with a popup menu of some common scale settings. You can also choose Custom from the popup menu to enter your own ratios. Choosing Scale Current Layer to Window will set the scale so that the current layer will fill the screen.
68 Screen Centric vs. Printer Centric The drawing can be set to either Screen Centric or to Printer Centric. Screen Centric lets you use your entire screen for the drawing area. This gives you a larger drawing area, but makes printing to a single sheet of paper more difficult. Printer Centric limits your drawing area to the size of your printer's page setup, but printing to a single sheet of paper is easy. Printer Centric defaults to a 8"x10.5" paper size, but can be changed using the Page Setup menu option. Origin The starting point for the drawing can also be set. Auto Center - Causes the plot to remain centered in the drawing unless you manually move it. Top Left - Causes the starting point of the first call to be drawn in the upper, left hand corner of the drawing. Top Right - Causes the starting point of the first call to be drawn in the upper, right hand corner of the drawing. Bottom Left - Causes the starting point of the first call to be drawn in the lower, left hand corner of the drawing. Bottom Right - Causes the starting point of the first call to be drawn in the lower, right hand corner of the drawing. Center of Drawing - Causes the starting point of the first call to be drawn in the center of the drawing. Unlike the Auto-Center option, this only keeps the starting point centered in the drawing and does not keep the entire plot centered in the drawing. The Auto Center option is useful for single layer drawings. The other five options are useful when multiple layers share the same starting point.
69 View Settings Show Area Choosing this option will draw the selected area measurement in the upper left hand corner of the drawing. You can choose to show the area with 0 to 5 decimal places. The number of decimal points chosen here will also be used for other area displays such as label placeholders and layer area captions. Show Scale This option toggles the visibility of the scale tape. If the scale is visible, you can also select which corner of the drawing that you want it to be drawn in. The scale defaults to feet, but the unit of measurement can be changed to any of the supported units of measurement using the unit s popup menu. Show North Arrow This option toggles the visibility of the north arrow. If the arrow is visible, you can also select which corner of the drawing that you want it to be drawn in. There are also several different styles of arrow that can be chosen from the Style popup menu. Show Border This option draws a thick border around the entire drawing. This can be useful for print outs. Show Watermark This option will draw a watermark in the center of the drawing. The watermark will be the text entered in the watermark text field.
70 Labels The labels button will bring on the Label Manager form. Pictures Clicking this button will bring up a popup menu. Choosing Background Picture from the popup menu will bring up the Background Picture form. Choosing Snapshots will bring up the Snapshots form. Title Block This button will bring up the Title Block form. To make the title block visible, check the Show Title Block checkbox. You can choose to anchor the title block in the lower-left or the lower-right of the drawing. The title block fields can also use the % placeholders. Style 1: There are 6 fields that you can enter data into. Directly beneath the data fields is a preview of what the title block will look like.
71 Style 2: Style 2 of the Title Block will show a custom label, the set date, the drawing's scale, the file path, and information about the drawing such as the current layers area and call list.
72 Style 3: Style 3 of the Title Block will show a custom label, the set date, the drawing's scale, the file path, and information and call lists for each layer. The title block will fill the entire bottom of the page and will resize itself up to half of the drawing's height in order to show all of the visible layer's calls. Each layer's text can have the same look, or you can choose to have each layer's calls have a different appearance.
73 Style 4: Style 4 of the Title Block will show a custom label, the set date, the drawing's scale, the file path and layer information. The title block will fill the entire bottom of the page and will resize itself up to half of the drawing's height in order to show all of the visible layer's information. Each layer's text can have the same look, or you can choose to have each layer's calls have a different appearance.
74 Style 5: Style 5 of the Title Block will show three custom labels, the set date, the current layer's information and the option to show the current layer's calls. The title block will fill the entire bottom of the page and the middle field will resize to show all of the entered data. Section Finder See Section Finder.
75 Labels and Captioning Captioning You can enter a single caption for the drawing by entering the caption in the Drawing Caption field. This caption will appear in the lower left hand corner of the drawing. Pressing the Set button will display the caption prior to closing the Label Manager form.
76 Labels You can add labels to the drawing by pressing the Labels button. This will bring up the labels manager form. Existing labels can be edited by right clicking on the label in the main drawing window. The Labels Visible checkbox can be used to toggle the visibility of the layers.
77 To create a new label, enter the label's text in the caption field and press the Add button. A label's caption can also automatically be filled with information about the plot. Click on the menu of choices. button to get a Each label can be rotated in 90-degree increments. Pick the label's angle by choosing the angle from the menu. To edit a label, click on the label in the list. The caption and angle fields will populate with that label's information. Press the Edit button to save your changes to the label. To remove a label, click on the label in the list and then press the Remove button. To remove all labels at once, press the Remove All button. Press the Font button to choose the font style used for the labels. Moving Labels The labels can be positioned on the main drawing by clicking on them and dragging them to the desired location. The labels will attempt to keep their position relative to the scale, when the scale is changed. You can also reset them back to the center by selecting the label in the Label Manager and pressing the Reset Location button. Label Placeholders Labels can also contain placeholder. Placeholders are a symbol that the label will replace with a calculated. Placeholders started with the percent symbol (%). %1 - Current Layer - Area in Sq. Feet %5 - Scale %9 - All Layers - Perimeter in Feet %13 - Layer Setting - Area (when in context) %2 - Current Layer - Area in Acres %6 - All Layers - Area in Sq. Feet %10 - Current Layer - Perimeter in Meters %3 - Current Layer - Area in Hectares %7 - All Layers - Area in Acres %11 - All Layers - Perimeter in Meters %4 - Current Layer - Area in Sq. Meters %8 - Current Layer - Perimeter in Feet %12 - Layer Name (when in context)
78 Floating Text Blocks Pressing the Edit Floating Text Blocks button will bring up the Float Text editor. Press the Add button to create a new floating text block. Enter your text into the text entry field. Press the Save button. You can make the text block invisible by un-checking the Visible checkbox. The text block's black border can be toggled using the Show Border checkbox. The text block's background can be solid or transparent. To edit a floating text block, select it from the list and press the Edit button. Make your changes and press the Save button. Press the Font button to change the text block's font. To delete a floating text block, select it from the list and press the Delete button. Moving Floating Text Blocks Floating text blocks will start out at the top, left corner of the drawing. You can move them by clicking on them and dragging them. You can resize them by clicking on the resizing block in the bottom, right hand corner of the floating text block.
79 Background Picture You can add a background to the drawing by pressing the Pictures button and choosing Background Picture from the popup menu. This will bring up the Background Picture form. You can also bring up this form by right clicking in the main drawing window and choosing Change Background from the popup menu.

80 Click the Load Picture From File button to select a picture to use as the background. Click the Load Picture From Clipboard to paste a picture from the clipboard for the background image. Click the Load Picture from Snapshots button to bring up the Snapshots form. Click the 3rd Party Imaging button to bring up the 3rd Party Imaging form. The background picture can also be set from the Section Finder. Click the Remove Picture button to remove the picture from the background. You can use the Transparency slider to adjust the picture's level of transparency. The visible checkbox can be used to make the background visible or invisible without having to load or remove the picture. The up/down arrows can be used to rotated the background picture by +-.1 degrees. Fit to Screen This option will cause the background picture to stretch to the size of the drawing. Other This option will allow you to choose where the background is drawn. You can either choose an option from the popup menu or press the button to bring up a visual picker. (Visual Picker)
81 Section Auto Center - This will keep the background drawn in the center of the drawing. Top Left - This will keep the top left corner of the background picture pinned to the top left corner of the drawing. Top Right - This will keep the top right corner of the background picture pinned to the top right corner of the drawing. Bottom Left - This will keep the bottom left corner of the background picture pinned to the bottom left corner of the drawing. Bottom Right - This will keep the bottom right corner of the background picture pinned to the bottom right corner of the drawing. Top Left at Center - This will keep the top left corner of the background picture pinned to the center of the drawing. Top Right at Center - This will keep the top right corner of the background picture pinned to the center of the drawing. Bottom Left at Center - This will keep the bottom left corner of the background picture pinned to the center of the drawing. Bottom Right at Center - This will keep the bottom right corner of the background picture pinned to the center of the drawing. Quarter Section Left Middle at Center - This will keep the middle of the left hand side of the background picture pinned to the center of the drawing. Right Middle at Center - This will keep the middle of the right hand side of the background picture pinned to the center of the drawing. Top Middle at Center - This will keep the middle of the top edge of the background picture pinned to the center of the drawing. Bottom Middle at Center - This will keep the middle of the bottom edge of the background picture pinned to the center of the drawing.
82 Quarter of Quarter Section NW/4 Top Middle at Center - This will keep the middle of the top edge of the northwest quarter of the background picture pinned to the center of the drawing. NW/4 Left Middle at Center - This will keep the middle of the left hand side of the north west quarter of the background picture pinned to the center of the drawing. NW/4 Right Middle at Center - This will keep the middle of the right hand side of the north west quarter of the background picture pinned to the center of the drawing. NW/4 Bottom Middle at Center - This will keep the middle of the bottom edge of the northwest quarter of the background picture pinned to the center of the drawing. NE/4 Top Middle at Center - This will keep the middle of the top edge of the northeast quarter of the background picture pinned to the center of the drawing. NE/4 Left Middle at Center - Same as NW/4 Right Middle at Center. NE/4 Right Middle at Center - This will keep the middle of the right side of the north east quarter of the background picture pinned to the center of the drawing. NE/4 Bottom Middle at Center - This will keep the middle of the bottom edge of the northeast quarter of the background picture pinned to the center of the drawing. SW/4 Top Middle at Center - Same as NW/4 Bottom Middle at Center SW/4 Left Middle at Center - This will keep the middle of the left hand side of the south west quarter of the background picture pinned to the center of the drawing. SW/4 Right Middle at Center - This will keep the middle of the right hand side of the south west quarter of the background picture pinned to the center of the drawing. SW/4 Bottom Middle at Center - This will keep the middle of the bottom edge of the south west quarter of the background picture pinned to the center of the drawing. SE/4 Top Middle at Center - Same as NE/4 Bottom Middle at Center SE/4 Left Middle at Center - Same as SW/4 Right Middle at Center SE/4 Right Middle at Center - This will keep the middle of the right hand side of the south east quarter of the background picture pinned to the center of the drawing. SE/4 Bottom Middle at Center - This will keep the bottom edge of the south east quarter of the background picture pinned to the center of the drawing. NW/4 Center at Center - This will keep the center of the north west quarter of the background picture pinned to the center of the drawing. NE/4 Center at Center - This will keep the center of the north east quarter of the background picture pinned to the center of the drawing. SW/4 Center at Center - This will keep the center of the south west quarter of the background picture pinned to the center of the drawing. SE/4 Center at Center - This will keep the center of the south east quarter of the background picture pinned to the center of the drawing.

83 Scale as 1 Mile When this option is selected, the background will be scaled as if it represented 1 square mile. This option will be automatically checked when the background picture is set from the Section Finder. Scale as 4 Miles When this option is selected, the background will be scaled as if it represented 4 square miles. Scale Picture Check this box to have the background draw to scale. Enter the number of feet that the width of the background picture represents and the number of feet that the height of the background picture represents. Common scales, such as 1 square mile, are available from the popup menu arrow. Lock Offset This option allows you to keep the background s offset locked to its origin, or its offset can be locked to a layer s offset. If the background is locked to layer s offset, then the background will move with the layer if the layer is moved by hand. Gird Overlay This option will draw a grid over the background image. This option is best suited for square background images. If no background picture is selected, the grid will still be displayed. Remove Offsets Clicking this button will remove the backgrounds x,y offset that was created when the background was moved with the mouse. Save Picture You can export the background picture to a regular picture file by choosing Save Picture from the File menu.
84 Edit Picture Choosing this menu option will open the currently selected background image in a new window. This window will allow you to crop, resize and rotate the background image. Click and drag on the picture to make a selection. Set Picture as Background Choosing this menu will set the current picture as the background picture. Keep Selection Square When this menu is checked, when making a selection, the selection will constrain itself to a square. Press the shift key while making a selection will also constrain the selection to a square. Rotate Choosing either of the Rotate menus will cause the picture to rotate 1/10th of a degree either clockwise or counterclockwise.
85 Floating Pictures This feature lets you place pictures onto your drawing. The pictures can be moved and resized by clicking on them on the drawing. To add a floating picture, click the add button and select your picture. The picture will be added to the upper-left hand corner of your drawing. Checking the Background checkbox will cause the picture to be drawn on the background layer, behind the layer drawings. To delete a floating picture, select the picture from the list and press the Delete button.
86 Snapshots The Snapshots feature is a repository for images. The images stored as snapshots can come from external sources or they can be created from within the software. Snapshots can be used to store images such as different views of the drawing or different pictures to use as background pictures.
87 Adding Snapshots: To save the current drawing as a snapshot, press the Save Drawing as Snapshot button. You can optionally enter in a description for the snapshot prior to pressing the save button. To load an external image as a snapshot, press the Load File as Snapshot button. Managing Snapshots: To manage a snapshot, select it from the Stored Snapshots list. Once selected, the following options will become available: View Snapshot: Press this button to view the snapshot in a full screen viewer. Press the Close button to close the full screen viewer. Print Snapshot: Press this button to print the selected snapshot. Export Snapshot: Press this button to save the snapshot as a external picture file. Change Description: Press this button to change the snapshots description. This will bring a a form where you can enter in a new description. Press the Save button to close the Change Description form. Delete Snapshot: Press this button to delete the selected snapshot. Set as Background: Press this button to set the selected snapshot as the background picture for the drawing.
88 3rd Party Imaging 3rd Party Imaging helps automate downloading images from 3rd party websites and integrating those images into a Metes and Bounds drawing. How to use 3rd Party Imaging: Enter the latitude and longitude into the appropriate fields. Click on the Send Coordinates To button and select the desired 3 rd Party website. This will send the appropriate URL to the built-in web browser to display the entered lat/long. Pressing the Take Screenshot button will take a screenshot of the current screen. o If the URL was sent to the internal web browser, the screenshot will automatically be cropped to the area contained by the built-in web browser. o o If the URL was sent to an external web browser, the screenshot will capture the entire screen. The screenshot will then be automatically sent to the Edit Picture form where you can crop the screenshot to include just the area that you are interested in. Because this feature relies on 3rd party services, the functionality is subject to change without notice. Metes and Bounds is not sponsored, authorized, or endorsed by any of the companies featured on this form. All 3rd party content is subject to change without notice. Please visit each company's website for the appropriate terms of use.
89 Opening, Saving, Printing and Exporting New Drawing To create a new drawing, choose New Drawing from the File menu. This will open a new, blank window. Open To open a saved drawing, choose Open from the File menu. The last 5 opened or saved files can be chosen from the Open Recent file menu. You can also use Open to open files sent by the iphone version of Metes and Bounds. Open As Layer An existing saved file can be opened as a new layer in the current drawing by choosing Open As Layer from the File menu. Saving To save your drawing, choose Save from the File menu. To save a copy of your drawing, choose Save As from the File menu. Pictures The drawing can also be saved as a picture. To save a picture of the drawing exactly as it appears on screen, choose Save as Picture (Screen) from the File menu. To save a full size picture of the drawing, choose Save as Picture (Full) from the File menu. This option is helpful for pictures that are scaled larger than the screen. A picture of the current drawing can also be copied to the clipboard. To copy the drawing to the clipboard choose Copy Drawing as Picture from the Edit menu. Print Call Lists This will print the call lists for all visible layers.
90 Import Import Call List: This option will allow you to choosing between importing a call list in the Metes and Bounds style or one of the Alternate styles. The Alternate styles can be used to import call lists from other 3rd party programs. Import X,Y Points: This option will allow you to import a list of x,y points and create a new layer from them. Import DXF File: This option will allow you to import a DXF file. Import Lat/Long: This option will allow you to import the following types of Lat/Long files: Comma separated list of lat/long values GPX Tracks GPX Waypoints KML files Shapefile

91 Export DXF: The drawing data can be exported as a DXF file. To export just the current layer as DXF, choose Export as DXF from the File menu. Often 3rd party applications require the DXF file to be in a specific format in order to import properly. Choose the DXF format that best works with your 3rd party application. To export all of the visible layers as DXF, choose Export All Layers as DXF from the File menu. Exporting a single layer will use the POB X,Y settings (if any) for the coordinates. Exporting all of the layers will use its own coordinates so that the DXF will look identical to the layers drawn on the screen.
92 Point Coordinates: This will allow you to save the point coordinates, as shown using the Show Layer Point Coordinates menu under the Tools menu, as a delimited text file. The points will be saved using the POB X,Y settings (if any). Choosing this menu option will bring up the following window: Choose either comma, tab or space from the popup menu to pick which character will be used to delimit the file. Check the Include Layer # checkbox if you want include a layer number as an additional field in the file. Choose the unit of measurement so save the coordinates in. Check the Round to Nearest Unit checkbox to round the exported values to the nearest unit.
93 KML Format: This will save the current layer in the KML file format. Choosing this menu will bring up the following dialog box that will allow you to modify some of the KML settings.
94 Call List: This will allow you to export the call list to a text file. The call list can be exported as either the Metes and Bounds style (N 12:34:56 E 100) or an Alternate style (n e 100). The Alternate style can be used to export call lists for importing into other 3rd party programs. The current layer can be exported in both styles. Exporting all layers can only be done in the alternate style.
95 Lat/Long Waypoints as GPX: This will allow you to export any layer's lat/long waypoints as a GPX file. Export Current Layer as Shapefile: This will allow you to export the current layer as a lat/long shapefile. Export Current Layer as SVG: This will allow you to export the current layer as a SVG file.

96 Export Compass Rule: This option will allow you to save or print a table showing the compass rule data for the selected layer.
97 Printing Page Setup This will preset you with the page setup dialog for your printer. These setting will be used by the Size Window to Printer and Show Printer Watermark features listed below. This also allows you to set the drawing size for Printer Centric drawings. Screen Centric Printing These features help you setup a Screen Centric drawing for printing. Size Window to Printer This will resize the drawing window so that the drawing area will represent a single piece of paper. Printing with the drawing window sized to the same size as the printer settings will produce the highest quality printing. Show Printer Watermark This will cause a watermark to be drawn that represents a single piece of paper. Print This will present you with a print option form. This form allows you to preview how the drawing will print using several different printing options. o Use the arrows to help center the drawing. o Press the Scale button to adjust the printings scale. o Press the Reset button to clear all printing adjustments. o o o Print as Printer Centric. This will print the drawing as if drawing was set as Printer Centric. It is also the same as choosing the Size Window to Printer option. Printer Watermark. This will print the area of the drawing that is shown under the Show Printer Water overlay. Print Scaled. This will scale the drawing to fit on a single sheet of paper.
98 Printer Centric Printing Printing a Printer Centric drawing is automatic as the drawing has already been configured for the printer. So features such as Size Window to Printer and Show Printer Watermark are not needed. Print This will print the current drawing. Print Picture (Screen) will resize the visible drawing to fit on a single sheet of paper and then print the drawing as a picture. (Full) will print the drawing at the full-scale size and will print on as many sheets of paper as needed.
99 Calculate Menu Find Area You can find the area of a plot by choosing one of the Find options from the Calculate menu. You can find the area in feet, meters, acres and hectares. Current Layer Area From Line Width When the layer's line width is set to scale, choosing this option will calculate the area represented by the width of the line. Area of Layer Minus Sub-Plots This function allows you to find the area of a master plot, minus the area of multiple sub-plots.
100 Choose a master plot from the layer list. Check all of the layers that are considered a sub-plot of the master plot. Press the Calculate button. You will be presented with the area of the master plot, the area of each selected sub-plot, and the area remaining after the sub-plots' area is subtracted from the master plot's area. Show Current Layer's Description This menu will create a description from the current layer's calls. This description can be saved to a text file or copied to the clipboard.
101 Show Layer X,Y Point Coordinates You can find the X, Y points of a drawing by choosing Show Point Coordinates from the Calculate menu. These values will use the POB X,Y settings if available. You can choose the number of decimal places to show the list as well as the type of units to use. The list can be exported as a text file or copied to the clipboard.
102 Calculate Perimeter To find the perimeter distance of a plot, choose Calculate Perimeter from the Calculate menu. You can choose which unit of measurement this calculation is made in. You can also create a new layer label from this calculation.
103 Current Layer Angle Totals This function provides a total count of the internal and external angles for the current layer.
104 Check for Closure You can check to see if a plot description closes completely by choosing Check for Closure from the Calculate menu. If the plot description does not close, this will show you how far off the description is. You can also create a new layer label from this data. You can also choose which unit of measurement this information is presented in. Unit Conversion Calculator Choose this menu option to bring up the conversion calculator form.


105 Decimal Angle to Degrees This will bring up a form that will allow you to convert an angle that is expressed as a decimal into an angle that is expressed in degrees, minutes and seconds. Degree Angle to Decimal This will bring up a form that will allow you to enter an angle that is in Degree/Minute/Second format and convert it into a decimal angle.
106 Azimuth to Bearing This feature can be used to change compass style calls into bounds data.
107 Angle Calculator This feature can be used to convert a plot description that is written using interior and exterior angles into a plot description that is written using metes and bounds.
108 Call Between Two Endpoints This feature will return the metes and bounds call between two endpoints for the current layer.
109 Latitude / Longitude Calculator To calculate the distance, angle or bearing between any two latitude/longitude points enter the data into points 1 and 2 and then press the appropriate calculation button. To project a waypoint enter the starting point into Point #1 and press the Project Point button. This will bring up the Project Waypoint form. Enter in the angle and distance to the new waypoint. The new waypoint's lat/long will be placed in Point #2.
110 Latitude / Longitude Calculator (Continued) The latitude/longitude of each end point for a given layer can be calculated by choosing the appropriate layer from the layer popup menu and pressing the Get Coordinates button. If the latitude and longitude for the POB has not yet been set, you will be prompted to enter this value. You can choose how many decimal places the coordinates are calculated to by choosing the number from the Decimal Places popup menu. Once the end point lat/long has been calculated, you can easily enter the point data into the calculator above by selecting the point and pressing either the Set Point 1 or the Set Point 2 button. A layer's end point lat/long coordinates can be saved as a GPX file from by choosing Export Lat/Long as GPX from the File menu. A layer's end point lat/long coordinates can be saved as a text file by choosing Export Lat/Long as Text File from the File menu. A layer's end point lat/long coordinates can be saved as a comma delimited text file by choosing Export Lat/Long as Comma Delimited from the File menu. A layer's end point lat/long coordinates can be sent to the Lat/Long to Layer tool by choosing Send Coordinates to Layer Converter from the Options menu. A layer's end point lat/long coordinates can be set as waypoints by choosing the Create Waypoints From Lat/Long from the Options menu. The waypoints will be added to the main window's currently selected layer. Point #2 can be used to set the current layer's POB by selecting Set Current Layer POB to Point 2 Lat/Long from the Options Menu. Checking the Display as DMS box will cause the lat/long coordinates to be displayed as Degree/Minute/Second instead of as decimal values.
111 Declination Calculator This function will find the declination between two lat/long points calculated by the software and two lat/long points as measured by a separate device. Select the two endpoints for the calculated coordinates. Enter the measured lat/long for the same two points. Press the Find Declination button to find the rotation between the calculated and measured values.
112 UTM to Lat/Long Calculator Use this form to convert UTM values to Lat/Long and vise-versa. Easting and Northing values can be entered from a World File by using the popup menu triangle.
113 SPCS to Metes and Bounds Call This feature will return a metes and bounds call for two SPCS points. It can also create a new layer from a series of SPCS points. When creating a layer, the software can import comma separated values files in the form of P,Y,X,Z and X,Y.
114 Project Waypoint Project Waypoint takes the Lat/Long of an existing waypoint, an angle and a distance and calculates a new waypoint. Or, you can use the Lat/Long of an existing waypoint and a metes and bounds call to calculate a new waypoint.
115 Tools Menu Set Scale This option allows you to set the drawing's scale numerically. This is the same as Right-Clicking on the scale in the drawing options and choosing Custom. Measurement Tool Checking this menu will put the software in measurement mode. This mode allows you to see the distance between any two points on the screen. It will also show you the call represented by the line between those two points. When first activated, there will be a message in the upper left hand corner of the drawing prompting you to pick the first point. Click anywhere on the drawing to set the first point. If you hold down the shift key while selecting a point, the endpoints will be marked with easy to hit targets. Then, click anywhere else on the drawing to set the second point. The message will now change to the distance between those two points. Click anywhere on the drawing to reset the measurement tool. The measurement mode can be turned off by pressing the escape key, clicking on the measurement message or by un-checking this menu. After the second point has been selected, you can turn the line into a call by selecting Measurement Tool - Add Call from the Tools menu. Call Drawing Tool Selecting this tool will allow you to draw calls on the drawing. If the current layer already has at least one call, the drawn call will be appended to the existing call list. If the current layer does not contain any calls, the first call created will be an invisible call from the drawing's origin to the first point selected. All subsequent calls will be visible. This tool is not available if the drawing's origin is set to Auto-Center. Press the Escape key (Esc) or uncheck the tool menu to exit call drawing mode. Move Background When this menu option is checked, the background can be moved by clicking on it and dragging it with the mouse. Uncheck this menu option when you are finished moving the background. Alignment Tool Checking this menu will put the software in layer alignment mode. This mode allows for point-and-click positioning of layers. While in this mode each layer will be drawn with its endpoints on. Click on the first endpoint and then click on an endpoint of a second layer. The first endpoint will align itself to the second endpoint.


116 Merge Layers This function helps with merging two layers into a single, new layer. See Tutorial #8 for additional information on merging layers. Segment Calls Segment Calls allows you to break calls into lengths that are no longer than N feet. Doing this will create a new layer with the calls broken into lengths no greater than N feet. This only effects lines and will not make any changes to curves.
117 Data Entry Mode See Entering Data. Set Views to Data Entry Mode While in Data Entry Mode, choosing this menu option will set the "view as" options for the call list, line lengths and floating call list to match that of the current data entry mode. Convert Auto-Center to Center of Drawing This option will convert a drawing from Auto-Center to Center of Drawing. Current Layer Convert Unit Type This option allows you to convert all of the calls in the current layer to a specific unit of measurement.
118 Current Layer Replace Unit Type This option will replace the unit of measurement for all calls in the current layer. This function will not convert the length entered for the call to the new unit of measurement. For example, 100 feet will become 100 meters.
119 Convert Lat/Long to Layer To convert a set of latitude, longitude coordinates into a set of metes and bounds calls, enter the points into the above form and press the Convert to Layer button. This will create a new layer and populate it with the data represented by the latitude and longitude points. You can set the layer's name by entering it in the Layer Name field. Pressing the Project Point button will take the current value in the Lat/Long fields and prompt you for an angle and a distance (in feet). It will then create a new point at that location.
120 Convert Lat/Long to Layer (continued) Choosing Import GPX File from the File menu will import a list a waypoints or tracks to be converted to a new layer. Choosing Import Delimited Text File from the File menu will import a list of lat/long coordinates to be converted to a new layer. Choosing Import KML File from the File menu will import a layer from a KML file. If the KML file includes more than one layer you will be prompted to select which layer to import. Note: Importing KML files only works on text based KML files. Binary KML files cannot be imported.
121 Convert X,Y to Layer This form will convert a set of X,Y coordinates into a set of Metes and Bounds calls. Enter the data as X,Y and press the Add button. Pressing the Delete button will delete the selected X,Y coordinate. Pressing the Convert to Layer button will create the Metes and Bounds calls. Press the Cancel button to close the form without creating any Metes and Bounds calls. You can choose a name for the layer by entering it into the Name field. You can choose the unit of measurement that the units are in from the unit popup menu. Import Comma Separated Values: Choosing this option from the File menu will allow you to import a comma delimited text file of X,Y points.
122 Window Menu This menu will allow you to open any of the data entry and drawing/layer settings forms. Show Status Bar Checking this menu will cause the status bar to be visible for this window. The status bar will show information for which drawing item is currently under the mouse cursor. Show Toolbar Checking this menu will cause the toolbar to be visible for this window. The toolbar can be customized in the preferences. Show Tab Bar Checking this menu will cause the tab bar to be visible for this window. The bottom of the Window menu will show all open files. Selecting one of these menu items will bring that window to the foreground.
123 Conversion Table Conversion Table 3 hands = 1 foot 1 span = 9 inches 1 rod, pole or perch = 16.5 feet 40 poles = 1 furlong 8 furlongs = 1 mile 320 rods = 1 mile 3 miles = 1 league 1 vara = 33 1/3 inches 1 square foot = 144 sq. in. 1 square yard = 9 sq. ft 1 acre = 4,840 sq. yd 1 square mile = 640 acres To Convert: Feet to Meters: Multiply Feet by Meters to Feet: Multiply Meters by Yards to Meters: Multiply Yards by Meters to Yards: Multiply Meters by Miles to Kilometers: Multiply Miles by Kilometers to Miles: Multiply Kilometers by Sq. Feet to Sq. Meters: Multiply Sq. Feet by.0929 Sq. Meters to Sq. Feet: Multiply Sq. Meters by Acres to Hectares: Multiply Acres by Hectares to Acres: Multiply Hectares by Also see the conversion calculator.
124 Conversion Calculator You can use the conversion calculator to convert between any two units of measurement.
125 Preferences Settings Tab Colors: To change the various colors that Metes and Bounds uses to draw the different components, click on the associated colored rectangle. Press the Defaults button to return the colors back to their original settings. Include Page Numbers This option allows you to print the page numbers when printing a full/multi-page drawing.
126 Show Status Bar in New Drawings Checking this will cause the status bar to be visible when a new drawing window opens. Show Tab Bar in New Drawings Checking this will cause the tab bar to be visible when a new drawing window opens. Scroll Wheel / Gesture This popup menu allows you to choose how the scroll wheel, or other gestures, will function. Use 1" Scale Type Checking this box will cause the scale tape to always draw as 1" instead of the auto-adjusting its size. Show Rods/Poles/Perch as Rods When this is checked, the software will show Rods instead of Rods/Poles/Perch in places such as the floating call list and line labels. Enable Large Scales Checking this option will increase the size the amount by which the drawing can be zoomed out. However, some features may not respond as expected while this option is turned on. Default to Meters When Available When this option is checked, the software will default to meters instead of feet when choosing meters is available. For example, if calls are entered on the main screen, the lengths will be considered to be meters instead of feet. And other forms, such as the floating call list, will default to showing meters instead of feet. Check For Updates Check this box to be notified when new versions of the software are available.
127 Defaults Tab Drawing: Use this section to set the default scale, origin and other options for new drawings. Layers: Press the Set Layer Defaults button to set the current layer's configuration to be used for all new layers. This can be cleared by pressing the Defaults button.
128 Toolbar Tab Show Toolbar in New Drawings Checking this will cause the toolbar to be visible when a new drawing window opens. Toolbar Items The items that are checked will appear in the toolbar.
129 How to Register, Upgrade or Renew Metes and Bounds How to Register: To register Metes and Bounds choose Register... from the File menu. Enter your serial number into the serial number box and press the Register button. If you need to purchase a serial number you can press the Purchase Basic button to purchase the Basic version or Purchase Professional to purchase the Pro version. Upgrading from Basic to Pro: If you wish to upgrade your Basic version to the Pro version you can do so by selecting Upgrade... from the File menu. Enter your upgrade serial number into the serial number box and press the Register button. If you need to purchase an upgrade serial number you can do so be pressing the Upgrade to Professional button. Renewing an update subscription: If your update subscription has expired or is about to expire, your can renew your subscription for another year by choosing Renew Update Subscription... from the File menu. Enter your renewal code (serial number) in the renewal code box and press the Renew button. If you need to purchase a renew code you can do so by pressing the Purchase Renewal Code button. You can view how long your current update subscription is good for by opening the About Box. A new renewal code will add 1 year from the date that the renewal code was purchased. Please Note: Renewing is optional. If you are happy with your current version, then there is no need to renew. You only need to renew if you want to keep up with all of the latest updates. Note #2: If you currently own the Basic version and the update subscription has expired and you have been considering upgrading to the Pro version, now may be a good time to do so. The Basic to Pro Upgrade will also renew your update subscription for another year. Registering Metes and Bounds on a new computer: If you have purchased a new computer, or are recovering from a hard drive failure, you can use these steps to reregister Metes and Bounds: 1. Enter your Basic or Pro serial number. If you purchased the Basic version and then upgraded to the Pro version, you will need to enter in your Basic serial number first and then enter your Basic to Pro Upgrade serial number. 2. If your Basic or Pro serial number has expired, you will be prompted to enter in your renewal code. Enter in your most recent renewal code.
130 Expired Serial Numbers/Renewal Codes: If the software tells you that your serial number has expired, that means that your serial number is too old to use the latest version of the software. There are two options available to address this. 1. Purchase an Update Subscription Renewal. This will allow you to use the latest version of the software. It will also allow you to use any new updates that are released in the next year. 2. Install an older version of the software that will work with your serial number. To find the last version of the software to support your serial number, open the About Box and click on the Advanced tab. Note the Subscription Renewal Code. Then go to the older versions website and download the version that matches your code. Lost Serial Numbers: If you have lost your serial number(s), you can find them by going to our support web page and clicking on the find serial number link.
Linkage 3.2. User s Guide
 Linkage 3.2 User s Guide David Rector Wednesday, April 06, 2016 Table of Contents Table of Contents... 2 Installation... 3 Running the Linkage Program... 3 Simple Mechanism Tutorial... 5 Mouse Operations...
Instructions for Creating a Poster for Arts and Humanities Research Day Using PowerPoint
 Instructions for Creating a Poster for Arts and Humanities Research Day Using PowerPoint While it is, of course, possible to create a Research Day poster using a graphics editing programme such as Adobe
Welcome to CorelDRAW, a comprehensive vector-based drawing and graphic-design program for the graphics professional.
 Workspace tour Welcome to CorelDRAW, a comprehensive vector-based drawing and graphic-design program for the graphics professional. In this tutorial, you will become familiar with the terminology and workspace
Plotting: Customizing the Graph
 Plotting: Customizing the Graph Data Plots: General Tips Making a Data Plot Active Within a graph layer, only one data plot can be active. A data plot must be set active before you can use the Data Selector
Chapter 23: Drafting in Worksheet View
 Chapter 23: Drafting in Worksheet View Worksheet View is a powerful, 2D production drafting module. Here you can find all of the drawing and editing tools needed to create fast, accurate, detailed working
Adobe Illustrator CS5 Part 1: Introduction to Illustrator
 CALIFORNIA STATE UNIVERSITY, LOS ANGELES INFORMATION TECHNOLOGY SERVICES Adobe Illustrator CS5 Part 1: Introduction to Illustrator Summer 2011, Version 1.0 Table of Contents Introduction...2 Downloading
User Guide. idraw for Mac OS X v2.5.1
 User Guide idraw for Mac OS X v2.5.1 1 Welcome to idraw 6 Vector Illustration 6 Getting Started 8 Creating a New Document 8 Interface Overview 10 Document Tabs 11 Switching Between Documents 11 Closing
2013 Getting Started Guide
 2013 Getting Started Guide The contents of this guide and accompanying exercises were originally created by Nemetschek Vectorworks, Inc. Vectorworks Fundamentals Getting Started Guide Created using: Vectorworks
Creating Interactive PDF Forms
 Creating Interactive PDF Forms Using Adobe Acrobat X Pro Information Technology Services Outreach and Distance Learning Technologies Copyright 2012 KSU Department of Information Technology Services This
Writer Guide. Chapter 15 Using Forms in Writer
 Writer Guide Chapter 15 Using Forms in Writer Copyright This document is Copyright 2005 2008 by its contributors as listed in the section titled Authors. You may distribute it and/or modify it under the
If you know exactly how you want your business forms to look and don t mind detail
 Advanced Form Customization APPENDIX E If you know exactly how you want your business forms to look and don t mind detail work, you can customize QuickBooks forms however you want. With QuickBooks Layout
Chapter 15 Using Forms in Writer
 Writer Guide Chapter 15 Using Forms in Writer OpenOffice.org Copyright This document is Copyright 2005 2006 by its contributors as listed in the section titled Authors. You can distribute it and/or modify
PowerPoint 2007 Basics Website: http://etc.usf.edu/te/
 Website: http://etc.usf.edu/te/ PowerPoint is the presentation program included in the Microsoft Office suite. With PowerPoint, you can create engaging presentations that can be presented in person, online,
Design document Goal Technology Description
 Design document Goal OpenOrienteering Mapper is a program to draw orienteering maps. It helps both in the surveying and the following final drawing task. Support for course setting is not a priority because
Layout Tutorial. Getting Started
 Getting Started Layout Tutorial This tutorial will explain how create a layout template, send views to a layout page, then save the document in PDF format. In this tutorial you will learn about: Creating
SMART Notebook 10 User s Guide. Linux Operating Systems
 SMART Notebook 10 User s Guide Linux Operating Systems Product Registration If you register your SMART product, we ll notify you of new features and software upgrades. Register online at www.smarttech.com/registration.
Introduction to Microsoft Word 2008
 1. Launch Microsoft Word icon in Applications > Microsoft Office 2008 (or on the Dock). 2. When the Project Gallery opens, view some of the available Word templates by clicking to expand the Groups, and
GUIDELINES FOR PREPARING POSTERS USING POWERPOINT PRESENTATION SOFTWARE
 Society for the Teaching of Psychology (APA Division 2) OFFICE OF TEACHING RESOURCES IN PSYCHOLOGY (OTRP) Department of Psychology, Georgia Southern University, P. O. Box 8041, Statesboro, GA 30460-8041
What is new in WiseImage
 Additional RAM support for 64-bit OS Now WiseImage installed on Windows 64-bit is able to use up to 3.5 3.7 GB of RAM, whereas the previous versions of WiseImage could not use more than 1.5 GB of RAM.
Guide To Creating Academic Posters Using Microsoft PowerPoint 2010
 Guide To Creating Academic Posters Using Microsoft PowerPoint 2010 INFORMATION SERVICES Version 3.0 July 2011 Table of Contents Section 1 - Introduction... 1 Section 2 - Initial Preparation... 2 2.1 Overall
Tutorials. If you have any questions, comments, or suggestions about these lessons, don't hesitate to contact us at [email protected].
 Tutorials The lesson schedules for these tutorials were installed when you installed Milestones Professional 2010. They can be accessed under File Open a File Lesson Chart. If you have any questions, comments,
Creating a PowerPoint Poster using Windows
 Creating a PowerPoint Poster using Windows Copyright 2001 Michael Dougherty ([email protected]) Purpose The purpose of this tutorial is to illustrate how to create a 3 x 4 ft. poster using PowerPoint. This
Intro to Excel spreadsheets
 Intro to Excel spreadsheets What are the objectives of this document? The objectives of document are: 1. Familiarize you with what a spreadsheet is, how it works, and what its capabilities are; 2. Using
SketchUp Instructions
 SketchUp Instructions Every architect needs to know how to use SketchUp! SketchUp is free from Google just Google it and download to your computer. You can do just about anything with it, but it is especially
Creating Drawings in Pro/ENGINEER
 6 Creating Drawings in Pro/ENGINEER This chapter shows you how to bring the cell phone models and the assembly you ve created into the Pro/ENGINEER Drawing mode to create a drawing. A mechanical drawing
Smart Board Notebook Software A guide for new Smart Board users
 Smart Board Notebook Software A guide for new Smart Board users This guide will address the following tasks in Notebook: 1. Adding shapes, text, and pictures. 2. Searching the Gallery. 3. Arranging objects
Basic AutoSketch Manual
 Basic AutoSketch Manual Instruction for students Skf-Manual.doc of 3 Contents BASIC AUTOSKETCH MANUAL... INSTRUCTION FOR STUDENTS... BASIC AUTOSKETCH INSTRUCTION... 3 SCREEN LAYOUT... 3 MENU BAR... 3 FILE
Task Card #2 SMART Board: Notebook
 Task Card #2 SMART Board: Notebook Objectives: Participants will learn how to utilize the SMART Notebook. Table of Contents: Launching The SMART Notebook Page 1 Entering Text Page 1 Top Toolbar Page 2
PowerPoint: Graphics and SmartArt
 PowerPoint: Graphics and SmartArt Contents Inserting Objects... 2 Picture from File... 2 Clip Art... 2 Shapes... 3 SmartArt... 3 WordArt... 3 Formatting Objects... 4 Move a picture, shape, text box, or
Handout: How to Use Excel 2010
 How to Use Excel 2010 Table of Contents THE EXCEL ENVIRONMENT... 4 MOVE OR SCROLL THROUGH A WORKSHEET... 5 USE THE SCROLL BARS TO MOVE THROUGH A WORKSHEET... 5 USE THE ARROW KEYS TO MOVE THROUGH A WORKSHEET...
House Design Tutorial
 Chapter 2: House Design Tutorial This House Design Tutorial shows you how to get started on a design project. The tutorials that follow continue with the same plan. When we are finished, we will have created
How to build text and objects in the Titler
 How to build text and objects in the Titler You can use the Titler in Adobe Premiere Pro to create text and geometric objects. There are three methods for creating text, each capable of producing either
Introduction to Autodesk Inventor for F1 in Schools
 Introduction to Autodesk Inventor for F1 in Schools F1 in Schools Race Car In this course you will be introduced to Autodesk Inventor, which is the centerpiece of Autodesk s digital prototyping strategy
Introduction to Autodesk Inventor for F1 in Schools
 F1 in Schools race car Introduction to Autodesk Inventor for F1 in Schools In this course you will be introduced to Autodesk Inventor, which is the centerpiece of Autodesk s Digital Prototyping strategy
Contents. The OWRB Floodplain Viewer. Creating Maps... 8. Helpful Tips... 10
 Contents QUICK START GUIDE... 2-5 Add layers...9 Search for Layers...9 COMPREHENSIVE GUIDE... 6 Navigate the map...6 Locate specific places...6 Add layer from file...9 Add layer from web...9 Display pop-up
Vodafone Business Product Management Group. Hosted Services EasySiteWizard Pro 8 User Guide
 Vodafone Business Product Management Group Hosted Services EasySiteWizard Pro 8 User Guide Vodafone Group 2010 Other than as permitted by law, no part of this document may be reproduced, adapted, or distributed,
User s Manual. Edraw Max V7.7. Professional diagram and communicate with essential Edraw solution
 V7.7 User s Manual Professional diagram and communicate with essential Edraw solution 2004-2014 EdrawSoft. All right reserved. Edraw and Edraw logo are registered trademarks of EdrawSoft. Contents Professional
BD CellQuest Pro Software Analysis Tutorial
 BD CellQuest Pro Analysis Tutorial This tutorial guides you through an analysis example using BD CellQuest Pro software. If you are already familiar with BD CellQuest Pro software on Mac OS 9, refer to
Basic Excel Handbook
 2 5 2 7 1 1 0 4 3 9 8 1 Basic Excel Handbook Version 3.6 May 6, 2008 Contents Contents... 1 Part I: Background Information...3 About This Handbook... 4 Excel Terminology... 5 Excel Terminology (cont.)...
Working With Animation: Introduction to Flash
 Working With Animation: Introduction to Flash With Adobe Flash, you can create artwork and animations that add motion and visual interest to your Web pages. Flash movies can be interactive users can click
In this session, we will explain some of the basics of word processing. 1. Start Microsoft Word 11. Edit the Document cut & move
 WORD PROCESSING In this session, we will explain some of the basics of word processing. The following are the outlines: 1. Start Microsoft Word 11. Edit the Document cut & move 2. Describe the Word Screen
Traffic Management App. User Guide
 Traffic Management App User Guide content section one Introduction 2 Logging In 2 section two Creating a new Traffic Management Plan 4 Identifying the location 4 Associating with a non-streetworks or unplanned
WEB TRADER USER MANUAL
 WEB TRADER USER MANUAL Web Trader... 2 Getting Started... 4 Logging In... 5 The Workspace... 6 Main menu... 7 File... 7 Instruments... 8 View... 8 Quotes View... 9 Advanced View...11 Accounts View...11
Business Objects Version 5 : Introduction
 Business Objects Version 5 : Introduction Page 1 TABLE OF CONTENTS Introduction About Business Objects Changing Your Password Retrieving Pre-Defined Reports Formatting Your Report Using the Slice and Dice
Getting Started With DraftSight A Guide For AEC Users
 Getting Started With DraftSight A Guide For AEC Users DraftSight.com Facebook.com/DraftSight Welcome to DraftSight a valuable tool for any AEC professional! DraftSight is more than a free, professional-grade
Microsoft Excel 2010 Linking Worksheets and Workbooks
 Microsoft Excel 2010 Linking Worksheets and Workbooks Email: [email protected] Web Page: http://training.health.ufl.edu Microsoft Excel 2010: Linking Worksheets & Workbooks 1.5 hour Topics include
QUICK REFERENCE: ADOBE ILLUSTRATOR CS2 AND CS3 SECTION 1: CS3 TOOL BOX: PAGE 2 SECTION 2: CS2 TOOL BOX: PAGE 11
 QUICK REFERENCE, ADOBE ILLUSTRATOR, PAGE 1 QUICK REFERENCE: ADOBE ILLUSTRATOR CS2 AND CS3 CS2 SECTION 1: CS3 TOOL BOX: PAGE 2 SECTION 2: CS2 TOOL BOX: PAGE 11 SECTION 3: GENERAL CONCEPTS: PAGE 14 SELECTING
What s New V 11. Preferences: Parameters: Layout/ Modifications: Reverse mouse scroll wheel zoom direction
 What s New V 11 Preferences: Reverse mouse scroll wheel zoom direction Assign mouse scroll wheel Middle Button as Fine tune Pricing Method (Manufacturing/Design) Display- Display Long Name Parameters:
Microsoft Excel 2010 Tutorial
 1 Microsoft Excel 2010 Tutorial Excel is a spreadsheet program in the Microsoft Office system. You can use Excel to create and format workbooks (a collection of spreadsheets) in order to analyze data and
How to make a line graph using Excel 2007
 How to make a line graph using Excel 2007 Format your data sheet Make sure you have a title and each column of data has a title. If you are entering data by hand, use time or the independent variable in
Microsoft Word 2010 Prepared by Computing Services at the Eastman School of Music July 2010
 Microsoft Word 2010 Prepared by Computing Services at the Eastman School of Music July 2010 Contents Microsoft Office Interface... 4 File Ribbon Tab... 5 Microsoft Office Quick Access Toolbar... 6 Appearance
13-1. This chapter explains how to use different objects.
 13-1 13.Objects This chapter explains how to use different objects. 13.1. Bit Lamp... 13-3 13.2. Word Lamp... 13-5 13.3. Set Bit... 13-9 13.4. Set Word... 13-11 13.5. Function Key... 13-18 13.6. Toggle
Creating an invitation
 Creating an invitation Michaela Maginot About the author Michaela Maginot lives in Unterhaching, Germany, not too far from Munich. She graduated from the Deutschen Meisterschule für Mode (German Master
KaleidaGraph Quick Start Guide
 KaleidaGraph Quick Start Guide This document is a hands-on guide that walks you through the use of KaleidaGraph. You will probably want to print this guide and then start your exploration of the product.
Publisher 2010 Cheat Sheet
 April 20, 2012 Publisher 2010 Cheat Sheet Toolbar customize click on arrow and then check the ones you want a shortcut for File Tab (has new, open save, print, and shows recent documents, and has choices
http://school-maths.com Gerrit Stols
 For more info and downloads go to: http://school-maths.com Gerrit Stols Acknowledgements GeoGebra is dynamic mathematics open source (free) software for learning and teaching mathematics in schools. It
Epson Brightlink Interactive Board and Pen Training. Step One: Install the Brightlink Easy Interactive Driver
 California State University, Fullerton Campus Information Technology Division Documentation and Training Services Handout Epson Brightlink Interactive Board and Pen Training Downloading Brightlink Drivers
Access 2007 Creating Forms Table of Contents
 Access 2007 Creating Forms Table of Contents CREATING FORMS IN ACCESS 2007... 3 UNDERSTAND LAYOUT VIEW AND DESIGN VIEW... 3 LAYOUT VIEW... 3 DESIGN VIEW... 3 UNDERSTAND CONTROLS... 4 BOUND CONTROL... 4
NDSU Technology Learning & Media Center
 1 NDSU Technology Learning & Media Center QBB 150C 231-5130 www.ndsu.edu/its/tlmc Creating a Large Format Poster (Plot) Using PowerPoint 2013 Posters should be designed and created in a manner that best
The following is an overview of lessons included in the tutorial.
 Chapter 2 Tutorial Tutorial Introduction This tutorial is designed to introduce you to some of Surfer's basic features. After you have completed the tutorial, you should be able to begin creating your
STATGRAPHICS Online. Statistical Analysis and Data Visualization System. Revised 6/21/2012. Copyright 2012 by StatPoint Technologies, Inc.
 STATGRAPHICS Online Statistical Analysis and Data Visualization System Revised 6/21/2012 Copyright 2012 by StatPoint Technologies, Inc. All rights reserved. Table of Contents Introduction... 1 Chapter
Communicate: In Print
 Communicate: In Print A simple guide Work areas Communicate: In Print has two different modes in which to edit your documents: Create and Adjust modes. These are easily interchangeable and the toolbars
SpaceClaim Introduction Training Session. A SpaceClaim Support Document
 SpaceClaim Introduction Training Session A SpaceClaim Support Document In this class we will walk through the basic tools used to create and modify models in SpaceClaim. Introduction We will focus on:
Understand the Sketcher workbench of CATIA V5.
 Chapter 1 Drawing Sketches in Learning Objectives the Sketcher Workbench-I After completing this chapter you will be able to: Understand the Sketcher workbench of CATIA V5. Start a new file in the Part
Custom Reporting System User Guide
 Citibank Custom Reporting System User Guide April 2012 Version 8.1.1 Transaction Services Citibank Custom Reporting System User Guide Table of Contents Table of Contents User Guide Overview...2 Subscribe
Introduction to the TI-Nspire CX
 Introduction to the TI-Nspire CX Activity Overview: In this activity, you will become familiar with the layout of the TI-Nspire CX. Step 1: Locate the Touchpad. The Touchpad is used to navigate the cursor
Creating Hyperlinks & Buttons InDesign CS6
 Creating Hyperlinks & Buttons Adobe DPS, InDesign CS6 1 Creating Hyperlinks & Buttons InDesign CS6 Hyperlinks panel overview You can create hyperlinks so that when you export to Adobe PDF or SWF in InDesign,
Clip Art in Office 2000
 Clip Art in Office 2000 In the process of making a certificate, we will cover: Adding clipart and templates from the Microsoft Office Clip Gallery, Modifying clip art by grouping and ungrouping, Flipping
Applying a circular load. Immediate and consolidation settlement. Deformed contours. Query points and query lines. Graph query.
 Quick Start Tutorial 1-1 Quick Start Tutorial This quick start tutorial will cover some of the basic features of Settle3D. A circular load is applied to a single soil layer and settlements are examined.
Using Adobe Dreamweaver CS4 (10.0)
") Getting Started Before you begin create a folder on your desktop called DreamweaverTraining This is where you will save your pages. Inside of the DreamweaverTraining folder, create another folder called
Getting Started Before you begin create a folder on your desktop called DreamweaverTraining This is where you will save your pages. Inside of the DreamweaverTraining folder, create another folder called
Canterbury Maps Quick Start - Drawing and Printing Tools
 Canterbury Maps Canterbury Maps Quick Start - Drawing and Printing Tools Quick Start Guide Standard GIS Viewer 2 Canterbury Maps Quick Start - Drawing and Printing Tools Introduction This document will
If you know exactly how you want your business forms to look and don t mind
 appendix e Advanced Form Customization If you know exactly how you want your business forms to look and don t mind detail work, you can configure QuickBooks forms however you want. With QuickBooks Layout
Banner Document Management Suite (BDMS) Web Access Help
 Web Access Help") May 10 th, 2011 Banner Document Management Suite (BDMS) Web Access Help Division of Information Technology AppXtender Web Access Help: For questions regarding AppXtender Web Access, please contact the
May 10 th, 2011 Banner Document Management Suite (BDMS) Web Access Help Division of Information Technology AppXtender Web Access Help: For questions regarding AppXtender Web Access, please contact the
Microsoft PowerPoint 2010 Templates and Slide Masters (Level 3)
") IT Services Microsoft PowerPoint 2010 Templates and Slide Masters (Level 3) Contents Introduction... 1 Installed Templates and Themes... 2 University of Reading Templates... 3 Further Templates and Presentations...
IT Services Microsoft PowerPoint 2010 Templates and Slide Masters (Level 3) Contents Introduction... 1 Installed Templates and Themes... 2 University of Reading Templates... 3 Further Templates and Presentations...
GFI FAXmaker 14 for Exchange/Lotus/SMTP. Fax-Client Manual. By GFI Software Ltd
 GFI FAXmaker 14 for Exchange/Lotus/SMTP Fax-Client Manual By GFI Software Ltd http://www.gfi.com Email: [email protected] Information in this document is subject to change without notice. Companies, names,
PLAY VIDEO. Close- Closes the file you are working on and takes you back to MicroStation V8i Open File dialog.
 Chapter Five Menus PLAY VIDEO INTRODUCTION To be able to utilize the many different menus and tools MicroStation V8i offers throughout the program and this guide, you must first be able to locate and understand
NiceLabel Designer Standard User Guide
 NiceLabel Designer Standard User Guide English Edition Rev-1112 2012 Euro Plus d.o.o. All rights reserved. Euro Plus d.o.o. Poslovna cona A 2 SI-4208 Šenčur, Slovenia tel.: +386 4 280 50 00 fax: +386 4
Sample Table. Columns. Column 1 Column 2 Column 3 Row 1 Cell 1 Cell 2 Cell 3 Row 2 Cell 4 Cell 5 Cell 6 Row 3 Cell 7 Cell 8 Cell 9.
 Working with Tables in Microsoft Word The purpose of this document is to lead you through the steps of creating, editing and deleting tables and parts of tables. This document follows a tutorial format
3D Viewer. user's manual 10017352_2
 EN 3D Viewer user's manual 10017352_2 TABLE OF CONTENTS 1 SYSTEM REQUIREMENTS...1 2 STARTING PLANMECA 3D VIEWER...2 3 PLANMECA 3D VIEWER INTRODUCTION...3 3.1 Menu Toolbar... 4 4 EXPLORER...6 4.1 3D Volume
UNIVERSITY OF CALGARY Information Technologies WEBFORMS DRUPAL 7 WEB CONTENT MANAGEMENT
 UNIVERSITY OF CALGARY Information Technologies WEBFORMS DRUPAL 7 WEB CONTENT MANAGEMENT Table of Contents Creating a Webform First Steps... 1 Form Components... 2 Component Types.......4 Conditionals...
Creating Fill-able Forms using Acrobat 8.0: Part 1
 Creating Fill-able Forms using Acrobat 8.0: Part 1 The first step in creating a fill-able form in Adobe Acrobat is to generate the form with all its formatting in a program such as Microsoft Word. Then
Pro/ENGINEER Wildfire 4.0 Basic Design
 Introduction Datum features are non-solid features used during the construction of other features. The most common datum features include planes, axes, coordinate systems, and curves. Datum features do
WHAT S NEW IN WORD 2010 & HOW TO CUSTOMIZE IT
 WHAT S NEW IN WORD 2010 & HOW TO CUSTOMIZE IT The Ribbon... 2 Default Tabs... 2 Contextual Tabs... 2 Minimizing and Restoring the Ribbon... 3 Customizing the Ribbon... 3 A New Graphic Interface... 5 Live
Excel 2003 Tutorial I
 This tutorial was adapted from a tutorial by see its complete version at http://www.fgcu.edu/support/office2000/excel/index.html Excel 2003 Tutorial I Spreadsheet Basics Screen Layout Title bar Menu bar
MS Word 2007 practical notes
 MS Word 2007 practical notes Contents Opening Microsoft Word 2007 in the practical room... 4 Screen Layout... 4 The Microsoft Office Button... 4 The Ribbon... 5 Quick Access Toolbar... 5 Moving in the
M-Files Gantt View. User Guide. App Version: 1.1.0 Author: Joel Heinrich
 M-Files Gantt View User Guide App Version: 1.1.0 Author: Joel Heinrich Date: 02-Jan-2013 Contents 1 Introduction... 1 1.1 Requirements... 1 2 Basic Use... 1 2.1 Activation... 1 2.2 Layout... 1 2.3 Navigation...
Appointment Scheduler
 EZClaim Appointment Scheduler User Guide Last Update: 11/19/2008 Copyright 2008 EZClaim This page intentionally left blank Contents Contents... iii Getting Started... 5 System Requirements... 5 Installing
Baseball Playbook Manual
 Baseball Playbook Manual Baseball Playbook 010 Introduction by Jes-Soft Baseball Playbook is a tool to help coaches define, draw and share baseball plays and drills. Baseball Playbook has the following
Microsoft Excel 2010 Charts and Graphs
 Microsoft Excel 2010 Charts and Graphs Email: [email protected] Web Page: http://training.health.ufl.edu Microsoft Excel 2010: Charts and Graphs 2.0 hours Topics include data groupings; creating
WBS Schedule Pro. User's Guide
 WBS Schedule Pro User's Guide Critical Tools, Inc. 2014 Table of Contents Overview of WBS Schedule Pro 7 What is WBS Schedule Pro? 7 What is a WBS chart? 9 What is a Network chart? 10 What's New in WBS
Embroidery Fonts Plus ( EFP ) Tutorial Guide Version 1.0505
 Tutorial Guide Version 1.0505") Embroidery Fonts Plus ( EFP ) Tutorial Guide Version 1.0505 1 Contents Chapter 1 System Requirements.................. 3 Chapter 2 Quick Start Installation.................. 4 System Requirements................
Embroidery Fonts Plus ( EFP ) Tutorial Guide Version 1.0505 1 Contents Chapter 1 System Requirements.................. 3 Chapter 2 Quick Start Installation.................. 4 System Requirements................
2. How to Use SMART Board as a Projector and Whiteboard
 Page 1 Smart Board Getting Started Smart Board is an interactive whiteboard developed by SMART Technologies that combines the capabilities of a data projector and a white board. Use the SMART Board to
Excel 2007 Basic knowledge
 Ribbon menu The Ribbon menu system with tabs for various Excel commands. This Ribbon system replaces the traditional menus used with Excel 2003. Above the Ribbon in the upper-left corner is the Microsoft
DinoXcope User Manual
 DinoXcope User Manual Contents 1 System Requirements 1 Installation 2 Adding a time stamp to the live view 3 Capturing an image 4 Creating a real time movie 5 Creating a time-lapse movie 6 Drawing on an
Writer Guide. Chapter 15 Using Forms in Writer
 Writer Guide Chapter 15 Using Forms in Writer Copyright This document is Copyright 2011 by its contributors as listed below. You may distribute it and/or modify it under the terms of either the GNU General
Roof Tutorial. Chapter 3:
 Chapter 3: Roof Tutorial The majority of Roof Tutorial describes some common roof styles that can be created using settings in the Wall Specification dialog and can be completed independent of the other
CONSTRUCTING SINGLE-SUBJECT REVERSAL DESIGN GRAPHS USING MICROSOFT WORD : A COMPREHENSIVE TUTORIAL
 CONSTRUCTING SINGLE-SUBJECT REVERSAL DESIGN GRAPHS USING MICROSOFT WORD : A COMPREHENSIVE TUTORIAL PATRICK GREHAN ADELPHI UNIVERSITY DANIEL J. MORAN MIDAMERICAN PSYCHOLOGICAL INSTITUTE This document is
MS Publisher 2010 Creating a newsletter
 MS Publisher 2010 Creating a newsletter Course Content This session is a brief introduction to creating a newsletter using Microsoft Publisher 2010 in the Waikato Management School student computer labs.
Lesson 7 - Creating Animation II
 Lesson 7 - Creating Animation II A. Motion-Tweened Animation With motion tweening, you can easily create motion effects for the objects in your Flash movies. Kites flying, balls bouncing, rocks rolling