Robust Parameter Design Using Statgraphics Centurion. Dr. Neil W. Polhemus Copy right 2011 by StatPoint Technologies, Inc.
|
|
|
- Kenneth Thornton
- 10 years ago
- Views:
Transcription
1 Robust Parameter Design Using Statgraphics Centurion Dr. Neil W. Polhemus Copy right 2011 by StatPoint Technologies, Inc. 1

2 Robust Parameter Designs Experimental designs containing 2 types of factors: controllable factors that the experimenter can manipulate both during the experiment and during production. noise factors that can be manipulated during the experiment but are normally uncontrollable. Goal: To find robust operating conditions, i.e., levels of the controllable factors where the values of the response variables are both desirable and relatively insensitive to variation in the noise factors. 2

3 Two Approaches 1. Crossed arrays (Genichi Taguchi) 2 designs are created, 1 for the controllable factors and 1 for the noise factors. Taguchi called these designs inner and outer arrays. An inner array is created for the controllable factors. At each location of the inner array, the outer array is performed. 2. Combined arrays (Doug Montgomery s response surface method) A single design is created for both the controllable and noise factors. Interactions between controllable factors and noise factors reveal location of robust operating conditions. 3
 A single design is created for both the controllable and noise factors.")
4 Example #1 Crossed Arrays Myers, Montgomery, and Anderson-Cook (2009) provide an example aimed at minimizing the rate of soldering defects. Response: Y = defects per million joints Controllable factors: X1 = temperature X2 = speed X3 = flux density X4 = preheat temperature X5 = wave height Noise factors: Z1 = variation in temperature Z2 = variation in conveyor speed Z3 = type of assembly 4


5 Step 1: Specify response 5


6 Step 2: Specify factors 6

7 Step 3: Select design 7
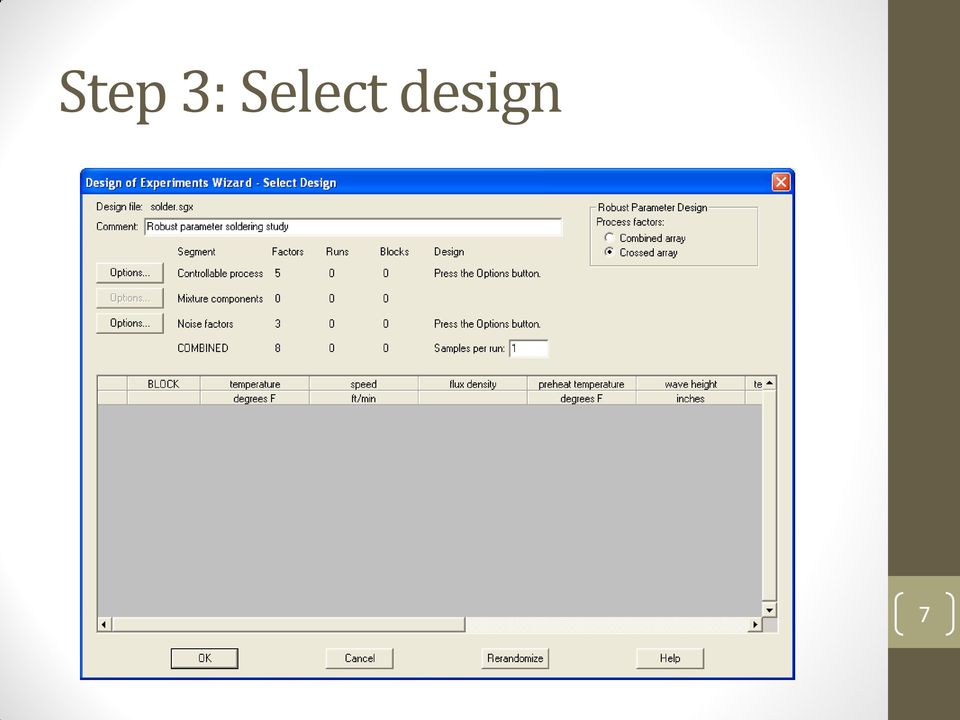
 First select the design for the")
8 Step 3: Select design (cont.) First select the design for the controllable factors. 8

 Column 1 2 3 4 5 6 7 Run 1 1 1 1 1 1 1 1 2 1 1 1 2 2 2 2 3 1 2 2 1 1 2 2 4 1 2 2 2 2 1 1")
9 Step 3: Select design (cont.) Column Run


10 Step 3: Select design (cont.) 10

11 Step 3: Select design (cont.) Next select the design for the noise factors. 11

12 Step 3: Select design (cont.) Column Run


13 Step 3: Select design (cont.) 13

14 Step 8: Analyze data Signal-to-Noise Ratio (Smaller the Better) - For situations in which the response is to be minimized, Taguchi proposed analyzing SNR S 10log n = number of rows in outer array n i1 y 2 i n n i1 y n 2 i y s n 2 Filename: solder2.sgx 14

15 Step 8: Analyze data (cont). Standardized Pareto Chart for defects(snrs) C:flux density + - A:temperature E:wave height D:preheat temperature B:speed Standardized effect 15

16 defects(snrs) Step 8: Analyze data (cont.) Main Effects Plot for defects(snrs) temperature speed flux density wave height preheat temperature 16

17 Step 9: Optimize response 17

18 wave height Step 9: Optimize response (Cont.) Estimated Response Surface Mesh speed=7.2,preheat temperature= temperature flux density 1 defects(snrs)

19 Example #2 Combined Array Myers, Montgomery, and Anderson-Cook (2009) provide an example optimizing the quality of color television images. Response: Y = reception quality in decibels Controllable factors: X1 = filter tabs X2 = sampling frequency Noise factors: Z1 = image bits Z2 = voltage 19

20 Step 1: Specify response 20


21 Step 2: Specify factors 21

22 Step 3: Select design 22
23 Step 3: Select design (cont.) Select a single design for both the controllable and noise factors. 23

24 Step 3: Select design (cont.) 24

25 Step 3: Select design (cont.) 25

26 Step 4: Select model The default model has two-factor interactions and quadratic effects for the 3-level factors. 26
27 Step 8: Analyze data Standardized Pareto Chart for reception quality C:image bits A:filter tabs B:sampling frequency D:voltage BC AB AC BD AD AA BB CD Standardized effect Filename: tvsignal.sgx 27
28 reception quality Step 8: Analyze data (cont.) Interaction Plot for reception quality 37 sampling sampling 33 frequency=6.25 frequency=13.5 sampling frequency= sampling frequency=6.25 filter tabs Reception quality is good at high sampling frequency, or at low sampling frequency and low filter tabs. 28
29 reception quality Step 8: Analyze data (cont.) Interaction Plot for reception quality image bits=256.0 image bits=256.0 image bits= image bits= sampling frequency Reception quality is less affected by changes in image bits at high sampling frequency. 29
30 reception quality Step 8: Analyze data (cont.) Interaction Plot for reception quality image bits=256.0 image bits=512.0 image bits= image bits=512.0 filter tabs Reception quality is less affected by changes in image bits at low filter tabs. 30
31 Step 9: Optimize response Desirability on a scale of 0 to 1, how desirable are the values of the response variables at a selected combination of the controllable factors. In this case, desirability is a combination of the mean response and the standard deviation of the response at that combination. The transmission of error formula is used to estimate the std. deviation: se r i1 y( x, z i 2 z) z 2 31

32 Analysis Options 32
33 Step 9: Optimize response (cont.) Transmission of error formula used to estimate the std. deviation of the response at the optimal conditions. se r i1 y( x, z i 2 z) z 2 33
34 Desirability Step 9: Optimize response (cont.) Desirability Plot image bits=512.0,voltage= Desirability filter tabs sampling frequency
35 sampling frequency Step 9: Optimize response (cont.) Overlay Plot reception quality Std. deviation filter tabs
36 More Information (1) Myers, R. H., Montgomery, D. C. and Anderson-Cook, C. M. (2009). Response Surface Methodology: Process and Product Optimization Using Designed Experiments, 3 rd edition. New York: John Wiley and Sons. (2) Statgraphics Centurion PDF file: Doe Wizard Inner-Outer Arrays (3) Statgraphics Centurion PDF file: Doe Wizard Robust Parameter Designs (4) 36
Capability Analysis Using Statgraphics Centurion
 Capability Analysis Using Statgraphics Centurion Neil W. Polhemus, CTO, StatPoint Technologies, Inc. Copyright 2011 by StatPoint Technologies, Inc. Web site: www.statgraphics.com Outline Definition of
TAGUCHI APPROACH TO DESIGN OPTIMIZATION FOR QUALITY AND COST: AN OVERVIEW. Resit Unal. Edwin B. Dean
 TAGUCHI APPROACH TO DESIGN OPTIMIZATION FOR QUALITY AND COST: AN OVERVIEW Resit Unal Edwin B. Dean INTRODUCTION Calibrations to existing cost of doing business in space indicate that to establish human
Online EFFECTIVE AS OF JANUARY 2013
 2013 A and C Session Start Dates (A-B Quarter Sequence*) 2013 B and D Session Start Dates (B-A Quarter Sequence*) Quarter 5 2012 1205A&C Begins November 5, 2012 1205A Ends December 9, 2012 Session Break
HOW TO USE MINITAB: DESIGN OF EXPERIMENTS. Noelle M. Richard 08/27/14
 HOW TO USE MINITAB: DESIGN OF EXPERIMENTS 1 Noelle M. Richard 08/27/14 CONTENTS 1. Terminology 2. Factorial Designs When to Use? (preliminary experiments) Full Factorial Design General Full Factorial Design
How To Use Statgraphics Centurion Xvii (Version 17) On A Computer Or A Computer (For Free)
 On A Computer Or A Computer (For Free)") Statgraphics Centurion XVII (currently in beta test) is a major upgrade to Statpoint's flagship data analysis and visualization product. It contains 32 new statistical procedures and significant upgrades
Statgraphics Centurion XVII (currently in beta test) is a major upgrade to Statpoint's flagship data analysis and visualization product. It contains 32 new statistical procedures and significant upgrades
Below is a very brief tutorial on the basic capabilities of Excel. Refer to the Excel help files for more information.
 Excel Tutorial Below is a very brief tutorial on the basic capabilities of Excel. Refer to the Excel help files for more information. Working with Data Entering and Formatting Data Before entering data
Summary of important mathematical operations and formulas (from first tutorial):
:") EXCEL Intermediate Tutorial Summary of important mathematical operations and formulas (from first tutorial): Operation Key Addition + Subtraction - Multiplication * Division / Exponential ^ To enter a
EXCEL Intermediate Tutorial Summary of important mathematical operations and formulas (from first tutorial): Operation Key Addition + Subtraction - Multiplication * Division / Exponential ^ To enter a
Minitab Tutorials for Design and Analysis of Experiments. Table of Contents
 Table of Contents Introduction to Minitab...2 Example 1 One-Way ANOVA...3 Determining Sample Size in One-way ANOVA...8 Example 2 Two-factor Factorial Design...9 Example 3: Randomized Complete Block Design...14
Copyright 2010-2011 PEOPLECERT Int. Ltd and IASSC
 PEOPLECERT - Personnel Certification Body 3 Korai st., 105 64 Athens, Greece, Tel.: +30 210 372 9100, Fax: +30 210 372 9101, e-mail: [email protected], www.peoplecert.org Copyright 2010-2011 PEOPLECERT
GE Healthcare Life Sciences UNICORN 5.31. Evaluation for Cross Flow Filtration / User Reference Manual
 GE Healthcare Life Sciences UNICORN 5.31 Evaluation for Cross Flow Filtration / User Reference Manual Table of Contents Table of Contents 1 Introducing UNICORN for evaluation of cross flow filtration...
Assignment objectives:
 Assignment objectives: Regression Pivot table Exercise #1- Simple Linear Regression Often the relationship between two variables, Y and X, can be adequately represented by a simple linear equation of the
KEYS TO SUCCESSFUL DESIGNED EXPERIMENTS
 KEYS TO SUCCESSFUL DESIGNED EXPERIMENTS Mark J. Anderson and Shari L. Kraber Consultants, Stat-Ease, Inc., Minneapolis, MN (e-mail: [email protected]) ABSTRACT This paper identifies eight keys to success
Use of the Chi-Square Statistic. Marie Diener-West, PhD Johns Hopkins University
 This work is licensed under a Creative Commons Attribution-NonCommercial-ShareAlike License. Your use of this material constitutes acceptance of that license and the conditions of use of materials on this
SPC Response Variable
 SPC Response Variable This procedure creates control charts for data in the form of continuous variables. Such charts are widely used to monitor manufacturing processes, where the data often represent
EXCEL Tutorial: How to use EXCEL for Graphs and Calculations.
 EXCEL Tutorial: How to use EXCEL for Graphs and Calculations. Excel is powerful tool and can make your life easier if you are proficient in using it. You will need to use Excel to complete most of your
INTEGRATED CIRCUITS DATA SHEET. TDA7000 FM radio circuit. Product specification File under Integrated Circuits, IC01
 INTEGRATED CIRCUITS DATA SHEET File under Integrated Circuits, IC01 May 1992 GENERAL DESCRIPTION The is a monolithic integrated circuit for mono FM portable radios, where a minimum on peripheral components
Manual Analysis Software AFD 1201
 AFD 1200 - AcoustiTube Manual Analysis Software AFD 1201 Measurement of Transmission loss acc. to Song and Bolton 1 Table of Contents Introduction - Analysis Software AFD 1201... 3 AFD 1200 - AcoustiTube
Step 3: Go to Column C. Use the function AVERAGE to calculate the mean values of n = 5. Column C is the column of the means.
 EXAMPLES - SAMPLING DISTRIBUTION EXCEL INSTRUCTIONS This exercise illustrates the process of the sampling distribution as stated in the Central Limit Theorem. Enter the actual data in Column A in MICROSOFT
Data Analysis Tools. Tools for Summarizing Data
 Data Analysis Tools This section of the notes is meant to introduce you to many of the tools that are provided by Excel under the Tools/Data Analysis menu item. If your computer does not have that tool
MB2-707: Version: Microsoft Dynamics CRM Customization. and Configuration. Demo
 MB2-707: Version: Microsoft Dynamics CRM Customization and Configuration Demo 1. You are a Microsoft Dynamics CRM consultant. You are assigned a new implementation. Before you configure the customer's
INTRODUCTION TO EXCEL
 INTRODUCTION TO EXCEL 1 INTRODUCTION Anyone who has used a computer for more than just playing games will be aware of spreadsheets A spreadsheet is a versatile computer program (package) that enables you
Activity 3.7 Statistical Analysis with Excel
 Activity 3.7 Statistical Analysis with Excel Introduction Engineers use various tools to make their jobs easier. Spreadsheets can greatly improve the accuracy and efficiency of repetitive and common calculations;
Using Excel (Microsoft Office 2007 Version) for Graphical Analysis of Data
 for Graphical Analysis of Data") Using Excel (Microsoft Office 2007 Version) for Graphical Analysis of Data Introduction In several upcoming labs, a primary goal will be to determine the mathematical relationship between two variable
Using Excel (Microsoft Office 2007 Version) for Graphical Analysis of Data Introduction In several upcoming labs, a primary goal will be to determine the mathematical relationship between two variable
Figure 1. An embedded chart on a worksheet.
 8. Excel Charts and Analysis ToolPak Charts, also known as graphs, have been an integral part of spreadsheets since the early days of Lotus 1-2-3. Charting features have improved significantly over the
Online Vaccine Ordering & Management Tools. NYC Department of Health & Mental Hygiene Bureau of Immunization
 Online Vaccine Ordering & Management Tools NYC Department of Health & Mental Hygiene Bureau of Immunization 1 Overview Online VFC Vaccine Ordering & Management Tool Online Influenza Vaccine Ordering Tool
Step-by-Step Guide to Bi-Parental Linkage Mapping WHITE PAPER
 Step-by-Step Guide to Bi-Parental Linkage Mapping WHITE PAPER JMP Genomics Step-by-Step Guide to Bi-Parental Linkage Mapping Introduction JMP Genomics offers several tools for the creation of linkage maps
How To Run Statistical Tests in Excel
 How To Run Statistical Tests in Excel Microsoft Excel is your best tool for storing and manipulating data, calculating basic descriptive statistics such as means and standard deviations, and conducting
A Guide to Using Excel in Physics Lab
 A Guide to Using Excel in Physics Lab Excel has the potential to be a very useful program that will save you lots of time. Excel is especially useful for making repetitious calculations on large data sets.
DOE-I Basic Design of Experiments (The Taguchi Approach)
") Complimentary Copy: DOE-I Basic Design of Experiments (The Taguchi Approach) Target Mean Target Quality Engineering Seminar and Software Bloomfield Hills, MI, USA. www.nutek-us.com Page 2 DOE-I Basic Design
Complimentary Copy: DOE-I Basic Design of Experiments (The Taguchi Approach) Target Mean Target Quality Engineering Seminar and Software Bloomfield Hills, MI, USA. www.nutek-us.com Page 2 DOE-I Basic Design
VCO Phase noise. Characterizing Phase Noise
 VCO Phase noise Characterizing Phase Noise The term phase noise is widely used for describing short term random frequency fluctuations of a signal. Frequency stability is a measure of the degree to which
An Optimization of Shrinkage in Injection Molding Parts by Using Taguchi Method
 An Optimization of Shrinkage in Injection Molding Parts by Using Taguchi Method H. Radhwan *,a, M. T. Mustaffa b, A. F. Annuar c, H. Azmi d, M. Z. Zakaria e and A. N. M. Khalil f School of Manufacturing
An analysis method for a quantitative outcome and two categorical explanatory variables.
 Chapter 11 Two-Way ANOVA An analysis method for a quantitative outcome and two categorical explanatory variables. If an experiment has a quantitative outcome and two categorical explanatory variables that
Getting started in Excel
 Getting started in Excel Disclaimer: This guide is not complete. It is rather a chronicle of my attempts to start using Excel for data analysis. As I use a Mac with OS X, these directions may need to be
Appendix 2.1 Tabular and Graphical Methods Using Excel
 Appendix 2.1 Tabular and Graphical Methods Using Excel 1 Appendix 2.1 Tabular and Graphical Methods Using Excel The instructions in this section begin by describing the entry of data into an Excel spreadsheet.
Taguchi Methods in Experimental Design
 Taguchi Methods in Experimental Design Ting Kong The Advantage Group, Inc. Introduction The quality of a product (or process) is one of the main factors which affects the buying decision of consumers.
Randomized Block Analysis of Variance
 Chapter 565 Randomized Block Analysis of Variance Introduction This module analyzes a randomized block analysis of variance with up to two treatment factors and their interaction. It provides tables of
Experiment 4: Sensor Bridge Circuits (tbc 1/11/2007, revised 2/20/2007, 2/28/2007) I. Introduction. From Voltage Dividers to Wheatstone Bridges
 I. Introduction. From Voltage Dividers to Wheatstone Bridges") Experiment 4: Sensor Bridge Circuits (tbc //2007, revised 2/20/2007, 2/28/2007) Objective: To implement Wheatstone bridge circuits for temperature measurements using thermistors. I. Introduction. From
Experiment 4: Sensor Bridge Circuits (tbc //2007, revised 2/20/2007, 2/28/2007) Objective: To implement Wheatstone bridge circuits for temperature measurements using thermistors. I. Introduction. From
Instruction Manual Service Program ULTRA-PROG-IR
 Instruction Manual Service Program ULTRA-PROG-IR Parameterizing Software for Ultrasonic Sensors with Infrared Interface Contents 1 Installation of the Software ULTRA-PROG-IR... 4 1.1 System Requirements...
GE Fanuc Automation CIMPLICITY. Statistical Process Control. CIMPLICITY Monitoring and Control Products. Operation Manual
 GE Fanuc Automation CIMPLICITY Monitoring and Control Products CIMPLICITY Statistical Process Control Operation Manual GFK-1413E December 2000 Following is a list of documentation icons: GFL-005 Warning
SLOT FRINGING EFFECT ON THE MAGNETIC CHARACTERISTICS OF ELECTRICAL MACHINES
 Journal of ELECTRICAL ENGINEERING, VOL. 60, NO. 1, 2009, 18 23 SLOT FRINGING EFFECT ON THE MAGNETIC CHARACTERISTICS OF ELECTRICAL MACHINES Mohammad B. B. Sharifian Mohammad R. Feyzi Meysam Farrokhifar
Can SAS Enterprise Guide do all of that, with no programming required? Yes, it can.
 SAS Enterprise Guide for Educational Researchers: Data Import to Publication without Programming AnnMaria De Mars, University of Southern California, Los Angeles, CA ABSTRACT In this workshop, participants
Using Excel for Handling, Graphing, and Analyzing Scientific Data:
 Using Excel for Handling, Graphing, and Analyzing Scientific Data: A Resource for Science and Mathematics Students Scott A. Sinex Barbara A. Gage Department of Physical Sciences and Engineering Prince
Sound absorption and acoustic surface impedance
 Sound absorption and acoustic surface impedance CHRISTER HEED SD2165 Stockholm October 2008 Marcus Wallenberg Laboratoriet för Ljud- och Vibrationsforskning Sound absorption and acoustic surface impedance
Sampling Theorem Notes. Recall: That a time sampled signal is like taking a snap shot or picture of signal periodically.
 Sampling Theorem We will show that a band limited signal can be reconstructed exactly from its discrete time samples. Recall: That a time sampled signal is like taking a snap shot or picture of signal
03 The full syllabus. 03 The full syllabus continued. For more information visit www.cimaglobal.com PAPER C03 FUNDAMENTALS OF BUSINESS MATHEMATICS
 0 The full syllabus 0 The full syllabus continued PAPER C0 FUNDAMENTALS OF BUSINESS MATHEMATICS Syllabus overview This paper primarily deals with the tools and techniques to understand the mathematics
Engineering Problem Solving and Excel. EGN 1006 Introduction to Engineering
 Engineering Problem Solving and Excel EGN 1006 Introduction to Engineering Mathematical Solution Procedures Commonly Used in Engineering Analysis Data Analysis Techniques (Statistics) Curve Fitting techniques
BI 4.1 Quick Start Java User s Guide
 BI 4.1 Quick Start Java User s Guide BI 4.1 Quick Start Guide... 1 Introduction... 4 Logging in... 4 Home Screen... 5 Documents... 6 Preferences... 8 Web Intelligence... 12 Create a New Web Intelligence
Preview of Period 3: Electromagnetic Waves Radiant Energy II
 Preview of Period 3: Electromagnetic Waves Radiant Energy II 3.1 Radiant Energy from the Sun How is light reflected and transmitted? What is polarized light? 3.2 Energy Transfer with Radiant Energy How
Spreadsheets and Laboratory Data Analysis: Excel 2003 Version (Excel 2007 is only slightly different)
") Spreadsheets and Laboratory Data Analysis: Excel 2003 Version (Excel 2007 is only slightly different) Spreadsheets are computer programs that allow the user to enter and manipulate numbers. They are capable
Spreadsheets and Laboratory Data Analysis: Excel 2003 Version (Excel 2007 is only slightly different) Spreadsheets are computer programs that allow the user to enter and manipulate numbers. They are capable
Current and voltage measuring relays
 Current and voltage measuring relays RXIK 1, RXEEB 1 and Page 1 Issued June 1999 Changed since July 1998 Data subject to change without notice RXIK 1 RXEEB 1 (SE980082) (SE980081) (SE970869) Features Application
How to Excel with CUFS Part 2 Excel 2010
 How to Excel with CUFS Part 2 Excel 2010 Course Manual Finance Training Contents 1. Working with multiple worksheets 1.1 Inserting new worksheets 3 1.2 Deleting sheets 3 1.3 Moving and copying Excel worksheets
ICP Data Validation and Aggregation Module Training document. HHC Data Validation and Aggregation Module Training Document
 HHC Data Validation and Aggregation Module Training Document Contents 1. Introduction... 4 1.1 About this Guide... 4 1.2 Scope... 4 2. Steps for Testing HHC Data Validation and Aggregation Module.. Error!
Graphing Parabolas With Microsoft Excel
 Graphing Parabolas With Microsoft Excel Mr. Clausen Algebra 2 California State Standard for Algebra 2 #10.0: Students graph quadratic functions and determine the maxima, minima, and zeros of the function.
CONTROLLING THE ASSEMBLY PROCESS WITH THE USE OF SPC
 CONTROLLING THE ASSEMBLY PROCESS WITH THE USE OF SPC William Beair, Alton Moore, and Eric Gilley Raytheon Company McKinney, TX, USA ABSTRACT With increasing deployment of both micro BGA s, 0201discreet
ABAQUS Tutorial. 3D Modeling
 Spring 2011 01/21/11 ABAQUS Tutorial 3D Modeling This exercise intends to demonstrate the steps you would follow in creating and analyzing a simple solid model using ABAQUS CAE. Introduction A solid undergoes
Simulating Investment Portfolios
 Page 5 of 9 brackets will now appear around your formula. Array formulas control multiple cells at once. When gen_resample is used as an array formula, it assures that the random sample taken from the
Learning Module 4 - Thermal Fluid Analysis Note: LM4 is still in progress. This version contains only 3 tutorials.
 Learning Module 4 - Thermal Fluid Analysis Note: LM4 is still in progress. This version contains only 3 tutorials. Attachment C1. SolidWorks-Specific FEM Tutorial 1... 2 Attachment C2. SolidWorks-Specific
DESIGN OF EXPERIMENTS IN MATERIAL TESTING AND DETERMINATION OF COEFFICIENT OF FRICTION. Ondřej ROZUM, Šárka HOUDKOVÁ
 8. 0.. 00, Rožnov pod Radhoštěm, Czech Republic DESIGN OF EXPERIMENTS IN MATERIAL TESTING AND DETERMINATION OF COEFFICIENT OF FRICTION Ondřej ROZUM, Šárka HOUDKOVÁ ŠKODA VÝZKUM s.r.o., Tylova /7, 36 00
Signal to Noise Instrumental Excel Assignment
 Signal to Noise Instrumental Excel Assignment Instrumental methods, as all techniques involved in physical measurements, are limited by both the precision and accuracy. The precision and accuracy of a
Data Logging Software and Cable Bundle Model DL-SC3 User Manual. Overview
 Data Logging Software and Cable Bundle Model DL-SC3 User Manual Overview Eco Sensors Digital Products are capable of transmitting data to a computer via an RS-232 serial connection. Eco Sensors DL-SC3
BGA - Ball Grid Array Inspection Workshop. Bob Willis leadfreesoldering.com
 BGA - Ball Grid Array Inspection Workshop Bob Willis leadfreesoldering.com Mixed Technology Assembly Processes Adhesive Dispensing Component Placement Adhesive Curing Turn Boar Over Conventional Insertion
The Design and Implementation of Multimedia Software
 Chapter 10 Auditory Content The Design and Implementation of Multimedia Software David Bernstein Jones and Bartlett Publishers www.jbpub.com David Bernstein (jbpub.com) Multimedia Software Jones and Bartlett
Quality Tools, The Basic Seven
 Quality Tools, The Basic Seven This topic actually contains an assortment of tools, some developed by quality engineers, and some adapted from other applications. They provide the means for making quality
Excel Guide for Finite Mathematics and Applied Calculus
 Excel Guide for Finite Mathematics and Applied Calculus Revathi Narasimhan Kean University A technology guide to accompany Mathematical Applications, 6 th Edition Applied Calculus, 2 nd Edition Calculus:
Unit-5 Quality Management Standards
 Unit-5 Quality Management Standards 1 THE ISO 9000 FAMILY ISO 9000: 2005 Identifies the fundamentals and vocabulary for Quality Management Systems (QMS) ISO 9001:2008 Specifies requirements for a QMS where
Electrical tests on PCB insulation materials and investigation of influence of solder fillets geometry on partial discharge
 , Firenze, Italy Electrical tests on PCB insulation materials and investigation of influence of solder fillets geometry on partial discharge A. Bulletti, L. Capineri B. Dunn ESTEC Material and Process
Business Objects Enterprise version 4.1. Report Viewing
 Business Objects Enterprise version 4.1 Note about Java: With earlier versions, the Java run-time was not needed for report viewing; but was needed for report writing. The default behavior in version 4.1
SECTION 2-1: OVERVIEW SECTION 2-2: FREQUENCY DISTRIBUTIONS
 SECTION 2-1: OVERVIEW Chapter 2 Describing, Exploring and Comparing Data 19 In this chapter, we will use the capabilities of Excel to help us look more carefully at sets of data. We can do this by re-organizing
T = 1 f. Phase. Measure of relative position in time within a single period of a signal For a periodic signal f(t), phase is fractional part t p
, phase is fractional part t p") Data Transmission Concepts and terminology Transmission terminology Transmission from transmitter to receiver goes over some transmission medium using electromagnetic waves Guided media. Waves are guided
Data Transmission Concepts and terminology Transmission terminology Transmission from transmitter to receiver goes over some transmission medium using electromagnetic waves Guided media. Waves are guided
Kit 106. 50 Watt Audio Amplifier
 Kit 106 50 Watt Audio Amplifier T his kit is based on an amazing IC amplifier module from ST Electronics, the TDA7294 It is intended for use as a high quality audio class AB amplifier in hi-fi applications
SA-9600 Surface Area Software Manual
 SA-9600 Surface Area Software Manual Version 4.0 Introduction The operation and data Presentation of the SA-9600 Surface Area analyzer is performed using a Microsoft Windows based software package. The
Creating and Managing Online Surveys LEVEL 2
 Creating and Managing Online Surveys LEVEL 2 Accessing your online survey account 1. If you are logged into UNF s network, go to https://survey. You will automatically be logged in. 2. If you are not logged
Series and Parallel Circuits
 Pre-Laboratory Assignment Series and Parallel Circuits ECE 2100 Circuit Analysis Laboratory updated 16 May 2011 1. Consider the following series circuit. Derive a formula to calculate voltages V 1, V 2,
BI 4.1 Quick Start Guide
 BI 4.1 Quick Start Guide BI 4.1 Quick Start Guide... 1 Introduction... 4 Logging in... 4 Home Screen... 5 Documents... 6 Preferences... 8 Setting Up Preferences to Display Public Folders... 10 Web Intelligence...
Fusion Pro QbD-aligned DOE Software
 Fusion Pro QbD-aligned DOE Software Statistical Experimental Design Analysis & Modeling Robustness Simulation Numerical & Graphical Optimization 2D, 3D, & 4D Visualization Graphics 100% aligned with Quality
Trace Layer Import for Printed Circuit Boards Under Icepak
 Tutorial 13. Trace Layer Import for Printed Circuit Boards Under Icepak Introduction: A printed circuit board (PCB) is generally a multi-layered board made of dielectric material and several layers of
Universal Simple Control, USC-1
 Universal Simple Control, USC-1 Data and Event Logging with the USB Flash Drive DATA-PAK The USC-1 universal simple voltage regulator control uses a flash drive to store data. Then a propriety Data and
Montgomery GI Bill Selected Reserve (MGIB-SR) Command/Servicing Personnel Office Review
 Command/Servicing Personnel Office Review") Overview Montgomery GI Bill Selected Reserve (MGIB-SR) Command/Servicing Personnel Office Review Introduction This transaction is used to record a Reserve member s Montgomery GI Bill-SR (MGIB-SR) eligibility
Overview Montgomery GI Bill Selected Reserve (MGIB-SR) Command/Servicing Personnel Office Review Introduction This transaction is used to record a Reserve member s Montgomery GI Bill-SR (MGIB-SR) eligibility
Key Concept. Density Curve
 MAT 155 Statistical Analysis Dr. Claude Moore Cape Fear Community College Chapter 6 Normal Probability Distributions 6 1 Review and Preview 6 2 The Standard Normal Distribution 6 3 Applications of Normal
PortfolioCenter Export Wizard in Practice: Evaluating IRA Account Holder Ages and Calculating Required Minimum Distribution (RMD) Amounts
 Amounts") PortfolioCenter Export Wizard in Practice: Evaluating IRA Account Holder Ages and Calculating Required Minimum Distribution (RMD) Amounts One way you can apply the PortfolioCenter Export Wizard in your
PortfolioCenter Export Wizard in Practice: Evaluating IRA Account Holder Ages and Calculating Required Minimum Distribution (RMD) Amounts One way you can apply the PortfolioCenter Export Wizard in your
Using Excel 2003 with Basic Business Statistics
 Using Excel 2003 with Basic Business Statistics Introduction Use this document if you plan to use Excel 2003 with Basic Business Statistics, 12th edition. Instructions specific to Excel 2003 are needed
A Better Statistical Method for A/B Testing in Marketing Campaigns
 A Better Statistical Method for A/B Testing in Marketing Campaigns Scott Burk Marketers are always looking for an advantage, a way to win customers, improve market share, profitability and demonstrate
Executive Dashboard. User Guide
 Executive Dashboard User Guide 2 Contents Executive Dashboard Overview 3 Naming conventions 3 Getting started 4 Welcome to Socialbakers Executive Dashboard! 4 Comparison View 5 Setting up a comparison
MS Data Analysis I: Importing Data into Genespring and Initial Quality Control
 Homework: Session 2 GENESPRING MS ONLINE TRAINING SESSION 2 MS Data Analysis I: Importing Data into Genespring and Initial Quality Control Introduction and Lab Overview: If you need help during completion
Spreadsheet - Introduction
 CSCA0102 IT and Business Applications Chapter 6 Spreadsheet - Introduction Spreadsheet A spreadsheet (or spreadsheet program) is software that permits numerical data to be used and to perform automatic
ADVANCED APPLICATIONS OF ELECTRICAL ENGINEERING
 Development of a Software Tool for Performance Evaluation of MIMO OFDM Alamouti using a didactical Approach as a Educational and Research support in Wireless Communications JOSE CORDOVA, REBECA ESTRADA
Scatter Plots with Error Bars
 Chapter 165 Scatter Plots with Error Bars Introduction The procedure extends the capability of the basic scatter plot by allowing you to plot the variability in Y and X corresponding to each point. Each
Application Note #49 RF Amplifier Output Voltage, Current, Power, and Impedance Relationship
 Application Note #49 RF Amplifier Output Voltage, Current, Power, and Impedance Relationship By: Jason Smith; Manager Applications Engineer and Pat Malloy; Sr. Applications Engineer How much output voltage,
Visualization with Excel Tools and Microsoft Azure
 Visualization with Excel Tools and Microsoft Azure Introduction Power Query and Power Map are add-ins that are available as free downloads from Microsoft to enhance the data access and data visualization
Bowerman, O'Connell, Aitken Schermer, & Adcock, Business Statistics in Practice, Canadian edition
 Bowerman, O'Connell, Aitken Schermer, & Adcock, Business Statistics in Practice, Canadian edition Online Learning Centre Technology Step-by-Step - Excel Microsoft Excel is a spreadsheet software application
Chapter 7. One-way ANOVA
 Chapter 7 One-way ANOVA One-way ANOVA examines equality of population means for a quantitative outcome and a single categorical explanatory variable with any number of levels. The t-test of Chapter 6 looks
SAS Analyst for Windows Tutorial
 Updated: August 2012 Table of Contents Section 1: Introduction... 3 1.1 About this Document... 3 1.2 Introduction to Version 8 of SAS... 3 Section 2: An Overview of SAS V.8 for Windows... 3 2.1 Navigating
Intro to Excel spreadsheets
 Intro to Excel spreadsheets What are the objectives of this document? The objectives of document are: 1. Familiarize you with what a spreadsheet is, how it works, and what its capabilities are; 2. Using
How is EnSight Uniquely Suited to FLOW-3D Data?
 How is EnSight Uniquely Suited to FLOW-3D Data? July 5, 2011 figure 1. FLOW-3D model of Dam visualized with EnSight If you would like to know how CEI s EnSight offers you more power than other postprocessors
Probability Distributions
 CHAPTER 5 Probability Distributions CHAPTER OUTLINE 5.1 Probability Distribution of a Discrete Random Variable 5.2 Mean and Standard Deviation of a Probability Distribution 5.3 The Binomial Distribution