Spatial Exploratory Data Analysis of Birth Defect Risk. factors Identification
|
|
|
- Timothy Booker
- 8 years ago
- Views:
Transcription
1 Spatial Exploratory Data Analysis of Birth Defect Risk factors Identification Jilei WU 1 *, Jinfeng WANG 1, Gong CHEN 2, Lihua PANG 2, Xinming SONG 2, Bin MENG 1, Keli ZHANG 3, Ting ZHANG 4 and Xiaoying ZHENG 2 * Address: 1 Institute of Geography Science and Nature Resource Research, CAS, Beijing, , P. R. China, 2 Institute of Population Research, Peking University, Beijing, , P. R. China 3 Department of Resources and Environment, Peking Normal University, Beijing, , P. R. China 4 Capital Institute of Pediatrics, Beijing, , P. R. China Jilei WU* wujl@lreis.ac.cn ; Jinfeng WANG wangjf@lreis.ac.cn ; Gong CHEN chengong@pku.edu.cn ; Lihua PANG-pang@pku.edu.cn ; Xinming SONG xmsong@pku.edu.cn ; Bin MENG mengb@lreis.ac.cn ; Keli ZHANG kunqing@bnu.edu.cn ; Ting Zhang zhangting@263.net.cn and Xiaoying ZHENG* xzheng@pku.edu.cn * Corresponding author Abstract Background Birth defects, which have severely been affecting the population health since human been appears in the earth, refer to embryos and fetus developing abnormally, with structure, function, and metabolism defects in some parts of their bodies in uterus before birth. The causes of birth defects were thought as 1

2 heredity and/or environmental factors but very difficulty to search out clearly. This study tries to identify environmental risk factors playing the role in birth defects using spatial exploratory data analysis methods. Methods Spatial autocorrelation statistics, Moran's I coefficient, was used to detect the spatial association of birth defects. And newly developed spatial hotspots detector, Getis's G statistics, was used to detect the hotspots birth defects in space to explore the risk factors. Results Different types of birth defects show different spatial distributions. Neural tube birth defects have significant positive spatial autocorrelation and two typical clustering phenomena at different spatial scales, while other types of birth defects have no such significant spatial autocorrelation. Positive spatial autocorrelation indicates that there are some common environmental risk factors affect birth defects occurring ratio while different clustering phenomena disclose the different working scales by different risk factors. Conclusion Using spatial exploratory data analysis methods, significant positive spatial autocorrelation of the neural tube birth defects and two typical spatial patterns of hotspots were detected. These give clues in the risk factors identification and the birth defects intervention. The risk factors causing birth defects could be connected future physical, chemical and molecular laboratory test according to spatial scales. 2

3 Background Birth defects refer to embryos and fetus developing abnormally and have defects in some parts of their bodies when in uterus before birth. The reasons caused birth defects severely affect the population health and definitely aggravate the burden on the whole society development. More and more attention has been paid to searching birth defects reasons and birth defect prevention measurements. Birth defects intervention has become a main task in public health field by now. According to update results of birth defects research, the probability of birth defects caused by genetic factors may be similar in regions. However, environmental risk factors, such as infection, environmental pollution and toxicosis, account for distinction of birth defects occurring ratio among regions. Such exposures of environmental risk are maneuverable for birth defects intervention. Currently, some researches have been initiated to look at identification and inspection of them to birth defects from different angles. Based on research estimated the ratio of birth defects occurring is estimated about 40~50 in China, a higher level in the world. Shanxi province of China is one of highest risk regions in China and has highest ratio of neural tube birth defects. In order to reach prepotency, we select Heshun, one county of Shanxi, as an experimental region for study. This county lies in Taihang Mountain regions and forms a relative closed area. Most people in this county are farmers and seldom change their living places, and no migration happened in history. So the population-based inherit risk factors to birth defects would be similar in this region, which is of very important precondition to study the relationship between environmental risk factors and birth defects. 3

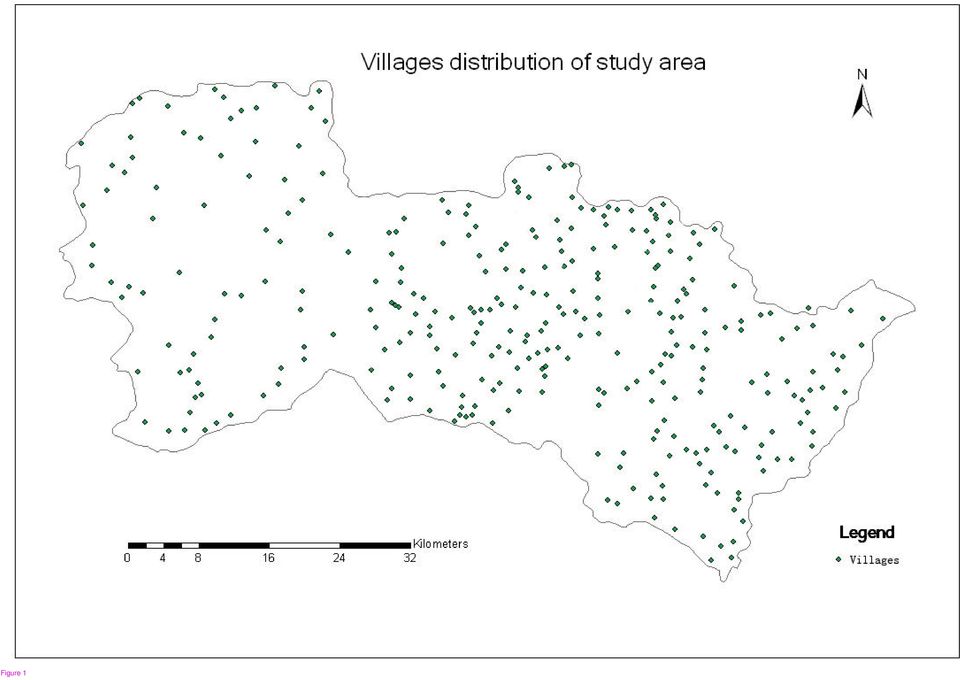
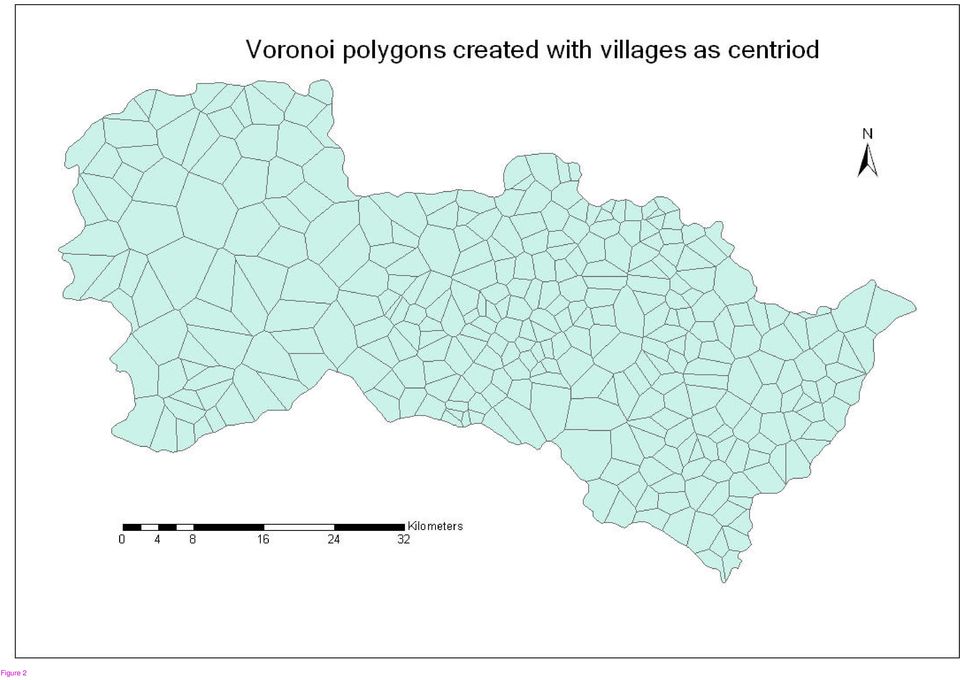
4 Methods Acquirement of birth defects data There are 322 villages and one town in this county. Four years (1998~2001) birth defects cases acquired based on hospital records and investigation in villages. As family plan policy being carried out strictly, number of birth planed every year for each village. So we can have birth defects occurring ratio according to this number. But as the birth defects are small probability events, we summed all four years birth defects cases and divided by average planning birth number per year as birth defects occurring ratio. The villages and their people are some equally distributed in this area. But the town is relatively people clustered place, and environment factors are also some complexity. In order to simplify the relationship between birth defects occurring ratio to environmental factors, we have removed the records occurring in the town. Different birth defects may be caused by different risk factors. By organ system, we divided the birth defects types by neural tube birth defects and non-neural tube birth defects (NTBD) and other birth defects. NTBD include anencephaly, spina bifida, encephalocele, holoprosencephaly, hydrecephalus etc. And the birth defects occurring ratio calculated respectively according to NTBD and other birth defects. Spatial position and expression 322 villages have been located by Geographical Information Systems for spatial analysis (Fig. 1). As there no boundaries defined for the villages, we draw them for every village by Voronoi chart (Fig. 2). Voronoi chart, also named Dirichlet chart, is composed by continuous polygons. Those polygons are formed by linking vertical lines of neighboring two points. Corresponding Delaunay triangle is created 4

5 by points on shared border of neighboring Voronoi polygons. Centered by location of the village, Voronoi polygon gives the scope of the villages and Delaunay triangles reflect the distance correlation of the villages which is used in spatial autocorrelation analysis below. Fig. 1 Villages in study region Fig. 2 Voronoi polygons Spatial statistics methods Spatial autocorrelation analysis, namely Moran s I statistics, has expression below [1] 5

6 I n n i = n ( i n j n j w ij w ij ( y ) i n i y)( y ( y i j y) y) 2 Here, n is the number of villages, yi is the number of birth defects occurring ratio in village i w is weight matrix between village i and j, when i and j linked in Delaunay triangle w = 1, ij ij otherwise W = 0, score test is used for hypothesis test, namely: ij Z = [ I E( I )]/ std ( I ) When Z > 1. 96, small probability exist in normally distribution, null hypothesis is rejected. Namely, significant positive autocorrelation exists for 95% confidence interval. Hotspots detect, namely Getis G * statistics, has expression below [2] G * i = n j S {[ ns w ( d) y ij * 1i W j * 2 i W * i y ] /( n 1)} 1/ 2 Here, S is standard variance of birth defects occurring ratio, when village j to i within distance * d, then w ij ( d) = 1, otherwise i ( d) = 0 S1 i = S j wij ( d), W i = S j wij ( d). The higher w j * value of * G i, the more influence of village i at given distance d, and become a hotspot of this region. Results Spatial autocorrelation Using Moran s I statistics, NTBD and other birth defects occurring ratios were analyzed for their spatial autocorrelation. The results were showed in table 1 below. 6
 y ij * 1i W j * 2 i W * i y ] /( n 1)} 1/ 2 Here, S is standard variance of birth defects occurring")
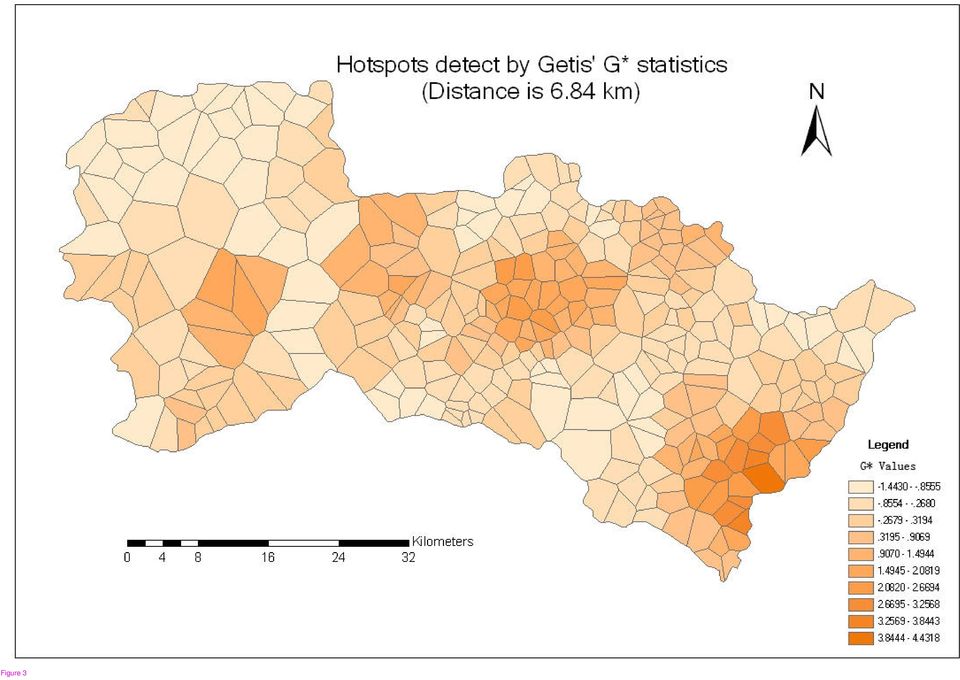
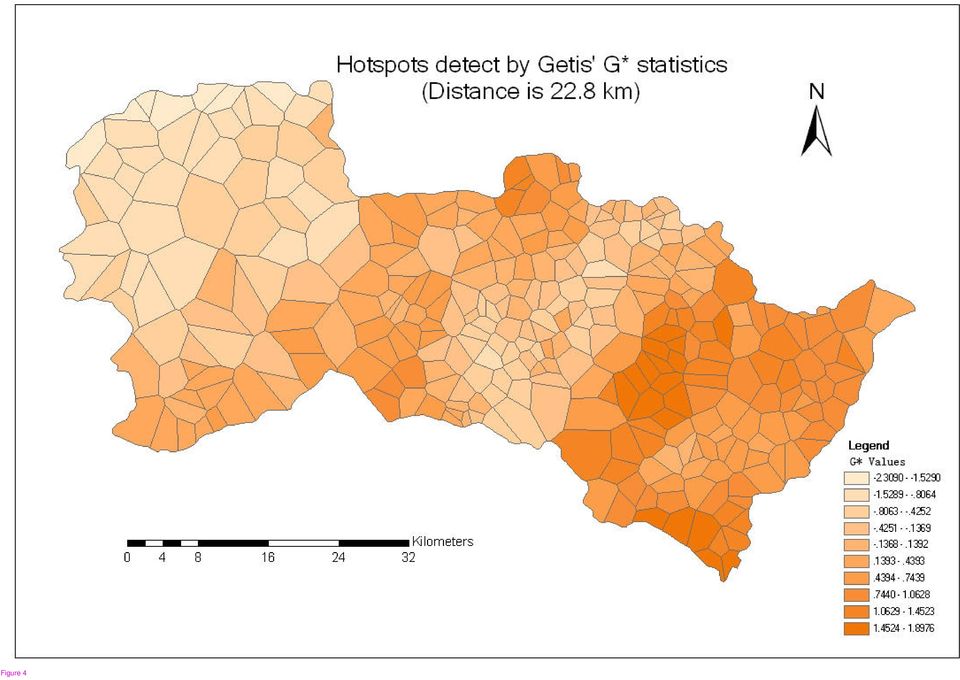
7 Tab.1 Moran s I statistics of NTBD and other birth defects occurring ratios Statistics items Moran I Value Score test Normal distribution probability Neural birth defects Non-neural birth defects Both NTBD and other birth defects occurring ratios have positive spatial autocorrelation. But by score test for Moran s I, NTBD occurring ratio has significant positive spatial autocorrelation in this study area, while other birth defects occurring ratio can not past this test at the 95% confidence intervals. Distance scale As Getis G* statistics needs a threshold distance value. Typical distance in this study area were calculated and described below in table 2. Tab 2 Typical distance scale and their meanings Statistics items Distance value Meanings Nearest distance among remote villages km Differentiated distance of soil types km Socio-economic activities scopes of farmers Geological variance distance scale of lithology etc. Hotspots detect Two typical hotspots distributions of NTBD occurring ratio are drawn in Fig 3 and Fig 4. Calculated by Getis G* statistics. In order to compare the hotspots detected results and acquire effective clues of environmental risk factors, the distributions of birth defects occurring ratios and lithology were also drawn in Fig 5 and Fig 6. 7

8 Fig 3. Hotspots detected at 6.84 km (Grouped distribution) Fig 4. Hotspots detected at 22.8 km (Zonal distribution) 8

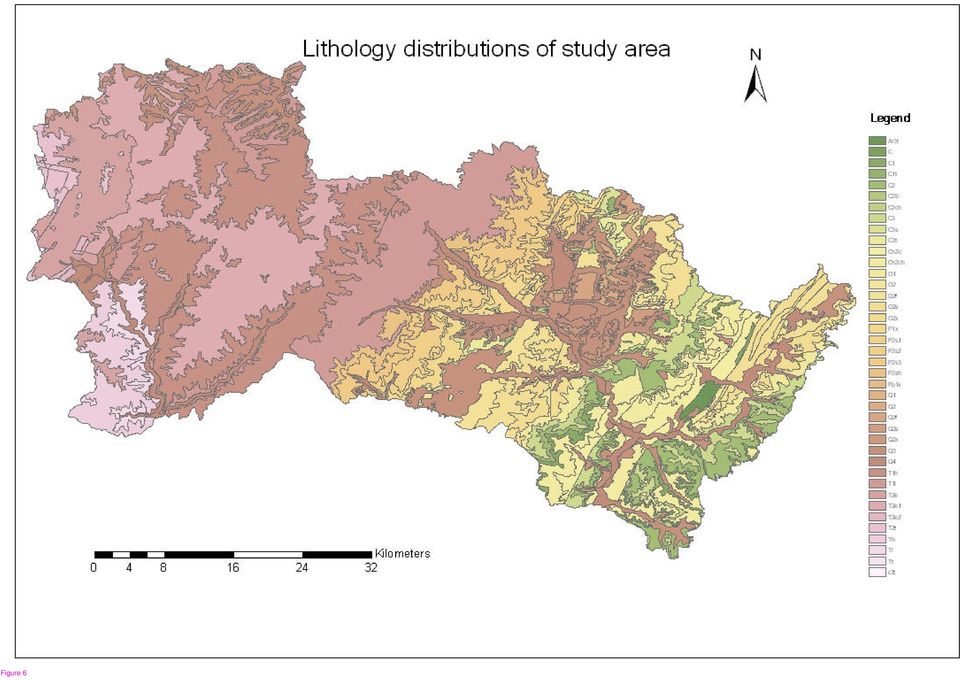
9 Fig 5. birth defects occurring ratios distributions Fig 6. Lithology distribution (zonal type) Discussion With mortality rate decreased and population life expectancy increased, it has been found that the 9

10 proportion of birth defect in infant mortality reason is gradually going up from one fourth to one third in the 90 s of last decade. Therefore, the birth defects research is becoming an important task in public health field nationwide. Many researchers collected the hospital-based monitoring data and analyzed for useful information to intervene birth defects. Those data were also used observed/expected method (O/E) to capture the unconventionally changes in birth defects occurring ratio. For example, International Clearinghouse for Birth Defects Monitoring Systems (ICBDMS) used O/E method in their quarterly and annual reports [3]. Commonly used O/E method has some disadvantages in birth defects inspection and intervention. The main task of O/E method is draw a baseline of birth defects occurring ratio of a region based on Poisson distribution. Then by inspecting the birth defects occurring ratio, sudden interventions of environmental factors can be detected by referring to epidemic characteristics of birth defects. However, there are many limits in O/E method. First of all, how to confirm baseline of birth defects occurring levels in different regions? Next, when inspecting time is limited and family planning were carried strictly, as small probability event birth defects are, the population may be not enough for statistics in O/E method. And more, for some regions, long existing environmental risk factors to birth defects cannot be detected by limited inspecting time. Using spatial exploratory data analysis methods, this study effectively reduced the dependence on temporal data of birth defects records. That means, by utilizing spatial location information, small probability events analysis, such as birth defects, can be effectively carried on. There are no limits of baseline on birth defects occurring levels and long existing environmental risk factors to birth defects can be also reflected as population-based situation in spatial. By Moran s I statistics, this study indicates that there exists significant positive spatial 10
 to capture the unconventionally changes in birth defects occurring ratio.")
11 autocorrelation on NTBD occurring ratio while no such on other birth defects. As mechanism analysis carried on birth defects types, NTBD have similar risk factors and other birth defects have different risk factors. Positive spatial autocorrelation can be proved common environmental risk factors to NTBD existing in this region while other birth defects might be caused by some random distributed risk factors or just belong to random occurrences. Hotspots detecting, namely Getis G* statistics, were calculated from distance of 0.5km to 45km and two typical hotspots clustering phenomena exist in two scales (6.84km and 22.8km). The distribution of hotspots changes from villages grouping clustering to zonal clustering as distance increasing. However, the scales of two typical hotspots clustering have practical meaning in socio-economic activity of people and geographical variance of lithology. Distance of scale 6.165~9.309km is typical radius of communication scope of residents in study area. Their socio-economic activities usually occur within this distance. So if inherit risk factors contribute to birth defects, this distance scope and hotspots clustering can give effective clues. Distance of scale 19.5~30km is the soil types change scale. In this study area, the soil types and lithology types have zonal distribution and core mine underground as well. According to general knowledge of residents in this area, high birth defects occurring areas usually are diggings area. So the minerals or rocks maybe have some risk elements do harm to mankind health and cause birth defects occurring. As rocks effloresce to soil, soil variance can reflect the change of lithology. This zonal type clustering of birth defects occurring hotspots indicate that this region exist some risk elements related to soil and lithology, and take effect in scope of soil types change scale. Conclusions This study analyzed the spatial distribution of different birth defects types by spatial exploratory data 11

12 analysis. The results showed that different types of birth defects have different characteristics in spatial distribution. NTBD have significant positive autocorrelation at 95% confidence interval while other birth defects have no such significant autocorrelation. From different scales to detect hotspots of birth defect occurring ratios, two types clustering phenomena shown at two typical scales which have some senses in socio-economic and geography. Those give effective clues to detect the environmental risk factors to birth defects especially NTBD. This spatial explore data analysis has proposed their efficiency capacity in seeking clues of birth defects risk exposure of environment. Next steps of this study should to analyze the geological samples by chemical test in laboratory firstly, such as soils samples, for environmental risk factors identification. Following these, animal model of risk exposure should be established and re-tested. Meanwhile, investigation of socio-economic activities such as scope of intermarriage etc. should be carried in the project. Authors contributions This study was conceived and completed by Jilei Wu, Jinfeng Wang and Xiaoying Zheng supervised this study, Gong Chen, Lihua Pang, Bin Meng and Keli Zhang assisted with the study and analyses of socio-economic factors, soils and lithology analysis, Xinming Song and Ting Zhang assisted with the medicine analysis of birth defects. Acknowledgements This study is supported by grants from National 973 Program, JJ and from National Nature Science Foundation of China, 2002AA from National High Technology Research and Development Program and the Science Innovation Project of the Chinese 12

13 Academy of Sciences and 211 program of Peking University. References [1] Robert.J. Haining. Spatial Data Analysis in the Social and Environmental Sciences. Cambridge University Press, Cambridge, U.K, [2] Getis A., Ord J.K., 1992, The Analysis of Spatial Association by Use of Distance Statistics, Geographical Analysis, Vol. 24: [3] ICBDMS. International Clearinghouse for Birth Defects Monitoring Systems Annual Report Roma: ICBDMS, 1998 [4] AN XL, FU SHL, Environmental Eugenics, Beijing Medical University and Chinese Union Medical University Union Press,
![1989. [2] Getis A., Ord J.K., 1992, The Analysis of Spatial Association by Use of Distance Statistics, Geographical Analysis, Vol. 24: 189-206.](/docs-images/50/15063200/images/page_13.jpg "[3] ICBDMS. International Clearinghouse for Birth Defects Monitoring Systems Annual Report 1998.")
14 Figure 1
15 Figure 2
16 Figure 3
17 Figure 4
18 Figure 5

19 Figure 6
Spatial Data Analysis Using GeoDa. Workshop Goals
 Spatial Data Analysis Using GeoDa 9 Jan 2014 Frank Witmer Computing and Research Services Institute of Behavioral Science Workshop Goals Enable participants to find and retrieve geographic data pertinent
PSO/ACO Algorithm-based Risk Assessment of Human Neural Tube Defects in Heshun County, China *
 Biomed Environ Sci, 2012; 25(5): 569 576 569 Letters PSO/ACO Algorithm-based Risk Assessment of Human Neural Tube Defects in Heshun County, China * LIAO Yi Lan 1,2, WANG Jin Feng 1,#, WU Ji Lei 2, WANG
Identifying Schools for the Fruit in Schools Programme
 1 Identifying Schools for the Fruit in Schools Programme Introduction This report identifies New Zeland publicly funded schools for the Fruit in Schools programme. The schools are identified based on need.
Spatial Analysis with GeoDa Spatial Autocorrelation
 Spatial Analysis with GeoDa Spatial Autocorrelation 1. Background GeoDa is a trademark of Luc Anselin. GeoDa is a collection of software tools designed for exploratory spatial data analysis (ESDA) based
Workshop: Using Spatial Analysis and Maps to Understand Patterns of Health Services Utilization
 Enhancing Information and Methods for Health System Planning and Research, Institute for Clinical Evaluative Sciences (ICES), January 19-20, 2004, Toronto, Canada Workshop: Using Spatial Analysis and Maps
Data Visualization Techniques and Practices Introduction to GIS Technology
 Data Visualization Techniques and Practices Introduction to GIS Technology Michael Greene Advanced Analytics & Modeling, Deloitte Consulting LLP March 16 th, 2010 Antitrust Notice The Casualty Actuarial
Geographically Weighted Regression
 Geographically Weighted Regression CSDE Statistics Workshop Christopher S. Fowler PhD. February 1 st 2011 Significant portions of this workshop were culled from presentations prepared by Fotheringham,
Epidemiology 521. Epidemiology of Maternal and Child Health Problems. Winter / Spring, 2010
 Extended MPH Degree Program School of Public Health Department of Epidemiology University of Washington Epidemiology 521 Epidemiology of Maternal and Child Health Problems Winter / Spring, 2010 Instructor:
Introduction to Exploratory Data Analysis
 Introduction to Exploratory Data Analysis A SpaceStat Software Tutorial Copyright 2013, BioMedware, Inc. (www.biomedware.com). All rights reserved. SpaceStat and BioMedware are trademarks of BioMedware,
Journal of Chemical and Pharmaceutical Research, 2014, 6(5): 647-651. Research Article
: 647-651. Research Article") Available online www.jocpr.com Journal of Chemical and Pharmaceutical Research, 2014, 6(5): 647-651 Research Article ISSN : 0975-7384 CODEN(USA) : JCPRC5 Comprehensive colliery safety monitoring system
Available online www.jocpr.com Journal of Chemical and Pharmaceutical Research, 2014, 6(5): 647-651 Research Article ISSN : 0975-7384 CODEN(USA) : JCPRC5 Comprehensive colliery safety monitoring system
Copula model estimation and test of inventory portfolio pledge rate
 International Journal of Business and Economics Research 2014; 3(4): 150-154 Published online August 10, 2014 (http://www.sciencepublishinggroup.com/j/ijber) doi: 10.11648/j.ijber.20140304.12 ISS: 2328-7543
Study on The Influence Factor of Cash Dividend Distribution in Listed
 Study on The Influence Factor of Cash Dividend Distribution in Listed Companies 1 Wu He, 2 Ping Liu 1, Management Department Ningbo Institute of Technology Zhejiang University Ningbo, China, hewucpa@163.com
The Data Analysis of Primary and Secondary School Teachers Educational Technology Training Result in Baotou City of Inner Mongolia Autonomous Region
 , pp.77-84 http://dx.doi.org/10.14257/ijunesst.2015.8.8.08 The Data Analysis of Primary and Secondary School Teachers Educational Technology Training Result in Baotou City of Inner Mongolia Autonomous
The Development of Soil Survey and Soil Mapping in China
 The Development of Soil Survey and Soil Mapping in China Gan-Lin Zhang, Zi-Tong Gong State Key Laboratory of Soil and Sustainable Agriculture, Institute of Soil Science, Chinese Academy of Sciences, Nanjing
Using GIS to Identify Pedestrian- Vehicle Crash Hot Spots and Unsafe Bus Stops
 Using GIS to Identify Pedestrian-Vehicle Crash Hot Spots and Unsafe Bus Stops Using GIS to Identify Pedestrian- Vehicle Crash Hot Spots and Unsafe Bus Stops Long Tien Truong and Sekhar V. C. Somenahalli
Application of ARCGIS and Analytical Hierarchy Process in the Risk Assessment of Geological Disaster in Complex Mountains
 Application of ARCGIS and Analytical Hierarchy Process in the Risk Assessment of Geological Disaster in Complex Mountains Li Li Lecturer Key Laboratory of Water Environment Evolution and Pollution Control
A Survey on Outlier Detection Techniques for Credit Card Fraud Detection
 IOSR Journal of Computer Engineering (IOSR-JCE) e-issn: 2278-0661, p- ISSN: 2278-8727Volume 16, Issue 2, Ver. VI (Mar-Apr. 2014), PP 44-48 A Survey on Outlier Detection Techniques for Credit Card Fraud
Empirical Analysis on the impact of working capital management. Hong ming, Chen & Sha Liu
 Empirical Analysis on the impact of working capital management Hong ming, Chen & Sha Liu (School Of Economics and Management in Changsha University of Science and Technology Changsha, Hunan, China 410076)
Early Childhood Education Policy Development in China
 International Journal of Child Care and Education Policy Copyright 2011 by Korea Institute of Child Care and Education 2011, Vol. 5, No.1, 29-39 Early Childhood Education Policy Development in China Xin
Credit risk management of commercial bank
 Available online www.jocpr.com Journal of Chemical and Pharmaceutical Research, 2014, 6(5):1784-1788 Research Article ISSN : 0975-7384 CODEN(USA) : JCPRC5 Credit risk management of commercial bank Qian
Random forest algorithm in big data environment
 Random forest algorithm in big data environment Yingchun Liu * School of Economics and Management, Beihang University, Beijing 100191, China Received 1 September 2014, www.cmnt.lv Abstract Random forest
Big Data Analytics of Multi-Relationship Online Social Network Based on Multi-Subnet Composited Complex Network
 , pp.273-284 http://dx.doi.org/10.14257/ijdta.2015.8.5.24 Big Data Analytics of Multi-Relationship Online Social Network Based on Multi-Subnet Composited Complex Network Gengxin Sun 1, Sheng Bin 2 and
Competency 1 Describe the role of epidemiology in public health
 The Northwest Center for Public Health Practice (NWCPHP) has developed competency-based epidemiology training materials for public health professionals in practice. Epidemiology is broadly accepted as
Food Safety Control from the Perspective of Supply Chain
 International Conference on Education Technology and Economic Management (ICETEM 2015) Food Safety Control from the Perspective of Supply Chain Weiyan Xie Guangxi Vocational College of Technology and Business,
Open Access Numerical Analysis on Mutual Influences in Urban Subway Double-Hole Parallel Tunneling
 Send Orders for Reprints to reprints@benthamscience.ae The Open Construction and Building Technology Journal, 2014, 8, 455-462 455 Open Access Numerical Analysis on Mutual Influences in Urban Subway Double-Hole
U.P.B. Sci. Bull., Series C, Vol. 77, Iss. 1, 2015 ISSN 2286 3540
 U.P.B. Sci. Bull., Series C, Vol. 77, Iss. 1, 2015 ISSN 2286 3540 ENTERPRISE FINANCIAL DISTRESS PREDICTION BASED ON BACKWARD PROPAGATION NEURAL NETWORK: AN EMPIRICAL STUDY ON THE CHINESE LISTED EQUIPMENT
Complex Network Visualization based on Voronoi Diagram and Smoothed-particle Hydrodynamics
 Complex Network Visualization based on Voronoi Diagram and Smoothed-particle Hydrodynamics Zhao Wenbin 1, Zhao Zhengxu 2 1 School of Instrument Science and Engineering, Southeast University, Nanjing, Jiangsu
Business Statistics. Successful completion of Introductory and/or Intermediate Algebra courses is recommended before taking Business Statistics.
 Business Course Text Bowerman, Bruce L., Richard T. O'Connell, J. B. Orris, and Dawn C. Porter. Essentials of Business, 2nd edition, McGraw-Hill/Irwin, 2008, ISBN: 978-0-07-331988-9. Required Computing
Database Modeling and Visualization Simulation technology Based on Java3D Hongxia Liu
 International Conference on Information Sciences, Machinery, Materials and Energy (ICISMME 05) Database Modeling and Visualization Simulation technology Based on Java3D Hongxia Liu Department of Electronic
Geography. Curriculum Glance Cards
 Geography Curriculum Glance Cards A fundamental principle of the curriculum is that children s current understanding and knowledge should form the basis for new learning. The curriculum is designed to
Design call center management system of e-commerce based on BP neural network and multifractal
 Available online www.jocpr.com Journal of Chemical and Pharmaceutical Research, 2014, 6(6):951-956 Research Article ISSN : 0975-7384 CODEN(USA) : JCPRC5 Design call center management system of e-commerce
Using your GIS tools for Mapping, Visualization and Analysis of Health Data, Improves Understanding. Patricia Cummens ESri
 Using your GIS tools for Mapping, Visualization and Analysis of Health Data, Improves Understanding Patricia Cummens ESri The Atlas for Geographic Variation within the Medicare Program http://atlas.esri.com/atlas/cms_atlas.html?t=1&m=1&x=-97.43&y=38.72&l=5
EXPLORING SPATIAL PATTERNS IN YOUR DATA
 EXPLORING SPATIAL PATTERNS IN YOUR DATA OBJECTIVES Learn how to examine your data using the Geostatistical Analysis tools in ArcMap. Learn how to use descriptive statistics in ArcMap and Geoda to analyze
Landslide hazard zonation using MR and AHP methods and GIS techniques in Langan watershed, Ardabil, Iran
 Landslide hazard zonation using MR and AHP methods and GIS techniques in Langan watershed, Ardabil, Iran A. Esmali Ouri 1* S. Amirian 2 1 Assistant Professor, Faculty of Agriculture, University of Mohaghegh
Developing Environmental Pollution Liability Insurance: the. Countermeasures. A Case Study of Baoding, Hebei Province, China
 Developing Environmental Pollution Liability Insurance: the Countermeasures Developing Environmental Pollution Liability Insurance: the Countermeasures A Case Study of Baoding, Hebei Province, China Liu
Time series analysis as a framework for the characterization of waterborne disease outbreaks
 Interdisciplinary Perspectives on Drinking Water Risk Assessment and Management (Proceedings of the Santiago (Chile) Symposium, September 1998). IAHS Publ. no. 260, 2000. 127 Time series analysis as a
Data Analysis and Interpretation. Eleanor Howell, MS Manager, Data Dissemination Unit State Center for Health Statistics
 Data Analysis and Interpretation Eleanor Howell, MS Manager, Data Dissemination Unit State Center for Health Statistics Why do we need data? To show evidence or support for an idea To track progress over
Modelling, Extraction and Description of Intrinsic Cues of High Resolution Satellite Images: Independent Component Analysis based approaches
 Modelling, Extraction and Description of Intrinsic Cues of High Resolution Satellite Images: Independent Component Analysis based approaches PhD Thesis by Payam Birjandi Director: Prof. Mihai Datcu Problematic
Spatial Analysis of Five Crime Statistics in Turkey
 Spatial Analysis of Five Crime Statistics in Turkey Saffet ERDOĞAN, M. Ali DERELİ, Mustafa YALÇIN, Turkey Key words: Crime rates, geographical information systems, spatial analysis. SUMMARY In this study,
CIESIN Columbia University
 Conference on Climate Change and Official Statistics Oslo, Norway, 14-16 April 2008 The Role of Spatial Data Infrastructure in Integrating Climate Change Information with a Focus on Monitoring Observed
A SOCIAL NETWORK ANALYSIS APPROACH TO ANALYZE ROAD NETWORKS INTRODUCTION
 A SOCIAL NETWORK ANALYSIS APPROACH TO ANALYZE ROAD NETWORKS Kyoungjin Park Alper Yilmaz Photogrammetric and Computer Vision Lab Ohio State University park.764@osu.edu yilmaz.15@osu.edu ABSTRACT Depending
The Status of Geospatial Information Management in China
 The Status of Geospatial Information Management in China Submitted by the National Administration of Surveying, Mapping and Geoinformation of China 1. Administration System The National Administration
The Influence of Stressful Life Events of College Students on Subjective Well-Being: The Mediation Effect of the Operational Effectiveness
 Open Journal of Social Sciences, 2016, 4, 70-76 Published Online June 2016 in SciRes. http://www.scirp.org/journal/jss http://dx.doi.org/10.4236/jss.2016.46008 The Influence of Stressful Life Events of
An empirical study of factor analysis on M & A performance of listed companies of Chinese pharmaceutical industry
 Available online www.jocpr.com Journal of Chemical and Pharmaceutical Research, 2014, 6(4):963-968 Research Article ISSN : 0975-7384 CODEN(USA) : JCPRC5 An empirical study of factor analysis on M & A performance
Introduction to spatial data analysis
 Introduction to spatial data analysis 3 Scuola di Dottorato in Economia, La Sapienza, 2015/2016 Instructors: Filippo Celata, Federico Martellozzo and Luca Salvati http://www.memotef.uniroma1.it/node/6524
Part 2: Analysis of Relationship Between Two Variables
 Part 2: Analysis of Relationship Between Two Variables Linear Regression Linear correlation Significance Tests Multiple regression Linear Regression Y = a X + b Dependent Variable Independent Variable
The application of Web GIS in emergency flood control system
 80 GIS and Remote Sensing in Hydrology, Water Resources and Environment (Proceedings of ICGRHWE held at the Three Gorges Dam, China, September 2003). IAHS Pub!. 289. 2004 The application of Web GIS in
Course Text. Required Computing Software. Course Description. Course Objectives. StraighterLine. Business Statistics
 Course Text Business Statistics Lind, Douglas A., Marchal, William A. and Samuel A. Wathen. Basic Statistics for Business and Economics, 7th edition, McGraw-Hill/Irwin, 2010, ISBN: 9780077384470 [This
Credit Risk Comprehensive Evaluation Method for Online Trading
 Credit Risk Comprehensive Evaluation Method for Online Trading Company 1 *1, Corresponding Author School of Economics and Management, Beijing Forestry University, fankun@bjfu.edu.cn Abstract A new comprehensive
A POPULATION MEAN, CONFIDENCE INTERVALS AND HYPOTHESIS TESTING
 CHAPTER 5. A POPULATION MEAN, CONFIDENCE INTERVALS AND HYPOTHESIS TESTING 5.1 Concepts When a number of animals or plots are exposed to a certain treatment, we usually estimate the effect of the treatment
Prenatal screening and diagnostic tests
 Prenatal screening and diagnostic tests Contents Introduction 3 First trimester routine tests in the mother 3 Testing for health conditions in the baby 4 Why would you have a prenatal test? 6 What are
RESEARCH ON THE FRAMEWORK OF SPATIO-TEMPORAL DATA WAREHOUSE
 RESEARCH ON THE FRAMEWORK OF SPATIO-TEMPORAL DATA WAREHOUSE WANG Jizhou, LI Chengming Institute of GIS, Chinese Academy of Surveying and Mapping No.16, Road Beitaiping, District Haidian, Beijing, P.R.China,
Research on Application of Web Log Analysis Method in Agriculture Website Improvement
 Research on Application of Web Log Analysis Method in Agriculture Website Improvement Jian Wang 1 ( 1 Agricultural information institute of CAAS, Beijing 100081, China) wangjian@caas.net.cn Abstract :
Institute of Actuaries of India Subject CT3 Probability and Mathematical Statistics
 Institute of Actuaries of India Subject CT3 Probability and Mathematical Statistics For 2015 Examinations Aim The aim of the Probability and Mathematical Statistics subject is to provide a grounding in
Mean = (sum of the values / the number of the value) if probabilities are equal
 if probabilities are equal") Population Mean Mean = (sum of the values / the number of the value) if probabilities are equal Compute the population mean Population/Sample mean: 1. Collect the data 2. sum all the values in the population/sample.
Population Mean Mean = (sum of the values / the number of the value) if probabilities are equal Compute the population mean Population/Sample mean: 1. Collect the data 2. sum all the values in the population/sample.
Risk Factors for Alcoholism among Taiwanese Aborigines
 Risk Factors for Alcoholism among Taiwanese Aborigines Introduction Like most mental disorders, Alcoholism is a complex disease involving naturenurture interplay (1). The influence from the bio-psycho-social
Integrated Geographic Information Services for Wenchuan Earthquake *
 UNITED NATIONS E/CONF.99/CRP.3 ECONOMIC AND SOCIAL COUNCIL Ninth United Nations Regional Cartographic Conference for the Americas New York, 10-14 August 2009 Item 5(b) of the provisional agenda Country
Effects of node buffer and capacity on network traffic
 Chin. Phys. B Vol. 21, No. 9 (212) 9892 Effects of node buffer and capacity on network traffic Ling Xiang( 凌 翔 ) a), Hu Mao-Bin( 胡 茂 彬 ) b), and Ding Jian-Xun( 丁 建 勋 ) a) a) School of Transportation Engineering,
A Load Balancing Algorithm based on the Variation Trend of Entropy in Homogeneous Cluster
 , pp.11-20 http://dx.doi.org/10.14257/ ijgdc.2014.7.2.02 A Load Balancing Algorithm based on the Variation Trend of Entropy in Homogeneous Cluster Kehe Wu 1, Long Chen 2, Shichao Ye 2 and Yi Li 2 1 Beijing
The multilayer sentiment analysis model based on Random forest Wei Liu1, Jie Zhang2
 2nd International Conference on Advances in Mechanical Engineering and Industrial Informatics (AMEII 2016) The multilayer sentiment analysis model based on Random forest Wei Liu1, Jie Zhang2 1 School of
Analysis on demand factor of regional difference for reverse mortgage-based on survey data in Beijing & Hangzhou
 Available online www.jocpr.com Journal of Chemical and Pharmaceutical Research, 2014, 6(5):232-238 Research Article ISSN : 0975-7384 CODEN(USA) : JCPRC5 Analysis on demand factor of regional difference
Spatial Data Analysis
 14 Spatial Data Analysis OVERVIEW This chapter is the first in a set of three dealing with geographic analysis and modeling methods. The chapter begins with a review of the relevant terms, and an outlines
The Relationships between Economic Growth and Environmental Pollution Based on Time Series Data:An Empirical Study of Zhejiang Province
 Journal of Cambridge Studies 33 The Relationships between Economic Growth and Environmental Pollution Based on Time Series Data:An Empirical Study of Zhejiang Province Lixia YANG 1 Shaofeng YUAN 2 * Le
Obesity in America: A Growing Trend
 Obesity in America: A Growing Trend David Todd P e n n s y l v a n i a S t a t e U n i v e r s i t y Utilizing Geographic Information Systems (GIS) to explore obesity in America, this study aims to determine
Study of data structure and algorithm design teaching reform based on CDIO model
 Study of data structure and algorithm design teaching reform based on CDIO model Li tongyan, Fu lin (Chengdu University of Information Technology, 610225, China) ABSTRACT CDIO is a new and innovative engineering
RESEARCH ON CHINA S GIS INDUSTRY
 RESEARCH ON CHINA S GIS INDUSTRY Bo Xiaoying a, Zhang Lingling a,b a School of Management, Graduate University of Chinese Academy of Sciences, Beijing (100080), China, - eeboxy@gmail.com b Chinese Academy
Improving the Performance of Data Mining Models with Data Preparation Using SAS Enterprise Miner Ricardo Galante, SAS Institute Brasil, São Paulo, SP
 Improving the Performance of Data Mining Models with Data Preparation Using SAS Enterprise Miner Ricardo Galante, SAS Institute Brasil, São Paulo, SP ABSTRACT In data mining modelling, data preparation
Independent t- Test (Comparing Two Means)
") Independent t- Test (Comparing Two Means) The objectives of this lesson are to learn: the definition/purpose of independent t-test when to use the independent t-test the use of SPSS to complete an independent
Independent t- Test (Comparing Two Means) The objectives of this lesson are to learn: the definition/purpose of independent t-test when to use the independent t-test the use of SPSS to complete an independent
An Open Platform of Data Quality Monitoring for ERP Information Systems
 An Open Platform of Data Quality Monitoring for ERP Information Systems Pawel Sieniawski 1 and Bogdan Trawinski 2 Wroclaw University of Technology, Institute of Applied Informatics Wybrzeze S. Wyspianskiego
Spatial sampling effect of laboratory practices in a porphyry copper deposit
 Spatial sampling effect of laboratory practices in a porphyry copper deposit Serge Antoine Séguret Centre of Geosciences and Geoengineering/ Geostatistics, MINES ParisTech, Fontainebleau, France ABSTRACT
For Online Publication. Appendix 1: Data. 1. Rainfall Data and Drought
 For Online Publication Appendix 1: Data 1. Rainfall Data and Drought The South African Weather Service http://www.weathersa.co.za/web/ provided the raw historical rainfall data. These data contain monthly
The Delicate Art of Flower Classification
 The Delicate Art of Flower Classification Paul Vicol Simon Fraser University University Burnaby, BC pvicol@sfu.ca Note: The following is my contribution to a group project for a graduate machine learning
Additional sources Compilation of sources: http://lrs.ed.uiuc.edu/tseportal/datacollectionmethodologies/jin-tselink/tselink.htm
 Mgt 540 Research Methods Data Analysis 1 Additional sources Compilation of sources: http://lrs.ed.uiuc.edu/tseportal/datacollectionmethodologies/jin-tselink/tselink.htm http://web.utk.edu/~dap/random/order/start.htm
Exploratory Factor Analysis of Demographic Characteristics of Antenatal Clinic Attendees and their Association with HIV Risk
 Doi:10.5901/mjss.2014.v5n20p303 Abstract Exploratory Factor Analysis of Demographic Characteristics of Antenatal Clinic Attendees and their Association with HIV Risk Wilbert Sibanda Philip D. Pretorius
excerpted from Reducing Pandemic Risk, Promoting Global Health For the full report go to http://report.predict.global
 excerpted from Reducing Pandemic Risk, Promoting Global Health For the full report go to http://report.predict.global FUTURE DIRECTIONS Historically, attempts to control deadly viruses, such as SARS and
WATER BODY EXTRACTION FROM MULTI SPECTRAL IMAGE BY SPECTRAL PATTERN ANALYSIS
 WATER BODY EXTRACTION FROM MULTI SPECTRAL IMAGE BY SPECTRAL PATTERN ANALYSIS Nguyen Dinh Duong Department of Environmental Information Study and Analysis, Institute of Geography, 18 Hoang Quoc Viet Rd.,
Analysis of China Motor Vehicle Insurance Business Trends
 Analysis of China Motor Vehicle Insurance Business Trends 1 Xiaohui WU, 2 Zheng Zhang, 3 Lei Liu, 4 Lanlan Zhang 1, First Autho University of International Business and Economic, Beijing, wuxiaohui@iachina.cn
Insurance Markets in China 1
 Insurance Markets in China 1 Hanming Fang University of Pennsylvania Even though Chinese merchants have practiced risk transferring and distributing as early as 3000 BC, 2 modern insurance markets in China
Atmospheric Mercury Monitoring in China
 Atmospheric Mercury Monitoring in China Xinbin Feng 1, Xuewu Fu 1,2, Qi Wan 1,2, Wei Zheng 1,2 1. State Key Laboratory of Environmental Geochemistry, Institute of Geochemistry, Chinese Academy of Sciences,
USING SPECTRAL RADIUS RATIO FOR NODE DEGREE TO ANALYZE THE EVOLUTION OF SCALE- FREE NETWORKS AND SMALL-WORLD NETWORKS
 USING SPECTRAL RADIUS RATIO FOR NODE DEGREE TO ANALYZE THE EVOLUTION OF SCALE- FREE NETWORKS AND SMALL-WORLD NETWORKS Natarajan Meghanathan Jackson State University, 1400 Lynch St, Jackson, MS, USA natarajan.meghanathan@jsums.edu
Research On The Classification Of High Resolution Image Based On Object-oriented And Class Rule
 Research On The Classification Of High Resolution Image Based On Object-oriented And Class Rule Li Chaokui a,b, Fang Wen a,b, Dong Xiaojiao a,b a National-Local Joint Engineering Laboratory of Geo-Spatial
PERSONALIZED WEB MAP CUSTOMIZED SERVICE
 CO-436 PERSONALIZED WEB MAP CUSTOMIZED SERVICE CHEN Y.(1), WU Z.(1), YE H.(2) (1) Zhengzhou Institute of Surveying and Mapping, ZHENGZHOU, CHINA ; (2) North China Institute of Water Conservancy and Hydroelectric
Data Mining Applications in Higher Education
 Executive report Data Mining Applications in Higher Education Jing Luan, PhD Chief Planning and Research Officer, Cabrillo College Founder, Knowledge Discovery Laboratories Table of contents Introduction..............................................................2
MULTIPLE CHOICE. Choose the one alternative that best completes the statement or answers the question.
 Final Exam Review MULTIPLE CHOICE. Choose the one alternative that best completes the statement or answers the question. 1) A researcher for an airline interviews all of the passengers on five randomly
The Study of Chinese P&C Insurance Risk for the Purpose of. Solvency Capital Requirement
 The Study of Chinese P&C Insurance Risk for the Purpose of Solvency Capital Requirement Xie Zhigang, Wang Shangwen, Zhou Jinhan School of Finance, Shanghai University of Finance & Economics 777 Guoding
International Journal of Advanced Computer Technology (IJACT) ISSN:2319-7900 PRIVACY PRESERVING DATA MINING IN HEALTH CARE APPLICATIONS
 ISSN:2319-7900 PRIVACY PRESERVING DATA MINING IN HEALTH CARE APPLICATIONS") PRIVACY PRESERVING DATA MINING IN HEALTH CARE APPLICATIONS First A. Dr. D. Aruna Kumari, Ph.d, ; Second B. Ch.Mounika, Student, Department Of ECM, K L University, chittiprolumounika@gmail.com; Third C.
PRIVACY PRESERVING DATA MINING IN HEALTH CARE APPLICATIONS First A. Dr. D. Aruna Kumari, Ph.d, ; Second B. Ch.Mounika, Student, Department Of ECM, K L University, chittiprolumounika@gmail.com; Third C.
The update mode study of residents electronic health records
 Available online www.jocpr.com Journal of Chemical and Pharmaceutical Research, 2014, 6(6):1579-1583 Research Article ISSN : 0975-7384 CODEN(USA) : JCPRC5 The update mode study of residents electronic
Simple Linear Regression Inference
 Simple Linear Regression Inference 1 Inference requirements The Normality assumption of the stochastic term e is needed for inference even if it is not a OLS requirement. Therefore we have: Interpretation
Population prevalence rates of birth defects: a data management and epidemiological perspective
 Population prevalence rates of birth defects: a data management and epidemiological perspective Merilyn Riley Abstract The Victorian Birth Defects Register (VBDR) is a population-based surveillance system
Data Mining Techniques Chapter 5: The Lure of Statistics: Data Mining Using Familiar Tools
 Data Mining Techniques Chapter 5: The Lure of Statistics: Data Mining Using Familiar Tools Occam s razor.......................................................... 2 A look at data I.........................................................
ANALYSING LIKERT SCALE/TYPE DATA, ORDINAL LOGISTIC REGRESSION EXAMPLE IN R.
 ANALYSING LIKERT SCALE/TYPE DATA, ORDINAL LOGISTIC REGRESSION EXAMPLE IN R. 1. Motivation. Likert items are used to measure respondents attitudes to a particular question or statement. One must recall
Local outlier detection in data forensics: data mining approach to flag unusual schools
 Local outlier detection in data forensics: data mining approach to flag unusual schools Mayuko Simon Data Recognition Corporation Paper presented at the 2012 Conference on Statistical Detection of Potential
Flood Disaster Risk Assessment of Rural Housings A Case Study of Kouqian Town in China
 Int. J. Environ. Res. Public Health 2014, 11, 3787-3802; doi:10.3390/ijerph110403787 OPEN ACCESS Article International Journal of Environmental Research and Public Health ISSN 1660-4601 www.mdpi.com/journal/ijerph
CLASSIFICATION is a fundamental part of the rational
 Published online December 2, 2005 Cross-Reference System for Translating Between Genetic Soil Classification of China and Soil Taxonomy X. Z. Shi, D. S. Yu, E. D. Warner,* W. X. Sun, G. W. Petersen, Z.
Classified Comparison of Operational Efficiency to Internet Company in China Based on DEA Model
 , pp. 1-14 http://dx.doi.org/10.14257/ijhit.2014.7.6.01 Classified Comparison of Operational Efficiency to Internet Company in China Based on DEA Model Liu Jian 1 and Li Wei 1,2,* 1 School of Information
Introduction to Spatial Data Mining
 Introduction to Spatial Data Mining 7.1 Pattern Discovery 7.2 Motivation 7.3 Classification Techniques 7.4 Association Rule Discovery Techniques 7.5 Clustering 7.6 Outlier Detection Introduction: a classic
Analyzing temporal and spatial dynamics of deforestation in the Amazon: a case study in the Calha Norte region, State of Pará, Brazil
 Anais XV Simpósio Brasileiro de Sensoriamento Remoto - SBSR, Curitiba, PR, Brasil, 30 de abril a 05 de maio de 2011, INPE p.2756 Analyzing temporal and spatial dynamics of deforestation in the Amazon:
An Introduction to China Data Development and Applications. Shuming Bao China Data Center University of Michigan
 An Introduction to China Data Development and Applications Shuming Bao China Data Center University of Michigan Background and Missions Background Founded in 1997 by the University of Michigan Inherited
Fault Analysis in Software with the Data Interaction of Classes
 , pp.189-196 http://dx.doi.org/10.14257/ijsia.2015.9.9.17 Fault Analysis in Software with the Data Interaction of Classes Yan Xiaobo 1 and Wang Yichen 2 1 Science & Technology on Reliability & Environmental
Metadata Hierarchy in Integrated Geoscientific Database for Regional Mineral Prospecting
 Metadata Hierarchy in Integrated Geoscientific Database for Regional Mineral Prospecting MA Xiaogang WANG Xinqing WU Chonglong JU Feng ABSTRACT: One of the core developments in geomathematics in now days