Data Analysis and Interpretation. Eleanor Howell, MS Manager, Data Dissemination Unit State Center for Health Statistics
|
|
|
- Shauna Rose
- 8 years ago
- Views:
Transcription
1 Data Analysis and Interpretation Eleanor Howell, MS Manager, Data Dissemination Unit State Center for Health Statistics

2 Why do we need data? To show evidence or support for an idea To track progress over time Use data to enhance: Reporting Grant writing Presentations Research

3 Essential Public Health Services Monitor health status to identify community health problems Source: Public Health Functions Steering Committee

4 Accreditation Standards 1.1.b Reflect the demographic profile of the population 1.1.c Describe socioeconomic, educational & environment factors that affect health 1.1.d Assemble/analyze secondary data to describe community health status 1.1.e Collect/analyze primary data to describe community health status

5 Accreditation Standards Community Health Assessments should include: Socioeconomic factors Unemployment Housing Educational factors Early interventions Drop-out out rates SAT scores Environmental factors Air pollution Tobacco Childhood lead exposure

6 Accreditation Standards 1.1.f Compile/analyze trend data to describe changes in community health status and factors affecting health 1.1.g Use scientific methods for collecting and analyzing data 1.1.h Identify population groups at risk 1.1.j Compare selected local data with data from other jurisdictions

7 Accreditation Standards cont. Analysis should include: Trends Comparison of local rates to: State rates Other counties Healthy NC 2020 objectives Health priorities selection process

8 Types of Data Quantitative Based on counts and measurements Rates Disease events Answers to closed questions Qualitative Based on information that can not be measured Opinions Perceptions Observations Answers to open questions

9 Sources of Data Primary Collected personally by your CHA team Surveys Listening sessions Interviews Observations Secondary Collected by someone else Birth Mortality Morbidity

10 Resource Guide for CHA
11 Descriptive Statistics Measurement Scales Nominal scale (identified by name only) sex, marital status Ordinal scale (identified by name and can be ranked) strongly agree strongly disagree Interval scale age groups Ratio scale (distances can be determined and there is a meaningful zero point) population growth, death rate
 population")
12 Descriptive Statistics Count Comparison of Variables Percent Mean Rate

13 Count Actual number of health events Cases of a disease Deaths People with risk factor People with health behavior

14 Example: Count
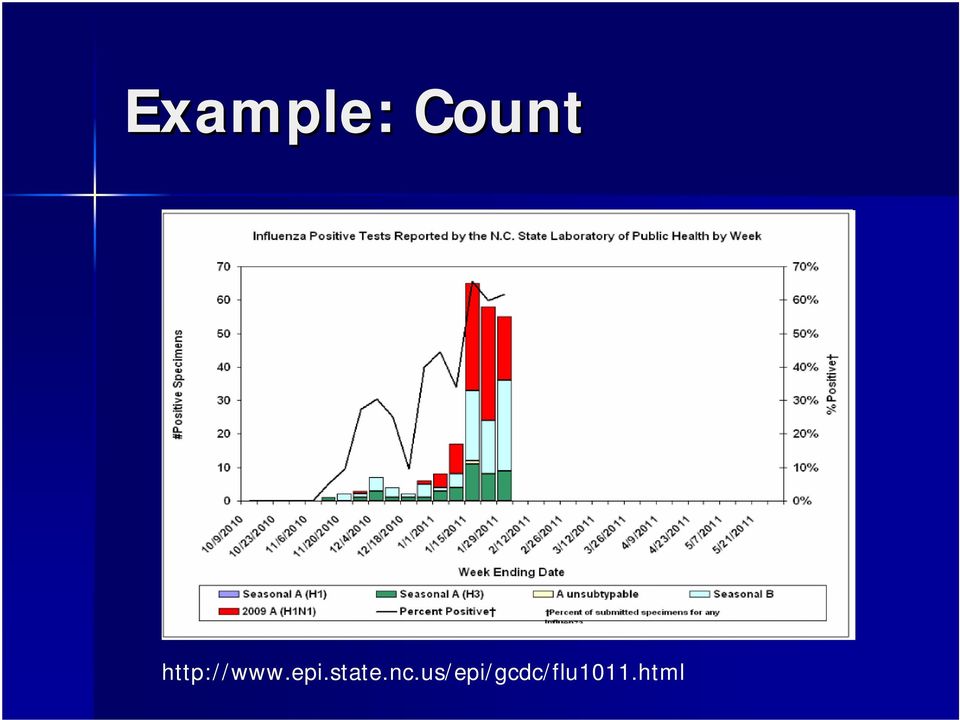
15 Additional Information to Include Include additional information on Time period Geographic area Potential sub-population (e.g. pregnant women, college campus)

16 Prevalence The proportion of people who have a disease/ outcome at one point in time New cases + previously diagnosed (living) cases Measures total disease burden on population Usually measured in surveys

17 Incidence The rate at which new cases occur in a population at risk for getting the outcome Also incidence rate or incidence density How rapidly is the disease occurring in the population? Usually measured in disease registries

18 Which to use? Chronic diseases are generally measured by prevalence Acute diseases are generally measured by incidence Why might a prevalence rate increase when the incident rate for the same condition is not increasing? Individuals are living longer

19 Percent Also known as proportion How big of a portion of the population has the characteristic? Example: Percent living below the poverty line

20 Mean (Average) Total of values _ Number of observations Examples Age Income BMI

21 Additional Information to Include Time period Geographic area Range of values Example
22 Rates # of events/ unit population or time Birth (natality( natality) ) rate Death (mortality) rate Infant mortality rate Cause specific death rate Age specific death rate
23 Crude Rates Relative frequency with which some event occurs in a study population Standard from such as a number per 100,000 Simply the number of events divided by the population at risk, often multiplied by some constant so that the result is not a fraction Used to study an absolute event, such as mortality or pregnancy May not give information needed for decision making May not represent accurately the health status of populations Do not permit clear comparisons among study populations
24 2007 US Deaths Crude Rate Age-Adjusted Adjusted United States 8.0 Alaska 5.1 Florida 9.2 North Carolina 8.4
25 2007 US Deaths Crude Rate Age-Adjusted Adjusted United States Alaska Florida North Carolina
26 Understanding Age- Adjusted Rates Age-adjustment controls for differences in age distributions of populations Important when comparing rates between 2 populations with different age distributions Rates for 2 different counties County vs. state rates State vs. national rates See Statistical Primer 13 for further discussion
27 Statistical Primer 13
28 Cautions to consider with rates Confirm base population is the same for comparisons Trends may be seasonable in nature Rates based on small numbers are unstable Consider notable events that may impact the county
29 Small Numbers Ahead Rates based on small numbers (< 20 events) are unreliable May look like a drastic change with only 1 added case Always report the actual number of cases Solutions: Combine data from several years Use regional instead of county data See Statistical Primer 12 for further discussion
30 Statistical Primer 12
31 Data Reporting
32 Data Overload: What to report? It is NOT necessary to report all of your data! Report: Data for which an action plan can be written Important comparisons Areas of progress Important health problems and risks
33 So what is important? Rough guideline= = 15% or greater difference between health indicators Use the 15% rule to judge: Comparisons between your county and peer or neighboring counties Comparisons between state and your county Areas of great improvement Problem areas See Excel spreadsheet for help
34 What analyses should I focus on? Trends Report changes in your county s s health indicators over time Need data from several points in time If annual rates, look at yearly trends over a 5 or 10 year period If 5 year rates, look at trends over longer periods of time Look for improvement, decline, or steady state Easiest to illustrate using graphs If this is your 2 nd CHA cycle, compare results from one CHA to the next!
35 Percent Change 1. Determine the base statistic 2. Subtract the base from the comparison value 3. Divide by the base value 4. Multiply by When reporting, clearly specify the base value
36 What analyses should I focus on? Comparison of local statistics to those from: Peer counties (as defined by NC-CATCH) CATCH) Neighboring counties State HC 2010/2020 objectives Can report using tables or figures See Excel spreadsheet for calculations
37 Using Statistics in Your Report 1. Combine your primary and secondary data 2. Review all of your statistics and analyses 3. Decide how you will present these numbers Text Graphs/ charts Tables 4. Ask yourself: What do these figures show? 5. Write a stand alone explanation of each graph, chart or table
38 Data Interpretation NEVER present numbers in any form without giving some explanation! 1. Summarize findings 2. Call attention to most important or interesting changes or problems 3. Always state your units Ex: The birth rate for 2007 for our county was 5.6 births per 100,000 population. 4. Look at qualitative data for the story behind the numbers
39 Interpreting the Numbers: Important Questions What makes your community unique? What do these numbers mean for my community s s health? How has my community changed lately? Do recent changes affect the health of community members? The work of health professionals? What gaps in healthcare did you find, if any?
40 Interpreting the Numbers: Health Problems What are my community s s major health risks and problems? What are major causes of death? Why are these risks or rates so high (or low)? Where did these problems come from? How has the history of my community s development affected the health of its members?
41 Interpreting the Numbers: Notes on Race Race itself does not cause poor health status! Race is often a surrogate measure for: Socioeconomic factors Stress Racism/ discrimination Why does SCHS only publish data for 2 groups: white and minority? Small numbers Census data collected only once a decade Hispanic/Latino is an ethnic group, rather than a racial group
42 Interpreting Community Health Opinion Survey data 1. Report your methods 2. Use demographic data to describe your sample population 3. Summarize important findings 4. Report how your sample population compares to your target population 5. Hypothesize about what caused differences
43 More on Interpreting Survey Data According to survey respondents: What was the general opinion about the quality of life in your community? What areas seem to need work in your community? What were the biggest health problems? What are some of your community s assets?
44 Reminders on Primary Data Misleading data is worse than no data! If using a convenience sample, interpret the results with caution. Be sure to describe the sampling method used. Small group discussion results should be described qualitatively, not quantitatively.
45 Organizing Your Results Most prevalent/ serious health problems Based on concerns of community members As evidenced by secondary data Results of each instrument used to collect data: Survey data Listening session/ focus group results NC-CATCH/ CATCH/ Community Health Data Books As supported by data: Informed beliefs/ opinions of CHA team members Healthy Carolinians Goals
46 Putting It All Together: Worksheet 1
47 Putting It All Together: Worksheet 2
48 Putting It All Together Focus on issues that: Affect a lot of people Greatly impact the whole community Have a solution Assess whether your community member s perceptions supported or conflicted with the secondary data Assess the accuracy or relevance of the data Cite your sources
49 Special Thanks Many of these slides have been borrowed and modified from presentations made by Kim Angelon- Gaetz,, MSPH at previous Community Health Assessment Institutes.
50 Discussion 1 Why the unusual trend?
51 Discussion 2 Percent Change Infant Mortality North Carolina 2008: 8.2 per 1,000 live births 2009: 7.9 per 1,000 live births Infant Mortality County A 2008: 3.2 per 1,000 live births 2009: 14.7 per 1,000 live births Numerators were 1 and 4, respectively, so not appropriate to compare
52 Discussion 3 Residence vs. Occurrence 2009 Events 3794 births occurred in Pitt County 2018 deaths occurred in Pitt County 2 births occurred in Greene County 90 deaths occurred in Greene County Why might this not be the appropriate numerator?
49. INFANT MORTALITY RATE. Infant mortality rate is defined as the death of an infant before his or her first birthday.
 49. INFANT MORTALITY RATE Wing Tam (Alice) Jennifer Cheng Stat 157 course project More Risk in Everyday Life Risk Meter LIKELIHOOD of exposure to hazardous levels Low Medium High Consequences: Severity,
Butler Memorial Hospital Community Health Needs Assessment 2013
 Butler Memorial Hospital Community Health Needs Assessment 2013 Butler County best represents the community that Butler Memorial Hospital serves. Butler Memorial Hospital (BMH) has conducted community
A Population Based Risk Algorithm for the Development of Type 2 Diabetes: in the United States
 A Population Based Risk Algorithm for the Development of Type 2 Diabetes: Validation of the Diabetes Population Risk Tool (DPoRT) in the United States Christopher Tait PhD Student Canadian Society for
Collecting Quantitative Data in Your Community Health Assessment
 Collecting Quantitative Data in Your Community Health Assessment January 23, 2012 Presented by: Julie Willems Van Dijk Webinar Logistics The lines are muted. If you wish to mute/unmute your line to ask/answer
Determines if the data you collect is practical for analysis. Reviews the appropriateness of your data collection methods.
 Performing a Community Assessment 37 STEP 5: DETERMINE HOW TO UNDERSTAND THE INFORMATION (ANALYZE DATA) Now that you have collected data, what does it mean? Making sense of this information is arguably
Graduate Student Epidemiology Program
 Graduate Student Epidemiology Program To promote training in MCH Epidemiology Real-World Experience in: Data Analysis and Monitoring Needs Assessment Program Evaluation 2015 Program Guide Submit your application
Chapter 3: Healthy Start Risk Screening
 Introduction Healthy Start legislation requires that all pregnant women and infants be offered screening for risk factors that may affect their pregnancy, health, or development. The prenatal and infant
Health Disparities in H.R. 3590 (Merged Senate Bill)
") Health Disparities in H.R. 3590 (Merged Senate Bill) Definitions: Health disparity population is defined in the bill as defined in Section 485E (Sec. 931) Current Law: a population is a health disparity
Health Disparities in H.R. 3590 (Merged Senate Bill) Definitions: Health disparity population is defined in the bill as defined in Section 485E (Sec. 931) Current Law: a population is a health disparity
Summary Measures (Ratio, Proportion, Rate) Marie Diener-West, PhD Johns Hopkins University
 Marie Diener-West, PhD Johns Hopkins University") This work is licensed under a Creative Commons Attribution-NonCommercial-ShareAlike License. Your use of this material constitutes acceptance of that license and the conditions of use of materials on this
This work is licensed under a Creative Commons Attribution-NonCommercial-ShareAlike License. Your use of this material constitutes acceptance of that license and the conditions of use of materials on this
King County City Health Profile Vashon Island
 King County City Health Profile Vashon Island West Seattle North Highline Burien SeaTac/Tukwila Vashon Island Des Moines/Normandy Park Kent-West East Federal Way Fed Way-Dash Point/Woodmont December, 212
Data Interpretation for Public Health Professionals
 Data Interpretation for Idaho Public Health Professionals Welcome to Data Interpretation for Idaho Public Health Professionals. My name is Janet Baseman. I m a faculty member at the Northwest Center for
The North Carolina Health Data Explorer
 1 The North Carolina Health Data Explorer The Health Data Explorer provides access to health data for North Carolina counties in an interactive, user-friendly atlas of maps, tables, and charts. It allows
Jay Weiss Institute for Health Equity Sylvester Comprehensive Cancer Center University of Miami. COMMUNITY PROFILE Liberty City, Florida
 Jay Weiss Institute for Health Equity Sylvester Comprehensive Cancer Center University of Miami COMMUNITY PROFILE Liberty City, Florida April 2015 TABLE OF CONTENTS Page Introduction 2 Community Description:
New York State s Racial, Ethnic, and Underserved Populations. Demographic Indicators
 New York State s Racial, Ethnic, and Underserved Populations While much progress has been made to improve the health of racial and ethnic populations, and increase access to care, many still experience
Appendices. 2006 Bexar County Community Health Assessment Appendices Appendix A 125
 Appendices Appendix A Recent reports suggest that the number of mothers seeking dropped precipitously between 2004 and 2005. Tables 1A and 1B, below, shows information since 1990. The trend has been that
Racial and Ethnic Health Disparities in Health and Health Care Kansas City Regional Data
 Racial and Ethnic Health Disparities in Health and Health Care Kansas City Regional Data By Debbie Chase, MPA Consultant, Center for Health Policy University of Missouri -- Columbia 1 Quantitative Data
How To Be A Health Care Worker
 Working with Epidemiologists for Heart Disease & Stroke Prevention Program Development Betty C. Jung, RN MPH CHES Connecticut Department of Public Health betty.jung@po.state.ct.us Albert Tsai, PhD, MPH
How To Be A Health Care Provider
 Program Competency & Learning Objectives Rubric (Student Version) Program Competency #1 Prepare Community Data for Public Health Analyses and Assessments - Student 1A1. Identifies the health status of
In this session, we ll address the issue Once you have data, what do you do with it? Session will include discussion & a data analysis exercise
 Introduce self. Link this talk to the two previous data talks We ve discussed the importance of data to an IP Program We ve identified sources of community-based injury data and We ve discussed planning
Medical Care Costs for Diabetes Associated with Health Disparities Among Adults Enrolled in Medicaid in North Carolina
 No. 160 August 2009 Among Adults Enrolled in Medicaid in North Carolina by Paul A. Buescher, Ph.D. J. Timothy Whitmire, Ph.D. Barbara Pullen-Smith, M.P.H. A Joint Report from the and the Office of Minority
Report of Results and Analysis of Parent Survey Data Collected in Southern West Virginia
 Partners in Community Outreach Education Begins at Home Partners in Community Outreach In-Home Family Education Programs Report of Results and Analysis of Parent Survey Data Collected in Southern West
Racial Disparities in US Healthcare
 Racial Disparities in US Healthcare Paul H. Johnson, Jr. Ph.D. Candidate University of Wisconsin Madison School of Business Research partially funded by the National Institute of Mental Health: Ruth L.
Projections of the Size and Composition of the U.S. Population: 2014 to 2060 Population Estimates and Projections
 Projections of the Size and Composition of the U.S. Population: to Population Estimates and Projections Current Population Reports By Sandra L. Colby and Jennifer M. Ortman Issued March 15 P25-1143 INTRODUCTION
Health Disparities in New Orleans
 Health Disparities in New Orleans New Orleans is a city facing significant health challenges. New Orleans' health-related challenges include a high rate of obesity, a high rate of people without health
Foundation of Quantitative Data Analysis
 Foundation of Quantitative Data Analysis Part 1: Data manipulation and descriptive statistics with SPSS/Excel HSRS #10 - October 17, 2013 Reference : A. Aczel, Complete Business Statistics. Chapters 1
Facts about Diabetes in Massachusetts
 Facts about Diabetes in Massachusetts Diabetes is a disease in which the body does not produce or properly use insulin (a hormone used to convert sugar, starches, and other food into the energy needed
Assessing and Forecasting Population Health
 Assessing and Forecasting Population Health Jeroen van Meijgaard UCLA School of Public Health AcademyHealth June 29, 2009 DEVELOPING A CALIFORNIA HEALTH FORECAST Need for health forecasting Policy makers
June 25, 2004 Meeting Assignment
 Appendix A.1 June 25, 2004 Meeting Assignment Please review the attached indicator worksheet and fill in what you believe to be the five most important and five least important indicators. As you are determining
Health Atlas and the Community Health and Equity Index:
 Health Atlas and the Community Health and Equity Index: An Examination of Health Conditions in the City of Los Angeles Presented by Eric Yurkovich, Raimi + Associates March 13, 2014 Purpose Spatial analysis
Huron County Community Health Profile
 2014 Huron County Community Health Profile ` Prepared by: Eileen Unruh RN, MSN Samantha Fackler RN, MSN 11/1/2014 1 HURON COUNTY COMMUNITY HEALTH PROFILE TABLE OF CONTENTS INTRODUCTION.... 4 DEMOGRAPHICS...
Death Data: CDC Wonder, Texas Health Data, and VitalWeb
 Death Data: CDC Wonder, Texas Health Data, and VitalWeb Evidence-Based Public Health Practice Step 2: Quantify the Issue This handout demonstrates how to access CDC Wonder, Texas Health Data, and VitalWeb
ECU, Center for Health Services Research and Development, 2001. Unintentional Injury
 Unintentional Injury Map 10.1 Progress Towards Unintentional Injury Mortality Objective Northampton Gates Currituck Camden Pasquotank Halifax Hertford Perquimans Nash Bertie Chowan Edgecombe Martin Washington
Cuyahoga County Community Health Data Dashboard
 Cuyahoga County Community Health Data Dashboard Presentation to MetroHealth November 22, 2013 1 Meeting Goals & Agenda Community Health Data Dashboard Cuyahoga County Community Health Data Dashboard (C3HD2)
State Health Assessment Health Priority Status Report Update. June 29, 2015 Presented by UIC SPH and IDPH
 State Health Assessment Health Priority Status Report Update June 29, 2015 Presented by UIC SPH and IDPH 1 Health Priority Presentation Objectives 1. Explain context of how this discussion fits into our
The Role of Insurance in Providing Access to Cardiac Care in Maryland. Samuel L. Brown, Ph.D. University of Baltimore College of Public Affairs
 The Role of Insurance in Providing Access to Cardiac Care in Maryland Samuel L. Brown, Ph.D. University of Baltimore College of Public Affairs Heart Disease Heart Disease is the leading cause of death
Health Care Access to Vulnerable Populations
 Health Care Access to Vulnerable Populations Closing the Gap: Reducing Racial and Ethnic Disparities in Florida Rosebud L. Foster, ED.D. Access to Health Care The timely use of personal health services
Wisconsin Health Trends: 2011 Progress Report
 Making Wisconsin the Healthiest State Project Wisconsin Health Trends: 211 Progress Report July 21 School of Medicine and Public Health UNIVERSITY OF WISCONSIN MADISON University of Wisconsin Population
Health Profile for St. Louis City
 Health Profile for St. Louis City The health indicators of St. Louis City show that the city has many health problems. To highlight a few, the city s rates of sexually transmitted diseases (i.e., HIV/AIDS,
Northumberland Knowledge
 Northumberland Knowledge Know Guide How to Analyse Data - November 2012 - This page has been left blank 2 About this guide The Know Guides are a suite of documents that provide useful information about
Use advanced techniques for summary and visualization of complex data for exploratory analysis and presentation.
 MS Biostatistics MS Biostatistics Competencies Study Development: Work collaboratively with biomedical or public health researchers and PhD biostatisticians, as necessary, to provide biostatistical expertise
Mortality Assessment Technology: A New Tool for Life Insurance Underwriting
 Mortality Assessment Technology: A New Tool for Life Insurance Underwriting Guizhou Hu, MD, PhD BioSignia, Inc, Durham, North Carolina Abstract The ability to more accurately predict chronic disease morbidity
ARE FLORIDA'S CHILDREN BORN HEALTHY AND DO THEY HAVE HEALTH INSURANCE?
 infant mortality rate per 1,000 live births ARE FLORIDA'S CHILDREN BORN HEALTHY AND DO THEY HAVE HEALTH INSURANCE? Too Many of Florida's Babies Die at Birth, Particularly African American Infants In the
in children less than one year old. It is commonly divided into two categories, neonatal
 INTRODUCTION Infant Mortality Rate is one of the most important indicators of the general level of health or well being of a given community. It is a measure of the yearly rate of deaths in children less
Public Health Accreditation Board STANDARDS. Measures VERSION 1.0 APPLICATION PERIOD 2011-2012 APPROVED MAY 2011
 Public Health Accreditation Board STANDARDS & Measures VERSION 1.0 APPLICATION PERIOD 2011-2012 APPROVED MAY 2011 Introduction The Public Health Accreditation Board (PHAB) Standards and Measures document
Guide for Performance Evaluation of Health Department Director/ Administrator
 Guide for Performance Evaluation of Health Department Director/ Administrator Levels of Performance Excellent Good Satisfactory Needs improvement Unacceptable Performance is clearly outstanding Performance
9. Substance Abuse. pg 166-169: Self-reported alcohol consumption. pg 170-171: Childhood experience of living with someone who used drugs
 9. pg 166-169: Self-reported alcohol consumption pg 170-171: Childhood experience of living with someone who used drugs pg 172-173: Hospitalizations related to alcohol and substance abuse pg 174-179: Accidental
Graduate Student Epidemiology Program
 Graduate Student Epidemiology Program To promote training in MCH Epidemiology Real-World Experience in: Data Analysis and Monitoring Needs Assessment Program Evaluation 2014 Program Guide Submit your application
Elementary Statistics
 Elementary Statistics Chapter 1 Dr. Ghamsary Page 1 Elementary Statistics M. Ghamsary, Ph.D. Chap 01 1 Elementary Statistics Chapter 1 Dr. Ghamsary Page 2 Statistics: Statistics is the science of collecting,
Diabetes. African Americans were disproportionately impacted by diabetes. Table 1 Diabetes deaths by race/ethnicity CHRONIC DISEASES
 Diabetes African Americans were disproportionately impacted by diabetes. African Americans were most likely to die of diabetes. People living in San Pablo, Pittsburg, Antioch and Richmond were more likely
Community Health Needs Assessment
 Community Health Needs Assessment CHNA IMPLEMENTATION STRATEGY COMMUNITY HEALTH NEEDS ASSESSMENT OVERVIEW Hospital Overview Greater Baltimore Medical Center (GBMC) is a not-for-profit health care facility
Populations of Color in Minnesota
 Populations of Color in Minnesota Health Status Report Update Summary Spring 2009 Center for Health Statistics Minnesota Department of Health TABLE OF CONTENTS BACKGROUND... 1 PART I: BIRTH-RELATED HEALTH
Health of King County Focus: health inequities
 Health of King County Focus: health inequities February 16, 2012 King County Board of Health David Fleming, MD Director and Health Officer Public Health-Seattle & King County 2/29/2012 1 Per 1,000 100
The Status of Women in Cumberland County, North Carolina
 IWPR #R366 January 2013 The Status of Women in Cumberland County, North Carolina Women in Cumberland County, and in North Carolina as a whole, have made significant progress during the last few decades,
bulletin 126 Healthy life expectancy in Australia: patterns and trends 1998 to 2012 Summary Bulletin 126 NOVEMBER 2014
 Bulletin 126 NOVEMBER 2014 Healthy life expectancy in Australia: patterns and trends 1998 to 2012 Summary bulletin 126 Life expectancy measures how many years on average a person can expect to live, if
Successful Children and Youth
 Successful Children and Youth are cared for by nurturing adults who support their healthy growth and development; live in safe environments free from abuse, neglect, and trauma; have basic necessities;
Chapter 1: Data and Statistics GBS221, Class 20640 January 28, 2013 Notes Compiled by Nicolas C. Rouse, Instructor, Phoenix College
 Chapter Objectives 1. Obtain an appreciation for the breadth of statistical applications in business and economics. 2. Understand the meaning of the terms elements, variables, and observations as they
Exercise Answers. Exercise 3.1 1. B 2. C 3. A 4. B 5. A
 Exercise Answers Exercise 3.1 1. B 2. C 3. A 4. B 5. A Exercise 3.2 1. A; denominator is size of population at start of study, numerator is number of deaths among that population. 2. B; denominator is
Incorporating Life Course, Social Determinants, and Health Equity into California s MCAH Programs
 Incorporating Life Course, Social Determinants, and Health Equity into California s MCAH Programs Shabbir Ahmad, DVM, MS, PhD Maternal, Child and Adolescent Health Program Center for Family Health California
How Midwest Orthopedic Specialty Hospital is meeting the NEEDS of our community. NSWERING HE CALL
 ANSWERING THE CALL MEETING OUR COMMUNITY NEEDS S July 1, 2013 June 30, 2016 How Midwest Orthopedic Specialty Hospital is meeting the NEEDS of our community. NSWERING HE CALL COMMUNITY HEALTH NEEDS IMPLEMENTATION
http://www.cdc.gov/nchs.
 As the Nation s principal health statistics agency, the National Center for Health Statistics (NCHS) compiles statistical information to guide actions and policies to improve the health of the population.
Intro to GIS Winter 2011. Data Visualization Part I
 Intro to GIS Winter 2011 Data Visualization Part I Cartographer Code of Ethics Always have a straightforward agenda and have a defining purpose or goal for each map Always strive to know your audience
STATS8: Introduction to Biostatistics. Data Exploration. Babak Shahbaba Department of Statistics, UCI
 STATS8: Introduction to Biostatistics Data Exploration Babak Shahbaba Department of Statistics, UCI Introduction After clearly defining the scientific problem, selecting a set of representative members
Hepatitis C Infections in Oregon September 2014
 Public Health Division Hepatitis C Infections in Oregon September 214 Chronic HCV in Oregon Since 25, when positive laboratory results for HCV infection became reportable in Oregon, 47,252 persons with
Domain #1: Analytic Assessment Skills
 Domain #1: Analytic Assessment Skills 1. Defines a problem 2. Determines appropriate uses and limitations of both quantitative and qualitative data 3. Selects and defines variables relevant to defined
Overview of Vital Records and Public Health Informatics in CDPH
 Overview of Vital Records and Public Health Informatics in CDPH Este Geraghty, MD, MS, MPH/CPH, FACP, GISP Deputy Director, Center for Health Statistics and Informatics California Department of Public
Meeting/Workshop: Delivery and Cost Studies Methods Workshop
 Presenters: Scott Frank, MD, MS Affiliation: Case Western Reserve University Title: Ohio Public Health Delivery and Cost Study Meeting/Workshop: Delivery and Cost Studies Methods Workshop Organization
Scottish Diabetes Survey 2013. Scottish Diabetes Survey Monitoring Group
 Scottish Diabetes Survey 2013 Scottish Diabetes Survey Monitoring Group Contents Contents... 2 Foreword... 4 Executive Summary... 6 Prevalence... 8 Undiagnosed diabetes... 18 Duration of Diabetes... 18
DESCRIPTIVE STATISTICS. The purpose of statistics is to condense raw data to make it easier to answer specific questions; test hypotheses.
 DESCRIPTIVE STATISTICS The purpose of statistics is to condense raw data to make it easier to answer specific questions; test hypotheses. DESCRIPTIVE VS. INFERENTIAL STATISTICS Descriptive To organize,
Borgess Health Implementation Strategy
 Borgess Health Implementation Strategy Implementation Strategy Narrative Overview Borgess Medical Center is a 422-bed tertiary care hospital and the flagship of Borgess Health with a continuum of health
Preventing Pediatric Diabetes: Are Racial Disparities A Factor? A Children s Health Fund Issue Brief February 2004
 Preventing Pediatric Diabetes: Are Racial Disparities A Factor? A Children s Health Fund Issue Brief February 2004 The Children s Health Fund The Children s Health Fund (CHF), working with hospitals and
Selected Health Status Indicators DALLAS COUNTY. Jointly produced to assist those seeking to improve health care in rural Alabama
 Selected Health Status Indicators DALLAS COUNTY Jointly produced to assist those seeking to improve health care in rural Alabama By The Office of Primary Care and Rural Health, Alabama Department of Public
Competency 1 Describe the role of epidemiology in public health
 The Northwest Center for Public Health Practice (NWCPHP) has developed competency-based epidemiology training materials for public health professionals in practice. Epidemiology is broadly accepted as
No. prev. doc.: 8770/08 SAN 64 Subject: EMPLOYMENT, SOCIAL POLICY, HEALTH AND CONSUMER AFFAIRS COUNCIL MEETING ON 9 AND 10 JUNE 2008
 COUNCIL OF THE EUROPEAN UNION Brussels, 22 May 2008 9636/08 SAN 87 NOTE from: Committee of Permanent Representatives (Part 1) to: Council No. prev. doc.: 8770/08 SAN 64 Subject: EMPLOYMENT, SOCIAL POLICY,
The Changing Face of American Communities: No Data, No Problem
 The Changing Face of American Communities: No Data, No Problem E. Richard Brown, PhD Director, UCLA Center for Health Policy Research Professor, UCLA School of Public Health Principal Investigator, California
Iowa School District Profiles. Central City
 Iowa School District Profiles Overview This profile describes enrollment trends, student performance, income levels, population, and other characteristics of the Central City public school district. The
Broome County Community Health Assessment 2013-2017 1 APPENDIX A
 Community Health Assessment 2013-2017 1 APPENDIX A 2 Community Health Assessment 2013-2017 Table of Contents: Appendix A A Community Report Card will be developed based on identified strengths and opportunities
University Hospital Community Health Needs Assessment FY 2014
 FY 2014 Prepared by Kathy Opromollo Executive Director of Ambulatory Care Services Newark New Jersey is the State s largest city. In striving to identify and address Newark s most pressing health care
CITY OF EAST PALO ALTO A COMMUNITY HEALTH PROFILE
 CITY OF EAST PALO ALTO A COMMUNITY HEALTH PROFILE www.gethealthysmc.org Contact us: 650-573-2398 hpp@smcgov.org HEALTH BEGINS WHERE PEOPLE LIVE Over the last century, there have been dramatic increases
Health and Social Services Needs in Whitman County. 2015 Community Needs Assessment Results General Report COMMUNITY REPORT OF RESULTS
 COMMUNITY REPORT OF RESULTS This report contains an overview of the results collected by the Health and Social Services Needs in Whitman County Survey. A description of Whitman County, the survey process,
1992 2001 Aggregate data available; release of county or case-based data requires approval by the DHMH Institutional Review Board
 50 Table 2.4 Maryland Cancer-Related base Summary: bases That Can Be Used for Cancer Surveillance base/system and/or of MD Cancer Registry Administration, Center for Cancer Surveillance and Control 410-767-5521
The Health of Riverside County 2 A Community Health Profile
 The Health of A Community Health Profile The Health of 2 A Community Health Profile The Health of 3 A Community Health Profile TABLE OF CONTENTS Executive Summary.. 3 Acknowledgements.. 5 Introduction...
Indicator 9: Pneumoconiosis Hospitalizations
 Indicator 9: Hospitalizations Significance i Pneumoconioses are lung diseases caused by dust exposure and nearly all are attributable to occupational exposures. Common types include silicosis, asbestosis,
Education: It Matters More to Health than Ever Before
 ISSUE BRIEF Education: It Matters More to Health than Ever Before Americans with fewer years of education have poorer health and shorter lives, and that has never been more true than today. In fact, since
Section VIII. Community Priorities & Action Plans
 Section VIII. Community Priorities & Action Plans Conclusions Common themes across each community health assessment existed after thorough review of the data and community opinion survey. 1. Chronic diseases
Georgia Statewide County Health Rankings
 Georgia Statewide County Health Rankings Atlanta Regional Commission Regional Snapshot: June 2013 For more information contact: mcarnathan@atlantaregional.com Source: HRSA Area Resource File, 2011-2012,
Sociology Course of Study
 UNIT ONE: How do sociologists study the world? (January February) 1. The Sociological Perspective 2. The Emergence of Scientific 3. Use of the Scientific Method 4. Difficulties of Sociological Research
PHRUC 2015: County Health Rankings Assignment Due Friday, February 13, 2015 by 4:00 pm, via the Learn@UW Dropbox
 PHRUC 2015: County Health Rankings Assignment Due Friday, February 13, 2015 by 4:00 pm, via the Learn@UW Dropbox Introduction In this assignment, you ll explore publicly available data (via the County
Race Matters. Household Asset Poverty by Race in North Carolina. Child Poverty by County
 Race Matters Children of color are more likely to grow up in both income poverty and asset poverty. This double burden creates a difficult barrier for children to overcome. As adults, children of color
PROPOSAL GRADUATE CERTIFICATE PEDIATRIC NURSE PRACTITIONER SCHOOL OF NURSING TO BE OFFERED AT PURDUE UNIVERSITY WEST LAFAYETTE CAMPUS
 Graduate Council Document 08-20a Approved by the Graduate Council on 4/17/08 PROPOSAL GRADUATE CERTIFICATE PEDIATRIC NURSE PRACTITIONER SCHOOL OF NURSING TO BE OFFERED AT PURDUE UNIVERSITY WEST LAFAYETTE
PROPOSAL GRADUATE CERTIFICATE ADVANCED PRACTICE ONCOLOGY SCHOOL OF NURSING TO BE OFFERED AT PURDUE UNIVERSITY WEST LAFAYETTE CAMPUS
 Graduate Council Document 08-20b Approved by the Graduate Council November 20, 2008 PROPOSAL GRADUATE CERTIFICATE ADVANCED PRACTICE ONCOLOGY SCHOOL OF NURSING TO BE OFFERED AT PURDUE UNIVERSITY WEST LAFAYETTE
PARENTAL UNDERSTANDINGS OF TRANSRACIAL ADOPTIONS: THE IMPACT OF RACE WITHIN FAMILIES. By: Hope Haslam-Straughan, Jayne Schooler, and Jane Hoyt-Oliver
 PARENTAL UNDERSTANDINGS OF TRANSRACIAL ADOPTIONS: THE IMPACT OF RACE WITHIN FAMILIES By: Hope Haslam-Straughan, Jayne Schooler, and Jane Hoyt-Oliver Presented at: NACSW Convention 2012 October, 2012 St.
Access Provided by your local institution at 02/06/13 5:22PM GMT
 Access Provided by your local institution at 02/06/13 5:22PM GMT brief communication Reducing Disparities in Access to Primary Care and Patient Satisfaction with Care: The Role of Health Centers Leiyu
Community Health. Status. Report
 Community Health Status Report 2014 Community Health Status Report 2014 A Description of the Health Status and Mortality Experience of Sacramento County Residents Prepared by: Helen Zheng, MPH Jake Pry,
Policy Forum. Racial and Ethnic Health Disparities in Illinois: Are There Any Solutions?
 Policy Forum I N S T I T U T E O F G O V E R N M E N T&P U B L I C A F F A I R S I N S T I T U T E O F G O V E R N M E N T&P U B L I C A F F A I R S Racial and Ethnic Health Disparities in Illinois: Are
Community Health Assessment
 Community Health Assessment of the Montachusett Public Health Network 1 TABLE OF CONTENTS Executive Summary.3 Assessment Introduction..23 PART 1 Montachusett Public Health Network Priority Areas Section
The Status of Women in Guilford County, North Carolina
 IWPR # R363 November 2012 The Status of Women in Guilford County, North Carolina Women in Guilford County, and in North Carolina as a whole, have made significant progress in the last few decades. The
Last year, The Center for Health Affairs (CHA) asked
 asked") Planning & Action February 2008 9 By Mark Salling, Ph.D., and Michele Egan Health Needs Analysis, Assessment Looks at the Region Last year, The Center for Health Affairs (CHA) asked Community Solutions
Planning & Action February 2008 9 By Mark Salling, Ph.D., and Michele Egan Health Needs Analysis, Assessment Looks at the Region Last year, The Center for Health Affairs (CHA) asked Community Solutions
Public Health s Approach to Youth Marijuana Prevention
 February 2016 Public Health s Approach to Youth Marijuana Prevention HB 3400 Legislative Report PUBLIC HEALTH DIVISION Executive Summary In November 2014, Oregon voters legalized retail marijuana sales.
Assessing and Forecasting Population Health
 Assessing and Forecasting Population Health Jeroen van Meijgaard UCLA School of Public Health March 17, 2010 HEALTH FORECASTING AT UCLA Health Forecasting is a sister project of Health Impact Assessment,
Assessing the Perceptions and Usage of Substance Abuse among Teenagers in a Rural Setting
 Journal of Rural Community Psychology Vol E12 No 2 Assessing the Perceptions and Usage of Substance Abuse among Teenagers in a Rural Setting Regina Fults McMurtery Jackson State University Department of