Software and Methods for the Analysis of Affymetrix GeneChip Data. Rafael A Irizarry Department of Biostatistics Johns Hopkins University
|
|
|
- August Sparks
- 8 years ago
- Views:
Transcription
1 Software and Methods for the Analysis of Affymetrix GeneChip Data Rafael A Irizarry Department of Biostatistics Johns Hopkins University

2 Outline Overview Bioconductor Project Examples 1: Gene Annotation Example 2: Preprocessing Affymetrix Array Data

3 Contact Information Personal webpage Department webpage Bioinformatics Program

4 Biological question Differentially expressed genes Sample class prediction etc. Experimental design Microarray experiment Image analysis Preprocessing (Normalization) Estimation Testing Clustering Discrimination Biological verification and interpretation
 Estimation Testing Clustering")
5 Bioconductor Bioconductor is an open source and open development software project for the analysis of biomedical and genomic data. The project was started in the Fall of 2001 and includes 23 core developers in the US, Europe, and Australia. R and the R package system are used to design and distribute software. ArrayAnalyzer: Commercial port of Bioconductor packages in S-Plus.

6 R What sorts of things is R good at? Many statistical and machine learning algorithms Good visualization capabilities Possible to write scripts that can be reused R is largely platform independent: Unix; Windows; OSX R has an active user community It s open source and free! R is a real computer language Supports many data technologies: XML, DBI, SOAP Interacts with other languages: C; Perl; Python; Java Sophisticated package creation and distribution system SPLUS is a commercial implementation of the S Language and R is an open source implementation

7 Gene Annotation Example: Metadata package hgu95av2 mappings between different gene IDs. ACCNUM X95808 GENENAME zinc finger protein 261 PMID AffyID 41046_s_at LOCUSID 9203 MAP Xq13.1 SYMBOL ZNF261 GO GO: GO: GO: many other mappings Assemble and process genomic annotation data from public repositories. Build annotation data packages or XML data documents. Associate experimental data in real time to biological metadata from web databases such as GenBank, GO, KEGG, LocusLink, and PubMed. Process and store query results: e.g., search PubMed abstracts. Generate HTML reports of analyses.

8 Preprocessing Illustrative example: Detecting differentially expressed genes

9 Affymetrix GeneChip Design 5 3 Reference sequence TGTGATGGTGCATGATGGGTCAGAAGGCCTCCGATGCGCCGATTGAGAAT GTACTACCCAGTCTTCCGGAGGCTA Perfectmatch GTACTACCCAGTGTTCCGGAGGCTA Mismatch NSB & SB NSB

10 Preprocessing Typically we want one measure of expression for each gene on each array 20K genes represented by 11 probe pairs of probe intensities (PM & MM) Obtain expression measure for each gene on each array by summarizing these pairs Background adjustment and normalization are important issues Affymetrix offers MAS 5.0 as solution

11 Software Infrastructure Experimental Data Annotation P r o b e s Arrays Probe Intensities (CEL files) A r r a y s Covariates Covariate Information MIAME P r o b e s Properties Meta Data (CDF Packages) AffyBatch Class
 AffyBatch")
12 Why normalize? Compliments of Ben Bolstad

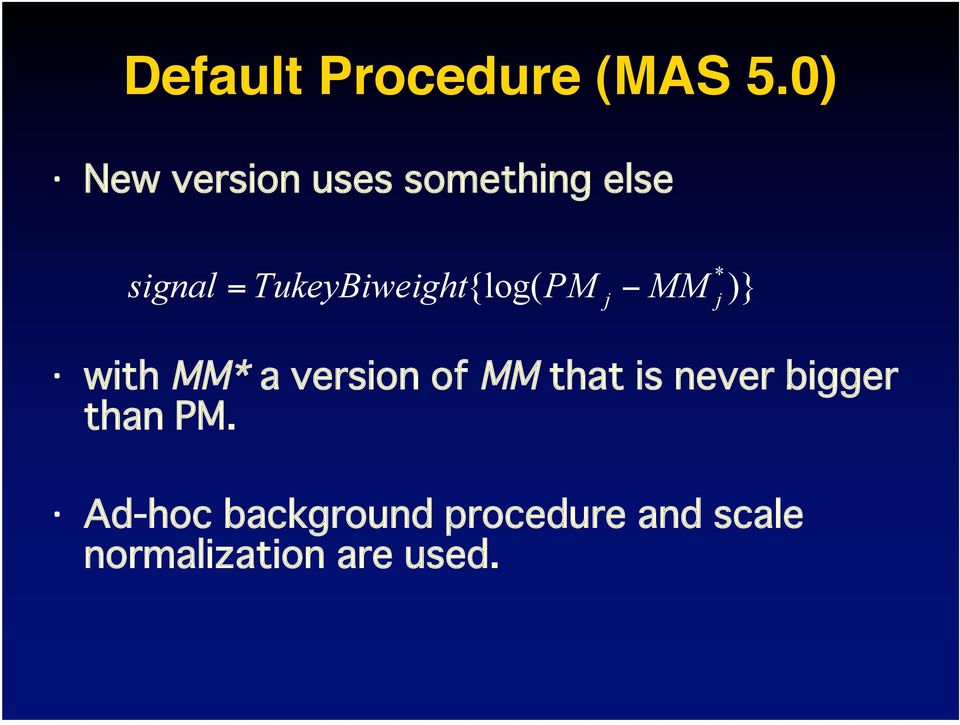
13 Default Procedure (MAS 5.0) signal * = TukeyBiweight{log( PM j MM j )}
14 Sometimes MM larger then PM
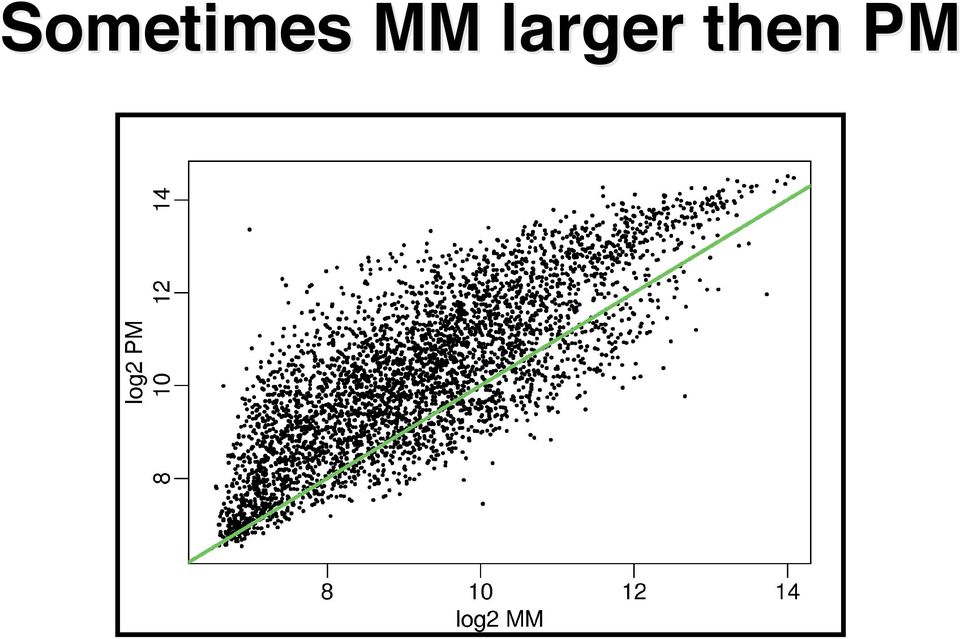
15 Sometimes MM larger then PM

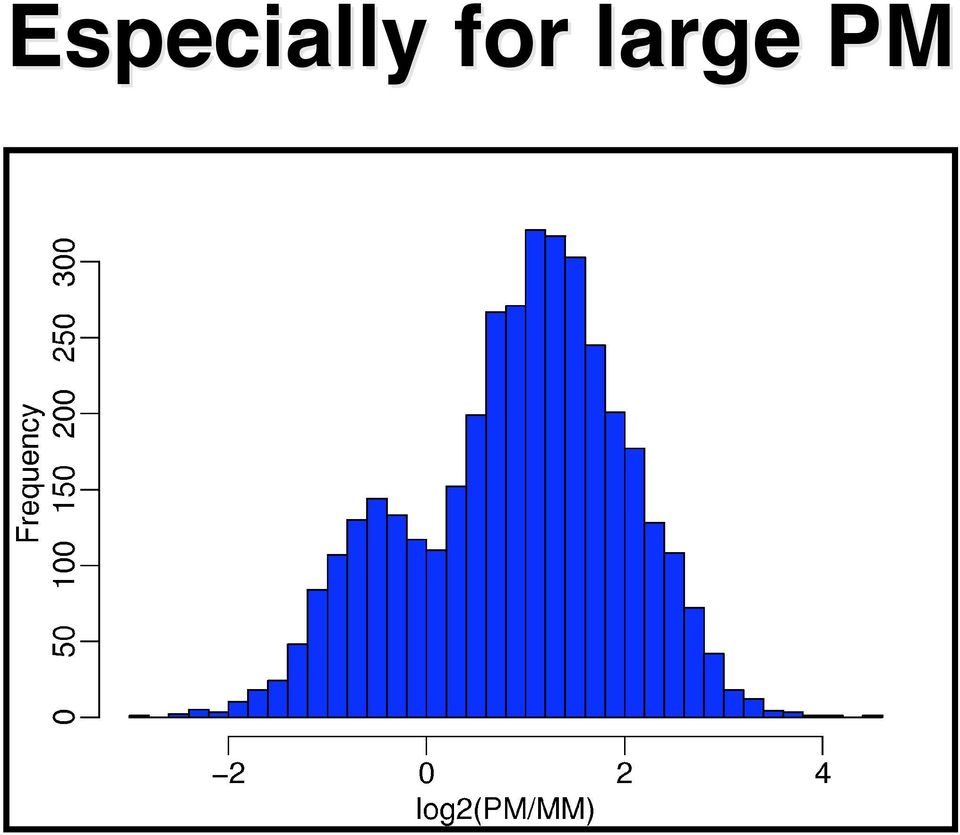
16 Especially for large PM
17 Default Procedure (MAS 5.0) signal * = TukeyBiweight{log( PM j MM j )}

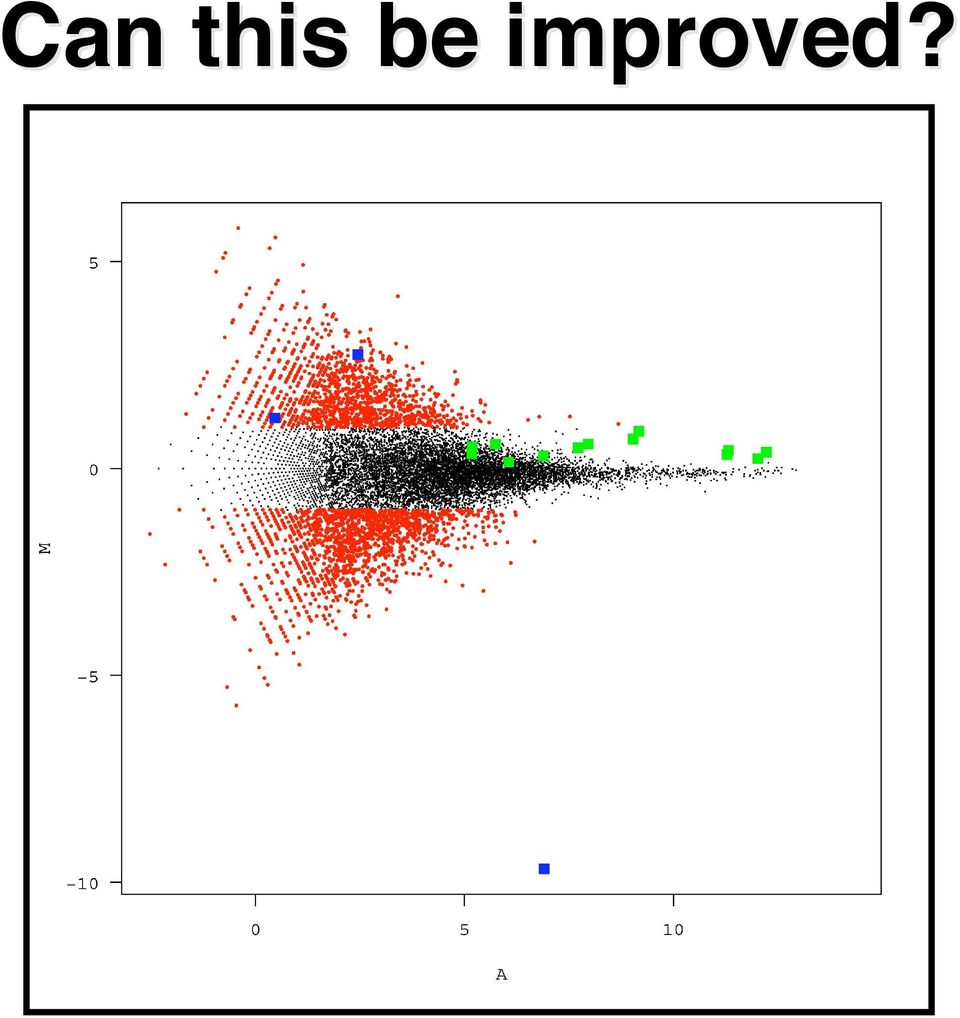
18 Can this be improved?

19 Can this be improved?
20 Why so much noise? Default algorithm seems to be inspired by the following deterministic model for background: PM = O + N + S MM = O + N PM MM = S And a multiplicative error model for signal (they take the log before averaging)

21 Deterministic model is wrong Do MM measure nonspecific binding? Look at Yeast DNA hybridized to Human Chip Look at PM, MM logscale scatter-plot R 2 is only 0.5
22 Stochastic Model (Additive background/multiplicative error) PM = O PM + N PM + S, MM = O MM + N MM log (N PM ), log (N MM ) ~ Bivariate Normal (ρ 0.7) S = exp ( s + a + ε ) s is the quantity of interest (log scale expression) E[ PM MM ] = S, but Var[ log( PM MM ) ] ~ 1/S 2 (can be very large)
23 Does it make a difference? Ranks
24 RMA: Our first attempt Ranks
25 Can RMA be improved? RMA attenuates signal slightly to achieve gains in precision method MAS 5.0 RMA slope
26 Probe Specific Effect To improve RMA we needed to account for probe-specific background effects Our first attempt was to use GC-content Others have noticed probe-specific SB effects We can extend these ideas to NSB
27 Predict NSB with sequence Fit simple linear model to yeast on human data to obtain base/position effects (Naef and Magnsaco)
28 Predict NSB with sequence Fit simple linear model to yeast on human data to obtain base/position effects Call these affinities and use them to obtain parameters for background model
29 Does it help? Accuracy of expression measures improves Precision a bit worst but not bad
30 Also explains MM thing
31 Also explains MM thing
32 Acknowledgements Ben Bolstad Leslie Cope Sandrine Dudoit Laurent Gautier Robert Gentleman Wolfgang Huber Christina Kendziorski James MacDonald Francisco Martínez-Murillo Felix Naef Marcelo Magnasco Forrest Spencer Terry Speed Jean Yang Zhijin Wu
33 Supplemental Slides
34 Does it help?
35 Other Good Uses: RMA This background adjustment is used to define an alternative algorithm: the Robust Multi-array Analysis Quantile normalization is used To combine the various probe intensities a log-scale probe level additive model is fit robustly log (PM * ) = a + b + ε 2 ij i j ij RMA = estimate of a i for chip i Default robust procedure is median polish b j represents the probe effect More details: Irizarry et al. Biostatistics (2003)
36
37 The Probe Effect
38 Other pseudo-chip images Weights Residuals Positive Residuals Negative Residuals
39 Why background correct?
40 Practical Consequences
41 Contact Information Personal webpage Department webpage Bioinformatics Program
42 Why use log? Original scale Log scale
43 Why we can not ignore NSB? The data shown is from a calibration experiment NSB causes bias (E 1 +K)/(E 2 +K) E 1 / E 2 if E 1, E 2 are large (E 1 +K)/(E 2 +K) 1 if E 1, E 2 are small We are faced with a bias/variance trade-off problem
44 Probe effect This strong probe-effect will result in very high correlation between replicates. Do not get too exited. Look at correlation or variance of relative expression (log FC) instead.
45 Alternative background adjustment Use this stochastic model Minimize the MSE: s E log s To do this we need to specify distributions for the different components Notice this is probe-specific so we need to borrow strength 2 S > 0,PM, MM * These parametric distributions were chosen to provide a closed form solution
46 Alternative background adjustment Model observed PM as the sum of a signal intensity S and a background intensity B PM = B + S, For convenience * it is assumed that S is Exponential (α), B is Normal (µ, σ 2 ), with S and B are independent Background adjusted PM are then E[S PM] Because expectation minimizes MSE, we avoid exaggerated variance Plug-in estimates of α, µ, and σ 2 are used Notice we can use only PM and make arrays half as expensive * These parametric distributions were chosen to provide a closed form solution
47 Spike-in Experiment Replicate RNA was hybridized to various arrays Some probe-sets were spiked in at different concentrations across the different arrays This gives us a way to assess precision and accuracy
48 Spikein Experiment Probeset A r r a y A B C D E F G H I J K L M N O P Q R S T
49 NSB: Practical Consequences The data shown here comes from spike-in experiments used for calibration NSB causes foldchange attenuation at low expression level (E 1 +K)/(E 2 +K) E 1 / E 2 if E 1, E 2 are large (E 1 +K)/(E 2 +K) 1 if E 1, E 2 are small
Quality Assessment of Exon and Gene Arrays
 Quality Assessment of Exon and Gene Arrays I. Introduction In this white paper we describe some quality assessment procedures that are computed from CEL files from Whole Transcript (WT) based arrays such
Frozen Robust Multi-Array Analysis and the Gene Expression Barcode
 Frozen Robust Multi-Array Analysis and the Gene Expression Barcode Matthew N. McCall October 13, 2015 Contents 1 Frozen Robust Multiarray Analysis (frma) 2 1.1 From CEL files to expression estimates...................
Row Quantile Normalisation of Microarrays
 Row Quantile Normalisation of Microarrays W. B. Langdon Departments of Mathematical Sciences and Biological Sciences University of Essex, CO4 3SQ Technical Report CES-484 ISSN: 1744-8050 23 June 2008 Abstract
Data Acquisition. DNA microarrays. The functional genomics pipeline. Experimental design affects outcome data analysis
 Data Acquisition DNA microarrays The functional genomics pipeline Experimental design affects outcome data analysis Data acquisition microarray processing Data preprocessing scaling/normalization/filtering
Analysis of gene expression data. Ulf Leser and Philippe Thomas
 Analysis of gene expression data Ulf Leser and Philippe Thomas This Lecture Protein synthesis Microarray Idea Technologies Applications Problems Quality control Normalization Analysis next week! Ulf Leser:
Microarray Data Analysis. A step by step analysis using BRB-Array Tools
 Microarray Data Analysis A step by step analysis using BRB-Array Tools 1 EXAMINATION OF DIFFERENTIAL GENE EXPRESSION (1) Objective: to find genes whose expression is changed before and after chemotherapy.
A Comparison of Normalization Methods for High Density Oligonucleotide Array Data Based on Variance and Bias
 A Comparison of Normalization Methods for High Density Oligonucleotide Array Data Based on Variance and Bias B. M. Bolstad, R. A. Irizarry 2, M. Astrand 3 and T. P. Speed 4, 5 Group in Biostatistics, University
affyplm: Fitting Probe Level Models
 affyplm: Fitting Probe Level Models Ben Bolstad bmb@bmbolstad.com http://bmbolstad.com April 16, 2015 Contents 1 Introduction 2 2 Fitting Probe Level Models 2 2.1 What is a Probe Level Model and What is
Gene Expression Analysis
 Gene Expression Analysis Jie Peng Department of Statistics University of California, Davis May 2012 RNA expression technologies High-throughput technologies to measure the expression levels of thousands
Normalization Methods for Analysis of Affymetrix GeneChip Microarray
 Microarray Data Analysis Normalization Methods for Analysis of Affymetrix GeneChip Microarray 中 央 研 究 院 生 命 科 學 圖 書 館 2008 年 教 育 訓 練 課 程 2008/01/29 1 吳 漢 銘 淡 江 大 學 數 學 系 hmwu@math.tku.edu.tw http://www.hmwu.idv.tw
Lecture 11 Data storage and LIMS solutions. Stéphane LE CROM lecrom@biologie.ens.fr
 Lecture 11 Data storage and LIMS solutions Stéphane LE CROM lecrom@biologie.ens.fr Various steps of a DNA microarray experiment Experimental steps Data analysis Experimental design set up Chips on catalog
Measuring gene expression (Microarrays) Ulf Leser
 Ulf Leser") Measuring gene expression (Microarrays) Ulf Leser This Lecture Gene expression Microarrays Idea Technologies Problems Quality control Normalization Analysis next week! 2 http://learn.genetics.utah.edu/content/molecules/transcribe/
Measuring gene expression (Microarrays) Ulf Leser This Lecture Gene expression Microarrays Idea Technologies Problems Quality control Normalization Analysis next week! 2 http://learn.genetics.utah.edu/content/molecules/transcribe/
Statistical issues in the analysis of microarray data
 Statistical issues in the analysis of microarray data Daniel Gerhard Institute of Biostatistics Leibniz University of Hannover ESNATS Summerschool, Zermatt D. Gerhard (LUH) Analysis of microarray data
Predictive Gene Signature Selection for Adjuvant Chemotherapy in Non-Small Cell Lung Cancer Patients
 Predictive Gene Signature Selection for Adjuvant Chemotherapy in Non-Small Cell Lung Cancer Patients by Li Liu A practicum report submitted to the Department of Public Health Sciences in conformity with
Analyzing microrna Data and Integrating mirna with Gene Expression Data in Partek Genomics Suite 6.6
 Analyzing microrna Data and Integrating mirna with Gene Expression Data in Partek Genomics Suite 6.6 Overview This tutorial outlines how microrna data can be analyzed within Partek Genomics Suite. Additionally,
Microarray Analysis. The Basics. Thomas Girke. December 9, 2011. Microarray Analysis Slide 1/42
 Microarray Analysis The Basics Thomas Girke December 9, 2011 Microarray Analysis Slide 1/42 Technology Challenges Data Analysis Data Depositories R and BioConductor Homework Assignment Microarray Analysis
DEVELOPMENT OF MAP/REDUCE BASED MICROARRAY ANALYSIS TOOLS
 Clemson University TigerPrints All Theses Theses 8-2013 DEVELOPMENT OF MAP/REDUCE BASED MICROARRAY ANALYSIS TOOLS Guangyu Yang Clemson University, guangyy@clemson.edu Follow this and additional works at:
The timecourse Package
 The timecourse Package Yu huan Tai October 13, 2015 ontents Institute for Human Genetics, University of alifornia, San Francisco taiy@humgen.ucsf.edu 1 Overview 1 2 Longitudinal one-sample problem 2 2.1
Gene expression analysis. Ulf Leser and Karin Zimmermann
 Gene expression analysis Ulf Leser and Karin Zimmermann Ulf Leser: Bioinformatics, Wintersemester 2010/2011 1 Last lecture What are microarrays? - Biomolecular devices measuring the transcriptome of a
Web-based Tools for the Analysis of DNA Microarrays. End of Project Report. Authors: P. Geeleher 1,2, A. Golden 3, J. Hinde 2 and D. G.
 Web-based Tools for the Analysis of DNA Microarrays End of Project Report Project 5236 Authors: P. Geeleher 1,2, A. Golden 3, J. Hinde 2 and D. G. Morris 1 1 Teagasc, Animal Reproduction Department, Mellows
GENEGOBI : VISUAL DATA ANALYSIS AID TOOLS FOR MICROARRAY DATA
 COMPSTAT 2004 Symposium c Physica-Verlag/Springer 2004 GENEGOBI : VISUAL DATA ANALYSIS AID TOOLS FOR MICROARRAY DATA Eun-kyung Lee, Dianne Cook, Eve Wurtele, Dongshin Kim, Jihong Kim, and Hogeun An Key
Importance of Statistics in creating high dimensional data
 Importance of Statistics in creating high dimensional data Hemant K. Tiwari, PhD Section on Statistical Genetics Department of Biostatistics University of Alabama at Birmingham History of Genomic Data
Molecular Genetics: Challenges for Statistical Practice. J.K. Lindsey
 Molecular Genetics: Challenges for Statistical Practice J.K. Lindsey 1. What is a Microarray? 2. Design Questions 3. Modelling Questions 4. Longitudinal Data 5. Conclusions 1. What is a microarray? A microarray
Using the Grid for the interactive workflow management in biomedicine. Andrea Schenone BIOLAB DIST University of Genova
 Using the Grid for the interactive workflow management in biomedicine Andrea Schenone BIOLAB DIST University of Genova overview background requirements solution case study results background A multilevel
GenBank, Entrez, & FASTA
 GenBank, Entrez, & FASTA Nucleotide Sequence Databases First generation GenBank is a representative example started as sort of a museum to preserve knowledge of a sequence from first discovery great repositories,
Exiqon Array Software Manual. Quick guide to data extraction from mircury LNA microrna Arrays
 Exiqon Array Software Manual Quick guide to data extraction from mircury LNA microrna Arrays March 2010 Table of contents Introduction Overview...................................................... 3 ImaGene
Processing Genome Data using Scalable Database Technology. My Background
 Johann Christoph Freytag, Ph.D. freytag@dbis.informatik.hu-berlin.de http://www.dbis.informatik.hu-berlin.de Stanford University, February 2004 PhD @ Harvard Univ. Visiting Scientist, Microsoft Res. (2002)
Basic Analysis of Microarray Data
 Basic Analysis of Microarray Data A User Guide and Tutorial Scott A. Ness, Ph.D. Co-Director, Keck-UNM Genomics Resource and Dept. of Molecular Genetics and Microbiology University of New Mexico HSC Tel.
Service courses for graduate students in degree programs other than the MS or PhD programs in Biostatistics.
 Course Catalog In order to be assured that all prerequisites are met, students must acquire a permission number from the education coordinator prior to enrolling in any Biostatistics course. Courses are
Genomics 95 (2010) 138 142. Contents lists available at ScienceDirect. Genomics. journal homepage: www.elsevier.com/locate/ygeno
 138 142. Contents lists available at ScienceDirect. Genomics. journal homepage: www.elsevier.com/locate/ygeno") Genomics 95 (2010) 138 142 Contents lists available at ScienceDirect Genomics journal homepage: www.elsevier.com/locate/ygeno Minireview Microarray data quality control improves the detection of differentially
Genomics 95 (2010) 138 142 Contents lists available at ScienceDirect Genomics journal homepage: www.elsevier.com/locate/ygeno Minireview Microarray data quality control improves the detection of differentially
Design of a Scientic Workow for the Analysis of Microarray experiments with Taverna and R
 Design of a Scientic Workow for the Analysis of Microarray experiments with Taverna and R Marcus Ertelt Proposal for a diploma thesis December 2006 - May 2007 referees: Prof. Dr. Ulf Leser, PD Dr. Wolfgang
Geostatistics Exploratory Analysis
 Instituto Superior de Estatística e Gestão de Informação Universidade Nova de Lisboa Master of Science in Geospatial Technologies Geostatistics Exploratory Analysis Carlos Alberto Felgueiras cfelgueiras@isegi.unl.pt
Normalization of RNA-Seq
 Normalization of RNA-Seq Davide Risso Modified: April 27, 2012. Compiled: April 27, 2012 1 Retrieving the data Usually, an RNA-Seq data analysis from scratch starts with a set of FASTQ files (see e.g.
Factors for success in big data science
 Factors for success in big data science Damjan Vukcevic Data Science Murdoch Childrens Research Institute 16 October 2014 Big Data Reading Group (Department of Mathematics & Statistics, University of Melbourne)
PROGRAMMING FOR BIOLOGISTS. BIOL 6297 Monday, Wednesday 10 am -12 pm
 PROGRAMMING FOR BIOLOGISTS BIOL 6297 Monday, Wednesday 10 am -12 pm Tomorrow is Ada Lovelace Day Ada Lovelace was the first person to write a computer program Today s Lecture Overview of the course Philosophy
Supplementary Figure 1: Quality Assessment of Mouse Arrays. Supplementary Figure 2: Quality Assessment of Rat Arrays
 Supplementary Figure 1: Quality Assessment of Mouse Arrays The mouse microarray data were subjected to an extensive quality-control procedure prior to conducting downstream analyses. We assessed the spread
ExploRase: Multivariate exploratory analysis and visualization for systems biology. 1 Introduction. Abstract
 ExploRase: Multivariate exploratory analysis and visualization for systems biology Michael Lawrence, Dianne Cook, Eun-Kyung Lee Abstract The large datasets being produced by high-throughput biological
SELDI-TOF Mass Spectrometry Protein Data By Huong Thi Dieu La
 SELDI-TOF Mass Spectrometry Protein Data By Huong Thi Dieu La References Alejandro Cruz-Marcelo, Rudy Guerra, Marina Vannucci, Yiting Li, Ching C. Lau, and Tsz-Kwong Man. Comparison of algorithms for pre-processing
Data Preparation and Statistical Displays
 Reservoir Modeling with GSLIB Data Preparation and Statistical Displays Data Cleaning / Quality Control Statistics as Parameters for Random Function Models Univariate Statistics Histograms and Probability
org.rn.eg.db December 16, 2015 org.rn.egaccnum is an R object that contains mappings between Entrez Gene identifiers and GenBank accession numbers.
 org.rn.eg.db December 16, 2015 org.rn.egaccnum Map Entrez Gene identifiers to GenBank Accession Numbers org.rn.egaccnum is an R object that contains mappings between Entrez Gene identifiers and GenBank
RETRIEVING SEQUENCE INFORMATION. Nucleotide sequence databases. Database search. Sequence alignment and comparison
 RETRIEVING SEQUENCE INFORMATION Nucleotide sequence databases Database search Sequence alignment and comparison Biological sequence databases Originally just a storage place for sequences. Currently the
Johns Hopkins University
 Johns Hopkins University Johns Hopkins University, Dept. of Biostatistics Working Papers Year 2004 Paper 65 Cross-study Validation and Combined Analysis of Gene Expression Microarray Data Elizabeth Garrett-Mayer
An Introduction to Machine Learning
 An Introduction to Machine Learning L5: Novelty Detection and Regression Alexander J. Smola Statistical Machine Learning Program Canberra, ACT 0200 Australia Alex.Smola@nicta.com.au Tata Institute, Pune,
Classification and Regression by randomforest
 Vol. 2/3, December 02 18 Classification and Regression by randomforest Andy Liaw and Matthew Wiener Introduction Recently there has been a lot of interest in ensemble learning methods that generate many
ECON 142 SKETCH OF SOLUTIONS FOR APPLIED EXERCISE #2
 University of California, Berkeley Prof. Ken Chay Department of Economics Fall Semester, 005 ECON 14 SKETCH OF SOLUTIONS FOR APPLIED EXERCISE # Question 1: a. Below are the scatter plots of hourly wages
How To Create A Microarray Database And Web Interface
 IMPLEMENTATION OF DATA MANAGEMENT PORTION OF MIDAR PROJECT By Joshua J. Hornsby B.S. University of Louisville, 2004 A Thesis Submitted to the Faculty of the University of Louisville Speed School of Engineering
GSR Microarrays Project Management System
 GSR Microarrays Project Management System A User s Guide GSR Microarrays Vanderbilt University MRBIII, Room 9274 465 21 st Avenue South Nashville, TN 37232 microarray@vanderbilt.edu (615) 936-3003 www.gsr.vanderbilt.edu
Cluster software and Java TreeView
 Cluster software and Java TreeView To download the software: http://bonsai.hgc.jp/~mdehoon/software/cluster/software.htm http://bonsai.hgc.jp/~mdehoon/software/cluster/manual/treeview.html Cluster 3.0
Data Analysis on the ABI PRISM 7700 Sequence Detection System: Setting Baselines and Thresholds. Overview. Data Analysis Tutorial
 Data Analysis on the ABI PRISM 7700 Sequence Detection System: Setting Baselines and Thresholds Overview In order for accuracy and precision to be optimal, the assay must be properly evaluated and a few
REGULATIONS FOR THE DEGREE OF BACHELOR OF SCIENCE IN BIOINFORMATICS (BSc[BioInf])
![REGULATIONS FOR THE DEGREE OF BACHELOR OF SCIENCE IN BIOINFORMATICS (BSc[BioInf])](/thumbs/29/13177944.jpg "REGULATIONS FOR THE DEGREE OF BACHELOR OF SCIENCE IN BIOINFORMATICS (BSc[BioInf])") 820 REGULATIONS FOR THE DEGREE OF BACHELOR OF SCIENCE IN BIOINFORMATICS (BSc[BioInf]) (See also General Regulations) BMS1 Admission to the Degree To be eligible for admission to the degree of Bachelor
820 REGULATIONS FOR THE DEGREE OF BACHELOR OF SCIENCE IN BIOINFORMATICS (BSc[BioInf]) (See also General Regulations) BMS1 Admission to the Degree To be eligible for admission to the degree of Bachelor
Gamma Distribution Fitting
 Chapter 552 Gamma Distribution Fitting Introduction This module fits the gamma probability distributions to a complete or censored set of individual or grouped data values. It outputs various statistics
Introduction to Statistical Methods for Microarray Data Analysis
 Introduction to Statistical Methods for Microarray Data Analysis T. Mary-Huard, F. Picard, S. Robin Institut National Agronomique Paris-Grignon UMR INA PG / INRA / ENGREF 518 de Biométrie 16, rue Claude
The Open2Dprot Proteomics Project for n-dimensional Protein Expression Data Analysis
 The Open2Dprot Proteomics Project for n-dimensional Protein Expression Data Analysis http://open2dprot.sourceforge.net/ Revised 2-05-2006 * (cf. 2D-LC) Introduction There is a need for integrated proteomics
Comparison of Estimation Methods for Complex Survey Data Analysis
 Comparison of Estimation Methods for Complex Survey Data Analysis Tihomir Asparouhov 1 Muthen & Muthen Bengt Muthen 2 UCLA 1 Tihomir Asparouhov, Muthen & Muthen, 3463 Stoner Ave. Los Angeles, CA 90066.
Microarray Data Analysis Workshop. Custom arrays and Probe design Probe design in a pangenomic world. Carsten Friis. MedVetNet Workshop, DTU 2008
 Microarray Data Analysis Workshop MedVetNet Workshop, DTU 2008 Custom arrays and Probe design Probe design in a pangenomic world Carsten Friis Media glna tnra GlnA TnrA C2 glnr C3 C5 C6 K GlnR C1 C4 C7
Data Integration. Lectures 16 & 17. ECS289A, WQ03, Filkov
 Data Integration Lectures 16 & 17 Lectures Outline Goals for Data Integration Homogeneous data integration time series data (Filkov et al. 2002) Heterogeneous data integration microarray + sequence microarray
200631 - ADO - Omics Data Analysis
 Coordinating unit: Teaching unit: Academic year: Degree: ECTS credits: 2016 200 - FME - School of Mathematics and Statistics 1004 - UB - (ENG)Universitat de Barcelona MASTER'S DEGREE IN STATISTICS AND
Penalized Logistic Regression and Classification of Microarray Data
 Penalized Logistic Regression and Classification of Microarray Data Milan, May 2003 Anestis Antoniadis Laboratoire IMAG-LMC University Joseph Fourier Grenoble, France Penalized Logistic Regression andclassification
Protein Protein Interaction Networks
 Functional Pattern Mining from Genome Scale Protein Protein Interaction Networks Young-Rae Cho, Ph.D. Assistant Professor Department of Computer Science Baylor University it My Definition of Bioinformatics
Lecture 3: Linear methods for classification
 Lecture 3: Linear methods for classification Rafael A. Irizarry and Hector Corrada Bravo February, 2010 Today we describe four specific algorithms useful for classification problems: linear regression,
PREDA S4-classes. Francesco Ferrari October 13, 2015
 PREDA S4-classes Francesco Ferrari October 13, 2015 Abstract This document provides a description of custom S4 classes used to manage data structures for PREDA: an R package for Position RElated Data Analysis.
Linear Discrimination. Linear Discrimination. Linear Discrimination. Linearly Separable Systems Pairwise Separation. Steven J Zeil.
 Steven J Zeil Old Dominion Univ. Fall 200 Discriminant-Based Classification Linearly Separable Systems Pairwise Separation 2 Posteriors 3 Logistic Discrimination 2 Discriminant-Based Classification Likelihood-based:
Introduction To Real Time Quantitative PCR (qpcr)
") Introduction To Real Time Quantitative PCR (qpcr) SABiosciences, A QIAGEN Company www.sabiosciences.com The Seminar Topics The advantages of qpcr versus conventional PCR Work flow & applications Factors
Introduction To Real Time Quantitative PCR (qpcr) SABiosciences, A QIAGEN Company www.sabiosciences.com The Seminar Topics The advantages of qpcr versus conventional PCR Work flow & applications Factors
AGILENT S BIOINFORMATICS ANALYSIS SOFTWARE
 ACCELERATING PROGRESS IS IN OUR GENES AGILENT S BIOINFORMATICS ANALYSIS SOFTWARE GENESPRING GENE EXPRESSION (GX) MASS PROFILER PROFESSIONAL (MPP) PATHWAY ARCHITECT (PA) See Deeper. Reach Further. BIOINFORMATICS
GENE expression profiling is widely used to explore gene
 TO APPEAR IN IEEE/ACM TRANSACTIONS ON COMPUTATIONAL BIOLOGY AND BIOINFORMATICS 1 Probabilistic analysis of probe reliability in differential gene expression studies with short oligonucleotide arrays Leo
Analysis of Illumina Gene Expression Microarray Data
 Analysis of Illumina Gene Expression Microarray Data Asta Laiho, Msc. Tech. Bioinformatics research engineer The Finnish DNA Microarray Centre Turku Centre for Biotechnology, Finland The Finnish DNA Microarray
Pipeline Pilot Enterprise Server. Flexible Integration of Disparate Data and Applications. Capture and Deployment of Best Practices
 overview Pipeline Pilot Enterprise Server Pipeline Pilot Enterprise Server (PPES) is a powerful client-server platform that streamlines the integration and analysis of the vast quantities of data flooding
BASIC STATISTICAL METHODS FOR GENOMIC DATA ANALYSIS
 BASIC STATISTICAL METHODS FOR GENOMIC DATA ANALYSIS SEEMA JAGGI Indian Agricultural Statistics Research Institute Library Avenue, New Delhi-110 012 seema@iasri.res.in Genomics A genome is an organism s
Comparative genomic hybridization Because arrays are more than just a tool for expression analysis
 Microarray Data Analysis Workshop MedVetNet Workshop, DTU 2008 Comparative genomic hybridization Because arrays are more than just a tool for expression analysis Carsten Friis ( with several slides from
A Primer of Genome Science THIRD
 A Primer of Genome Science THIRD EDITION GREG GIBSON-SPENCER V. MUSE North Carolina State University Sinauer Associates, Inc. Publishers Sunderland, Massachusetts USA Contents Preface xi 1 Genome Projects:
Outline. Topic 4 - Analysis of Variance Approach to Regression. Partitioning Sums of Squares. Total Sum of Squares. Partitioning sums of squares
 Topic 4 - Analysis of Variance Approach to Regression Outline Partitioning sums of squares Degrees of freedom Expected mean squares General linear test - Fall 2013 R 2 and the coefficient of correlation
PPInterFinder A Web Server for Mining Human Protein Protein Interaction
 PPInterFinder A Web Server for Mining Human Protein Protein Interaction Kalpana Raja, Suresh Subramani, Jeyakumar Natarajan Data Mining and Text Mining Laboratory, Department of Bioinformatics, Bharathiar
UKB_WCSGAX: UK Biobank 500K Samples Genotyping Data Generation by the Affymetrix Research Services Laboratory. April, 2015
 UKB_WCSGAX: UK Biobank 500K Samples Genotyping Data Generation by the Affymetrix Research Services Laboratory April, 2015 1 Contents Overview... 3 Rare Variants... 3 Observation... 3 Approach... 3 ApoE
Creating a New Annotation Package using SQLForge
 Creating a New Annotation Package using SQLForge Marc Carlson, Herve Pages, Nianhua Li February 4, 2016 1 Introduction The AnnotationForge package provides a series of functions that can be used to build
Influence of GSM and UMTS on the Blood Brain Barrier in vitro additional results
 Influence of GSM and UMTS on the Blood Brain Barrier in vitro additional results Intl. Workshop on long term effects, München, 11.-12. Okt. 2007 Dr. rer. nat. Helmut Franke Klinik und Poliklinik für Neurologie
Statistics Graduate Courses
 Statistics Graduate Courses STAT 7002--Topics in Statistics-Biological/Physical/Mathematics (cr.arr.).organized study of selected topics. Subjects and earnable credit may vary from semester to semester.
Comparing Methods for Identifying Transcription Factor Target Genes
 Comparing Methods for Identifying Transcription Factor Target Genes Alena van Bömmel (R 3.3.73) Matthew Huska (R 3.3.18) Max Planck Institute for Molecular Genetics Folie 1 Transcriptional Regulation TF
Exercise with Gene Ontology - Cytoscape - BiNGO
 Exercise with Gene Ontology - Cytoscape - BiNGO This practical has material extracted from http://www.cbs.dtu.dk/chipcourse/exercises/ex_go/goexercise11.php In this exercise we will analyze microarray
NCBI resources III: GEO and ftp site. Yanbin Yin Spring 2013
 NCBI resources III: GEO and ftp site Yanbin Yin Spring 2013 1 Homework assignment 2 Search colon cancer at GEO and find a data Series and perform a GEO2R analysis Write a report (in word or ppt) to include
Forecasting in supply chains
 1 Forecasting in supply chains Role of demand forecasting Effective transportation system or supply chain design is predicated on the availability of accurate inputs to the modeling process. One of the
Time series experiments
 Time series experiments Time series experiments Why is this a separate lecture: The price of microarrays are decreasing more time series experiments are coming Often a more complex experimental design
Correlation of microarray and quantitative real-time PCR results. Elisa Wurmbach Mount Sinai School of Medicine New York
 Correlation of microarray and quantitative real-time PCR results Elisa Wurmbach Mount Sinai School of Medicine New York Microarray techniques Oligo-array: Affymetrix, Codelink, spotted oligo-arrays (60-70mers)
GeneChip Expression Analysis. Data Analysis Fundamentals
 GeneChip Expression Analysis Data Analysis Fundamentals Table of Contents Page No. Introduction 1 Chapter 1 Guidelines for Assessing Sample and Array Quality 2 Chapter 2 Statistical Algorithms Reference
InSyBio BioNets: Utmost efficiency in gene expression data and biological networks analysis
 InSyBio BioNets: Utmost efficiency in gene expression data and biological networks analysis WHITE PAPER By InSyBio Ltd Konstantinos Theofilatos Bioinformatician, PhD InSyBio Technical Sales Manager August
Lecture 4: Exact string searching algorithms. Exact string search algorithms. Definitions. Exact string searching or matching
 COSC 348: Computing for Bioinformatics Definitions A pattern (keyword) is an ordered sequence of symbols. Lecture 4: Exact string searching algorithms Lubica Benuskova http://www.cs.otago.ac.nz/cosc348/
Introduction to Pattern Recognition
 Introduction to Pattern Recognition Selim Aksoy Department of Computer Engineering Bilkent University saksoy@cs.bilkent.edu.tr CS 551, Spring 2009 CS 551, Spring 2009 c 2009, Selim Aksoy (Bilkent University)
A demonstration of the use of Datagrid testbed and services for the biomedical community
 A demonstration of the use of Datagrid testbed and services for the biomedical community Biomedical applications work package V. Breton, Y Legré (CNRS/IN2P3) R. Météry (CS) Credits : C. Blanchet, T. Contamine,
The GeWare data warehouse platform for the analysis of molecular-biological and clinical data
 The GeWare data warehouse platform for the analysis of molecular-biological and clinical data Erhard Rahm, Toralf Kirsten, Jörg Lange Dept. of Computer Sciences, University of Leipzig Interdisciplinary
Exploratory data analysis for microarray data
 Eploratory data analysis for microarray data Anja von Heydebreck Ma Planck Institute for Molecular Genetics, Dept. Computational Molecular Biology, Berlin, Germany heydebre@molgen.mpg.de Visualization
Identification of rheumatoid arthritis and osteoarthritis patients by transcriptome-based rule set generation
 Identification of rheumatoid arthritis and osterthritis patients by transcriptome-based rule set generation Bering Limited Report generated on September 19, 2014 Contents 1 Dataset summary 2 1.1 Project
Sequence Formats and Sequence Database Searches. Gloria Rendon SC11 Education June, 2011
 Sequence Formats and Sequence Database Searches Gloria Rendon SC11 Education June, 2011 Sequence A is the primary structure of a biological molecule. It is a chain of residues that form a precise linear
Introduction to transcriptome analysis using High Throughput Sequencing technologies (HTS)
") Introduction to transcriptome analysis using High Throughput Sequencing technologies (HTS) A typical RNA Seq experiment Library construction Protocol variations Fragmentation methods RNA: nebulization,
Introduction to transcriptome analysis using High Throughput Sequencing technologies (HTS) A typical RNA Seq experiment Library construction Protocol variations Fragmentation methods RNA: nebulization,
Final Project Report
 CPSC545 by Introduction to Data Mining Prof. Martin Schultz & Prof. Mark Gerstein Student Name: Yu Kor Hugo Lam Student ID : 904907866 Due Date : May 7, 2007 Introduction Final Project Report Pseudogenes
Statistical analysis of modern sequencing data quality control, modelling and interpretation
 Statistical analysis of modern sequencing data quality control, modelling and interpretation Jörg Rahnenführer Technische Universität Dortmund, Fakultät Statistik Email: rahnenfuehrer@statistik.tu-.de
Mass Spectra Alignments and their Significance
 Mass Spectra Alignments and their Significance Sebastian Böcker 1, Hans-Michael altenbach 2 1 Technische Fakultät, Universität Bielefeld 2 NRW Int l Graduate School in Bioinformatics and Genome Research,
HowTo: Querying online Data
 HowTo: Querying online Data Jeff Gentry and Robert Gentleman May 3, 2016 1 Overview This article demonstrates how you can make use of the tools that have been provided for on-line querying of data resources.
Data deluge (and it s applications) Gianluigi Zanetti. Data deluge. (and its applications) Gianluigi Zanetti
 Gianluigi Zanetti. Data deluge. (and its applications) Gianluigi Zanetti") Data deluge (and its applications) Prologue Data is becoming cheaper and cheaper to produce and store Driving mechanism is parallelism on sensors, storage, computing Data directly produced are complex
Data deluge (and its applications) Prologue Data is becoming cheaper and cheaper to produce and store Driving mechanism is parallelism on sensors, storage, computing Data directly produced are complex
Configuring Apache HTTP Server as a Reverse Proxy Server for SAS 9.2 Web Applications Deployed on BEA WebLogic Server 9.2
 Configuration Guide Configuring Apache HTTP Server as a Reverse Proxy Server for SAS 9.2 Web Applications Deployed on BEA WebLogic Server 9.2 This document describes how to configure Apache HTTP Server
Analysis of the colorectal tumor microenvironment using integrative bioinformatic tools
 MLECNIK Bernhard & BINDEA Gabriela Analysis of the colorectal tumor microenvironment using integrative bioinformatic tools INSERM U872, Jérôme Galon Team15: Integrative Cancer Immunology Cordeliers Research
Real-time PCR: Understanding C t
 APPLICATION NOTE Real-Time PCR Real-time PCR: Understanding C t Real-time PCR, also called quantitative PCR or qpcr, can provide a simple and elegant method for determining the amount of a target sequence