BOULDER CITY BYPASS TRAFFIC FORECAST MEMORANDUM
|
|
|
- Maximilian Booth
- 10 years ago
- Views:
Transcription
1 BOULDER CITY BYPASS TRAFFIC FORECAST MEMORANDUM Submitted to: The Nevada Department of Transportation Prepared for: The Regional Transportation Commission of Southern Nevada Prepared by: THE Louis Berger Group, INC. September 2012

2 TABLE OF CONTENTS Section Page No. 1. INTRODUCTION Project Description Alternatives Evaluated Forecast Horizon Year of Methodology Report Structure EXISTING TRAFFIC CONDITIONS Existing Highway System Traffic Volumes and Trends Speed and Delay Analysis License Plate Matching Survey CORRIDOR GROWTH ASSESSMENT Review of Historical Socioeconomic Growth Review of Regional (RTC) Model Forecasts Adjusted Growth Forecasts TRAFFIC ANALYSIS METHODOLOGY Traffic Model Development and Refinement Traffic Model Calibration Results Basic Assumptions Roadway Improvements Toll Sensitivity TRAFFIC FORECASTS Traffic Forecasts for Study Alternatives Level of Service Analysis Vehicle Miles of Travel Truck and Bus Traffic LIST OF FIGURES Figure Page No. 1-1 Project Location Map Average Annual Daily Traffic Counts Monthly Traffic Variations Daily Traffic Variations Hourly Traffic Variations by Direction Estimated 2012 Passenger Car Travel Times License Plate Matching Survey Operations Estimated Thru Traffic Volumes and Percentages Clark County Historical Population Trend TOC-i

3 LIST OF FIGURES (continued) 3-2 Clark County 2010 Population Geographical Distribution Boulder City Historical Population Trend Clark County Historical Employment Trend Clark County 2010 Location Quotients Las Vegas Historical Visitor Volume Trend Las Vegas Valley Historical Room Inventory and Occupancy Rates Hoover Dam Visitation Trend Study Area (RTC Region Based) Population Forecasts by Source Estimated 2018 and 2035 Toll Sensitivity Curves Volumes by Period US-93 at US Volumes by Period US-95 at Volumes by Period US-93 at Veterans Memorial Drive Volumes by Period US-93 at Nevada Way / Buchanan Boulevard Volumes by Period US-93 at Nevada Interchange No Build AM(PM) Peak Hour Traffic Volumes No Build AM(PM) Peak Hour Traffic Volumes Untolled AM(PM) Peak Hour Traffic Volumes Tolled AM(PM) Peak Hour Traffic Volumes Nevada Interchange LIST OF TABLES Table Page No. 2-1 Historical Corridor Annual Average Daily Traffic Counts Vehicle Classification Distribution at Selected Corridor Locations Distances, Travel Time, Speed Summary-Weekday and Weekend Day License Plate Matching Survey Summary Population and Household Growth Trends Key Unadjusted Socioeconomic Variables Clark County Population Forecasts by Source Key Adjusted Socioeconomic Variables Baseline Scenario Calibrated Travel Demand Model Percent Deviation Comparison Along Project Corridor Links AADT Traffic Forecasts by Alternative Mainline Bypass Level of Service Signalized Intersection Levels of Service Estimated Year 2035 Daily Vehicle Miles of Travel on US-93 and the by Alternative Between Nevada State Drive And the Nevada Interchange at SR Year 2035 Estimated Heavy Trucks APPENDIX Signalized Intersection Analysis TOC-ii

4 1. INTRODUCTION BOULDER CITY BYPASS TRAFFIC FORECAST MEMORANDUM The Regional Transportation Commission of Southern Nevada (RTC) has been charged by the Nevada State Legislature with establishing a demonstration project to develop a portion of the (BCB) as a toll road using a public-private partnership (P3) concept. The purpose of the project, for which preliminary design plans have been prepared by the Nevada Department of Transportation (NDOT) and for which a record of decision was issued in 2005, is to reduce traffic problems in the vicinity of Boulder City and to create a safer transportation corridor. Current design plans envision the BCB being constructed in two phases. Phase 1, which is under final design by NDOT, will reconstruct the short section of US-93/95 from I-515 at Foothills Drive in Henderson to US-95, providing a new Railroad Pass Interchange maintaining access to US-93 serving Downtown Boulder City and a new interchange connection to US-95. The Phase 2 tolled section would extend the BCB from US-95 easterly for approximately 12 miles, around the southern perimeter of Boulder City, to the Nevada Interchange near Hoover Dam. Traffic and revenue studies have been conducted under the auspices of the RTC for purposes of evaluating the financial feasibility of tolling Phase 2 of the. The Nevada Department of Transportation (NDOT) is conducting a re-evaluation of the 2005 FEIS to include tolling of Phase 2 of the Bypass. The purpose of this Traffic Forecast Memorandum is to provide traffic forecasts to support the environmental re-evaluation. As described in this memorandum, the methodology followed the NDOT guidelines for Traffic Forecasting with a Travel Demand Model. Most of the material presented in this memorandum comes from the RTC s Sketch Level Traffic and Revenue Study for the, August 27, 2012 prepared by CDM Smith. 1.1 Project Description Figure 1-1 depicts the project location and its relationship to the surrounding transportation system. The Phase 1 segment of the BCB is shown in red; while the tolled, Phase 2 segment is shown in blue. The proposed project is a southern bypass of Boulder City. Upon completion, it would consist of a continuous four-lane, controlled-access, divided highway bypassing the developed area of Boulder City. The Phase 1 alignment begins at the Foothills grade separation, crosses under the Boulder City Branch Railroad, and continues just south of the highway to a new interchange near the Railroad Pass Hotel and Casino. From there, the roadway will continue south and east to US 95 with a new, full-access interchange approximately 1.2 miles south of the existing US 93/95 interchange. The Phase 2 highway segment alignment continues south and east toward the Mead Substation. The alignment runs approximately 0.9 miles south of Georgia Avenue, just north of the Western Area Power Administration (WAPA) Mead Substation, and then turns northward to run parallel to the transmission corridor between the landfill and the Boulder City Rifle and Pistol Club range prior to crossing a ridge representing a western extension of the Eldorado Mountains, east of Boulder City. The highway will be developed as a limited-access, divided highway from US 95 to a redesigned, full-access Hoover Dam Bypass Nevada Interchange. The highway would tie into US 93 at the Hoover Dam Bypass Nevada Interchange. 1

5 FIGURE 1-1 PROJECT LOCATION MAP THE Louis Berger Group, INC 2

6 Except for the interchanges at the project s eastern and western termini, there are no planned intermediate access locations. However, an emergency access ramp for fire, police, and other emergency vehicles is planned at Buchanan Boulevard. Its use would be controlled, and would not be available to the general public. The total length of the BCB including Phases 1 and 2 is approximately 15 miles. For the purposes of this memorandum, the Study Area or Bypass Corridor includes: Phase 2 of the from US-95 to the SR-172 Nevada Interchange at Hoover Dam; and US-93 from US-95 to the SR-172 Nevada Interchange at Hoover Dam as the existing alternative route. 1.2 Alternatives Evaluated This memorandum addresses the following alternatives: 2011 No-Build Alternative - Existing Base Condition No-Build Alternative - Assumes that Phase 2 of the Bypass is not constructed and that traffic continues to use US-93 through Boulder City. Also assumes that Phase 1 of the Bypass will be constructed Untolled Alternative - Assumes that the Bypass is constructed but that the Bypass is not tolled. This is the same as the Build Alternative in the 2005 FEIS Tolled Alternative - Assumes that the Bypass is constructed and that an optimum toll rate is charged to motorists electing to use the Bypass. Also assumes that motorists who elect not to pay the toll will continue to use US-93 through Boulder City. For the Tolled Alternative, the volume of traffic using the Bypass is a function of the amount of the toll and therefore, a write-up describing the recommended optimum toll is included. 1.3 Forecast Horizon Year of 2035 The RTC s Travel Demand Model was used for this memorandum. However, the presently adopted and approved RTC model only provides forecasts through the year 2030 and is based on outdated population and land use as far as this study is concerned. Accordingly, the updated RTC Travel Demand Model with land use data adopted in 2011 was used for this memorandum because: It provides the best available data for projecting traffic through the year 2035; and It includes Boulder City. 1.4 Methodology As a part of this study, inventories of the corridor operating conditions were conducted including traffic counts, license plate matching surveys, and speed-delay studies. Additionally, previous reports and study materials related to the proposed BCB were also reviewed. This included the 3

7 prior sketch-level traffic and revenue analysis, and relevant sections of the Boulder City/US 93 Corridor Study, Environmental Impact Statement. In addition to the NDOT permanent count station data in the project corridor, supplemental traffic counts were conducted. This information facilitated both the calibration of the travel demand model used in the analysis and provided a base case count condition for use in the traffic analyses described below. The proposed improvements to other roadways in the Boulder City area inherent in the traffic networks of the travel demand model provided by the RTC were included in the traffic assignments. An overview of the major tasks in the methodology follows. These tasks included an extensive data collection effort, refinements to the regional travel demand model, a corridor growth assessment, and a traffic and revenue analysis to establish traffic volumes at optimum toll rates for the Tolled Alternative Data Collection The NDOT Traffic Records INformation Access (TRINA) website was the primary source for the current and historical traffic count data for the major roads in the study area, particularly US 93 and US 95. In particular, data from permanent automatic traffic recorder (ATR) count station located on US miles south of the US-95 interchange and on US miles south of Lakeshore Road were used for assessing historical traffic growth, as well as monthly, daily, and hourly traffic variations. Vehicle classification data was also collected. The data was also used for the traffic model validation process. The evaluation of the traffic and revenue potential of the Bypass required development of a traffic and operation profile on the competing, non-tolled US 93. To accomplish this, additional traffic data as noted below was collected: Seven day and 72-hour automatic traffic recorder (ATR) counts by direction and vehicle classification in 15-minute intervals for additional locations on US 93 and US 95; Travel time/speed-delay measurements on US 93 from the vicinity of Lakeshore Road to the Railroad Pass Casino by direction for peak and off-peak conditions. Multiple runs in the a.m. peak from 6:00-9:00, the midday from 10:00 a.m. - 2:00 p.m., and the p.m. peak from 4:00 7:00 p.m. were made. The runs, done with GPS equipment, were performed during an internal weekday (Tuesday) and weekend day (Sunday). The data was summarized and used to calibrate the travel demand model developed for this analysis; and Video license plate surveys with cameras set up on the west and east ends of US 93 were performed to determine the number and percent of through vehicles by passenger car and commercial vehicle categories. The US 93 video surveys were done coincident with the ATR counts mentioned above. These recordings identified license plate numbers passing each survey station. Matched license plates (captured at both survey sites) represent a through trip taken on US 93. License plates recorded at only one of the locations indicated a local trip with an origin or destination in Boulder City or the Lake Mead National Recreation Area. Compared with ATR outputs on US 93, at the same time as video recording, the number and percent of through trips were estimated. Also acquired from the RTC as part of data collection was the latest version of the RTC travel demand model, including traffic networks, trip tables, socioeconomic datasets, and transportation improvement projects. In addition to the 2010 base year model, future years 2015, 2020, 2030 and 2035 models were provided. 4

8 Finally, relevant previous reports and study materials related to the proposed BCB were reviewed. This included the prior sketch-level traffic and revenue analysis, and relevant sections of the Boulder City/US 93 Corridor Study, Environmental Impact Statement Traffic Model Refinement As part of this study, the most recent version of the RTC travel demand model was obtained. This traffic model covers Clark County, including the Boulder City area. Files obtained for the model included highway networks and trip tables for the years 2010, 2015, 2020, 2025, 2030, and 2035, as well as socioeconomic forecasts for each year by traffic analysis zone. A base year, 2011, trip table was developed through interpolation using the 2010 and 2015 socioeconomic datasets. A subarea model of the Boulder City area was created as will be described in more detail in Chapter 4. The subarea model was calibrated in the immediate project corridor to achieve the best traffic volume assignments compared to observed traffic counts and observed speeds from speed-delay studies. The traffic model network was updated to reflect the latest improvements recently completed on US 93. A toll collection concept was developed, and the BCB was coded into the network as a toll road. The network was also extended south (US 93 and US 95) to incorporate east west routes SH 68 in Arizona and SH 163 in Nevada. This provided an additional toll-free alternate route, other than US 93 through Boulder City. While not the primary alternate toll-free route, it could be used by a small set of motorists. Information was also obtained pertaining to state, regional and corridor income characteristics to aid in the development of estimated values of time for potential users of the toll facility. This is a critical model parameter used for assessing motorists willingness to pay tolls and for estimating motorists sensitivity to toll rates. Vehicle operating cost parameters were also established specific to the study corridor Corridor Growth Assessment An economic growth assessment is particularly important for a new toll facility such as the proposed BCB. The project would reduce traffic volumes through downtown Boulder City and provide improved access for through trips traveling between Las Vegas and Arizona, and between Las Vegas and the Hoover Dam. As such, analysis and validation of the projected economic activity in the County is particularly important. The socioeconomic forecast provided by the RTC was reviewed and revised as appropriate. The revised socioeconomic forecasts were then used to develop revised trip tables which were then used in the analysis Traffic and Revenue Analysis The subarea model created for the analysis was run first without the Bypass (No-Build) and then under Build, toll-free conditions to estimate the maximum demand for the Bypass. Following this, a series of traffic assignments were run at a range of toll rates for the opening and horizon years to generate toll sensitivity curves. The near optimum revenue toll rates were chosen so as to maximize revenue while retaining sufficient use of the Bypass. A comparison of tolled and toll-free volumes was made to assess the reasonableness of the capture rate of toll-free demand. 5

9 1.5 Report Structure The remainder of this report consists of four chapters. Chapter 2 presents the existing (2011) traffic conditions in the corridor and surrounding area. Chapter 3 describes the socioeconomic characteristics of the corridor. Chapter 4 provides a description of the development of the traffic forecast model, assumed roadway improvements, toll collection concept, toll sensitivity, traffic and revenue forecasts, and net toll revenue. Chapter 5 provides traffic forecasts, level of service analysis and estimates of vehicle miles of travel. 6

10 2. EXISTING TRAFFIC CONDITIONS In order to better understand existing travel patterns within the study area, a traffic data collection effort was conducted. Traffic volumes and vehicle type data was compiled for a considerable number of locations in the study area. In addition to historical counts obtained from the Nevada Department of Transportation (NDOT) and Arizona Department of Transportation (ADOT), supplementary traffic counts were performed by Silver State Data Collection, LLC (SSDC) at selected locations within the study area. A video license plate survey was performed by National Data & Surveying Services (NDSS) at two locations on US 93 to estimate the through-trip component of US 93 traffic. This was critical in that it is this component of the US 93 traffic than contains the potential users of the proposed. Extensive route reconnaissance and speed data collection were also performed on US 93 and alternative routes within the study area. This chapter describes the methods and results of the data collection effort for US 93 and other relevant facilities in the study area. The information gathered as a result of this effort was used to calibrate the base year travel demand model and to ensure that it adequately replicates current conditions within the study area. 2.1 Existing Highway System As a starting point, the major highways in the study area were identified and a detailed route reconnaissance was performed to collect key highway attribute data. The route reconnaissance provided a better understanding of the local dynamics of the roadways in the region, and also provided background information for the tolling analysis. Information on a variety of different roadways characteristics was collected for major roadways within the study area. This process was used to verify, and if necessary, update roadway link characteristics in the travel demand model. Doing so ensured that the traffic network accurately reflected current roadway characteristics. Key highway attributes were identified, such as: Posted speed limits; Number of lanes; Presence and location of turning lanes; and Location of interchanges and traffic signals. The focus of the reconnaissance was primarily on US 93, given its significance to travel within Boulder City and its potential relationship to the proposed as the primary toll-free alternative route. The proposed would facilitate traffic movement in a north-south direction between I-515, Las Vegas and the Hoover Dam, Arizona and points to the east and south. The proposed new limited access facility bypasses Boulder City to the south, an area currently served by the following major highways: US 93 provides the primary north-south connection between Las Vegas and Arizona through Boulder City. North of Veterans Memorial Drive, US 93 is a four-lane limitedaccess divided highway with a direct connection from I-515. A full diamond interchange is provided with US 95 just to the west of Boulder City. A signalized intersection is located at Veterans Memorial Drive and a partial signal (northbound direction) is located at the Railroad Pass Casino entrance. These segments are signed with posted speeds 7
 at selected locations within the study area.")
11 between 65 and 50 MPH. South of Veterans Memorial Drive, US 93 becomes a fourlane arterial with a center turning lane, with a posted speed of between 45 and 35 MPH, and provides access to local businesses and cross streets. A second signalized intersection is located at Nevada Way/Buchanan Boulevard. Two left-turn lanes are provided to facilitate southbound traffic continuing on US 93, while a dedicated right-turn lane is provided in the reverse direction. Between Nevada Way and Lakeshore Drive, US 93 continues as a four-lane arterial with a center turning lane and a posted speed limit of 45 MPH. Significant grades are located on this segment as US 93 descends into the Colorado River valley towards Lake Mead. Lakeshore Drive in this segment provides access to the Lake Mead National Recreation Area. South of Lakeshore Drive, just past the Hacienda Hotel, US 93 once again becomes a limited-access divided highway with a posted speed limit of 65 MPH. Access to Hoover Dam via SR 172 is located at Exit 2, the Nevada Interchange, just prior to crossing the Colorado River and entering Arizona. In Arizona, US 93 continues as a divided rural arterial facility, with a posted speed limit of 65 MPH, until AZ 68 and I-40 in Kingman, AZ. US 95 provides a major north-south connection between Las Vegas and California. Within the study area, US 95 is signed along I-515 and US 93 until the interchange located just north of Boulder City. At this point, US 95 continues south through Searchlight to NV 163 and intersects I-40 near Needles, CA. The roadway is primarily a four-lane divided rural arterial, with a posted speed of 75 MPH. However, areas near major intersections and developed areas are posted at 65 MPH or less. US 95 within the study area does not have any significant grades. NV 172 provides access to Hoover Dam from US 93. Running from the Nevada Interchange (Exit 2 on US 93) to Hoover Dam, NV 172 is a two lane rural arterial with steep grades and elbow turns. NV 172 provides the only access to Hoover Dam for tourists accessing U.S. Bureau of Reclamation visitor facilities. NV 163 and AZ 68 together serve as the next crossing of the Colorado River to the south, running east-west between US 95 and US 93 through Laughlin, NV and Bullhead City, AZ. NV 163 is primarily a four-lane, divided rural arterial. Due to grades of 5 to 7 percent, the posted speed limit for cars is 65 MPH and the posted speed limit for trucks is 50 MPH. Two runaway truck ramps are provided in the eastbound direction. After crossing the Colorado River, NV 163 meets AZ 68 at a signalized intersection. AZ 68 is also a four-lane divided rural arterial between Bullhead City, AZ and Golden Valley, AZ. Due to grades of 5 percent and several wide elbow turns, the posted speed limit for cars is 65 MPH and the posted speed limit for trucks is 50 MPH. Three runaway truck ramps are provided in the westbound direction. After entering Golden Valley, AZ, the roadway becomes a four-lane arterial with a posted speed limit of 55 MPH before intersecting with US 93. Nevada Way is a local roadway providing access between US 93 and downtown Boulder City. Nevada Way is a four-lane roadway with posted speeds of between 25 and 35 MPH. Except for the intersection with US 93 west of downtown Boulder City, all major intersections between Nevada Way and local streets are stop-sign controlled. Additionally, several pedestrian crossings are located in downtown Boulder City. Lakeshore Drive provides access between US 93 and the recreational facilities surrounding Lake Mead. Lakeshore Drive is owned by the National Park Service as part of the Lake Mead National Recreational Area and motorists using the roadway are charged an entrance fee. 8

12 Veterans Memorial Drive is a local two-lane roadway with a median running around Boulder City. A major signalized intersection exists Veterans Memorial Drive and US 93 just west of Boulder City. Additionally, the roadway provides access to the Boulder City Municipal Airport. Industrial Road is a two-lane local roadway running parallel to US 93 with a posted speed limit of 35 MPH. Industrial Road intersects US 93 on the west via Veterans Memorial Drive and on the east just north of Nevada Way. 2.2 Traffic Volumes and Trends Historical and current traffic volumes were used to better understand the traffic growth patterns in the region. Additionally, the traffic counts obtained as part of this study were used in the model calibration process. Traffic count data were collected from three primary sources. Historical traffic data from Automatic Traffic Recorder (ATR) stations located on US 93 and US 95 were obtained from the Nevada Department of Transportation (NDOT) website. Additionally, traffic counts conducted in 2011 by the NDOT on other significant local roadways were obtained. For locations on US 93 and other roadways in Arizona, historical traffic data was obtained from the Arizona Department of Transportation (ADOT) website. Lastly, supplementary traffic counts were performed by Silver State Data Collection, LLC (SSDC) at selected locations within the study area Annual Average Daily Traffic Volumes and Trends Figure 2-1 presents the location and annual average daily volumes of the various traffic counts obtained for the sources identified above. These include traffic counts on US 93, US 95, Nevada Way, Lakeshore Drive, and ramps at the US 93/US 95 and Nevada interchanges. The figure shows higher traffic volumes to the north of Boulder City at 42,000 vehicles per day, lowering to 11,000 vehicles per day south of the Arizona Border. At the intersection of US 93 and Nevada Way in Boulder City, traffic volumes on US 93 are 20,000 vehicles per day. The ramp counts conducted by SSDC at the two major interchanges on US 93 within the study area indicate the major directions of travel at those locations. At the interchange of US 93 and US 95, the highest volumes are on the ramps to/from the north, indicating that the majority of traffic from US 95 is headed to Las Vegas and not Boulder City. At Exit 2 on US 93, south of Lakeshore Drive, the ramp volumes indicate that the major movements are to/from the north. This indicates that the primary source of traffic for the Hoover Dam is from Boulder City and Las Vegas. These observations are relevant to the calibration of the travel demand model, to ensure that local traffic patterns are properly captured. Historical traffic volumes also indicate the local growth trends, which are relevant to the assumed traffic growth rates used in the travel demand model. Table 2-1 contains the traffic counts and the average annual growth rates for the three permanent Automatic Traffic Recorder (ATR) stations on US 93 and US 95 within the study area. Annual traffic growth on US 93, south of Lakeshore Drive remained relatively low between 2001 and 2010 due to capacity constraints and vehicle class restrictions over the Hoover Dam prior to the opening of the new Hoover Dam Bypass and Mike O Callaghan Pat Tillman Memorial Bridge in October Following the events of September 11, 2001, commercial vehicles were prohibited from crossing the Hoover Dam and new security measures were implemented for passenger cars. 9

13 Figure 2-1 AVERAGE ANNUAL DAILY TRAFFIC COUNTS 10

14 As a result, traffic volumes decreased by 6.8 percent between 2001 and The majority of this traffic diverted to the next available crossing of the Colorado River, using AZ 68/NV 163 and US 95. This is shown in the increase in traffic experienced on US 95 between 2001 and Following the opening of the new bypass and bridge, AADT volumes at this location increased 21.9 percent from 13,700 vehicle in 2010 to 16,700 vehicles in These additional vehicles represent the traffic returning from the AZ 68/NV163/US 95 routing to US 93. The experience of the last fifteen years also demonstrates that under extreme circumstances, AZ 68 and NV 163 serve as a potential alternative to US 93. Therefore, traffic volumes on US 93 south of Lakeshore Drive and on US 95 need to be taken together to represent the historical traffic growth trends for vehicle crossing of the Colorado River, until the opening of the new bypass and bridge in October As shown in Table 2-1, the average annual traffic growth at these combined locations between 2001 and 2010 is 1.2 percent per year. Additionally, given the low growth on US 93 south of Lakeshore Drive, the traffic volumes on US 93 south of US 95 primarily represent traffic growth as a result of growth within Boulder City. Between 2001 and 2010, traffic grew at an average of 0.6 percent per year at this station, with much of that growth occurring prior to It should also be noted that the recession, beginning in 2008, has also contributed to the lower traffic growth trends. TABLE 2-1 HISTORICAL CORRIDOR ANNUAL AVERAGE DAILY TRAFFIC COUNTS Annual Average Daily Traffic Volumes (000s) US 93, E of US 95 US 93, E of Lakeshore Dr. US 95, N of SR 164 Colorado River Crossings Station Station Station Stations & Year Volume AAPC (1) Volume AAPC (1) Volume AAPC (1) Volume AAPC (1) Source: Nevada Department of Transportation (1) Average Annual Percent Change. 11

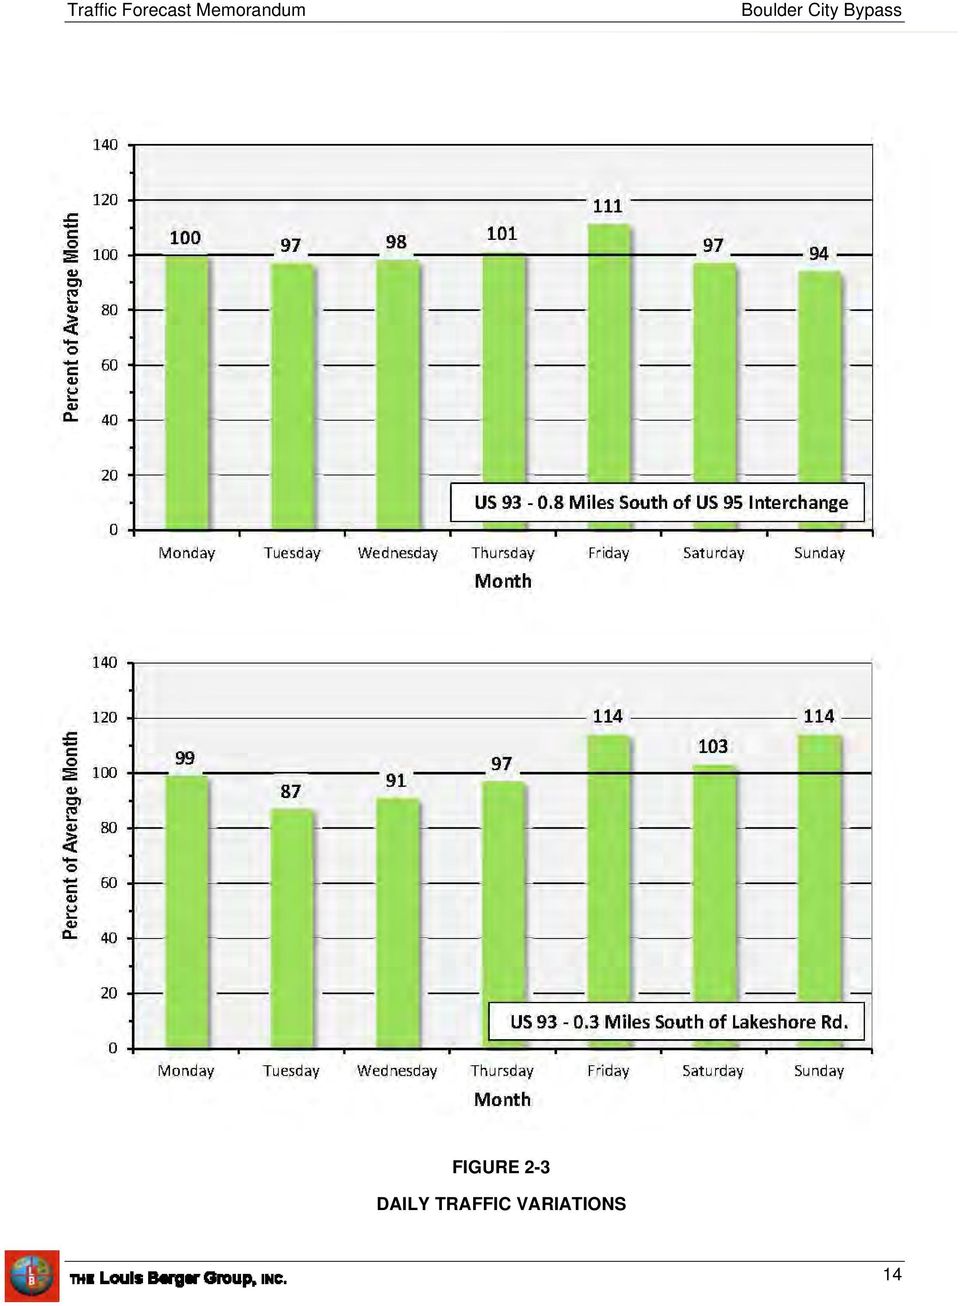
15 2.2.2 Monthly Traffic Variations Monthly traffic variations based on 2011 traffic volumes collected at the two ATR stations on US 93 are depicted in Figure 2-2. March, April, June and July represent the months of greatest traffic volume, corresponding to the months during which many people vacation. This indicates that tourism traffic contributes a significant amount of volume during these months. The winter months, December through January, represent the months of lowest traffic. Although both count stations show seasonal trends, US 93 south of Lakeshore Drive has a higher degree of seasonality. Monthly traffic volumes on US 93 south of US 95 range between 91 and 106 percent of average annual volumes. Monthly traffic volumes on US 93 south of Lakeshore Drive range between 85 and 109 percent of average annual volumes Daily Traffic Variations Daily traffic variations based on 2011 traffic volumes collected at the two ATR stations on US 93 are depicted in Figure 2-3. The two count stations exhibit two different sets of daily travel patterns. On US 93 south of US 95, a weekday commuting pattern is observable in that traffic volumes on Monday through Friday are generally higher than the weekend. Average Friday traffic is 111 percent of the weekly average, while average Sunday traffic is 94 percent of the weekly average. The high amount of traffic on Friday and relatively high amount of Sunday traffic (only 6 percent below the weekly average) is most likely due to the recreational travel patterns in the area, as demonstrated by the Lakeshore Drive count station. On US 93 south of Lakeshore Drive, a clear recreational facility travel pattern is shown. The days with the greatest amount of traffic are Friday through Sunday, with the lowest volumes on Tuesday and Wednesday. Based on these daily variations, it would seem that visitors to the area primarily arrive on Friday and leave on Sunday, corresponding to the traffic volumes that are 114 percent of the weekly average Hourly Traffic Variations The observations made based on the daily traffic variations are evident in relationship to hourly traffic volumes. Hourly traffic variations based on 2011 traffic volumes collected at the same two ATR stations on US 93 are depicted in Figure 2-4. On US 93 south of US 95, traffic patterns on Monday through Friday are very similar, with both a morning and afternoon peak. Moreover, the higher volumes northbound on Friday appear to correspond to the higher Sunday southbound volumes, indicative of recreational trips orientated to Las Vegas. On US 93 south of Lakeshore Drive, the hourly patterns of traffic seem to indicate that traffic travels southbound to Hoover Dam and associated recreational facilities in the morning and returns northbound in the afternoon. This pattern is the same for all days of the week, with greater average volumes on the weekend days (Friday to Sunday) Vehicle Classification Table 2-2 presents a summary of vehicle classification count data provided by NDOT and ADOT at select locations throughout the US 93 corridor and other significant roadways within the study area. As might be expected, passenger cars are the predominant vehicle class. On US 93, commercial vehicle traffic range between 11.1 and 8.6 percent of total vehicles. On US 95, commercial vehicle traffic represents 11.9 percent of traffic south of US 93 and 35.9 percent of traffic at the California State Line. This is due primarily to reductions in passenger car traffic instead of large increases in commercial vehicles. 12

16 FIGURE 2-2 MONTHLY TRAFFIC VARIATIONS 13

17 FIGURE 2-3 DAILY TRAFFIC VARIATIONS 14
18 FIGURE 2-4 HOURLY TRAFFIC VARIATIONS BY DIRECTION 15

19 TABLE 2 2 VEHICLE CLASSIFICATION DISTRIBUTION AT SELECTED CORRIDOR LOCATIONS Segment Description Count Station Description CV Percent Route From To Source Station Type Year PC Light Heavy Total Total CV US 93 / US 95 Wagonwheel Dr. RR Pass NVDOT Temp ,375 1,395 2,230 3,625 42, US 93 US95 Buchannan Blvd NVDOT ATR ,335 2,521 1,144 3,665 36, US 93 Buchannon Blvd Nevada Highway NVDOT Temp , ,385 2,059 20, US 93 Nevada Highway Hoover Dam / AZ/NV State Line NVDOT ATR , ,220 1,849 16, US 93 Hoover Dam / AZ/NV State Line Pierce Ferry Rd AZDOT ATR , ,150 1,497 10, US 93 Chloride Rd / Old Highway 62 Cerbat Rd AZDOT Temp ,742 US 93 Cerbat Rd SR 68 AZDOT ATR , ,403 2,057 11, US 93 SR 68 I-40 (Exit 5X) / SB 40 (0) AZDOT Temp ,358 US 95 US93/95 RR Pass SR164 (Nipton Rd.) NVDOT ATR , , US 95 SR164 (Nipton Rd.) SR163 (Laughlin Hwy.) NVDOT Temp , ,490 2,147 6, US 95 SR163 (Laughlin Hwy.) CA/NV State Line NVDOT Temp , ,114 3, SR 163 US95 Needles Hwy. NVDOT ATR , , SR 163 Needles Hwy. AZ / NV Stateline NVDOT Temp , , AZ 68 US 95 Veterans Way AZDOT Temp ,132 AZ 68 US 95 Veterans Way AZDOT Temp ,668 Nevada Highway Buchannan Blvd. US93 NVDOT Temp , , Source: Nevada Department of Transportation, Arizona Department of Transportation. 2.3 Speed and Delay Analysis Travel speeds, travel time and roadway delay for US 93 was also collected. By recording the time and distance that elapsed between points along US 93, a speed profile was calculated. By collecting travel speed, travel time and roadway delay information, roadway link characteristics in the traffic network of the travel demand model were able to be adjusted to more closely match current travel conditions, where necessary, to improve base year, 2011, calibration. Travel time runs within the project study area were conducted on Sunday, May 20, 2012 between 7:00 A.M. and 7:00 P.M. and on Tuesday, May 22, 2012 between 6:00 A.M. and 6:00 P.M. The results of this data collection effort are summarized by time period and compared to the proposed in Table 2-3. Average speed for US 93 between Exit 2 / Hoover Dam and Exit 56 / Nevada State Drive do not show large variations by direction or by day of the week. The average speed for US 93 is 40.8 MPH, which is about 8.5 MPH less than the average of the posted speed limits, with observed speeds on individual segments ranging from 15.3 MPH to 57.1 MPH. The average observed travel time is 16.6 minutes. The lowest speeds were observed between Yucca Street and Nevada Way, primarily due to the development along that segment, pedestrian walkways and the signal at US 93 and Nevada Way. Additionally, observed speeds on US 93 between US 95 and Exit 56 / Nevada State Drive are significantly lower than the posted speed limit of 65 MPH for that segment. In the northbound direction, observed average daily speeds were 42.9 MPH for a weekday and 44.7 MPH for a weekend. In the southbound direction, observed average daily speeds were 53.0 MPH for a weekday and 54.7 MPH for a weekend. These differences, especially in the northbound direction, are primarily due to the grades on US 93 as it crosses through Railroad Pass between Boulder City and Nevada Way. Estimated 2012 passenger car speeds and travel times are also summarized and compared to the proposed in Figure

20 TABLE 2 3 DISTANCES, TRAVEL TIME, SPEED SUMMARY WEEKDAY AND WEEKEND DAY PROPOSED BOULDER CITY BYPASS (BCB) (1) EXISTING US 93 (2) From To Exit 2 / Hoover Dam El Dorado Mountains El Dorado Mountains US 95 US 95 Exit 56 / Nevada State Dr. Exit 2 / Hoover Dam Lakeshore Rd. Nevada Way Industrial Rd. Total Lakeshore Rd. Nevada Way Industrial Rd. Nevada Way / Buchanan Blvd. Nevada Way / Buchanan Blvd. Yucca St. Yucca St. Veterans Memorial Dr. Veterans Memorial Dr. US 95 US 95 Exit 56 / Nevada State Dr. Total Difference (BCB Minus Existing US 93) Distance (mi.) Posted Speed (MPH) (3) 45.0 (3) 45.0 (3) Northbound/Westbound Weekday (Tuesday) AM Peak Period (4) PM Peak Period (5) Midday Period (6) Daily Avg Southbound/Eastbound Weekday (Tuesday) AM Peak Period (4) PM Peak Period (5) Midday Period (6) Daily Avg Northbound/Westbound Weekend Day (Sunday) AM Peak Period (7) PM Peak Period (8) Midday Period (9) Daily Avg Southbound/Eastbound Weekend Day (Sunday) AM Peak Period (7) PM Peak Period (8) Midday Period (9) Daily Avg (1) Distances and speeds on the proposed are as provided by Louis Berger Group, Inc., June 1, (2) Actual distance and observed speeds on US 93 and Nevada Way are as measured by GPS during May 20, 2012 data collection effort. (3) Due to construction, Posted Speed Limit at the time of data collection was 35 MPH. Posted Speed Limit prior to the construction effort was 50 MPH. (4) Weekday AM Peak Period is 6:00 A.M. to 9:00 A.M. (5) Weekday PM Peak Period is 3:00 P.M. to 6:00 P.M. (6) Weekday Midday Period is 10:00 A.M. to 2:00 P.M. (7) Weekend AM Peak Period is 7:00 A.M. to 9:00 A.M. (8) Weekend PM Peak Period is 4:00 P.M. to 7:00 P.M. (9) Weekend Midday Period is 10:00 A.M. to 3:00 P.M. 17
 70.0 70.0 70.0 70.0 45.0 (3) 45.0 (3) 45.0 (3) 35.0 35.0 45.0 55.0 65.0 49.4 20.6 Northbound/Westbound Weekday (Tuesday) AM Peak Period (4) 70.0 70.0 70.0 70.0 35.9 39.")
21 FIGURE 2-5 ESTIMATED 2012 PASSENGER CAR TRAVEL TIMES 18
22 2.4 License Plate Matching Survey In order to better understand travel patterns on US 93 within the study area and to calibrate the travel demand model, a video license plate survey was performed by National Data & Surveying Services (NDSS) at two locations on US 93. These locations were US 93 south of US 95 and US 93 south of Lakeshore Drive. The video surveys were conducted on Sunday, May 20, 2012 and on Tuesday, May 22, 2012 between 6:00 A.M. and 7:00 P.M. The purpose of the survey was to estimate the percent of traffic traveling from points west of to points east of Boulder City on US 93. This traffic represents motorists who are the greatest potential users of the proposed. This was accomplished by recording and matching license plates of vehicle traversing both survey stations. Bi-directional license plate surveys were performed at each site, which consisted of two lanes per direction. Each video system consisted of a camera unit installed on a tri-pod and secured at a safe location within clear view of approaching vehicles. The video systems were set up on the shoulder of the road for all directions with one system designated for the outside lane and one system designated for the inside lane. A total of 8 systems were installed. At each station, a video specialist monitored and adjusted the equipment throughout the collection period to account for lighting and other field conditions. A typical license plate matching survey operation is shown in Figure 2-6. After the recording was completed, the license plate videos were downloaded and manually reviewed. License plate numbers were transcribed and entered into a database. A matching matrix was then created with the outlined parameters to match license plates observed at both video locations. For this study, license plates passing both count stations within the period of one hour were considered through trips. The license plate matching matrix and a summary of passenger car/light truck and heavy truck through trips were provided. Additionally, data on vehicle registrations by state. Table 2-4 presents the results of the video survey, which showed that 75 to 80 percent of passenger car traffic are through trips. TABLE 2-4 LICENSE PLATE MATCHING SURVEY SUMMARY Weekday (Tuesday) Southbound Northbound Total Total Passenger Car Volume (1) 4,301 4,078 8,379 Matched License Plates 3,409 2,966 6,375 Percentage Weekend Day (Sunday) Southbound Northbound Total Total Passenger Car Volume (1) 6,186 5,112 11,298 Matched License Plates 4,970 3,529 8,499 Percentage Source: May 2012 survey by Nevada Data and Surveying Services. (1) Volume at US 93 S of Lakeshore Drive. 19
23 FIGURE 2-6 LICENSE PLATE MATCHING SURVEY OPERATIONS 20
24 2.4.1 Estimated Through Traffic Volumes Estimated through traffic volumes and percentages are shown in Figure 2-7. Through trip percentages were based on the observed passenger car through trip percentage of approximately 80 percent during the video survey period and an assumed 95 percent through trip percentage during nighttime hours. The through trip percentages for light trucks and heavy trucks were also based in part on traffic counts provided by NDOT at each of the video survey locations. An estimated 82.7 percent of passenger cars at Station 2 are through trips, or 12,430 passenger cars per day. This represents 38.2 percent of traffic at Station 1. Therefore, an estimated 20,000 passenger cars per day are travelling between Boulder City and Las Vegas, while an estimated 2,600 passenger cars per day are travelling between Boulder City and points east. A significant difference in through trips exists between light trucks and heavy trucks. Of light trucks, an estimated 30.3 percent of those at Station 2 are through trips. This appears to be primarily due to the significant numbers of RVs and trailers visiting the Hover Dam instead of continuing on to Arizona. By contrast, all heavy trucks are estimated to be through trips based on the traffic counts at both video stations. Overall, 13,660 vehicles per day are estimated to be through trips, representing 37.9 percent of the traffic volumes at Station 1 and 81.8 percent of the traffic volumes at Station 2. 21
25 FIGURE 2-7 ESTIMATED THRU TRAFFIC VOLUMES AND PERCENTAGES 22
26 3. CORRIDOR GROWTH ASSESSMENT Vehicle trips on the proposed would occur for various reasons, including, but not limited to recreation, commerce and to a lesser degree, commuting. Using the Bypass for the aforementioned reasons or otherwise are, to an extent, a function of determining socioeconomic variables, such as population, households, and employment since these types of variables generally explain the levels of commuting, commerce, etc. In projecting the effects of future potential traffic growth on the proposed Bypass, a sketch-level socioeconomic growth analysis for the Study Area (1) was undertaken to provide the context to develop travel demand growth projections. During this review and update, various data sources and adjustment techniques were evaluated and applied in developing the socioeconomic growth projections for the Study Area. Initially, historical trends in these variables were evaluated and served primarily for context and update/adjustment purposes. Historical and projected data were obtained from regional, statewide, and national sources, as well as supplemental on-the-ground observations and meetings with Southern Nevada public sector planners and others knowledgeable with respect to the socioeconomic forecasts and developments in the Study Area. This chapter provides a summary description of the methodology and findings related to the socioeconomic forecast update for the Study Area. For contextual purposes, the document begins with an overview of the historical socioeconomic trends in Clark County, Nevada. 3.1 Review of Historical Socioeconomic Growth Presented herein are historical socioeconomic growth trends in Clark County, which very closely match the modeled Study Area. This assessment begins by presenting counts and estimates of population, households, and employment, dating as far back as year Also, since Clark County is one of the most popular tourist destinations in the world, and the Leisure and Hospitality industry is its main economic driver, the area s economic base and trends in key tourism statistics are also discussed. Clark County contains the Cities of Las Vegas, North Las Vegas, Henderson, Mesquite, and Boulder City, as well as unincorporated urban and rural areas. The urbanized portion of Clark County, known as the Las Vegas Valley, is comprised of the Cities of Las Vegas, North Las Vegas, Henderson, and unincorporated urban areas of the County Sources of Historical Data Historical socioeconomic growth trends presented in this document draw primarily from various local/regional and federal public data sources. The historical population for Clark County was obtained from local consensus estimates, as reported by Clark County s Comprehensive Planning department ( CCCP ) and the Center for Business and Economic Research at the University of Nevada, Las Vegas ( CBER ). Local consensus estimates are based on collaborative efforts between the six local jurisdictions in Clark County (cities and unincorporated county areas) to conduct annual population estimates under the guidance of the Southern Nevada Regional Planning Coalition ( SNRPC ) (2). Estimates are produced using the housing-unit method, which employs the U.S. Postal vacancy (1) The Study Area consists of traffic analysis zones in the Southern Nevada RTC model (closely resembling Clark County). (2) Southern Nevada Regional Planning Coalition s Southern Nevada Regional Policy Plan. Amended September 28,
27 survey to derive occupied housing unit counts. The number of occupied housing units is multiplied by the persons per household (occupancy rate) figure reported by the U.S. Census Bureau to obtain a population estimate each year. Also, an annual population forecast is updated and prepared by CCCP and CBER and is funded by the Regional Transportation Commission of Southern Nevada ( RTC ) and Southern Nevada Water Authority ( SNWA ). As approved by the SNRPC, CBER uses the Regional Economic Models, Inc. ( REMI ) econometric input-output model to forecast population and other demographic and economic variables that influence the region s growth. Historical household counts were derived from the U.S. Census Bureau s Summary Social, Economic, and Housing Characteristics reports for the years 1990, 2000, and Employment and economic-base estimates for Clark County were collected from the U.S. Bureau of Labor Statistics ( BLS ). The employment estimates were from the Local Area Unemployment Statistics ( LAUS ) program. Non-farm payroll employment estimates by major industry sector is establishment-based and are from the Current Employment Statistics ( CES ) program. Location quotients were based on private sector employment data, by industry, as measured by the Quarterly Census of Employment and Wages ( QCEW ) program. Select key tourism statistics for the Las Vegas Valley include visitor volume, room inventory, and hotel occupancy rate and were from the Las Vegas Conventions and Visitors Authority ( LVCVA ). Visitor statistics on paid tours to Hoover Dam were obtained from the U.S. Bureau of Reclamation s Hoover Dam Visitor Service Office Total Population & Household Historical Growth The U.S. Census Bureau reports Nevada as the only state to maintain population growth rates in excess of 25 percent over each of the last three decades (3). The remarkable growth was largely attributable to the growth of Clark County, which comprises nearly 75 percent of the State s population. Figure 3-1 presents the population history of Clark County from 1990 to As shown, population in Clark County has hovered near two million since 2007, even after experiencing some recent population losses. As shown in Table 3-1, population in Clark County rose by over 1.14 million (or 142 percent) between 1990 and 2010, reaching 1.95 million residents, which is equivalent to growing at an average annual rate of 4.5 percent. During the same period, households increased by 428,000, to 715,000 in 2010, growing on average at a similar rate of 4.7 percent annually. Growth in both variables did slow down substantially during the inter-censal period compared to the preceding decade. (3 ) U.S. Census Population Distribution and Change: 2000 to < 01.pdf> 24
28 FIGURE 3-1 CLARK COUNTY HISTORICAL POPULATION TREND 25
29 Table 3-1 Population and Household Growth Trends Clark County and Boulder City Year Total Change Total Change Total Change Location Number Percent AAPC (1) Number Percent AAPC (1) Number Percent AAPC (1) Clark County Population 805,519 1,428,689 1,951, ,170 77% 5.9% 522, % 3.2% 1,145, % 4.5% Households 287, , , ,228 78% 6.0% 203, % 3.4% 428, % 4.7% Boulder City Population 12,986 15,551 15,886 2,565 20% 1.8% % 0.2% 2,900 22% 1.0% Households 4,998 6,385 6,492 1,387 28% 2.5% % 0.2% 1,494 30% 1.3% (1) Growth rates shown are in terms of average annual percentage change. Sources: SNRPC consensus population estimate; and U.S. Census. Figure 3-2 shows the population composition for Clark County s six local jurisdictions as of As shown, Boulder City accounted for less than one percent of the region s total population. Unlike other jurisdictions in Clark County, Boulder City does not allow gambling, and maintains a controlled growth ordinance by limiting its residential and hotel development (4). This adherence to growth control is reflected in its modest demographic growth over the preceding two decades, shown in Figure 3-3 and Table 3-1. From 1990 to 2010, the city s population increased at an average rate of about 1.0 percent per year and households grew by 1.3 percent per year. While actual growth occurred in both Boulder City and Clark County overall, population and household growth in Boulder City slowed even more over the past 10 years; both at rates of 0.2 percent per year Total Employment Historical Growth Figure 3-4 shows Clark County s employment history between 1990 and Employment trends generally matched trends in population and households since 1990 until the Great Recession, when the relative decline in employment became more pronounced. After non-farm employment peaked at 902,000 in 2008, Clark County has since lost 48,000 jobs, dropping to nearly 854,000 in The unemployment rate in 1990 was 4.9 percent and was similar to the 4.6 percent rate in By 2010, the unemployment rate tripled to 14.1 percent (5) Economic Base/Location Quotient A region s economic-base can be defined as the cluster of industries that comprise the greatest amount of employment in excess of the needs of the region. A location quotient ( LQ ) provides an indirect approach for identifying a regional economy s relative specialization and concentration of an industry (or groups of industries) compared to the U.S. economy. Assuming a region s residents have the same/similar demand for goods and services as those at the national level, if a given sector s proportional share of the local economy is equal to the share of that industry in the national economy, then the location quotient value would be 1.0. If a (4) Boulder City ordinance code Title 11: Zoning and Subdivisions, Chapter 41, Controlled Growth Management Plan. (5) Based on the U.S. BLS LAUS program. 26
30 FIGURE 3-2 CLARK COUNTY 2010 POPULATION GEOGRAPHICAL DISTRIBUTION 27
31 FIGURE 3-3 BOULDER CITY HISTORICAL POPULATION TREND 28
32 FIGURE 3-4 CLARK COUNTY HISTORICAL EMPLOYMENT TREND 29
33 proportional industry share within a local economy is higher than the national level, the LQ is greater than 1.0. In this assessment, a LQ of 1.0 (or higher) is used to designate key industry sector concentrations in Clark County. Using this metric, two of the county s eleven aggregate private industry sectors - Leisure and Hospitality, and Construction - were identified as producing more than is consumed locally, as shown in Figure 3-5. The Leisure & Hospitality industry in particular, with an LQ of close to 3.0, confirms the relatively high concentration of tourism in the regional economy. Altogether, these two industries comprised over 42 percent of Clark County s total non-farm private employment in Tourism Clark County currently attracts around 40 million visitors a year (6). This is largely driven by casino-resorts and other attractions in the Las Vegas Valley, as well as nearby destinations (e.g., Hoover Dam and Red Rock Canyon). Visitors to the Las Vegas Valley accounted for more than 92 percent of total visitors to Clark County overall in 2011, as reported by the LVCVA. Figure 3-6 presents visitor volume trends to the Las Vegas Valley from 1990 to Visitor volume grew steadily in the 1990s, jumping in 1994 and 1999 following waves of new hotel and casino-resort construction. Growth stagnated in the early 2000s before recovering in 2004, when visitor volumes started to exceed 35 million a year. After peaking in 2007, with nearly 39.2 million visitors, the number of visitors dropped drastically in 2008 and 2009 as a result of the 2007 economic downturn. Tourism began to recover in 2010, when visitor volume grew for the first time since The 2011 number was second to 2007's peak with over 38.9 million visitors for the year. Las Vegas Valley hotel/motel room inventory and occupancy rates from 1990 to 2011 are presented in Figure 3-7. The number of visitors drives hotel occupancy rates and, as shown in the exhibit, these occupancy rates have generally followed the trends in visitor volumes. Over the past two decades, occupancy was at its highest in 2007 at 94.0 percent, but dropped significantly in the three years that followed. Aside from the decrease in visitors, the worsening of occupancy levels were also precipitated by the addition of over 17,200 rooms that have come online since 2007, according to the LVCVA data. Occupancy rose for the first time since 2007 in However, it remains relatively low from a historical comparison standpoint. The LVCVA releases the results of visitor exit surveys in their annual visitor profile studies. According to their latest study, visitors in 2010 were asked what other nearby destinations they had visited or planned to visit. Respondents were most likely to say Hoover Dam (64 percent), followed by the Grand Canyon (61 percent) and Lake Mead (20 percent) (7). Notably, these are destinations along the direction of the proposed Bypass. Visitor volume trends to Hoover Dam from 2003 to 2011 are shown in Figure 3-8. The recent uptick in visitors in 2011 followed the recent completion of the Mike O'Callaghan Pat Tillman Memorial Bridge in October of Review of Regional (RTC) Model Forecasts One of the early components of the traffic and revenue analysis was the review and evaluation of potential adjustments to the socioeconomic forecast data in the regional model produced by (6) Las Vegas Convention and Visitor Authority Las Vegas Year to Date Executive Summary, (7) Las Vegas Convention and Visitor Authority. Las Vegas Visitor Profile Study
34 FIGURE 3-5 CLARK COUNTY 2010 LOCATION QUOTIENTS 31
35 FIGURE 3-6 LAS VEGAS HISTORICAL VISITOR VOLUME TREND 32
36 FIGURE 3-7 LAS VEGAS VALLEY HISTORICAL ROOM INVENTORY AND OCCUPANCY RATES 33
37 FIGURE 3-8 HOOVER DAM VISITATION TREND 34
38 the RTC in The latest socioeconomics in the RTC model, referred to by the RTC as NEWLANDUSE_INPUT contain a forecast of socioeconomic variables for the time horizon in 5-year increments. The model is based on a traffic analysis zone ( TAZ ) structure of 1,658 zones in the Las Vegas Valley (i.e., including cities of Las Vegas, North Las Vegas, and Henderson, as well as unincorporated urban areas of the county) plus Boulder City. According to the SNRPC s consensus population estimate, these jurisdictions contain about 97.3 percent of Clark County s 2010 total population. (8) The summary totals for the Study Area from the RTC model for the key variables of total population, household, and employment are shown in Table 3-2 below. Table 3-2 Key Unadjusted Socioeconomic Variables Regional Transpotation Commission Travel Demand Model Year Variable AAPC (1) Population 1,915,984 2,155,796 2,349,683 2,494,672 2,602,601 2,682, % Households 731, , , , ,997 1,002, % Total Employment 825, , ,087 1,084,891 1,161,784 1,233, % (1) Growth rates shown are in terms of average annual percentage change. Source: RTC Model, As can be seen from Table 3-2, the total area population is forecasted to increase from about 1.92 million in the base-year of 2010 to 2.68 million in 2035, which equates to a compound average annual percent change of 1.4 percent over the 25-year forecast period. The corresponding compound average annual percent change for households and employment are 1.3 percent and 1.6 percent, respectively. These annual growth rates are at 2.2 percent or higher initially (i.e., in the period), and then rather sharply decelerate afterwards to half or quarter that pace towards the end of the time horizon. Within the 40 traffic analysis zones (TAZs) comprising the Boulder City area, the growth rates in the RTC model for that (sub)area are significantly lower, i.e., one percent for population, no change for households, and 0.4 percent for employment in the period. Based on communications with the RTC modelers and the accompanying documentation, the model was deemed generally reasonable in terms of the methodology and results, but was becoming somewhat dated relative to the subsequently released socioeconomic projections data by other sources for Southern Nevada. Having combined the RTC model data and modelers input with other data sources, adjustments/updates to the model socioeconomics were made, as described in the section below. (8) Source: Southern Nevada Regional Planning Coalition Consensus Population Estimates/Clark County Demographics: < 35
39 3.3 Adjusted Growth Forecasts This section of the chapter describes the methodology applied to the update/adjustment of the model socioeconomics, as well as the resulting findings Methodology The socioeconomic forecast developed as part of the current Southern Nevada RTC model (summarized in the previous section) served as the starting-point for the socioeconomic update pertaining to both the TAZ-level as well as the aggregate geography totals. As one of the first required steps, the data from the 2011 RTC model, based on the 1,658 TAZs, had to be converted to the 1,646 TAZ system used for travel demand modeling in this study. This 1,646 TAZ structure was then carried through to the subsequent steps, which included both quantitative and qualitative data collection from other sources, including published data, as well as field observations and meetings Field Observations/ Meetings As part of this socioeconomic update effort, the Study Team engaged in field observations in the Study Area. These observations of the economic landscape, traffic volumes, and composition in the Study Area were helpful at generally confirming the patterns evident in the numerical data from the above-listed sources. Furthermore, to supplement and enhance the volume and quality of the data, various communications (i.e., in-person, via telephone, and/or ) were conducted with knowledgeable representatives from a number of area agencies to serve as both quantitative and qualitative data sources and complementary input. As part of this effort, the entities from which information was obtained included: the RTC; Las Vegas Convention & Visitors Authority; Center for Business and Economic Research at the University of Nevada-Las Vegas; Boulder City, Community Development Department; Clark County, Comprehensive Planning Department; the City of Henderson, Community Development Department; Nevada Governor s Office of Economic Development; and Nevada State Demographer s Office at the University of Nevada-Reno. One of the key themes from the outreach with the regional planners was the unified strong discounting of the previously proposed real estate developments in Mojave County, AZ. These sizable developments, e.g., Golden Valley, and White Hills, were envisioned to be material to the traffic on the proposed Bypass prior to the Great Recession. The subsequent collapse of real estate sales and prices in the Las Vegas region is thought to have made these Mojave County developments unrealistic in the foreseeable future. Thanks to the information and extensive feedback from different agencies, this study has the best locally produced up-to-date socioeconomic estimates and projections available for the Study Area Socioeconomic Forecasts Input In addition to the RTC and other entities, like the City of Henderson, that provided data matching corresponding RTC forecasts, a number of pertinent socioeconomic forecasts were obtained from additional sources, which included: the Center for Business and Economic Research at the University of Nevada; the Nevada State Demographer s Office at the University of Nevada; Woods and Poole Complete Economic and Demographic Data Source ( CEDDS ) 36
40 by Woods and Poole Economics, Inc., 2012 ( Woods & Poole ) (9) ; and Moody s Analytics ( Moody s ). Three of these sources (i.e., CBER, Woods & Poole, and Moody s) match the RTC s forecast time horizon (through year 2035) for Clark County, and are relatively newly released for year 2012, while incorporating recent Census data. These Clark County population forecasts are shown in Table 3-3, with compound average annual percent changes of 1.5 percent, 1.7 percent, and 2.8 percent, based on CBER, Woods & Poole, and Moody s, respectively. Table 3-3 Clark County Population Forecasts by Source Year Variable AAPC (1) CBER 2,112,000 2,365,000 2,545,000 2,699,000 2,848, % W & P 2,151,336 2,352,880 2,556,154 2,758,714 2,959, % Moody's 2,183,451 2,535,715 2,556,154 3,409,225 3,905, % (1) Growth rates shown are in terms of average percentage change. Sources: CBER 2012; W &P 2012; Moody's 2012 As previously mentioned, the Study Area in the RTC model does not completely match that of Clark County, with the coverage differential of less than three percent. For comparison and adjustment purposes, the forecasts from the County-level non-rtc source data were scaled down to match that of the RTC aggregate. As shown in Figure 3-9, the latest population forecasts from CBER and Woods & Poole are fairly close to RTC s, while Moody s significantly and optimistically diverges from the rest. Since RTC uses the CBER population forecast for Clark County as the benchmark for its own forecast control totals, the very latest population forecasts released by CBER in June 2012 (10) become the driving force for this model update/adjustment. The unadjusted RTC model used the previous (released in May 2011) CBER population forecasts for Clark County as its control total. The base year of 2010 was left unchanged. The latest CBER Clark County population forecasts (released in June 2012) were appropriately scaled down marginally to match the RTC model geography to serve as the new control total. The control total was then allocated among all the TAZs in order to match the proportions in the unadjusted RTC model. The other variables in the model, (i.e., total households and employment) were updated using the combination of the latest CBER-based population projections and their respective ratios relative to population. (9) Source: Woods & Poole Economics, Inc. Washington, D.C. Copyright Woods & Poole does not guarantee the accuracy of this data. The use of this data and the conclusion drawn from it are solely the responsibility of the CDM Smith Team. (10) Center for Business and Economic Research at the University of Nevada, Las Vegas. Population Forecasts: Long Term Projections for Clark County, Nevada June 18,
41 FIGURE 3-9 STUDY AREA (RTC REGION BASED) POPULATION FORECASTS BY SOURCE 38
42 In addition to the aggregate update, further attention was given to the Boulder City TAZs. These additional adjustments included lowering the RTC unadjusted future annual growth rate from 1.0 percent to 0.4 per annum, which is in-line with the projections of the Boulder City Community Development Department. Boulder City area employment growth was also approximately halved. Households in the Boulder City area zones were kept flat in the unadjusted RTC model, which was carried forward except for TAZ number According to the Boulder City Community Development Department, TAZ number 1615 is slated to gain 150 units during the forecast time horizon, of which the first 30 would occur by All these updates/adjustments to the RTC model are reflected in the Baseline case of the model s socioeconomics, as summarized for the key variables and years in Table 3-4 below Results The socioeconomic projections for the Study Area were developed for the time horizon through year A summary of the results for the Baseline scenario is provided in Table 3-4. Baseline Scenario - In the Baseline scenario, the Southern Nevada Study Area population is projected to grow at an average annual rate of about 1.5 percent through 2035 (from 2010). Over the same timeframe, the Study Area households and employment are forecast to increase, on average, by about 1.4 percent and 1.8 percent, respectively. Generally, relative to the RTC model forecasts, these adjusted results show a slower recovery in the initial years, and then an acceleration post 2020, reflective of the CBER forecasted growth pattern. These adjusted forecast terminal year (2035) socioeconomics are about 3.2 percent higher in that year than the unadjusted RTC projections, which is not an overall large differential. Table 3-4 Key Adjusted Socioeconomic Variables Baseline Scenario Year Variable AAPC (1) Population 1,915,984 2,055,776 2,301,215 2,475,758 2,624,891 2,768, % Households 731, , , , ,091 1,035, % Total Employment 825, , ,633 1,076,989 1,172,301 1,274, % (1) Growth rates shown are in terms of average annual percentage change. In light of the long-term horizon, it should also be kept in mind that these forecasts serve as guidelines, since the future cannot be predicted with (absolute) certainty, and the forecast presented herein is subject to various unpredictable circumstances and events. Therefore, any related planning of the proposed corridor must remain sufficiently flexible to adequately respond to unforeseen shocks. 39
43 3.3.5 Socioeconomic Conclusion The Study Area socioeconomics included as part of the 2011 RTC model were reviewed in the context of the comparable historical growth rates, as well as those projected by other public and private sources. Based on this socioeconomics review, it was determined that updates and adjustments to the RTC model were deemed warranted. This process led to the development of the adjusted Baseline scenario. The adjusted Baseline scenario forecasts yield compound average annual growth rates that are about 0.1 to 0.2 percent higher than the unadjusted projections, resulting in year 2035 levels that are about 3.2 percent above those of the unadjusted RTC in that year, which is not an overall large differential. 40
44 4. TRAFFIC ANALYSIS METHODOLOGY Chapter 4 presents the traffic analysis methodology conducted for the proposed Boulder City Bypass Phase 2. In addition to an overview of the travel demand modeling process, this chapter also presents information on the basic assumptions upon which the traffic forecasts are based, and a toll rate sensitivity analysis for the proposed. 4.1 Traffic Model Development and Refinement The model used for this traffic study was developed from the regional travel demand model maintained by the Regional Transportation Commission of Southern Nevada (RTC) but modified to analyze potential diversions from US 93 to the proposed BCB toll road. From the RTC model, the 2009 Regional Transportation Plan (RTP) input networks were used for this study. The networks include all project changes from several TIP amendments since 2008 ( RTP was completed and approved in 2008). The 2004 RTC model PK2 from Parsons was used for the model runs. The model requires TransCAD version 4.8 as the software platform. At the outset of the study, the most recently updated land-use data approved in 2011 for the RTP was obtained. The land use data was reviewed and updated as described in Chapter 3 to incorporate the latest growth trends in the socioeconomic/demographic forecasts of the region. The updated data set was developed for the base year 2010 and future year 2035, with intermediate forecasts for years 2015, 2020, 2025, and Socioeconomic/demographic forecasts for the recently updated 1,658 traffic analysis zone (TAZ) system were aggregated to the prior 1,646 TAZ system to make the land use data compatible with the traffic network. Year 2011 was chosen as the base year for the study because it followed the October 19, 2010 opening of the Hoover Dam Bypass Bridge, and because it was the latest year for which a full set of annual traffic data was available. With the completion of the Hoover Dam Bypass Bridge, heavy commercial vehicles that were previously restricted from the US 93/Hoover Dam routing and diverted to US 95 are now permitted to travel on US 93 through Boulder City. Year 2035 was modeled as the project horizon year. Land use data for 2011 was derived through interpolation using the 2010 and 2015 data sets. After running the full RTC model to generate new trip tables associated with the socioeconomic data revisions, a subarea model was constructed to fully capture the potential traffic diversion dynamics of the proposed project. The subarea includes Boulder City and extends the road network along both US 93 and US 95 south to SH 163 in Nevada and SH 68 in Arizona. Heavy commercial vehicles on US 93 had been diverted to the SH 68/SH 163/US 95 routing after the Hoover Dam was closed to heavy commercial vehicles following the events of September 11, This route would be the next likely toll-free alternative for heavy commercial vehicles to cross the Colorado River other than US 93 through Boulder City. New external stations were added to the subarea region as needed within the subarea model only. To generate the trips for the subarea model, the RTC model was run using 2011 land use data and a subarea origin-destination (OD) matrix was extracted from the assignment procedure. The seven time periods from the RTC model were combined to a daily OD matrix. The OD matrix estimation procedure in TransCAD was used to adjust the subarea matrix to the 2011 AADT traffic counts at 66 links throughout the subarea network. The estimated OD matrices included cars, light trucks, and heavy commercial vehicles. The estimated daily matrix was then disaggregated into four time periods for toll traffic analyses. The factors developed for 41
45 disaggregating the matrix were calculated based on existing traffic count data. Travel movements in the expanded part of the subarea network (primarily SH 68 in Arizona and SH 163 in Nevada and US 95) were not available from the RTC model. Since the traffic in this part of the model would not be affected by the proposed, the traffic loadings on these highways were developed using a fixed preloaded volume on each link based on traffic counts. The subarea OD matrices and networks were converted to another assignment software platform to use CDM Smith s toll diversion technique for testing different toll rates. The toll diversion assignment technique compares the total costs (time cost, distance cost, and toll cost) between the toll route and non-toll route. A portion of traffic is assigned to the toll route based on the toll vs. non-toll cost ratio. The RTC model was run to extract subarea trip tables for the 2035 horizon year that reflect the revised socioeconomic forecasts. The growth between each of the future years and the base year was added to the estimated OD matrix for the base year to develop future adjusted trip tables for traffic analysis. Preloaded traffic and movements between external stations were increased using an assumed annual growth rate of 2.2 percent per annum. 4.2 Traffic Model Calibration Results After calibration of the travel demand model as described above, 2011 base model output was checked against year 2011 AADT traffic counts at four NDOT traffic count locations. Table 4-1 provides a comparison between the model 2011 AADT and the actual 2011 AADT. As shown in the table, the calibrated model meets NDOT guideline consistency thresholds. TABLE 4-1 CALIBRATED TRAVEL DEMAND MODEL PERCENT DEVIATION COMPARISON ALONG PROJECT CORRIDOR LINKS Segment Field Count Source Model 2011 AADT Actual 2011 AADT Percent Deviation Meets Consistency Thresholds US-93 South of US-95 NDOT ATR ,677 36, % Yes US-93 South of Lakeshore Drive NDOT ATR ,747 16, % Yes US-95 South of US-93 NDOT ATR ,708 6, % Yes US-93 North of Nevada Way NDOT Temp. count 23,361 20, % Yes 4.3 Basic Assumptions The traffic estimates for the were predicated on the following basic assumptions: 42
46 1. Only the approximately 12-mile Phase 2 segment of the from the US 95 Interchange to the Nevada Interchange will be tolled. 2. There will be no intermediate interchanges constructed along the Phase 2 segment during the forecast period. 3. Roadway improvements included within the travel demand model networks received from the RTC were assumed to be implemented, including the programmed widening of competing routes such as US Toll rates would be as shown in this chapter. 5. No other competing facilities or additional capacity would be constructed during the project period, other than those in the RTC model provided. 6. For purposes of this analysis, cash and electronic toll collection options would be available at the mainline toll plaza. 7. Economic growth in the project study area, and associated travel demand will occur as represented in the adjusted socioeconomic/demographic data used as inputs to the RTC travel demand model used in this analysis and as reported in Chapter Motor fuel will remain in adequate supply and no national or regional emergency would arise that would abnormally restrict the use of motor vehicles. Any significant departure from these basic assumptions could materially affect tolled traffic potential on the proposed. 4.4 Roadway Improvements The traffic networks of the RTC model used in this analysis contain all future highway improvements listed in the 2009 to 2030 Regional Transportation Plan (RTP) approved in 2008, including all project changes from several Transportation Improvement Program (TIP) amendments since The traffic networks were also updated to reflect the latest improvements recently completed on US Toll Sensitivity While the entire from the vicinity of Foothills Drive in Henderson to the Nevada Interchange is approximately 15 miles, it has been assumed that only the 12-mile, Phase 2 segment between the US 95 Interchange to the north and the Nevada Interchange at the southern terminus will be subject to tolling. Additionally, along this segment, it has also been assumed that no intermediate interchanges will be constructed. Based on these assumptions, a single mainline toll plaza would be required. Toll sensitivity analyses to estimate the optimum toll rates were performed at opening year, 2018, and future year, 2035, levels. The analysis assumes that all vehicles are permitted to use the Bypass or the primary toll-free alternate route, US 93 through Boulder City, if they choose to avoid paying the Bypass toll. Excluding the toll-free traffic assignments, approximately 15 different toll rates were tested for both passenger cars and light and heavy commercial vehicle classes. The passenger car-based toll rates tested ranged from $0.25 to $2.50 in $0.25 increments, and from $2.50 to $5.00 in $0.50 increments. The results of the toll sensitivity analyses are shown in Figure 4-1. Separate curves are shown for passenger cars and commercial vehicles. Each curve shows the approximate average daily revenue potential for each of the vehicle categories at each toll rate. 43
47 In theory, the absolute optimum toll rate would be that which produces the maximum revenue. However, CDM Smith recommends a rate which is slightly below the maximum point on the curve. This will allow for some latitude in rate structure adjustments in the future, if needed to offset lower traffic growth, for example. Also, the forecasting process itself is based on a range of assumptions such as estimates of values of travel time and perceived operating costs, etc. While the technical approach and assumptions are reasonable, there is always some inherent uncertainty about the way the motoring public will behave, since decisions to use toll facilities are based on individual perceptions and values. Generally, maximum revenue potential would occur at a passenger car-based toll of approximately $2.75 in However, only slightly lower revenue would be expected at a toll of $2.25, which was selected as the optimum rate for the opening year. Proportionally higher rates would be levied for commercial vehicles. A similar analysis was performed for year In general, the maximum revenue yield would occur at a passenger car-based toll of approximately $4.00 in However, slightly lower revenue would be expected at a toll of $3.50, which was selected as the optimum rate. Again, proportionally higher rates would be levied for commercial vehicles. 44
48 FIGURE 4-1 ESTIMATED 2018 AND 2035 TOLL SENSITIVITY CURVES 45
49 5. TRAFFIC FORECASTS 5.1 Traffic Forecasts for Study Alternatives Traffic forecasts were developed for the following alternatives: 2011 No-Build Alternative - Existing Base Condition No-Build Alternative - Assumes that Phase 2 of the Bypass is not constructed and that traffic continues to use US-93 through Boulder City. Also assumes that Phase 1 of the Bypass will be constructed Untolled Alternative - Assumes that the Bypass is constructed but that the Bypass is not tolled. This is the same as the Build Alternative in the 2005 FEIS Tolled Alternative - Assumes that the Bypass is constructed and that an optimum toll rate is charged to motorists electing to use the Bypass. Also assumes that motorists who elect not to pay the toll will continue to use US-93 through Boulder City. For the Untolled Alternative, the traffic forecast assumes that the percentages of traffic identified as through trips from the license plate survey would utilize the Bypass because it provides the fastest route for traffic which does not have its origin or destination in Boulder City or the Lake Mead National Recreation Area. For the Tolled Alternative, the traffic forecast assumes that the toll would be set by the RTC at an optimum level of $3.50 for passenger cars in the year 2035, thereby attracting a volume of traffic for which the economic benefits of using the Bypass outweight the cost of the toll. Since the volume of traffic predicted to use the Bypass is a function of the amount of the toll, the Tolled Alternative forecast as presented herein is based on the optimum toll rate as described in Section 4. Table 5-1 presents forecast traffic volumes for each alternative at key locations in the Study Area. TABLE 5-1 AADT TRAFFIC FORECASTS BY ALTERNATIVE 2011 NO BUILD 2035 NO BUILD 2035 TOLL FREE 2035 OPTIMUM TOLL Phase 2 NA NA 22,879 8,979 Phase 1 NA 11,548 34,426 20,527 US-93 North of US-95 44,664 53,146 30,224 44,144 US-93 at Veterans Memorial Drive 38,677 54,597 31,712 45,624 US-93 at Nevada Way/Buchanan Blvd. 34,227 43,940 26,621 37,707 US-93 East of Nevada Way/Buchanan Blvd. 23,361 32,353 12,863 25,213 US-93 West of the Nevada Interchange 16,747 28,054 5,174 19,075 US-95 South of US-93 7,729 1,404 1,432 1,431 US-95 South of the Bypass 7,728 12,952 12,982 12,980 46
50 Figures 5-1 through 5-5 provide the projected AADT and peak period traffic volumes for all alternatives for: the proposed Bypass at US-95 Interchange; the proposed Nevada Interchange at the Bypass / US-93; the existing US-93 / US-95 Interchange; the US-93/Veterans Memorial Drive Intersection; and the US-93/Nevada Way/Buchanan Boulevard Intersection. Peak period forecasts shown in the figures are from 7:00 to 9:00 AM and 2:00 to 6:00 PM from the RTC travel demand model. Analysis of count data shows that the AM and PM peak hour traffic is approximately 5% higher than the averages during the AM and PM peak periods. Figures 5-6 through 5-9 show estimated peak hour intersection volumes for the major intersections in the Study Area under each alternative. Year 2035 traffic on the Bypass would be expected to be highest with the Untolled Alternative and, conversely, year 2035 traffic on US-93 would be expected to be lowest with the Untolled Alternative. Year 2035 traffic on US-93 through Boulder City would be highest under the No-Build Alternative. 47
51 Volumes by Period US 93 at US 95 Daily Total (Black); AM Period (Blue); PM Period (Red) Cascata Golf Course Optimum Optimum Toll Toll No Build No Build Toll Free ($3.50) No Build No Build Toll Free ($3.50) Optimum Optimum Toll Toll 2035 No Build No Build Toll Free ($3.50) No Build No Build Toll Free ($3.50) Optimum Optimum No Build No Build 2035 Toll 3, Toll (US 93) (US 93) Toll Free ($3.50) No Build No Build Toll Free ($3.50) ,818 26,166 14,730 21,980 18,873 26,919 15,495 22,736 2,185 2,622 1,487 2,229 1,889 2,697 1,564 2,306 US 93 5,991 7,182 4,035 5,978 5,179 7,387 4,245 6, US Optimum Optimum No Build No Build 2035 Toll Toll (US 93) (US 93) Toll Free ($3.50) No Build No Build Toll Free ($3.50) Optimum Optimum 22,846 26,980 15,494 22, Toll Toll 19,804 27,678 16,217 22,888 2,288 2,706 1,562 2,246 No Build No Build Toll Free ($3.50) No Build No Build Toll Free ($3.50) 1,980 2,777 1,635 2,319 6,273 7,400 4,245 6,018 5,440 7,597 4,443 6,217 3, Optimum Optimum Toll Toll No Build No Build Toll Free ($3.50) No Build No Build Toll Free ($3.50) 3, , , , US 95 AM Peak Period for the travel demand model is 7:00 A.M. to 9:00 A.M. FIGURE 5-1 PM Peak Period for the travel demand model is 2:00 P.M. to 6:00 P.M. 48
52 Volumes by Period US 95 at Daily Total (Black); AM Period (Blue); PM Period (Red) US Optimum Optimum Toll Toll No Build No Build Toll Free ($3.50) No Build No Build Toll Free ($3.50) 3, , , , Optimum Optimum Toll Toll 2035 No Build No Build Toll Free ($3.50) No Build No Build Toll Free ($3.50) Optimum Optimum No Build No Build 2035 Toll 0 5,774 5,775 5, Toll (US 93) (US 93) Toll Free ($3.50) No Build No Build Toll Free ($3.50) 0 1,586 1,586 1, Boulder 0 5,774 17,214 9, ,441 4,186 City , , Bypass 0 1,586 4,728 2, ,149 1, Boulder Optimum Optimum City No Build No Build 2035 Toll Toll Bypass (US 93) (US 93) Toll Free ($3.50) No Build No Build Toll Free ($3.50) Optimum Optimum 0 5,774 17,212 10, Toll Toll ,438 4, ,718 1,037 No Build No Build Toll Free ($3.50) No Build No Build Toll Free ($3.50) 0 0 1, ,586 4,734 2, ,148 1, ,774 5,774 5, ,586 1,586 1, Optimum Optimum Toll Toll No Build No Build Toll Free ($3.50) No Build No Build Toll Free ($3.50) 3,854 6,451 6,453 6,453 3,874 6,501 6,529 6, ,059 1,772 1,779 1,772 1,068 1,791 1,793 1,793 US 95 AM Peak Period for the travel demand model is 7:00 A.M. to 9:00 A.M. FIGURE 5-2 PM Peak Period for the travel demand model is 2:00 P.M. to 6:00 P.M. 49
53 Volumes by Period US 93 at Veterans Memorial Drive Daily Total (Black); AM Period (Blue); PM Period (Red) Veterans Memorial Drive Optimum Optimum Toll Toll No Build No Build Toll Free ($3.50) No Build No Build Toll Free ($3.50) Optimum Optimum Toll Toll No Build No Build Toll Free ($3.50) No Build No Build Toll Free ($3.50) 18,873 26,919 15,495 22,736 17,102 24,792 13,324 20,592 1,889 2,697 1,564 2,306 1,708 2,489 1,345 2,087 US 93 5,179 7,387 4,245 6,183 4,700 6,810 3,651 5,601 19,804 27,678 16,217 22,888 17,848 25,287 13,915 20,582 US 93 1,980 2,777 1,635 2,319 1,784 2,545 1,403 2,086 5,440 7,597 4,443 6,217 4,904 6,929 3,812 5, Optimum Optimum Toll Toll No Build No Build Toll Free ($3.50) No Build No Build Toll Free ($3.50) 1,965 2,402 2,322 2,322 1,821 2,184 2,190 2, Veterans Memorial Drive AM Peak Period for the travel demand model is 7:00 A.M. to 9:00 A.M. FIGURE 5-3 PM Peak Period for the travel demand model is 2:00 P.M. to 6:00 P.M. 50
54 Volumes by Period US 93 at Nevada Way / Buchanan Boulevard Daily Total (Black); AM Period (Blue); PM Period (Red) US Optimum Optimum Toll Toll No Build No Build Toll Free ($3.50) No Build No Build Toll Free ($3.50) 11,536 15,863 5,570 12,421 11,825 16,490 7,293 12,792 1,160 1, ,281 1,056 1, ,269 3,138 4,192 1,531 3,294 3,147 4,339 2,003 3, Optimum Optimum Toll Toll No Build No Build Toll Free ($3.50) No Build No Build Toll Free ($3.50) 17,073 22,919 12,075 19,144 7,118 8,307 8,189 8,214 1,703 2,327 1,210 1, US 93 4,678 6,239 3,316 5,189 1,945 2,330 2,241 2,253 17,154 21,021 14,546 18,563 9,063 9,828 9,029 9,563 Nevada Way 1,932 2,179 1,454 2,012 1,088 1, ,067 4,366 3,233 3,978 4,666 2,485 2,626 2,393 2, Optimum Optimum Toll Toll No Build No Build Toll Free ($3.50) No Build No Build Toll Free ($3.50) 667 1, ,820 5, , ,086 2, ,235 Buchanan Boulevard AM Peak Period for the travel demand model is 7:00 A.M. to 9:00 A.M. FIGURE 5-4 PM Peak Period for the travel demand model is 2:00 P.M. to 6:00 P.M. 51
55 Volumes by Period US 93 at Nevada Interchange Daily Total (Black); NO BUILD SCENARIOS No Build No Build 2,900 4, , No Build No Build No Build No Build Route 172 No Build No Build 2,900 4, , ,150 3, , No Build No Build No Build No Build ,375 14,030 6,975 11, , ,173 US 93 2,303 3,858 1,918 3, US 93 No Build No Build No Build No Build 8,375 14,030 6,975 11, , ,173 2,303 3,858 No Build No Build No Build No Build 1,918 3,225 2,150 3, , BUILD SCENARIOS Optimum Optimum 2035 Toll 2035 Toll Toll Free ($3.50) Toll Free ($3.50) 2,590 9,540 4,900 4, US ,623 1,347 1, Route 172 Optimum Optimum 2035 Toll 2035 Toll Toll Free ($3.50) Toll Free ($3.50) 2,590 9,540 4,900 4, ,623 1,347 1, Optimum Optimum 2035 Toll 2035 Toll 2035 Toll Free ($3.50) Toll Free ($3.50) 2035 Optimum Optimum 2035 Toll 2,935 1,152 3,225 8, Toll Toll Free ($3.50) Toll Free ($3.50) ,307 Boulder 11,440 4,490 11,730 11,730 City 1, ,173 1,173 Bypass 3,858 1,234 3,225 3, US 93 Optimum Optimum 2035 Toll 2035 Toll Toll Free ($3.50) Toll Free ($3.50) Optimum Optimum 11,440 4, Toll 2035 Toll 11,730 11,730 1, Toll Free ($3.50) Toll Free ($3.50) 1,173 1,173 3,858 1,234 3,225 3,225 2,935 1,152 3,225 8, ,307 AM Peak Period for the travel demand model is 7:00 A.M. to 9:00 A.M. FIGURE 5-5 PM Peak Period for the travel demand model is 2:00 P.M. to 6:00 P.M. 52
56 53
57 54
58 55
59 56
60 5.2 Level of Service Analysis Phase 2 of the is projected to carry an estimated 22,879 vehicles per day under the Untolled Alternative and an estimated 8,979 vehicles per day under the Tolled Alternative in It is proposed as a four lane access controlled freeway with a design speed of 70 mph with maximum grades of 6%. Table 5-2 shows the AM and PM peak hour northbound and southbound year 2035 traffic forecasts for the mainline Bypass. Following the Highway Capacity Manual 2010 analysis methodology, the Bypass is expected to operate at level of service A in the year 2035 under both the Tolled and Untolled Alternatives. TABLE 5-2 BOULDER CITY BYPASS MAINLINE BYPASS LEVEL OF SERVICE 2035 UNTOLLED ALTERNATIVE 2035 TOLLED ALTERNATIVE AADT 22,879 8,979 Northbound AM Peak Hour Traffic Southbound AM Peak Hour Traffic Northbound PM Peak Hour Traffic Southbound PM Peak Hour Traffic Proportion of Heavy Trucks 7% 8% Northbound Passenger Car Equivalents for Heavy Trucks Southbound Passenger Car Equivalents for Heavy Trucks Northbound AM Peak Hour 381 pcpl 136 pcpl Southbound AM Peak Hour 361 pcpl 148 pcpl Northbound PM Peak Hour 442 pcpl 209 pcpl Southbound PM Peak Hour 450 pcpl 226 pcpl Northbound Mainline Level of Service A A Southbound Mainline Level of Service A A 57
61 5.2.2 US-93 US-93 through Boulder City has two traffic signals which control the flow of traffic, one at the Veterans Memorial Drive Intersection and one at the Buchanan Boulevard / Nevada Way Intersection. The Highway Capacity Software 2010 was used to evaluate the level of service of US-93 at the signalized intersections. Table 5-3 summarizes the level of service estimates for US-93 for the Build and No-Build Alternatives. TABLE 5-3 SIGNALIZED INTERSECTION LEVELS OF SERVICE Year and Alternative US 93 and Veteran s Memorial Drive 1 US 93 and Buchanan Boulevard and Nevada Way 2 AM Peak Hour PM Peak Hour AM Peak Hour PM Peak Hour Cycle Delay Cycle Delay Cycle Delay Cycle Delay LOS LOS LOS LOS (sec) (sec) (sec) (sec) (sec) (sec) (sec) (sec) C C C D 2035 No-Build 2035 Tolled 2035 Untolled C D D E C C D D C C C D 1 Delay and level of service analysis for US 93 and Veteran s Memorial Drive are based on 10% heavy vehicles on each approach. 2 Delay and level of service analysis for US 93 and Buchanan Boulevard are based on 10% heavy vehicles on US 93 and Buchanan Boulevard for the following movements: EBLT, EBRT, SBTH, NBLT, and NBTH. Per the NDOT commercial vehicle table, Nevada Way has a heavy vehicle percentage of only 0.5%. So the heavy vehicle percentage for the westbound approach (east leg; WBLT, WBTH, and WBRT) was set at 1%. (The Highway Capacity Software 2010 only allows input of the heavy vehicle percentage to the nearest whole number.) The heavy vehicle percentages for the three movements to Nevada Way (EBTH, SBLT, and NBRT) were also set to 1%. Under the No-Build Alternative, the US-93 and Buchanan Boulevard / Nevada Way Intersection operates at level of service D at the present time but is expected to deteriorate to level of service E by Under both the Tolled and Untolled Alternatives, the US-93 and Buchanan Boulevard / Nevada Way Intersection is expected to provide level of service D or better through The US-93 and Veterans Memorial Drive intersection is expected to provide level of service C or better through
62 The intersection of US-93 and Veterans Memorial Drive is expected to operate at level of service D or better through 2035 under both the Build and No-Build Alternatives. Signalized intersection analyses of the existing Veterans Memorial Drive and Buchanan Boulevard / Nevada Way Intersections with forecasts traffic under each Alternative are provided in the Appendix. For the US-93 and Buchanan Boulevard / Nevada Way Intersection, an analysis is also provided with a minor improvement (the addition of a westbound through lane) improving the year 2035 level of service from E to D / US-95 Interchange Phase 1 of the includes directional ramps between the Phase 1 Bypass north of US-95 and US-95 south of the Bypass. When Phase 2 of the Bypass is constructed, adding ramps from US-95 to and from the Phase 2 Bypass, the Phase 2 new ramps are expected to carry a negligible volume of traffic and to operate as stop-sign controlled Nevada Interchange at SR-172 Under the No-Build Alternative, the Nevada Interchange at SR-172 would continue to operate in its present configuration. Traffic at the ramp junctions with SR-172 will continue to grow, but would not meet warrants for a traffic signal by The existing stop sign controlled ramp junctions would be expected to continue to operate with stop sign control. The Nevada Interchange at SR-172 is proposed to be reconfigured with the Build Alternative as shown in Figure With the reconfigured interchange, all US-93 traffic which is not diverted to the Bypass would pass through two at-grade intersections. US-93 northbound traffic from Arizona would exit at the Nevada Interchange and continue straight through the intersection to Boulder City. US-93 southbound traffic from Boulder City would approach the Interchange from the west and cross under the Interchange bridge to access the southbound entrance ramp. Additionally, all Hoover Dam traffic using SR-172 would pass through the ramp junction intersections to and from both US-93 and the Bypass freeway. With both the Tolled and Untolled Alternatives, much higher traffic volumes would be expected to pass through the Nevada Interchange ramp junction intersections than under the No-Build Alternative. However, traffic volumes are not predicted to be high enough at the Nevada Interchange intersections under the Build Alternatives to warrant signalization. The Nevada Interchange ramp junctions are expected to continue to operate under stop sign control with both the Build and No-Build Alternatives through Vehicle Miles of Travel Table 5-4 provides year 2035 estimated daily vehicle miles of travel for projected traffic on the and on US-93 in Boulder City. The is proposed to extend 15.0 miles from Nevada State Drive in Henderson to the Nevada Interchange at SR-172. The existing US-93 has a length of 11.4 miles from Nevada State Drive to the Nevada Interchange. Each motorist electing to use the Bypass instead of US-93 will travel an additional 3.6 miles. The Bypass, therefore, will increase regional vehicle miles of travel. (Note: As shown in Table 2-3 and Figure 2-5, the average speed on the Bypass is expected to be 70 mph compared with 40 mph on US-93 resulting in a net four minute time savings when using the Bypass despite the longer travel distance.) 59
63 TABLE 5-4 ESTIMATED YEAR 2035 DAILY VEHICLE MILES OF TRAVEL ON US-93 AND THE BOULDER CITY BYPASS BY ALTERNATIVE BETWEEN NEVADA STATE DRIVE AND THE NEVADA INTERCHANGE AT SR No-Build 2035 Untolled 2035 Tolled Distance (Miles) AADT Daily VMT AADT Daily VMT AADT Daily VMT Nevada State Drive to US ,548 40,418 34, ,491 20,527 71,845 US-95 to Nevada Interchange 11.5 N/A N/A 22, ,109 8, ,259 Subtotal 15.0 US-93 Distance (Miles) AADT Daily VMT AADT Daily VMT AADT Daily VMT Nevada State Drive to US , ,067 30,224 96,717 44, ,261 US-95 to Veterans Memorial Dr ,597 81,896 31,712 47,568 45,624 68,436 Veterans Memorial Dr. to Buchanan Blvd ,940 61,516 26,621 37,269 37,707 52,790 Buchanan Blvd. to Lakeshore Dr , ,941 12,863 48,879 25,213 95,809 Lakeshore Dr. to Nevada Int ,054 42,081 5,174 7,761 19,075 28,613 Subtotal 11.4 TOTAL 518, , ,013 60
64 61
65 As shown in Table 5-4, using projected year 2035 traffic volumes along US-93 through Boulder City, under the No-Build Alternative 518,919 vehicle miles of travel (VMT) would occur along US-93 daily in the year With the year 2035 Untolled Alternative, the highest volume of traffic would be diverted from US- 93 to the Bypass. Since the Bypass is a longer route than US-93, the total vehicle miles of travel would be expected to increase to 621,794 VMT daily in the year 2035 for all traffic using both US-93 and the Bypass from Nevada State Drive to the Nevada Interchange. With the year 2035 Tolled Alternative, a lesser volume of traffic would be diverted to the Bypass from US-93 than with the Untolled Alternative, with the total vehicle miles of travel expected to increase to 562,013 VMT daily in the year 2035 for all traffic using both US-3 and the Bypass from Nevada State Drive to the Nevada Interchange. With the Untolled Alternative, VMT would be expected to increase by 102,875 vehicles miles per day in 2035 compared to the No-Build Alternative. With the Tolled Alternative, VMT would be expected to increase by 43,094 vehicle miles per day in 2035 compared to the No-Build Alternative. 5.4 Truck and Bus Traffic Table 2-2 shows the number of light and heavy trucks counted at NDOT count stations in Approximately 1,200 daily heavy trucks were counted passing through Boulder City in Heavy trucks constituted 7.3% of the total traffic on US-93 at Lakeshore Drive but only 3.2% of the total traffic at Veterans Memorial Drive due to much heavier car traffic at Veterans Memorial Drive. Table 5-5 shows the estimated volume of heavy trucks passing through Boulder City for the various alternatives and the percentage of AADT. Light trucks constituted only 3.8% of the total traffic on U-93 at Lakeshore Drive but 7.0% of total traffic at Veterans Memorial Drive, because four times more light trucks move between Boulder City and Las Vegas than between Boulder City and Kingman. Accordingly, most light trucks have an origin or destination in Boulder City as opposed to heavy trucks which pass through with higher frequency. For US-93, the percentages of light trucks would be expected to remain the same as at present (Table 2-2) with all alternatives. 62
66 TABLE 5-5 YEAR 2035 ESTIMATED HEAVY TRUCKS DAILY HEAVY TRUCKS AT VETERANS MEMORIAL % OF AADT AT LAKESHORE DRIVE PHASE 2 BYPASS No Build , % 7.2% N/A No-Build , % 7.2% N/A Untolled Alternative 2035 US % 7.7% Bypass 1, % Tolled Alternative 2035 US-93 1, % 6.8% Bypass % For the Bypass, light trucks would only be expected to constitute approximately 3.5% of the total traffic on the Bypass based on the relatively small percentage of light trucks which presently pass through Boulder City. Traffic counts taken for this study indicate that approximately 300 buses pass through Boulder City daily. This represents approximately 2% of the total traffic at Lakeshore Drive and approximately 1% of traffic at Veterans Memorial Drive. 63
67 APPENDIX SIGNALIZED INTERSECTION ANALYSIS
68
69
70
71
72
73
74
75
76
77
78
79
80
81
82
83
Nearly 38,000 vehicles cross the Shinnecock Canal on Sunrise Highway (NYS Route 27) daily, during peak summer months.
 daily, during peak summer months.") 2. Traffic Characteristics Traffic volumes have increased in concert with population growth in the Towns of Southampton and East Hampton. The New York State Department of Transportation (NYSDOT) maintains
2. Traffic Characteristics Traffic volumes have increased in concert with population growth in the Towns of Southampton and East Hampton. The New York State Department of Transportation (NYSDOT) maintains
9988 REDWOOD AVENUE PROJECT TRAFFIC IMPACT ANALYSIS. April 24, 2015
 9988 REDWOOD AVENUE PROJECT TRAFFIC IMPACT ANALYSIS April 24, 2015 Kunzman Associates, Inc. 9988 REDWOOD AVENUE PROJECT TRAFFIC IMPACT ANALYSIS April 24, 2015 Prepared by: Bryan Crawford Carl Ballard,
ENGINEERING REPORT. College Street: Interstate 85 to Donahue Drive Traffic Signal System Feasibility Study Auburn, Alabama
 ENGINEERING REPORT College Street: Interstate 85 to Donahue Drive Traffic Signal System Feasibility Study Auburn, Alabama Prepared for: The City of Auburn Prepared by: 3644 Vann Road Suite 100 Birmingham,
Traffic Volume Counts
 Traffic Volume Counts Prepare 1. Communicate with other staff/departments 2. Review historical data trends 3. Review citizen input 4. Request traffic control Select Location 1. Select the proper location
Section 6 Traffic Analysis
 Section 6 Traffic Analysis Traffic Operations of the Preferred Network Alternative After the Preferred Network was identified and confirmed by local policy makers and area residents, detailed traffic analysis
INDOT 2000-2025 Long Range Plan
 Chapter 9 INDOT 2000-2025 Long Range Plan Highway Needs Analysis Overview The statewide transportation planning process provides for the identification of highway needs through a comprehensive process
Stone Way N Rechannelization: Before and After Study. N 34th Street to N 50th Street
 City of Seattle Department of Transportation Stone Way N Rechannelization: Before and After Study N 34th Street to N 50th Street May, 2010 INTRODUCTION Population density in Seattle is increasing within
Executive Summary. Transportation Needs CHAPTER. Existing Conditions
 CHAPTER 1 Executive Summary The City of Forest Grove Transportation System Plan (TSP) was updated to keep it consistent with recent growth trends in the city and other transportation planning efforts in
The Northwest Arkansas Travel Demand Model
 The Northwest Arkansas Travel Demand Model Creation and Results John McLarty Northwest Arkansas Regional Planning Commission Cristina Scarlat Center for Advanced Spatial Technologies What is a Travel Demand
KEEPING NEVADA CONNECTED: Future Mobility in the Silver State
 KEEPING NEVADA CONNECTED: Future Mobility in the Silver State MARCH 2014 202-466-6706 www.tripnet.org Founded in 1971, TRIP, of Washington, DC is a nonprofit organization that researches, evaluates and
Highway 138 Corridor Solutions Study Roseburg, Oregon. Technical Memorandum #4: Concept Development and Screening DRAFT
 Highway 138 Corridor Solutions Study Roseburg, Oregon Technical Memorandum #4: DRAFT Prepared for Oregon Department of Transportation, Region 3 3500 NW Stewart Parkway Roseburg, Oregon 97470 Prepared by
TH 23 Access Management Study Richmond to Paynesville
 TH 23 Access Management Study Richmond to Paynesville Prepared For: Minnesota Department of Transportation District 8 Prepared By: Short Elliott Hendrickson Inc. July 2015 Table of Contents I. Introduction...
TERMINAL 91 TRAFFIC MONITORING STUDY
 REVISED DRAFT TERMINAL 9 TRAFFIC MONITORING STUDY Prepared for: Port of Seattle Prepared by: 6544 NE 6st Street, Seattle, WA 985 ph: (26) 523-3939 fx: (26) 523-4949 NOVEMBER 22, 2 TABLE OF CONTENTS. INTRODUCTION...
Executive Summary. Literature/Community Review. Traffic Flows and Projections. Final Report Truck Route System for Miami-Dade County CORRADINO
 Executive Summary The Miami-Dade County Metropolitan Planning Organization (MPO) has prepared a Truck Route System Plan for Miami-Dade County. The MPO and its consultants have worked closely with the MPO
APPENDIX E TASK 5 TECHNICAL MEMORANDUM: TRAVEL DEMAND FORECASTING PROCESS
 APPENDIX E TASK 5 TECHNICAL MEMORANDUM: TRAVEL DEMAND FORECASTING PROCESS INTRODUCTION The purpose of this Technical Memorandum is to describe the methodologies and assumptions used in estimating travel
Overview of the Travel Demand Forecasting Methodology
 Overview of the Travel Demand Forecasting Methodology Prepared by the Central Transportation Planning Staff (CTPS) Authors: Scott A. Peterson, Manager Ian Harrington, Chief Planner March 29, 2008 1 OVERVIEW
Maryland Invests $845 Million in New Highway and Bridge Projects
 Maryland Invests $845 Million in New Highway and Bridge Projects Completing Widening of MD 404 Talbot And Caroline Counties Top Regional Priority Queen Anne s, Talbot, and Caroline Counties Widening MD
Effect on structures. Uniform settlement - no concerns. Angular distortion - causes damage due to tensile strain
 Effect on structures Uniform settlement - no concerns Angular distortion - causes damage due to tensile strain 1/500 - safe limit for no cracking of buildings 1/150 - potential structural damage 36 37
APPENDIX J TRAFFIC STUDY
 APPENDIX J TRAFFIC STUDY May 7, 2014 Ms. Leianne Humble Denise Duffy and Associates, Inc. 947 Cass Street, Suite 5 Monterey, CA 93940 Re: Traffic Study for the Heritage Oaks Memorial Park in San Jose,
TECHNIQUES FOR MANUALLY ESTIMATING ROAD USER COSTS ASSOCIATED WITH CONSTRUCTION PROJECTS
 TECHNIQUES FOR MANUALLY ESTIMATING ROAD USER COSTS ASSOCIATED WITH CONSTRUCTION PROJECTS by Ginger Daniels, P.E. Associate Research Engineer Texas Transportation Institute David R. Ellis, Ph.D. Associate
Master Transportation Plan
 Master Transportation Plan August 2010 Executive Summary EXECUTIVE SUMMARY CONTENT In January 2009, the City of Stratford initiated this Master Transportation Plan study to update and replace the 1992
Mercer County Multi-Modal Transportation Plan Year 2025 Travel Demand Model
 Mercer County Multi-Modal Transportation Plan Year 2025 Travel Demand Model Prepared For West Virginia Department of Transportation Transportation Planning Division Building 5, Room 824 1900 Kanawha Blvd.
Ne w J e r s e y Tr a f f i c Co n g e s t i o n :
 Ne w J e r s e y Tr a f f i c Co n g e s t i o n : A Growing Crisis January 2008 Cover photo : Route 3, Passaic County introduction A rising tide of traffic congestion threatens to increase roadway gridlock,
Ohio Department of Transportation
 Ohio Department of Transportation Office of Technical Services Ohio Certified Traffic Manual June 2007 Prepared By: Ohio Certified Traffic Manual Table of Contents Chapter 1 Introduction...1 1.1 Purpose
Comment #1: Provide an interchange at Route 7 and Farm Market Road/White Gate Road. This was studied in the late 1990 s.
 Proposed Truck Climbing Lane Route 7 Westbound Between West Market Street and Route 9 UPC# 58599, Project # 6007-053-133, P101 Date of Meeting: August 24, 2010 Time: 6:00PM to 8:00PM Location: Rust Library
Simulating Traffic for Incident Management and ITS Investment Decisions
 1998 TRANSPORTATION CONFERENCE PROCEEDINGS 7 Simulating Traffic for Incident Management and ITS Investment Decisions MICHAEL D. ANDERSON AND REGINALD R. SOULEYRETTE UTPS-type models were designed to adequately
CAPACITY AND LEVEL-OF-SERVICE CONCEPTS
 CHAPTER 2 CAPACITY AND LEVEL-OF-SERVICE CONCEPTS CONTENTS I. INTRODUCTION...2-1 II. CAPACITY...2-2 III. DEMAND...2-2 IV. QUALITY AND LEVELS OF SERVICE...2-2 Service Flow Rates...2-3 Performance Measures...2-3
ELMHURST SPEEDWAY A STUDY OF LAWBREAKING IN ELMHURST
 ELMHURST SPEEDWAY A STUDY OF LAWBREAKING IN ELMHURST INTRODUCTION TWENTY-THIRD AVENUE IS AN EAST-WEST FOUR-LANE ARTERIAL ROAD running through East Elmhurst, Queens. With two lanes of traffic in either
How To Use Vehicle Gps Data To Understand Travel Time And Speed In Delaware
 USE OF STATE FLEET VEHICLE GPS DATA FOR TRAVEL TIME ANALYSIS David P. Racca Center for Applied Demography and Survey Research (CADSR) University of Delaware Graham Hall, Rm 284, Newark, Delaware 19716
Chapter Forty-seven. RURAL TWO-LANE/MULTILANE STATE HIGHWAYS (New Construction/Reconstruction) BUREAU OF DESIGN AND ENVIRONMENT MANUAL
 BUREAU OF DESIGN AND ENVIRONMENT MANUAL") Chapter Forty-seven RURAL TWO-LANE/MULTILANE STATE HIGHWAYS (New Construction/Reconstruction) BUREAU OF DESIGN AND ENVIRONMENT MANUAL Illinois RURAL TWO-LANE/MULTILANE STATE HIGHWAYS December 2009 2 Illinois
Chapter Forty-seven RURAL TWO-LANE/MULTILANE STATE HIGHWAYS (New Construction/Reconstruction) BUREAU OF DESIGN AND ENVIRONMENT MANUAL Illinois RURAL TWO-LANE/MULTILANE STATE HIGHWAYS December 2009 2 Illinois
Crash Report Calendar Years 2003 through 2006 August 2007
 Bloomington/Monroe County Metropolitan Planning Organization Crash Report Calendar Years 2003 through 2006 August 2007 (this page intentionally left blank) Table of Contents Executive Summary... ii Introduction...
How To Understand The Traffic Patterns In Coronado
 CITY OF CORONADO ANNUAL TRAFFIC REPORT - 2010 PREPARED BY THE CITY OF CORONADO ENGINEERING AND PROJECT DEVELOPMENT DEPARTMENT TABLE OF CONTENTS SECTION PAGE EXECUTIVE SUMMARY i Quick Facts i Traffic Volume
EPA Technical Assistance for Sustainable Communities Building Blocks
 EPA Technical Assistance for Sustainable Communities Technical Assistance Tool: Complete Streets Deerfield Beach, Florida February 16, 2012 To: CC: Amanda Martinez, City of Deerfield Beach Roger Millar,
Corridor Goals and Objectives
 Corridor Goals and Objectives This chapter presents the goals and objectives, developed by the Corridor Study Committee, that serve as the purpose and intent of the Corridor Plan. This plan covers a twenty
The partnership has selected three intersections where enforcement, education, and engineering initiatives are being implemented to improve safety:
 Hamilton-Finn Suite 310 Tel. (403) 207-6000 Road Safety 3016 5th Avenue N.E. Fax. (403) 273-3440 Consultants Ltd. Calgary, Alberta dawatt.dawatt.com www.hamiltonfinn.ca January 19, 2005 Mr. Don Szarko,
Transportation Management Plan Template
 DATE: TO: FROM: SUBJECT: Date Name Position Transportation Service Center Name Position Transportation Service Center Transportation Management Plan Job Number(s) Control Section(s) Route Details County
VERMONT TRAFFIC MONITORING STANDARDS
 VERMONT TRAFFIC MONITORING STANDARDS FOR CONTRACTUAL AGREEMENTS Vermont Agency of Transportation Traffic Research January 2001 Introduction This document presents the traffic monitoring standards in effect
Traffic Monitoring Guide May 1, 2001. Traffic Volume Monitoring
 Traffic Volume Monitoring SECTION 3 CONTENTS Section Page CHAPTER 1 INTRODUCTION...3-1 Traffic Volume Data Collection...3-1 Objectives of the Traffic Volume Monitoring Program...3-2 Organization of This
Anchorage Travel Model Calibration and Validation
 Final Draft Anchorage Travel Model Calibration and Validation Prepared for Anchorage Metropolitan Transportation Solutions (AMATS) February 2005 301 West Northern Lights Boulevard Suite 601 Anchorage,
Performance Measures for RIDOT s Traffic Management Center
 Performance Measures for RIDOT s Traffic Management Center Catherine Burns, EIT Transportation Engineer Sudhir Murthy, PE, PTOE President 5/2011 Presentation Outline RIDOT Performance Measures Public Outreach
Route Development Plan
 WSDOT Northwest Washington Division, Planning and Policy Office Route Development Plan State Route 99 North/Aurora Avenue North From the North end of the Battery Street Tunnel (Mile Post 32.44) to N. 145th
Crash data may not contain complete information, some elements may be unknown
 Crash Data Introduction: Crash data are information that comes from a reportable crash. A reportable crash according to Title 75, Pennsylvania Consolidated Statutes, Section 3746(a) is: an incident that
FHWA Colorado Division Control of Access to the Interstate and its Right-of-Way February 2005
 FHWA Colorado Division Control of Access to the Interstate and its Right-of-Way February 2005 Background: It is in the national interest to maintain the Interstate System to provide the highest level of
2013 State of Arizona Hazard Mitigation Plan State and County Descriptions
 Mohave County History / Geography Mohave County is located in northwest corner of Arizona and shares a border with California and Nevada along the Colorado River to the west, and Utah to the north. Its
11 p.m. to. Tuesday, June. will remain open. 14. closed
 June 3, 2011 CONTACT: Marcia McAllister T: 703 572 0506 C: 571 730 9117 [email protected] Important Lane Closures June 5 11 Include Northbound Beltway Lanes, Eastbound Dulles Airport Access
Addendum to the Arterial Transitway Corridors Study
 January 2013 1 Addendum to the Arterial Transitway Corridors Study The Arterial Transitway Corridors Study (ATCS) evaluated and prioritized arterial bus rapid transit (BRT) improvements to nine corridors
Transit Service Assessment
 Technical Memorandum #1 Transit Service Assessment June 213 Table of Contents 1. Existing Service Summary... 1 1.1 Service Overview... 1 1.2 Service Characteristics... 1 2. Ridership and Productivity...
Accident Analysis of Sheridan Road between Isabella Street and South Boulevard
 Accident Analysis of Sheridan Road between Isabella Street and South Boulevard Prepared for TranSystems Corporation for the City of Evanston Submitted by Regina Webster & Associates, Inc. Date: 08/15/2008
Caledon Transportation Needs Study. Study Report
 Caledon Transportation Needs Study Study Report March 2009 PROJECT SUMMARY PROJECT NAME:...CALEDON TRANSPORTATION NEEDS STUDY UPDATE CLIENT:... THE TOWN OF CALEDON & THE REGIONAL MUNICIPALITY OF PEEL CALEDON
TRAFFIC IMPACT ANALYSIS (TIA)
") GUIDELINES FOR TRAFFIC IMPACT ANALYSIS (TIA) FOR REZONING APPLICATIONS AND OTHER DEVELOPMENT APPROVALS REQUIRING TRANSPORTATION IMPACT ANALYSIS IN SUMTER COUNTY, FLORIDA July 17, 2007 PURPOSE AND APPLICABILITY
GUIDELINES FOR TRAFFIC IMPACT ANALYSIS (TIA) FOR REZONING APPLICATIONS AND OTHER DEVELOPMENT APPROVALS REQUIRING TRANSPORTATION IMPACT ANALYSIS IN SUMTER COUNTY, FLORIDA July 17, 2007 PURPOSE AND APPLICABILITY
3.1 Historical Considerations
 3. Recommended Scope of Bridge improvements 3.1 Historical Considerations In the fall of 2000, an outside consultant, Fraser Design, suggested that the existing 4 th St. Bridge is potentially eligible
Data Services Engineering Division. Traffic Monitoring System Program
 Data Services Engineering Division Traffic Monitoring System Program July 2015 Table of Contents Table of Contents Chapter 1: Introduction... 1-1 Chapter 2: Automatic Traffic Recorders (ATRs)... 2-1 ATRs
Needs Analysis. Long Beach Bicycle Master Plan. Bicycle Commuter Needs. LONG BEACH BICYCLE MASTER PLAN Needs Analysis
 Long Beach Bicycle Master Plan Needs Analysis The purpose of reviewing the needs of commuter and recreational bicyclists is twofold: (1) it is instrumental when planning a system which must serve both
A Short Course on Techniques for Determining Construction Related Road User Costs
 TEXAS TRANSPORTATION INSTITUTE A Short Course on Techniques for Determining Construction Related Road User Costs prepared by TEXAS TRANSPORTATION INSTITUTE THE TEXAS A&M UNIVERSITY SYSTEM 701 NORTH POST
Light Rail Transit in Phoenix
 4. Presentation and Discussion: Phoenix Light Rail Implementation Wulf Grote Planning and Development Director, Phoenix Valley Metro Light Rail Transit in Phoenix Broadway Citizen s Task Force February
The Fresno COG Travel Demand Forecasting Model How the Pieces Fit Together
 The Fresno COG Travel Demand Forecasting Model How the Pieces Fit Together Mike Bitner PE, Senior Transportation Planner Council of Fresno County Governments 1 COG Modeling Staff Mike Bitner Kathy Chung
Crash Analysis. Identify/Prioritize. Gather Data. Analyze Crashes and Identify Improvements. Review Funding Options. Implement Improvements
 Crash Analysis Identify/Prioritize 1. Find high crash areas 2. Review citizen input 3. Access City/County Safety Improvement Candidate Locations Gather Data 1. Use DOT-provided crash analysis programs
Chapter 3 - GPS Data Collection Description and Validation
 Chapter 3 - GPS Data Collection Description and Validation The first step toward the analysis of accuracy and reliability of AVI system was to identify a suitable benchmark for measuring AVI system performance.
MEMORANDUM. Robert Nichols, Acting Corridor Design Manager Northgate Link Extension
 MEMORANDUM DATE: September 23, 2014 TO: Robert Nichols, Acting Corridor Design Manager Northgate Link Extension FROM: SUBJECT: COPIES: Katherine Casseday, PE, PTOE, Casseday Consulting Tony Lo, PE, Parsons
3 Tappan Zee Bridge Rehabilitation Options
 3 Tappan Zee Bridge Rehabilitation Options 3.1 Introduction This chapter describes possible options that rehabilitate and enhance the existing Tappan Zee Bridge. Four Rehabilitation Options have been developed:
Implementation Strategy
 Implementation Strategy 6 The following implementation strategy defines strategic points of intervention for complete streets programming, including visioning, goal-setting, local agency plans, coordination
PRIORITIZATION PROCESSES
 PROJECT SELECTION & PRIORITIZATION PROCESSES STIP Workshop Presented by: Bill Lawrence April 2011 Purpose and Review Overview of Project Selection Process Review Various Prioritization Processes Tk Take
Traffic Impact Study for the 3817-45 North Broadway Mixed-Use Development Chicago, Illinois. Prepared by
 Traffic Impact Study for the Chicago, Illinois repared by March 30, 2015 1. Introduction This report summarizes the methodologies, results and findings of a traffic impact study conducted by Kenig, Lindgren,
Improving Access in Florida International University Biscayne Bay Campus Executive Summary
 EXECUTIVE SUMMARY Improving Access in Florida International University Biscayne Bay Campus Executive Summary Prepared for: Miami-Dade County Metropolitan Planning Organization (Miami-Dade MPO) Prepared
NCHRP Report 765 Overview. Rob Bostrom August 15, 2014 ARC Model Users Group
 NCHRP Report 765 Overview Rob Bostrom August 15, 2014 ARC Model Users Group Presentation Overview NCHRP Report 765 Overview Focus on ARC Case Study Spreadsheets Sketch Planning Techniques NCHRP REPORT
PROGRAM FOR ARTERIAL SYSTEM SYNCHRONIZATION (PASS) STANDARD SCOPE OF WORK, SCHEDULE AND BUDGET
 STANDARD SCOPE OF WORK, SCHEDULE AND BUDGET") PROGRAM FOR ARTERIAL SYSTEM SYNCHRONIZATION (PASS) STANDARD SCOPE OF WORK, SCHEDULE AND BUDGET The purpose of the Program for Arterial System Synchronization (PASS) is to provide technical and financial
PROGRAM FOR ARTERIAL SYSTEM SYNCHRONIZATION (PASS) STANDARD SCOPE OF WORK, SCHEDULE AND BUDGET The purpose of the Program for Arterial System Synchronization (PASS) is to provide technical and financial
Hamilton Truck Route Study
 Prepared for the City of Hamilton March 2012 Pavlos S. Kanaroglou, Ph.D. Vivek Korikanthimath, Ph.D. McMaster Institute of Transportation and Logistics McMaster University Hamilton, Ontario March 2012
Date August 28, 2013
 Date August 28, 2013 To From Subject San Fernando Valley Service Council Scott Page, Service Planning Manager Staff s Review of Past Chair Kymberleigh Richards Email, Proposed Resource Recovery Strategies
Guide to the Jamey Stillings Photographs of the Mike O Callaghan-Pat Tillman Memorial Bridge and the Hoover Dam
 Guide to the Jamey Stillings Photographs of the Mike O Callaghan-Pat Tillman Memorial Bridge and the Hoover Dam This finding aid was produced using ArchivesSpace on November 17, 2015. English 2015 The
AIR QUALITY TECHNICAL MEMORANDUM
 AIR QUALITY TECHNICAL MEMORANDUM AIR QUALITY TECHNICAL MEMORANDUM GOLDEN GLADES INTERCHANGE PD&E STUDY Miami-Dade County, Florida Financial Management Number: 428358-1-22-01 Efficient Transportation Decision
BICYCLE TRENDS IN CAMBRIDGE
 BICYCLE TRENDS IN CAMBRIDGE Cambridge promotes bicycling as a healthy, environmentally friendly way of getting around as an important part of the City's efforts to improve mobility and protect our environment.
City of North Las Vegas
 City of North Las Vegas July 2014 North Las Vegas Facts North Las Vegas was incorporated in 1946 North Las Vegas encompasses 100.4 square miles in Clark County Current population in December 2012 was projected
Goals & Objectives. Chapter 9. Transportation
 Goals & Objectives Chapter 9 Transportation Transportation MISSION STATEMENT: TO PROVIDE A TRANSPORTATION NETWORK CAPABLE OF MOVING PEOPLE AND GOODS EFFICIENTLY AND SAFELY. T he transportation system
The financial plan was prepared in conjunction with the Technical Working Group. Refer to Table 3-1: Funding and Implementation Plan.
 3 Financial Plan The purpose of the financial plan is to identify funding options that would be likely sources of money to advance recommendations made by this study. The Capitol Region Transportation
DISTRICT 3 TRAFFIC MANAGEMENT PLAN CHECKLIST
 State of California Business, Transportation and Housing Agency DISTRICT 3 TRAFFIC MANAGEMENT PLAN CHECKLIST District / EA: District 3/ EA 03-3E380 Date Prepared: 1/10/2013 Prepared By: Robert Himes Stage
Examples of Transportation Plan Goals, Objectives and Performance Measures
 Examples of Transportation Plan Goals, Objectives and Performance Measures The next step in the Long Range Transportation Plan (LRTP) process is to develop goals, objectives, and performance measures.
14-97. 14-97.002 Definitions. For the purposes of this rule chapter the following definitions shall apply unless the context clearly shows otherwise:
 14-97 14-97.001 Purpose. This rule chapter sets forth an access control classification system and access management standards to implement the State Highway System Access Management Act of 1988. The implementation
Measuring the Street:
 Measuring the Street: New Metrics for 21st Century Streets 1 Measuring the Street: New Metrics for 21st Century Streets New York City s streets are constantly called on to the meet new and varied needs
ORANGE COUNTY TRANSPORTATION AUTHORITY. Final Long-Range Transportation Plan - Destination 2035. Attachment A
 ORANGE COUNTY TRANSPORTATION AUTHORITY Final Long-Range Transportation Plan - Destination 2035 Attachment A DESTINATION 2035 DESTINATION 2035 EXECUTIVE SUMMARY ATTACHMENT A Moving Toward a Greener Tomorrow
NCHRP 8-84/Report 735: Long-Distance and Rural Transferable Parameters for Statewide Travel Forecasting Models
 NCHRP 8-84/Report 735: Long-Distance and Rural Transferable Parameters for Statewide Travel Forecasting Models presented to Atlanta Regional Commission Model Users Group Presented by Robert G. Schiffer,
APPENDIX G OPERATIONS AND MAINTENANCE COST ESTIMATION MODEL
 DRAFT APPENDIX G OPERATIONS AND MAINTENANCE COST ESTIMATION MODEL Operations and Maintenance Cost Methodology and Results The Colorado Department of Transportation is conducting an Advanced Guideway System
Appendix J Santa Monica Travel Demand Forecasting Model Trip Generation Rates
 Appendix J Santa Monica Travel Demand Forecasting Model Trip Generation Rates SANTA MONICA TRAVEL DEMAND FORECASTING MODEL TRIP GENERATION RATES SUBMITTED BY: 201 Santa Monica Blvd., Suite 500 Santa Monica,
Chapter 5. Transportation. Decatur County Comprehensive Plan. Introduction. Goals and Objectives. Goal. Objectives. Goal.
 Chapter 5 Transportation Chapter 5: Transportation Introduction The transportation system forms the backbone of a community. I-74 connects Decatur County with the large metropolitan areas of Cincinnati
HIGHWAY DESIGN REPORT. Appendix 4. Proposed Design Principles for City Passings
 HIGHWAY DESIGN REPORT Appendix 4 Proposed Design Principles for City Passings June 2000 Contents Page 1 Introduction 2 1.1 Purpose 2 1.2 Definition of city passing 2 1.3 Safety Problems 2 1.4 Planning
Downtown Tampa Transportation Vision
 Downtown Tampa Transportation Vision Executive Summary August 1, 2006 Hillsborough County Metropolitan Planning Organization County Center, 18 th Floor Tampa, Florida 33602 813-272-5940 www.hillsboroughmpo.org