How To Calculate Wealth In The United States
|
|
|
- Julia Price
- 3 years ago
- Views:
Transcription
1 The State of Working America 12th Edition LAWRENCE MISHEL JOSH BIVENS ELISE GOULD HEIDI SHIERHOLZ Wealth EPI DIGITAL EDITION This chapter is from The State of Working America, 12th Edition, an Economic Policy Institute book published by Cornell University Press in November Data from this chapter should be attributed to the Economic Policy Institute s The State of Working America, 12th Edition.

2 CHAPTER6 Wealth Unrelenting disparities Preceding chapters have focused on what individuals and families bring in over a given time period, whether wages earned hourly or income received in a year. This chapter analyzes wealth. A family s (or individual s) wealth, or net worth, is the sum of assets, such as a home, bank account balances, stock holdings, and retirement funds (such as 401(k) plans and individual retirement accounts), minus liabilities, such as mortgages, credit card balances, outstanding medical bills, student loans, and other debts, at a point in time. As with wages and other income, wealth is a key determinant of a family s standard of living. Wealth makes it easier for families to invest in education and training, start a small business, or fund retirement. In addition, wealth particularly liquid assets such as checking account balances, stocks, and bonds can help families cope with financial emergencies related to unemployment or illness. More tangible forms of wealth, such as cars, computers, and homes, can directly affect a family s ability to participate fully in work, school, and community life. Chapter 3 highlighted the class barriers evident in the strong correlation between family wealth in one generation and family wealth in subsequent generations in the United States. In the United States, children of poor parents are much more likely than other children to be poor as adults, and children of wealthy parents are much more likely than other children to be wealthy as adults. This lack of mobility violates a core American principal of equal opportunity for all. This chapter further investigates wealth in the United States, uncovering some important, if disturbing, findings. The distribution of wealth in the United States is profoundly unequal even more unequal than the highly skewed distributions of wages and income 375
, minus liabilities, such as mortgages, credit card balances, outstanding medical bills, student loans, and other debts, at a point in time.")
3 376 THE ST A T E OF WORKING A MERICA described in earlier chapters. In 2010, the wealthiest 1 percent of all households controlled a much larger share of national wealth (35.4 percent) than did the entire bottom 90 percent of households (which controlled just 23.3 percent of national wealth). The distribution of wealth has also become much more unequal over time. Between 1983 and 2010, nearly three-fourths (74.2 percent) of the total growth in household wealth accrued to the top 5 percent of households in the wealth distribution. For the bottom 60 percent of households, wealth declined from 1983 to The median household had 22.0 percent less wealth in 2010 than it did in 1983, with median household wealth dropping from $73,000 to $57,000 over those 27 years. In 2010, more than 1 in 5 households (22.5 percent) had either zero or negative wealth. Racial and ethnic disparities in wealth are profound. The median net worth of black households was $4,900 in 2010, compared with $1,300 for Hispanic households and $97,000 for white households. Furthermore, about a third of black and Hispanic households (33.9 percent and 35.8 percent, respectively) had zero or negative wealth, compared with 18.6 percent of white households. For all the talk of the democratization of the stock market since the 1980s, a surprisingly small share of households hold any stocks, including stocks held indirectly through retirement accounts and pension funds. In 2010, less than half (46.9 percent) of households owned any stock, and less than one-third (31.1 percent) of households owned more than $10,000 in stocks. The median black household and the median Hispanic household owned no stocks at all. While stock market ups and downs garner much attention in the news media, housing equity is a far more important source of wealth for most households. In 2010, households in the middle fifth of the wealth distribution had an average net worth of $61,000, $39,300 of which was in home equity. This means that home equity made up nearly two-thirds (64.5 percent) of the wealth of typical households (those in the middle of the wealth distribution). Therefore, though the destruction of home equity and other forms of wealth by the bursting of the housing bubble and resulting Great Recession affected households across the entire distribution, the wealth of middle-class households and those below was hit particularly hard. From 2007 to 2010 the average wealth of the top 1 percent of households dropped 15.6 percent, but median wealth dropped an astounding 47.1 percent. The middle fifth of households saw their housing equity drop 44.6 percent between 2007 and 2010, and in 2010 households in the bottom 40 percent of the wealth distribution had negative housing equity on average for the first time on record. Table notes and figure notes at the end of this chapter provide documentation for the data, as well as information on methodology, used in the tables and figures that follow.

4 WEALTH 377 Net worth Wealth, or net worth, is the sum of all assets minus the sum of all liabilities. Assets include resources such as homes, bank account balances, stock holdings, and funds in 401(k) plans and individual retirement accounts. Liabilities include mortgages, credit card debt, outstanding medical bills, student loan debt, and other debts. Calculations of net worth exclude assets held in defined-benefit pension plans because workers do not legally own these assets and thus do not benefit or suffer when these assets gain or lose value. For similar reasons, Social Security and Medicare are also excluded from net worth. (However, we later review the contributions of Social Security and defined-benefit pension plans to retirement security. Given the low levels of wealth held by most households, living standards in retirement greatly rely on implicit wealth from defined-benefit pension plans and Social Security.) Net worth can be further subdivided into net nonfinancial (tangible) assets, and net financial assets. Net tangible assets are assets such as real estate and durable goods, minus mortgage debt. Net financial assets are assets such as stocks, bonds, mutual funds, and bank account balances, minus nonmortgage debt. Figure 6A shows average net worth per household, along with net tangible assets and net financial assets, from 1965 to 2012.

5 378 THE ST A T E OF WORKING A MERICA For decades, the real average net worth of U.S. households grew at a relatively steady and modest pace about 1.2 percent per year from 1965 to In the mid-1990s, net worth began to grow at a faster pace on average but also became increasingly volatile, as illustrated by two peaks (1999 and 2006) that were each followed by precipitous declines. During the first steep run-up in wealth, from 1994 to 1999, net worth, fueled by the dot-com bubble, grew 42.1 percent; as that bubble deflated, net worth declined 12.9 percent from 1999 to Net worth rebounded at a rapid pace from 2002 to 2006, but much of the increase was due to a growing housing bubble, which began inflating around After the housing bubble burst in 2006, net worth plummeted, dropping over 25 percent between 2006 and early Since 2009 it has rebounded slightly, growing over 12 percent between early 2009 and early Net financial assets make up the majority of average net worth (though, as discussed later in the chapter, average net worth figures are skewed by the net worth of the very wealthy; most households have greater tangible assets, in particular housing value, than financial assets). Figure 6A shows that the trajectory of net financial assets closely mirrors that of overall net worth. However, between 1997 and 2005, growth in net worth was also bolstered by growth in tangible assets as the housing bubble inflated. Between 1997 and 2005 net tangible assets grew about 70 percent; after the housing bubble burst, they fell, dropping back to their pre-bubble levels by The data underlying Figure 6A are from the Federal Reserve Board s Flow of Funds Accounts of the United States. These data are timely, but they do not allow for an analysis of how wealth is distributed across the population. We turn to the Survey of Consumer Finances (SCF) to conduct a distributional analysis, presented in the next set of tables and figures. This dataset, collected every three years by the Federal Reserve Board, is one of the country s primary sources of data on wealth. The latest data available are from As mentioned, the distribution of wealth in the United States is dramatically more unequal than even the extremely unequal distributions of wages and income. Table 6.1 shows the income distribution and the wealth distribution for It provides shares of total household income and wealth held by the top 1 percent, the next 9 percent (those between the 90th and 99th percentiles), and the bottom 90 percent of households in the income or wealth distributions. The 1 percent of households with the highest incomes received 17.2 percent of all income. At the same time, the 1 percent of households with the most wealth held 35.4 percent of all net worth. The entire bottom 90 percent of the income distribution received just 55.5 percent of all income, but that astoundingly small share dwarfs the share of wealth held by the bottom 90 percent of the wealth distribution, which was only 23.3 percent.

6 WEALTH 379 The distribution of wealth has become more unequal over time, with the top 10 percent, and especially the top 5 percent, of the wealth distribution holding an increasing share of the country s total wealth. Table 6.2 shows the share of wealth held by households in various segments of the wealth distribution. The top 5 percent of wealth holders have consistently held over half of all wealth, with their share increasing from 56.1 percent in 1983 to 63.1 percent in The bottom four-fifths of wealth holders have consistently held less than 20 percent of all wealth; their share decreased from 18.7 percent in 1983 to 11.1 percent in 2010, with all of that lost share migrating upward to the top 10 percent. The middle fifth of households held 2.6 percent of total wealth in 2010, its lowest recorded share. In 1983, middle-fifth households had 5.2 percent of wealth, which means their share of all wealth was cut in half between 1983 and Table 6.3 shows overall average and median wealth, as well as average wealth by wealth group. As seen in Figure 6A, over the long run, average wealth grows along with an expanding economy, but also experiences short-run fluctuations due to business cycle dynamics, i.e., economic booms and busts. In 1983, average household wealth was $284,400; by 2007, it had roughly doubled to $563,800, its peak before the onset of the Great Recession. By 2010, average household wealth had dropped to $463,800, 17.7 percent below its 2007 level, but still 63.1 percent above its 1983 level and, as we saw in Figure 6A, it was again on an upward trajectory as the economy began to recover from the recession. However, since all of the gains in wealth have gone to the top portion of the wealth distribution, median wealth, or the wealth of the typical household, has fared very poorly over the last three decades. Median wealth grew just 47.5 percent between 1983 and 2007, from $73,000 to $107,800, but with the housing bust and resulting Great Recession, all those gains and more were lost. Median wealth fell to $57,000 in 2010, meaning there was a 22.0 percent decline in the wealth of the typical household over the 27 years between 1983 and Over

7 380 THE ST A T E OF WORKING A MERICA the same period, average wealth of the top 5 percent of households grew 83.1 percent, from nearly $3.2 million in 1983 to over $5.8 million in Declines in average wealth due to the housing bust and resulting Great Recession were bigger in percentage terms for the bottom four-fifths of households than for groups in the top fifth of the wealth distribution. For example, between 2007 and 2010, middle-fifth household wealth dropped 45.3 percent while wealth of the top fifth dropped 14.0 percent. This is unsurprising given that households with less wealth tend to have a much larger share of their wealth in their homes. This feature of the wealth distribution, which will be discussed later in this chapter, underscores how the expansion and collapse of the housing bubble caused enormous damage to the balance sheets of middle-class households. Table 6.3 shows that average household wealth grew $179,400 between 1983 and 2010, from $284,400 to $463,800. Figure 6B spotlights the increase in wealth inequality over this period by showing which groups in the wealth

8 WEALTH 381

9 382 THE ST A T E OF WORKING A MERICA distribution actually claimed that increase in average household wealth. Nearly 40 percent (38.3 percent) of the increase in average household wealth between 1983 and 2010 accrued to the top 1 percent of the wealth distribution, and nearly three-fourths (74.2 percent) accrued to the top 5 percent of the distribution. For the bottom 60 percent of households, wealth declined from 1983 to Figure 6C presents increasing wealth inequality in another way. The figure shows the ratio of the average wealth of the top 1 percent of households in the wealth distribution to the wealth of the median household. In 1962, the ratio was 125-to-1. In other words, the wealth of the wealthiest 1 percent of households averaged 125 times the wealth of the median household. However, that large disparity is dwarfed by today s wealth gap; in 2010, the wealthiest 1 percent of households had on average 288 times more wealth than the median household. With Figure 6D we extend our analysis beyond the top 1 percent to the net worth of the ultra wealthy, the 400 wealthiest people in the United States as captured in the Forbes 400. The average annual net worth of the top 400 rises as asset bubbles inflate, drops when asset bubbles burst, and quickly bounces back. The rise of the dot-com bubble at the end of the 1990s and its fall, and then the rise of the housing bubble in the mid-2000s and its fall, are apparent in the figure. While the net worth of the ultra-wealthy dropped from 2007 to 2009, it began

10 WEALTH 383

11 384 THE ST A T E OF WORKING A MERICA to rise again in 2010 and continued to rise in Overall, from 1982 to 2011, average wealth of the top 400 increased by 234 percent, from $1.1 billion to $3.8 billion. In 2011, the collective net worth of these 400 individuals was $1.5 trillion. The price of admission to the top 400 has also increased substantially; in 2011, the minimum for being in the top 400 was $1.1 billion, nearly three times the $368.8 million threshold in And, perhaps unsurprisingly given the rising wealth inequality already documented in this chapter, gains were even greater for the wealthiest of the ultra-wealthy; in 1982, the net worth of the wealthiest person in the top 400 was $9.9 billion, but by 2011 it was six times higher, at $59.0 billion. At the extreme other end of the wealth spectrum are a significant share of households with low, zero, or negative net worth. Table 6.4 reports the share of all households with zero or negative net worth, and net worth of less than $10,000, from 1962 to In 2010, more than 1 in 5 households (22.5 percent) had zero or negative net worth, while another 12.6 percent had net worth of more than zero but less than $10,000. Thus, more than one-third (35.1 percent) of U.S. households had wealth holdings so low that they were extremely vulnerable to financial distress and insecurity. The share of households in this precarious position had held fairly steady for two-and-a-half decades, increasing 0.5 percentage points, from 27.7 percent to 28.2 percent, between 1983 and However, it

12 WEALTH 385 increased dramatically by 6.9 percentage points from 2007 to 2010, during the Great Recession and its aftermath. The racial divide in net worth The legacy of economic disadvantage for racial and ethnic minorities is apparent in persistent and profound racial and ethnic disparities in wealth, disparities that are far greater than racial and ethnic disparities in wages and incomes. Here we examine disparities in net worth by race and ethnicity; later in this chapter we examine disparities in assets and liabilities. Table 6.5 shows that in 2010 the median net worth of black households was $4,900, just 5.0 percent of the median net worth of white households, $97,000. In 2010, the median net worth of Hispanic households was an even lower $1,300, just 1.4 percent of median white household net worth. Persistent, large disparities also appear in shares of households with low net worth. In 2010, black and Hispanic households were nearly twice as likely as white households to have zero or negative net worth; 33.9 percent of black

13 386 THE ST A T E OF WORKING A MERICA households and 35.8 percent of Hispanic households had zero or negative net worth, compared with 18.6 percent of white households. These persistent wealth disparities are apparent in Figure 6E, which presents median wealth by race and ethnicity between 1983 and The figure also shows the damage to all groups wealth during the Great Recession and its aftermath. Between 2007 and 2010, median white household wealth dropped $54,100. This was more in absolute terms than the $8,300 decline in median Hispanic household wealth and the $4,800 decline in median black household wealth. However, black and Hispanic households started from much lower levels of wealth and experienced considerably larger percentage declines in wealth. Median white household wealth declined 35.8 percent between 2007 and 2010, while median black household wealth dropped 49.7 percent and median Hispanic household wealth was all but wiped out over this period, dropping 86.3 percent. Assets As mentioned previously, net worth or wealth is determined by two components assets and liabilities. This section further investigates assets, while the following section will further investigate liabilities. There are myriad assets households may possess, including houses, stocks, bonds, and bank account balances.

14 WEALTH 387 The distribution of assets varies significantly by the type of asset. Some assets, such as stocks and bonds, are highly concentrated among a relatively small share of households. Other assets, such as houses, are more widely held. The distributional differences of these assets are strongly related to overall wealth holdings. Wealthy households, for example, tend to hold a much higher percentage of their wealth in financial assets such as stocks and bonds, whereas less-affluent households, particularly those in the middle of the wealth distribution, typically hold most of their wealth in housing equity. This difference is one reason middle-class households were disproportionately affected when the housing bubble burst. Table 6.6 shows that while the distribution across wealth groups of different types of household assets varies, it always strongly favors those at the top. In 2010 the wealthiest 5 percent of households owned about two-thirds (67.1 percent) of all stock, and an even larger share (79.9 percent) of stock not held in retirement accounts. Households in the bottom 80 percent of the wealth distribution held just 8.3 percent of all stock, and even less, 3.5 percent, of stock not held in retirement accounts. In comparison, housing equity is less skewed. However, the top 5 percent of households still held a highly disproportionate share (34.3 percent) of housing equity, a bigger share than the 29.9 percent held by the entire bottom 80 percent of households.

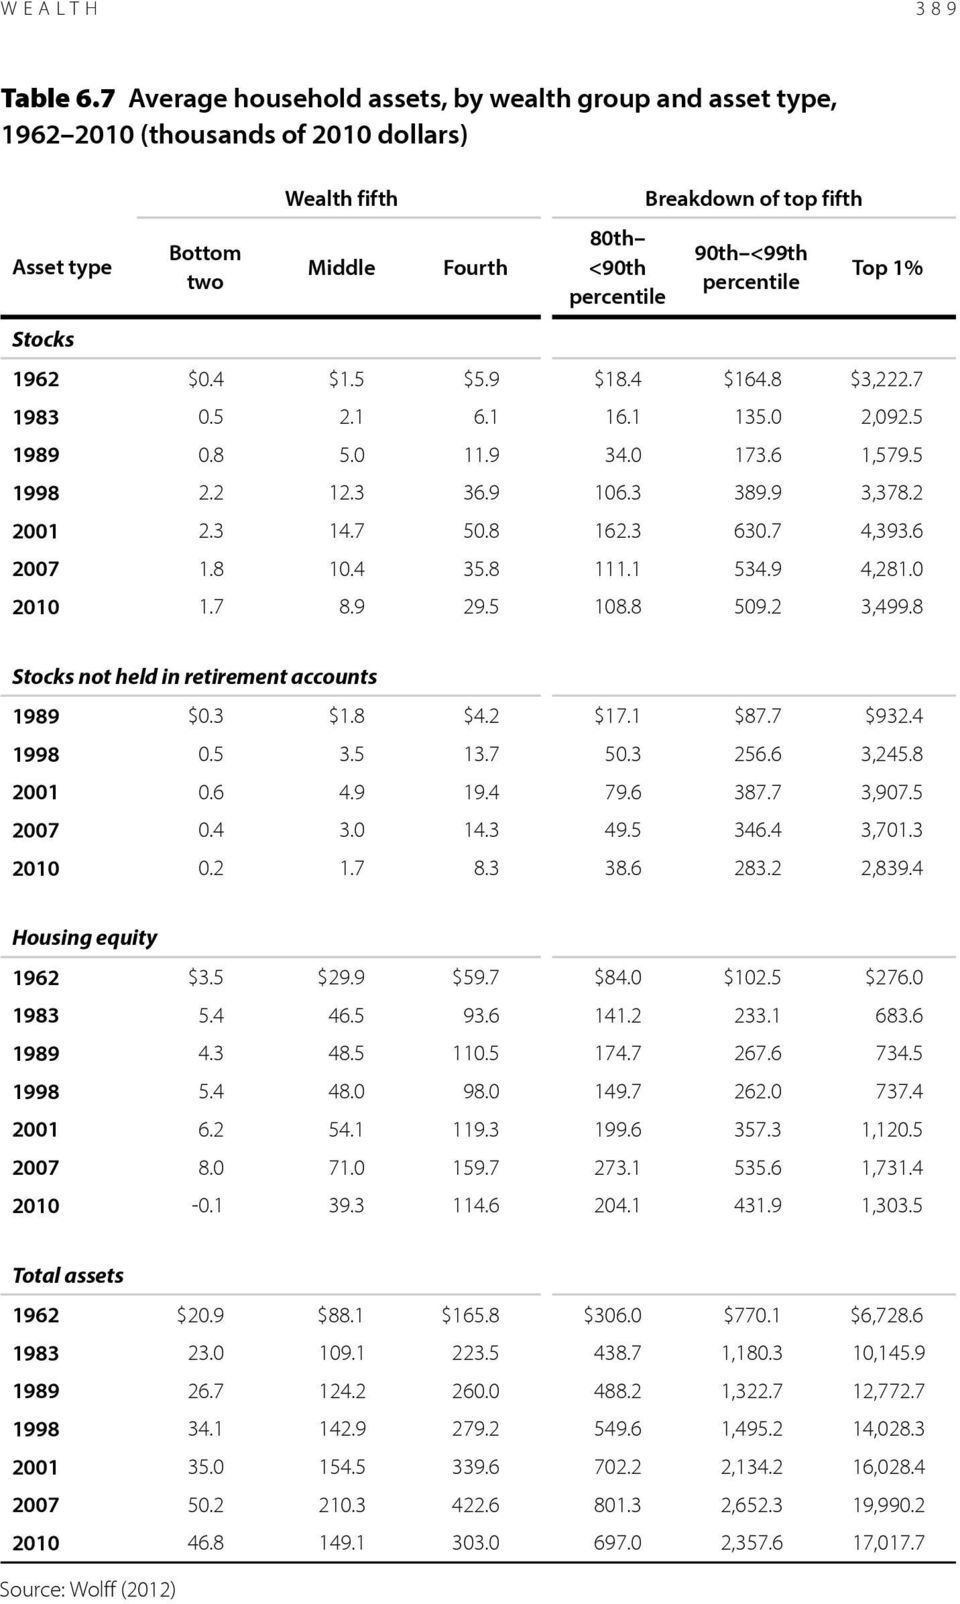
15 388 THE ST A T E OF WORKING A MERICA Table 6.7 shows how the various wealth groups holdings of different types of assets have changed over time. In 2010, the wealthiest 1 percent of households owned an average of $3.5 million in total stocks (including stocks held in retirement accounts). The next 9 percent (those between the 90th and 99th percentiles) owned an average of $509,200 in total stocks. In comparison, the middle fifth of households held just $8,900 in stocks on average, and the bottom two-fifths of households held $1,700. These data confirm that stock ownership is not at all pervasive in or below the middle class, even taking into account stocks held indirectly in retirement plans. Excluding stocks held in retirement accounts, the typical wealth holder represented by households in the middle fifth owns next to nothing in stock, just $1,700. Stock holdings are further investigated later in the chapter. In 2010, the wealthiest 1 percent of households held an average of $1.3 million in housing equity (housing assets minus mortgages). This was 24.7 percent less than their $1.7 million in housing equity in 2007, but still well above the $1.1 million in housing equity they held in Households lower in the wealth distribution fared much worse when the housing bubble burst. The middle fifth held just $39,300 in housing equity on average in 2010, 44.6 percent less than in 2007 and 15.5 percent less than the $46,500 average home equity they had 27 years earlier, in In 2010, households in the bottom two-fifths of the wealth distribution had negative housing equity. This means that on average, homeowners in the bottom two-fifths were underwater on their home loans in 2010, i.e., they owed more on their homes than their homes were worth. Housing is further investigated later in the chapter. Table 6.8 shows average and median household assets (stocks, housing equity, and total assets) by race and ethnicity from 1983 to As shown in Table 6.7, households in the bottom 80 percent of the wealth distribution generally hold little in stocks, even including stocks held in retirement accounts. Table 6.8 shows that in 2010, the median black and median Hispanic households held no stocks, even including stocks held in retirement accounts, while the median white household held just $1,200 in stocks. Table 6.9, discussed later, provides a more direct look at the startlingly low share of households with any significant stock holdings, showing that the strong public narrative of the democratization of the stock market since the 1980s is at odds with the facts. Although housing equity, as already mentioned, is more widely held than other forms of wealth such as stocks, the median black household and the median Hispanic household had zero housing equity over the entire period, while the median white household had $45,000 of housing equity in 2010 (a drop of more than one-third 37.1 percent from their $71,500 in housing equity in 2007). The median is a better indication of the typical household in a given category than the average, since the median is the value at which half of households

16 WEALTH 389
17 390 THE ST A T E OF WORKING A MERICA have more and half have less. However, because median housing equity for black and Hispanic households is zero over the entire period, we turn to averages to provide some sense of how housing wealth has changed over time for these groups.

18 WEALTH 391 The average black household had $39,400 in housing equity in 2010, very close to the housing equity of the average Hispanic household ($39,700), and slightly less than a third of the housing equity of the average white household ($124,600). Between 2007 and 2010, the average black household lost 27.8 percent in housing equity, compared with a loss of 24.4 percent for the average white household. The average Hispanic household saw its home equity cut almost in half (falling 49.1 percent) between 2007 and In 2010, the median black household held $28,100 in total assets, more than the $20,000 in total assets of the median Hispanic household but significantly less than the $205,000 in total assets of the median white household. Stocks This subsection and the next will look in more depth at two major asset categories, stocks and housing, respectively. While the stock market has experienced ups and downs throughout the last 50 years, stocks have been extremely volatile in the last two decades, as evident in Figure 6F, in which the two recent bubbles are unmistakable. The inflation-adjusted value of the Standard & Poor s composite index of the 500 largest U.S. firms (the S&P 500) increased 230 percent between 1989 and 2000, then lost over a third of its value between 2000 and 2003, after the dot-com bubble burst. The market regained more than 60 percent of those losses

19 392 THE ST A T E OF WORKING A MERICA by 2007, only to lose those gains and more during the steep decline from 2007 to The market began to climb again in 2009 and by 2011 had regained nearly half of what it lost between 2007 and The strong rebound in stocks since 2009 amidst persistently high unemployment (see Chapter 5) highlights the disconnect between Wall Street s financial markets and Main Street s employers and workers. Despite minute-by-minute dissection of the stock market in the news media, the share of the population owning stock is surprisingly low, even when including shares purchased indirectly through retirement accounts. This means that the stock market has little or no direct financial importance to the majority of U.S. households which is perhaps particularly surprising given the public discourse on how the stock market has democratized (the term implying stock holdings are no longer dominated by a tiny elite) since the 1980s. As Table 6.9 shows, even with the profound run-up in stocks in the latter half of the 1990s, in 2001 just over half (51.9 percent) of U.S. households held any stock, including stocks held in retirement plans, and just over a third (37.8 percent) had total stock holdings of $10,000 or more. In 2010, under half (46.9 percent) of all households had any stock holdings, and less than a third (31.1 percent) had stock holdings of $10,000 or more. Stocks held outside of retirement accounts are a liquid asset; they can quickly be turned into cash without incurring significant losses. Just 14.3 percent of households owned $10,000 or more of this type of asset in Conversely, retirement stock holdings are largely nonliquid; premature withdrawals from IRAs and 401(k) accounts carry stiff tax penalties. Only around one-fourth (25.3 percent) of households had $10,000 or more in retirement stock holdings in 2010.

20 WEALTH 393 The imbalanced distribution of stock assets has persisted over time, as seen in Figure 6G. From 1989 to 2007, the wealthiest 1 percent of households never held less than one-third of all stock wealth. The top fifth of households consistently held about 90 percent of stock wealth, leaving approximately 10 percent for the bottom four-fifths of households. Because these data include stocks held in pension plans and retirement accounts, the shares capture the effect of the broad shift from defined-benefit pension plans to defined-contribution pension plans (a shift discussed both in Chapter 4 and later in this chapter). This figure shows that the vast democratization of the stock market since the 1980s wherein the masses gained significant shares of the market through investment vehicles such as mutual funds, IRAs, and 401(k)s never actually happened. Housing While stock market fluctuations garner much attention, housing equity is a far more important form of wealth for most households. In 2010, households in the middle fifth of the wealth distribution had an average net worth of $61,000 (Table 6.3), and $39,300 of that was in home equity (Table 6.7). In other words, home equity constituted nearly two-thirds (64.5 percent) of the wealth of households with typical wealth levels (i.e., those in the middle of the wealth distribution). Homeownership has long been associated with solid footing on the

21 394 THE ST A T E OF WORKING A MERICA economic ladder. However, the housing boom and bust made that association more tenuous. This section examines homeownership and the effect of the housing meltdown on household wealth. Homeownership Figure 6H shows changes in the homeownership rate between 1965 and In 1965, 63 percent of homes were owned by the people who lived in them. The homeownership rate fluctuated somewhat in the following 30 years, including sharp increases in the late 1970s and declines in the early 1980s, but never exceeded 65.6 percent. But in the mid-1990s, homeownership rates began to rise dramatically, increasing from 64.0 percent in 1994 to 69.0 percent in Then, after the housing bust in 2006, the homeownership rate registered an unprecedented decline, falling to 66.1 percent in As with other measures related to wealth, homeownership rates vary dramatically by income and demographics. Figure 6I shows, unsurprisingly, that higherincome households are more likely to own their homes. In 2009 (the most recent data available for this measure), 88.8 percent of households in the top fourth of the income distribution were homeowners, compared with just 47.0 percent in the bottom fourth. Figure 6J shows homeownership rates by race and ethnicity
22 WEALTH 395
23 396 THE ST A T E OF WORKING A MERICA from 1975 to In 2011, nearly three-fourths (73.8 percent) of white households, more than half (58.0 percent) of Asian households, less than half (44.9 percent) of black households, and less than half (46.9 percent) of Hispanic households owned their homes. Minority homeownership rates rose more than the white homeownership rate as the housing bubble inflated and fell further when it collapsed, with black households hit particularly hard; the black homeownership rate fell from 49.1 percent in 2004 to 44.9 percent in The housing meltdown As Table 6.7 showed, the collapse of the housing bubble had an enormous impact on the home equity of homeowners. Figure 6K shows the change in home prices from 1953 through the first quarter of The dramatic run-up in home prices from the mid-1990s to 2006 is striking, with annual increases from mid through mid-2005 in the double- or near-double-digits. However, this was ignored by central bankers and others responsible for the economic health of the country, who did nothing to halt the bubble s expansion. Home prices peaked in early Then the bubble burst and home prices began falling sharply, losing 35.7 percent between the first quarter of 2006 and the first quarter of 2009 and another 11.1 percent between the first quarter of 2009 and the first quarter of By early 2012, with home prices back at their 1998 values, it was likely
The Wealth of Households: An Analysis of the 2013 Survey of Consumer Finances
 November 214 The Wealth of Households: An Analysis of the 213 Survey of Consumer Finances By David Rosnick and Dean Baker* Center for Economic and Policy Research 1611 Connecticut Ave. NW Suite 4 Washington,
The deflation of the housing bubble which started in 2006 pushed the U.S. economy into recession by the
 EPI BRIEFING PAPER Economic Policy Institute state of working america March 23, 2011 Briefing Paper #292 The State of Working America s Wealth, 2011 Through volatility and turmoil, the gap widens By Sylvia
The State of Mortgage Lending in New York City
 The State of Mortgage Lending in New York City Mortgage lending trends provide an important window into the housing market and the changing availability of credit, both of which have been profoundly affected
DATA AND CHART PACK February 2016
 DATA AND CHART PACK February 2016 Income Inequality Income includes the revenue streams from wages, salaries, interest on a savings account, dividends from shares of stock, rent, and profits from selling
Making Sure Money Is Available When We Need It
 AP PHOTO/RIC FRANCIS Making Sure Money Is Available When We Need It Protecting Household Assets Must Become an Integral Part of U.S. Savings Policies Christian E. Weller March 2013 WWW.AMERICANPROGRESS.ORG
FRBSF ECONOMIC LETTER
 FRBSF ECONOMIC LETTER 2012-25 August 20, 2012 Consumer Debt and the Economic Recovery BY JOHN KRAINER A key ingredient of an economic recovery is a pickup in household spending supported by increased consumer
(1) What are the significant assets of low-income households? (2) What are the significant liabilities of low-income households?
 What are the significant assets of low-income households? (2) What are the significant liabilities of low-income households?") EXECUTIVE SUMMARY Building assets and avoiding excessive debt can help low-income families insure against unforeseen disruptions, achieve economic independence, and improve socio-economic status. Assets
EXECUTIVE SUMMARY Building assets and avoiding excessive debt can help low-income families insure against unforeseen disruptions, achieve economic independence, and improve socio-economic status. Assets
Striking it Richer: The Evolution of Top Incomes in the United States (Updated with 2009 and 2010 estimates)
") Striking it Richer: The Evolution of Top Incomes in the United States (Updated with 2009 and 2010 estimates) Emmanuel Saez March 2, 2012 What s new for recent years? Great Recession 2007-2009 During the
Striking it Richer: The Evolution of Top Incomes in the United States (Updated with 2009 and 2010 estimates) Emmanuel Saez March 2, 2012 What s new for recent years? Great Recession 2007-2009 During the
The American Dream of Asset Ownership is Vulnerable When Bubbles Burst
 New America Foundation Part 6 of 6 The American Dream of Asset Ownership is Vulnerable When Bubbles Burst Lauren Damme, Next Social Contract Initiative Valuable research assistance for this series provided
Why home values may take decades to recover. by Dennis Cauchon, USA TODAY
 Why home values may take decades to recover by Dennis Cauchon, USA TODAY 200 180 160 140 120 100 80 The history of housing as an investment 1950 1952 1954 1956 1958 1960 1962 1964 1966 1968 1970 1972 1974
Facts and Figures on the Middle-Class Squeeze in Idaho
 Facts and Figures on the Middle-Class Squeeze in Idaho For hard-working, middle-class families all over the country, life during the Bush presidency has grown less affordable and less secure. President
Economic Snapshot for February 2013
 Economic Snapshot for February 2013 Christian E. Weller on the State of the Economy Christian E. Weller, associate professor, Department of Public Policy and Public Affairs, University of Massachusetts
At What Cost? h o w s t u d e n t d e b t. r e d u c e s. l i f e t i m e w e a l t h. r o b e r t. h i l t o n s m i t h A U G U S T 2 0 1 3
 Debt-For-Diploma Series At What Cost? h o w s t u d e n t d e b t r e d u c e s l i f e t i m e w e a l t h by r o b e r t h i l t o n s m i t h A U G U S T 2 0 1 3 a b o u t d ē m o s Dēmos is a public
CONGRESS OF THE UNITED STATES CONGRESSIONAL BUDGET OFFICE CBO. The Distribution of Household Income and Federal Taxes, 2008 and 2009
 CONGRESS OF THE UNITED STATES CONGRESSIONAL BUDGET OFFICE Percent 70 The Distribution of Household Income and Federal Taxes, 2008 and 2009 60 50 Before-Tax Income Federal Taxes Top 1 Percent 40 30 20 81st
Working Paper No. 502
 Working Paper No. 502 Recent Trends in Household Wealth in the United States: Rising Debt and the Middle-Class Squeeze by Edward N. Wolff Department of Economics, New York University The Levy Economics
Home-Mortgage Lending Trends in New England in 2010
 January 212 No. 212-1 Home-Mortgage Lending Trends in New England in 21 Ana Patricia Muñoz The views expressed in this paper are solely those of the author and do not necessarily represent those of the
wealth inequality The last three decades have witnessed The Stanford Center on Poverty and Inequality
 national report card wealth inequality The Stanford Center on Poverty and Inequality By Edward N. Wolff Key findings After two decades of robust growth in middle class wealth, median net worth plummeted
Snapshot of older consumers and mortgage debt. Office for Older Americans
 Snapshot of older consumers and mortgage debt Office for Older Americans May 2014 Table of contents Table of contents... 2 1. Introduction... 3 2. Rising mortgage debt threatens retirement security for
Homeownership HOMEOWNERSHIP TRENDS JOINT CENTER FOR HOUSING STUDIES OF HARVARD UNIVERSITY
 4 Homeownership The national homeownership rate marked its ninth consecutive year of decline in 213, affecting most segments of the population. The drop among minorities is particularly troubling, given
Working Paper No. 589. Recent Trends in Household Wealth in the United States: Rising Debt and the Middle-Class Squeeze an Update to 2007
 Working Paper No. 589 Recent Trends in Household Wealth in the United States: Rising Debt and the Middle-Class Squeeze an Update to 2007 by Edward N. Wolff Levy Economics Institute of Bard College March
 The Credit Card Report May 4 The Credit Card Report May 4 Contents Visa makes no representations or warranties about the accuracy or suitability of the information or advice provided. You use the information
Striking it Richer: The Evolution of Top Incomes in the United States (Updated with 2012 preliminary estimates)
") Striking it Richer: The Evolution of Top Incomes in the United States (Updated with 2012 preliminary estimates) Emmanuel Saez, UC Berkeley September 3, 2013 What s new for recent years? 2009-2012: Uneven
Striking it Richer: The Evolution of Top Incomes in the United States (Updated with 2012 preliminary estimates) Emmanuel Saez, UC Berkeley September 3, 2013 What s new for recent years? 2009-2012: Uneven
Recent Developments in the Housing Market and its Financing
 Recent Developments in the Housing Market and its Financing Luci Ellis Head of Financial Stability Department Financial Review Residential Property Conference 2010 Sydney - 18 May 2010 I d like to thank
Investment Company Institute and the Securities Industry Association. Equity Ownership
 Investment Company Institute and the Securities Industry Association Equity Ownership in America, 2005 Investment Company Institute and the Securities Industry Association Equity Ownership in America,
Household Borrowing Behaviour: Evidence from HILDA
 Household Borrowing Behaviour: Evidence from HILDA Ellis Connolly and Daisy McGregor* Over the 199s and the first half of the s, household debt grew strongly in response to lower nominal interest rates
MMI Omnibus Survey. Homeownership. Top-Line Results and Suggested Story Lines
 MMI Omnibus Survey Homeownership Top-Line Results and Suggested Story Lines Methodology: Cynapsus and Money Management International (MMI) developed a series of questions on the topic of homeownership,
THE POTENTIAL MACROECONOMIC EFFECT OF DEBT CEILING BRINKMANSHIP
 OCTOBER 2013 THE POTENTIAL MACROECONOMIC EFFECT OF DEBT CEILING BRINKMANSHIP Introduction The United States has never defaulted on its obligations, and the U. S. dollar and Treasury securities are at the
Chapter 2. Education and Human Resource Development for Science and Technology
 Chapter 2 Education and Human Resource Development for Science and Technology 2.1 Evironment for Basic Human Resource Development... 53 2.1.1 Science education in primary and secondary schools... 53 2.1.2
The Key to Stabilizing House Prices: Bring Them Down
 The Key to Stabilizing House Prices: Bring Them Down Dean Baker December 2008 Center for Economic and Policy Research 1611 Connecticut Avenue, NW, Suite 400 Washington, D.C. 20009 202-293-5380 www.cepr.net
Trends in Household Wealth Dynamics, 2005-2007
 Technical Series Paper #09-03 Trends in Household Wealth Dynamics, 2005-2007 Elena Gouskova and Frank Stafford Survey Research Center - Institute for Social Research University of Michigan September, 2009
HOMEOWNERSHIP TRENDS. After 12 successive years of increases, the national homeownership rate slipped
 HOMEOWNERSHIP TRENDS After 1 successive years of increases, the national homeownership rate slipped to 8.9 percent last year. This small dip reflects in part the sharp swing in renter households, whose
Late, Not Lost: The Economic Drag From the Millennial Generation
 Late, Not Lost: The Economic Drag From the Millennial Generation September 2, 2014 by Joshua Anderson, Emmanuel Sharef, Jason Mandinach of PIMCO We believe concerns of a student debt "bubble" and perpetual
2012 HOUSEHOLD FINANCIAL PLANNING SURVEY
 2012 HOUSEHOLD FINANCIAL PLANNING SURVEY A Summary of Key Findings July 23, 2012 Prepared for: Certified Financial Planner Board of Standards, Inc. and the Consumer Federation of America Prepared by: Princeton
Housing Markets in Six Metropolitan Areas and their Main Central Cities
 Housing Markets in Six Metropolitan Areas and their Main Central Cities Rolf Pendall Director, Metropolitan Housing and Communities Policy Center, The Urban Institute Housing issues and opportunities at
Access Denied. Low-Income and Minority Families Face More Credit Constraints and Higher Borrowing Costs. Christian E. Weller
 Access Denied Low-Income and Minority Families Face More Credit Constraints and Higher Borrowing Costs Christian E. Weller Senior Fellow, Center for American Progress August 2007 w w w. a m e r i c a n
Executive Summary. 204 N. First St., Suite C PO Box 7 Silverton, OR 97381 www.ocpp.org 503-873-1201 fax 503-873-1947
 Executive Summary 204 N. First St., Suite C PO Box 7 Silverton, OR 97381 www.ocpp.org 503-873-1201 fax 503-873-1947 On Whose Backs? Tax Distribution, Income Inequality, and Plans for Raising Revenue By
Mortgage Lending During the Great Recession: HMDA 2009
 F U R M A N C E N T E R F O R R E A L E S T A T E & U R B A N P O L I C Y N E W Y O R K U N I V E R S I T Y S C H O O L O F L AW WA G N E R S C H O O L O F P U B L I C S E R V I C E N O V E M B E R 2 0
Salt Lake Housing Forecast
 2015 Salt Lake Housing Forecast A Sustainable Housing Market By James Wood Director of the Bureau of Economic and Business Research Commissioned by the Salt Lake Board of REALTORS By year-end 2013 home
Personal debt ON LABOUR AND INCOME
 ON LABOUR AND INCOME Personal debt Although the economy and population are almost times the size of s, the two countries show several similarities. Both have relatively high per-capita income and living
The U.S. Economy after September 11. 1. pushing us from sluggish growth to an outright contraction. b and there s a lot of uncertainty.
 Presentation to the University of Washington Business School For delivery November 15, 2001 at approximately 8:05 AM Pacific Standard Time (11:05 AM Eastern) By Robert T. Parry, President and CEO of the
êéëé~êåü=üáöüäáöüí House Prices, Borrowing Against Home Equity, and Consumer Expenditures lîéêîáéï eçìëé=éêáåéë=~åç=äçêêçïáåö ~Ö~áåëí=ÜçãÉ=Éèìáíó
 êéëé~êåü=üáöüäáöüí January 2004 Socio-economic Series 04-006 House Prices, Borrowing Against Home Equity, and Consumer Expenditures lîéêîáéï The focus of the study is to examine the link between house
CANADA AND U.S. AUTO SALES: ROOM FOR FUR- THER GROWTH? October 2014. Factors supporting the U.S. sales outlook: Employment Growth
 93619 CANADA AND U.S. AUTO SALES: ROOM FOR FUR- THER GROWTH? October 2014 Canadian and U.S. auto sales have strengthened significantly from recession lows. Canadian new motor vehicle sales have surprised
Trends in Homeownership and Mortgage Debt among Older Americans Office for Older Americans
 June 24, 2015 Trends in Homeownership and Mortgage Debt among Older Americans Office for Older Americans Presentation for MHA Trusted Advisors Note: This document was used in support of a live discussion.
NATIONAL SURVEY OF HOME EQUITY LOANS
 NATIONAL SURVEY OF HOME EQUITY LOANS Richard T. Curtin Director, Surveys of Consumers Survey Research Center The October 1998 WP51 The 1988, 1994, and 1997 National Surveys of Home Equity Loans were sponsored
and Financial Security
 3 Housing and Financial Security Housing costs typically represent the single largest expense for any household. Homeowners who pay off their mortgages before retirement, however, reduce those costs sharply.
Development of consumer credit in China
 Development of consumer credit in China Shen Bingxi and Yan Lijuan 1 Summary Consumer credit particularly personal consumer loans such as home mortgages and loans financing purchases of automobiles and
Is U.S. Household Savings Rate Dangerously Low?
 GLOBAL COMMENTARY July 22, 28 David Malpass 212-876-44 dmalpass@encimaglobal.com Is U.S. Household Savings Rate Dangerously Low? The front page of Sunday s New York Times highlighted the heavy household
Growing Wealth, Inequality, and Housing in the United States Zhu Xiao Di February 2007 W07-1
 Joint Center for Housing Studies Harvard University Growing Wealth, Inequality, and Housing in the United States Zhu Xiao Di February 2007 W07-1 by Zhu Xiao Di. All rights reserved. Short sections of text,
Spotlight on the Housing Market in the Orlando-Kissimmee-Sanford, FL MSA
 Spotlight on in Orlando-Kissimmee-Sanford, FL MSA The Orlando-Kissimmee-Sanford, FL Metropolitan Statistical Area (Orlando MSA) is located in central Florida and includes four counties: Lake, Orange, Osceola,
Pew Study: American Middle Class is Steadily Shrinking
 Pew Study: American Middle Class is Steadily Shrinking December 23, 2015 by Gary D. Halbert of ProFutures Investments IN THIS ISSUE: 1. Pew Research: American Middle Class is Steadily Shrinking 2. Pew
The Asset Price Meltdown and the Wealth of the Middle Class Edward N. Wolff New York University November 2013
 The Asset Price Meltdown and the Wealth of the Middle Class Edward N. Wolff New York University November 2013 Abstract: I find that median wealth plummeted over the years 2007 to 2010, and by 2010 was
Student Debt Being Smart about Student Loans
 Insight. Education. Analysis. S e p t e m b e r 2 0 1 4 Student Debt Being Smart about Student Loans By Kevin Chambers During the 2008 crisis, total American household debt fell. The amount of money borrowed
The Return of Saving
 Martin Feldstein the u.s. savings rate and the global economy The savings rate of American households has been declining for more than a decade and recently turned negative. This decrease has dramatically
Striking it Richer: The Evolution of Top Incomes in the United States (Update using 2006 preliminary estimates)
") Striking it Richer: The Evolution of Top Incomes in the United States (Update using 2006 preliminary estimates) Emmanuel Saez March 15, 2008 The recent dramatic rise in income inequality in the United
Striking it Richer: The Evolution of Top Incomes in the United States (Update using 2006 preliminary estimates) Emmanuel Saez March 15, 2008 The recent dramatic rise in income inequality in the United
Keywords: household wealth, inequality, racial inequality, portfolio composition JEL Codes: D31, J15
 The Asset Price Meltdown and the Wealth of the Middle Class Edward N. Wolff New York University August 26, 2012 Abstract In this study, I look at wealth trends from 1962 to 2010. The most telling finding
Summary. Abbas P. Grammy 1 Professor of Economics California State University, Bakersfield
 The State of the Economy: Kern County, California Summary Abbas P. Grammy 1 Professor of Economics California State University, Bakersfield Kern County households follow national trends. They turned less
A LIFE-CYCLE AND GENERATIONAL PERSPECTIVE ON THE WEALTH AND INCOME OF MILLENNIALS
 A LIFE-CYCLE AND GENERATIONAL PERSPECTIVE ON THE WEALTH AND INCOME OF MILLENNIALS William R. Emmons and Ray Boshara Young adulthood is the life stage when the greatest increases in income and wealth typically
Spotlight on the Housing Market in the Las Vegas-Henderson-Paradise, NV MSA
 Spotlight on the in the Las Vegas-Henderson-Paradise, NV MSA The Las Vegas-Henderson-Paradise, NV Metropolitan Statistical Area (Las Vegas MSA) is located at the southern tip of Nevada and contains the
Large and Small Companies Exhibit Diverging Bankruptcy Trends
 JANUARY, 22 NUMBER 2-1 D I V I S I O N O F I N S U R A N C E Bank Trends Analysis of Emerging Risks In Banking WASHINGTON, D.C. ALAN DEATON (22) 898-738 adeaton@fdic.gov Large and Small Companies Exhibit
Federal Reserve Bank of Kansas City: Consumer Credit Report
 Federal Reserve Bank of Kansas City: Consumer Credit Report Tenth District Consumer Credit Report May 29, 2015 By Kelly Edmiston, Senior Economist and Mwai Malindi, Research Associate FIRST QUARTER 2015
How To Understand The Wealth Gap Between Black And White Families
 FACT SHEET April 2014 The Racial Wealth Gap: African Americans Facts At A Glance The median wealth of White households is 20 times that of African American households. The growing racial wealth gap occurring
The Impact of Lock-In Effects on Housing Turnover and Implications for a Housing Recovery
 W RESEARCH BRIEF The Impact of Lock-In Effects on Housing Turnover and Implications for a Housing Recovery FEBRUARY 2014 TABLE OF CONTENTS SECTION I Introduction 3 SECTION II Background Lock-In Effects
A Beginner s Guide to the Stock Market
 A beginner s guide to the stock market 1 A Beginner s Guide to the Stock Market An organized market in which stocks or bonds are bought and sold is called a securities market. Securities markets that deal
Historically, employment in financial
 Employment in financial activities: double billed by housing and financial crises The housing market crash, followed by the financial crisis of the 2007-09 recession, helped depress financial activities
Equity Ownership in America
 Equity Ownership in America Investment Company Institute and the Securities Industry Association Equity Ownership in America Fall 999 Investment Company Institute and the Securities Industry Association
Lost Ground, 2011: Disparities in Mortgage Lending and Foreclosures. Debbie Gruenstein Bocian, Wei Li, Carolina Reid Center for Responsible Lending
 Lost Ground, 2011: Disparities in Mortgage Lending and Foreclosures Executive Summary Debbie Gruenstein Bocian, Wei Li, Carolina Reid Center for Responsible Lending Roberto G. Quercia Center for Community
ASSETS, CREDIT USE AND DEBT OF LOW-INCOME HOUSEHOLDS
 ASSETS, CREDIT USE AND DEBT OF LOW-INCOME HOUSEHOLDS By Marieka Klawitter and Colin Morgan-Cross, Evans School of Public Affairs, University of Washington Key Findings This report analyzes credit and debt
Employment in the United States is recovering slowly from the
 Employment Patterns During the Recovery: Who Are Getting the Jobs and Why? By Ayşegül Şahin and Jonathan L. Willis Employment in the United States is recovering slowly from the Great Recession. After declining
COMMON QUESTIONS ABOUT BANKRUPTCY
 SCUDDER G. STEVENS, P.A. ATTORNEYS AT LAW A PROFESSIONAL ASSOCIATION 120 North Union Street P.O. Box 1156 Kennett Square, PA 19348 (610) 444-9840 (800) 294-4242 FAX (610) 444-9841 COMMON QUESTIONS ABOUT
Federal Reserve Monetary Policy
 Federal Reserve Monetary Policy To prevent recession, earlier this decade the Federal Reserve s monetary policy pushed down the short-term interest rate to just 1%, the lowest level for many decades. Long-term
Federal Reserve Bank of New York Staff Reports
 Federal Reserve Bank of New York Staff Reports Household Debt and Saving during the 2007 Recession Rajashri Chakrabarti Donghoon Lee Wilbert van der Klaauw Basit Zafar Staff Report no. 482 January 2011
Special Report. December 16, 2009. pace of household borrowing.
 December 16, 29 HIGHLIGHTS Consumer credit is an important indicator of the level of household borrowing. Since peaking in 28, U.S. consumer credit has fallen by 3.8%, its largest decline since World War
Adecade into the 21st century, Michigan s longbruised
 Michigan League FOR Human Services December 2010 Michigan's Economy Continues to Cause Pain: Communities of Color Take a Harder Hit Adecade into the 21st century, Michigan s longbruised economy continues
The Effects of Funding Costs and Risk on Banks Lending Rates
 The Effects of Funding Costs and Risk on Banks Lending Rates Daniel Fabbro and Mark Hack* After falling for over a decade, the major banks net interest margins appear to have stabilised in a relatively
Distribution of Household Wealth in the U.S.: 2000 to 2011
 Distribution of Household Wealth in the U.S.: By Marina Vornovitsky, Alfred Gottschalck, and Adam Smith Household net worth, or wealth, is an important indicar of economic well-being in the United States.
OFFICE MARKET ANALYSIS SUBURBAN CHICAGO. According to Costar Property, the Suburban Chicago office market is distributed as follows:
 OFFICE MARKET ANALYSIS SUBURBAN CHICAGO Market Composition & Distribution According to Costar Property, the Suburban Chicago office market is distributed as follows: Office Submarket Cluster Distribution
Economic Outlook, November 2013 November 21, 2013. Jeffrey M. Lacker President Federal Reserve Bank of Richmond
 Economic Outlook, November 2013 November 21, 2013 Jeffrey M. Lacker President Federal Reserve Bank of Richmond Asheboro SCORE Asheboro, North Carolina It's a pleasure to be with you today to discuss the
Milwaukee s Housing Crisis: Housing Affordability and Mortgage Lending Practices
 Milwaukee s Housing Crisis: Housing Affordability and Mortgage Lending Practices by John Pawasarat and Lois M. Quinn, Employment and Training Institute, University of Wisconsin-Milwaukee, 2007 This report
LOAN APPROVALS, REPAYMENTS AND HOUSING CREDIT GROWTH 1
 LOAN APPROVALS, REPAYMENTS AND HOUSING CREDIT GROWTH Introduction The majority of household borrowing is for the purchase of existing or new housing. Developments in borrowing for housing are important
The pattern of wealth and income inequality during the. Top Wealth Shares in the United States, 1916 2000: Evidence from Estate Tax Returns
 Top Wealth Shares in the United States, 1916 2000 Top Wealth Shares in the United States, 1916 2000: Evidence from Estate Tax Returns Abstract - This paper presents new homogeneous series on top wealth
THE ECONOMIC PLIGHT OF MILLENNIALS
 THE ECONOMIC PLIGHT OF MILLENNIALS 6 EconSouth January April 2014 A demographic cohort is never monolithic, but the group that recently entered the labor force had one trait in common: they watched as
The Distressed Property Market and Shadow Inventory in Florida: Estimates and Analysis
 The Distressed Property Market and Shadow Inventory in Florida: Estimates and Analysis Introduction Florida was one of the states hardest hit by the real estate downturn. Delinquencies, foreclosures and
Chapter 13 Money and Banking
 Chapter 13 Money and Banking Multiple Choice Questions Choose the one alternative that best completes the statement or answers the question. 1. The most important function of money is (a) as a store of
Revisiting the Canadian Mortgage Market Risk is Small and Contained
 Revisiting the Canadian Mortgage Market Risk is Small and Contained January 2010 Prepared for: Canadian Association of Accredited Mortgage Professionals By: Will Dunning CAAMP Chief Economist Revisiting
ANALYSIS OF HOME MORTGAGE DISCLOSURE ACT (HMDA) DATA FOR TEXAS, 1999-2001
 DATA FOR TEXAS, 1999-2001") LEGISLATIVE REPORT ANALYSIS OF HOME MORTGAGE DISCLOSURE ACT (HMDA) DATA FOR TEXAS, 1999-2001 REPORT PREPARED FOR THE FINANCE COMMISSION OF TEXAS AND THE OFFICE OF CONSUMER CREDIT COMMISSIONER BY THE TEXAS
LEGISLATIVE REPORT ANALYSIS OF HOME MORTGAGE DISCLOSURE ACT (HMDA) DATA FOR TEXAS, 1999-2001 REPORT PREPARED FOR THE FINANCE COMMISSION OF TEXAS AND THE OFFICE OF CONSUMER CREDIT COMMISSIONER BY THE TEXAS
THE FINANCIAL CRISIS: Is This a REPEAT OF THE 80 S FOR AGRICULTURE? Mike Boehlje and Chris Hurt, Department of Agricultural Economics
 THE FINANCIAL CRISIS: Is This a REPEAT OF THE 80 S FOR AGRICULTURE? Mike Boehlje and Chris Hurt, Department of Agricultural Economics The current financial crisis in the capital markets combined with recession
Consumer Credit Worldwide at year end 2012
 Consumer Credit Worldwide at year end 2012 Introduction For the fifth consecutive year, Crédit Agricole Consumer Finance has published the Consumer Credit Overview, its yearly report on the international
CREDIT UNION TRENDS REPORT
 CREDIT UNION TRENDS REPORT CUNA Mutual Group Economics June 2 (April 2 data) Highlights During April, credit unions picked up 3, new memberships, credit union loan balances grew at an annualized 1.7% pace,
From Widening Deficits to Paying Down the Debt: Benefits for the American People
 From Widening Deficits to Paying Down the Debt: Benefits for the American People August 4, 1999 Office of Economic Policy U.S. Department of Treasury From Widening Deficits to Paying Down the Debt: Benefits
Wealth Inequality and Racial Wealth Accumulation. Jessica Gordon Nembhard, Ph.D. Assistant Professor, African American Studies
 Wealth Inequality and Racial Wealth Accumulation Jessica Gordon Nembhard, Ph.D. Assistant Professor, African American Studies Wealth Inequality Increasing Media attention World wealth inequality (UNU-
THE MORTGAGE INTEREST DEDUCTION ACROSS ZIP CODES. Benjamin H. Harris and Lucie Parker Urban-Brookings Tax Policy Center December 4, 2014 ABSTRACT
 THE MORTGAGE INTEREST DEDUCTION ACROSS ZIP CODES Benjamin H. Harris and Lucie Parker Urban-Brookings Tax Policy Center December 4, 2014 ABSTRACT This brief examines characteristics of the mortgage interest
Student Loan Borrowing and Repayment Trends, 2015
 Student Loan Borrowing and Repayment Trends, 2015 April 16, 2015 Andrew Haughwout, Donghoon Lee, Joelle Scally, Wilbert van der Klaauw The views presented here are those of the authors and do not necessarily
Why Did House Prices Drop So Quickly?
 Why Did House Prices Drop So Quickly? David Barker April 26, 2009 Summary: After a long period of stability which ended in the early 1990s, U.S. house prices rose for more than a decade, then suddenly
Investment Symposium March 14-15, 2013 New York, NY. Session E5, U.S. Economic Conditions and the Housing/Mortgage Market
 Investment Symposium March 1-15, 213 New York, NY Session E5, U.S. Economic Conditions and the Housing/Mortgage Market Moderator: Jonathan Glowacki Presenter: David Berson Housing & Mortgage Market Outlook
The IRA Investor Profile: Traditional IRA Investors Activity, 2007 2013
 ICI RESEARCH REPORT The IRA Investor Profile: Traditional IRA Investors Activity, 2007 2013 July 2015 The IRA Investor Database The Investment Company Institute and the Securities Industry and Financial
Composition of Farm Household Income and Wealth
 Composition of Farm Household Income and Wealth Today it is rare for any household to receive all of its from a single source. Even when only one household member is employed, it is possible to earn from
The question of whether student debt levels are excessive
 College on Credit: How Borrowers Perceive Their Education Debt By Sandy Baum and Marie O Malley Sandy Baum is professor of economics at Skidmore College in Skidmore, PA. Marie O Malley is vice president
The Obama Administration s Efforts To Stabilize The Housing Market and Help American Homeowners
 The Obama Administration s Efforts To Stabilize The Housing Market and Help American Homeowners July 2014 U.S. Department of Housing and Urban Development Office of Policy Development and Research U.S
BORROWER IN DISTRESS: A Survey on the Impact of Private Student Loan Debt
 May 2013 BORROWER IN DISTRESS: A Survey on the Impact of Private Student Loan Debt an issue brief by BORROWER IN DISTRESS Executive Summary For most, a college degree is a path to economic security. These