|
|
|
- Eustacia Eaton
- 8 years ago
- Views:
Transcription
1

2
3

4
5
6

7

8

9
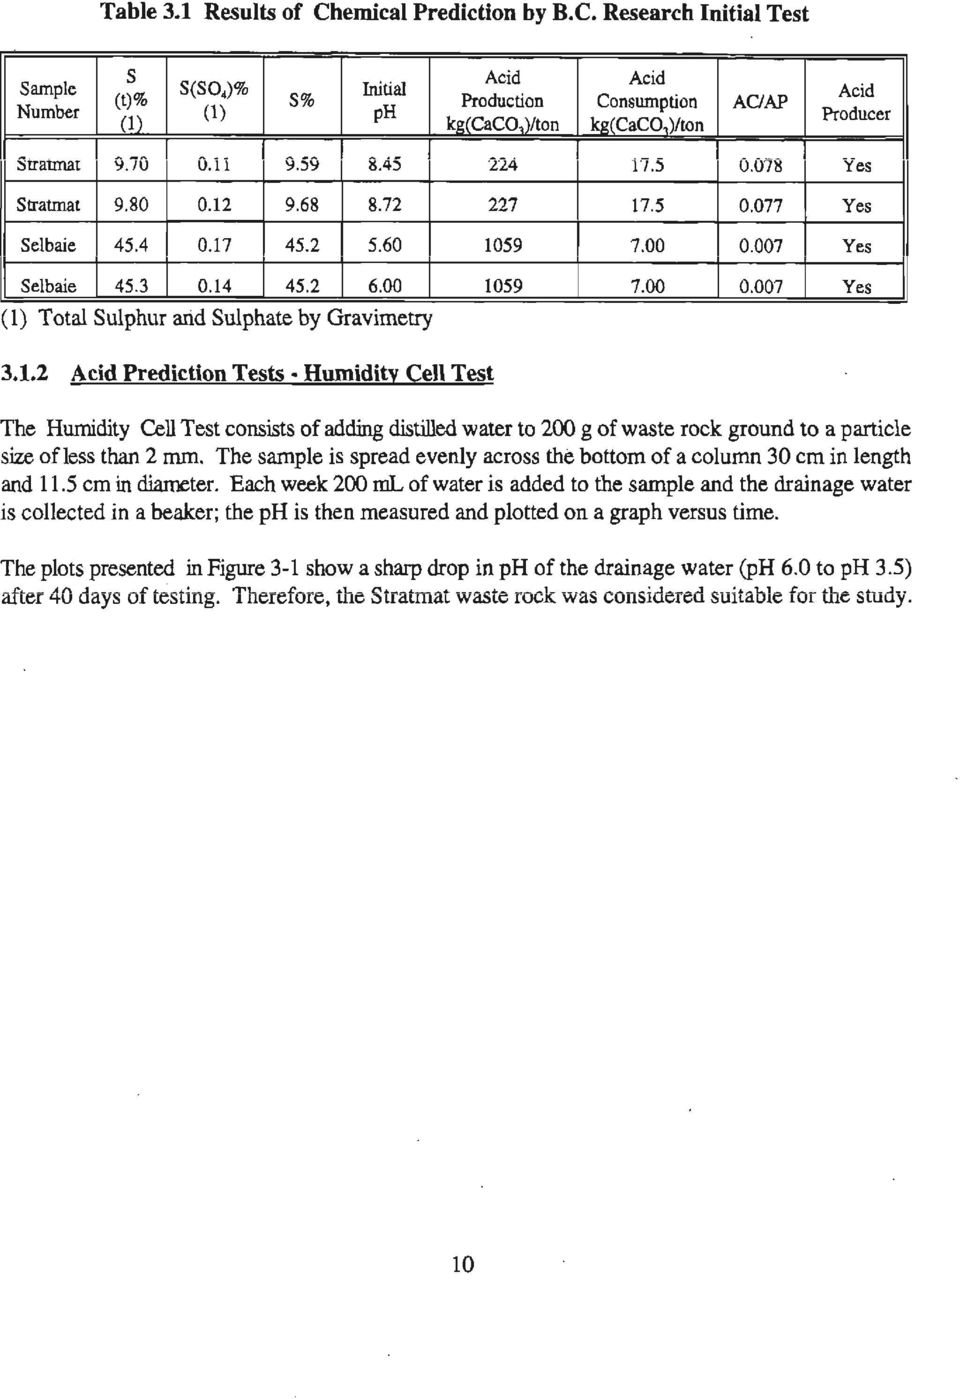
10

11
12
13

14

15
16

17
18
19

20

21
22
23
24
25 In addition, a control wood bark test (without rock) was installed 10 weeks after all the other tests had begun. This control test consisted of approximately 10 kg of uncompacted wood bark placed in a 22-litre plastic pail. A drainage outlet, installed at the bottom of the pail, allowed drainage water to be collected in a receiving bucket. The receiving bucket was sampled in a similar manner to those of the outdoor lysimeters Laboratorv Column Tests The laboratory columns were constructed from standard 15 cm diameter PVC pipe. The pipe was cut in 100 cm lengths and one end was sealed with a standard PVC cap. A hole was drilled in the bottom of the column and a 0.95 cm inch) male adapter compression fitting was installed. A geotextile filter cloth was placed at the bottom of the column to prevent plugging of the drain and a water trap was installed between the male adapter and the receiving container to prevent oxygen from entering through the drain tube. The columns were then with 20 kg of waste rock of the total volume). Finally, a 1-litre receiving bottle was used to collect the drainage water. The waste rock in each column was subjected to cycles of eight weeks of wet condition followed by eight weeks of dry condition. For comparison of the indoor column and outdoor lysimeter tests, the amount of water added as rain was calculated from the average annual precipitation of the nearby municipality of Dorval, This annual precipitation is mm or 18.2 mm per week. During the wet period, therefore, 650 of distilled water was added to each column every week. Weekly sampling of drainage water involved measuring the total volume of water, determining the and total acidity (mg of as well as taking two 200 unfiltered subsamples, one acidified with hydrochloric acid for a final acid concentration of 2% (for ions analysis) and one acidified (for total organic carbon and chloride determinations). After sampling, each receiving bucket was cleaned, rinsed with distilled water and re-connected to the column. All the subsamples from Stratmat control, limestone addition 1% and 3% and water cover tests collected during the second and seventh week of every eight week wet period were submitted for metal and non-metal analysis. In addition, subsamples from the other preventing techniques collected during weeks 1, 35, 41, 101, 105, 148 and 153 were also analysed for metals and non-metals. Drainage water samples from week 150 and 153 were analysed for and conductivity. The Stratmat waste rock column tests started on July 4, 1991 with first samples taken on July 11, The Selbaie tests, on the other hand, were started on August 8, 1991 with first samples taken on August 16,
26 The installation of the laboratory column experiments was also in triplicate and consisted of the following: Stratmat Waste Rock Control Consisted of 20 kg of crushed waste rock as received (no cover, no additive). 1% Phosphate Rock Addition Consisted of 200 g of phosphate rock mixed with 20 kg of waste rock during filling of lysimeter. 3% Phosphate Rock Addition Consisted of 600 g of phosphate rock mixed with 20 kg of waste rock during filling of lysimeter. 1% Limestone Addition Consisted of 200 g of limestone mixed with 20 kg of waste rock during filling of lysimeter. 3% Limestone Addition Consisted of 600 g of limestone mixed with 20 kg waste rock during filling of lysimeter. Wood Bark Cover Consisted of a 15 cm layer of wood bark years old from James Industries Inc. Approximately 900 g of uncompacted wood bark layer was placed as received directly on 20 kg of waste rock. Soil Cover Consisted of a cover: a top layer of 7.5 cm of tine sand (2.0 kg), a middle layer of 15 cm of compacted, nearly fully saturated clay (3.6 kg) and a bottom layer of 7.5 cm of coarse sand (2.0 kg). The clay was compacted in six 2.5 cm lifts directly in the column. Unlike the outside drums, the small size of the laboratory columns did not permit compaction to the same specifications. Water Cover Consisted of 1.0 m of water over 20 kg of waste rock. The depth of water was maintained constant by using the same arrangements as the outside tests. Selbaie Waste Rock Control added). Consisted of 20 kg of crushed waste rock as received (no cover or ameliorant 3% Rock Addition Consisted of 600 g of phosphate rock mixed with 20 kg of waste rock during filling of lysimeter. A control wood bark test (without rock) was installed on 20 March, 1992 in the same manner as the outdoor tests. 18
27 3.3.3 Evaluation The tests ended June 17, 1994 after 3 years of testing. Only the indoor tests were submitted to the post-testing evaluation. One column from each triplicate set was dismantled and the rocks split in three sections: top, middle and bottom. For each section, 25% of the rocks were frozen for possible future examination. The remaining 75% was washed with deionized water until the resulting gave an acidity concentration close to the detection limit of 10 of All the samples obtained from the washing of rocks a particular column were combined 15 L) for ICP scan and ferric iron determination. The density of the washed rocks was also measured. A sample of washed rocks from the Stratmat Control, Selbaie Control and the water covered Stratmat columns were examined by scanning electron microscopy at the University of Western Ontario to obtain information on the degree of alteration of the sulphide minerals. The rock samples were also analysed using petrographic methods. Mercury intrusion porosity was conducted on the Stratmat Control, Selbaie Control and the water covered Stratmat rocks. 4.0 RESULTS The total cumulative acid production for each test is graphed in Figures and 4-3. The data indicate some variations in the triplicates. The calculated Relative Standard Deviation (R.S.D.) averaged 49% for the outdoor tests and 33% for the indoor tests. The higher variation for outdoor triplicate tests was probably induced by natural weather. The limestone-amended indoor and outdoor tests showed the highest variation of R.S.D. ranging from 65% to 138%; however, the other techniques, such as phosphate addition and covers application, resulted in R.S.D. ranging from 5.8% to 106%. Differences between replicate tests may have been due to slight variations in the mixing of the chemical amendments or in the placement of the cover; even the control tests conducted with well homogenized waste rocks resulted in R.S.D. values ranging from 3.6% to 55%. The magnitude of the variation within a single set of replicates suggest that small differences in acid production between prevention techniques may not be significant. The average acid generation rates and the average percent acid reductions covering the entire 3 year period of testing are summarized in Table The results indicated that indoor and outdoor tests showed the same trend. The best prevention technique tested was found to be the water cover with an acid reduction of more than followed by the limestone addition with an acid reduction of 94% to 98% acid reduction for 3% dosage rate and 82% to 84% for 1% dosage rate. The soil cover results showed 98% acid reduction in the indoor tests and 46% in the outdoor tests. Deterioration of the soil cover by natural weather is probably responsible for the reduced effectiveness observed in the outdoor tests. The phosphate addition and the wood bark cover had only marginal effect on acid reduction. 19
28 TABLE 4.1 Average Weekly Acid Production in mg of CaC03 per kg of Waste Rock LAB TESTS OUTSIDE TESTS STRATMAT WASTE ROCK SELBAIE WASTE ROCK STRATMAT WASTE ROCK SELBAIE WASTE ROCK acid acid (CaC03) reduction (CaC03) reduction acid acid (CaC03) reduction (CaC03) reduction % PHOSPHATE 111 I 10.0% I I % 3% PHOSPHATE % % 1% LIMESTONE % 3% LIMESTONE % I I % WOOD BARK % % WATER 0.40 I I I % Shading areas indicate oxidation rate and acid reduction that included oxidation product stored in the laboratory columns
29 Approximately 40 and 200 L of drainage water were collected during the testing period for the indoor and outdoor tests, respectively. Samples of the drainage water were preserved and submitted to metal and non-metal determinations. The results are presented in Appendix A (Tables I to LXI). Metal and non-metal concentrations of the indoor tests were measured only on collected in the second and seventh week of every eight week washing period while acidity was determined every week. To obtain a reasonable of the sulphate, iron or zinc, the acidity measured plotted versus the measured concentrations of the ions mentioned previously and a strong correlation resulted. This correlation was used to calculate sulphate, iron and zinc concentrations in samples not submitted to ICP analysis and the total loading calculated. Detailed results for each acid prevention technique are described in this section. 21
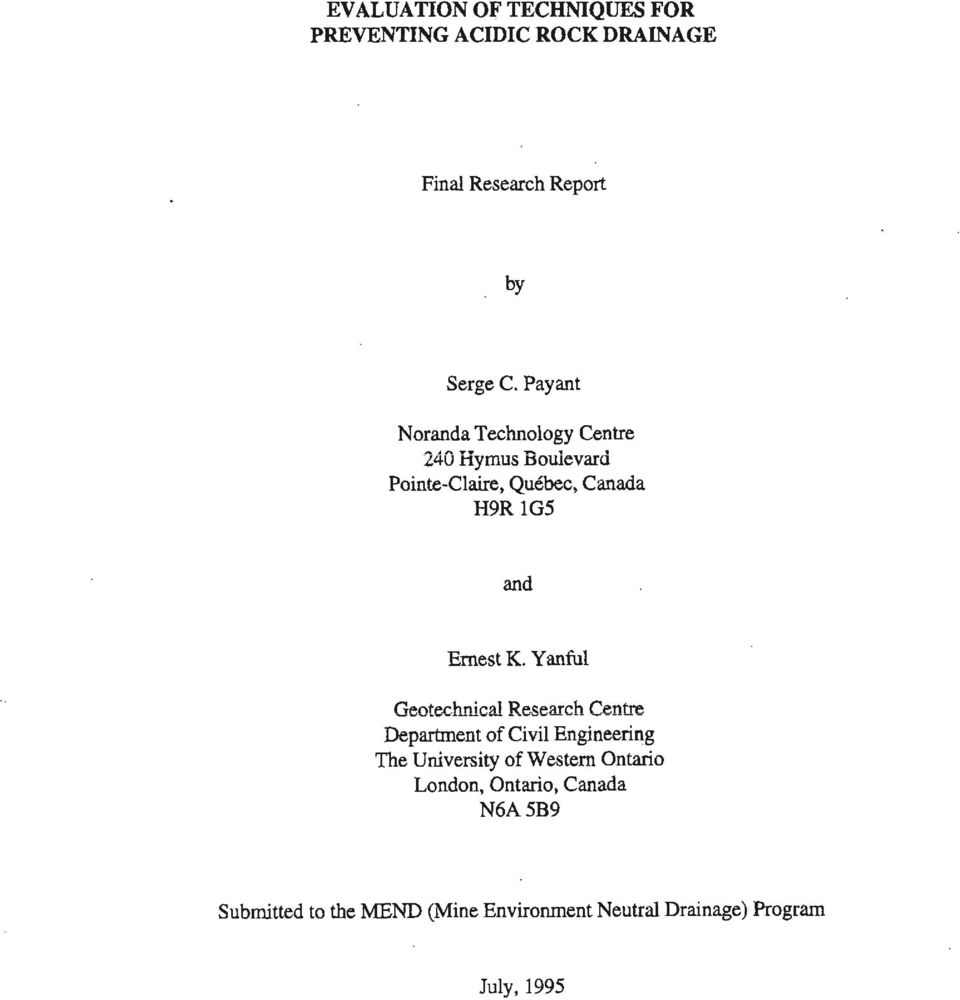
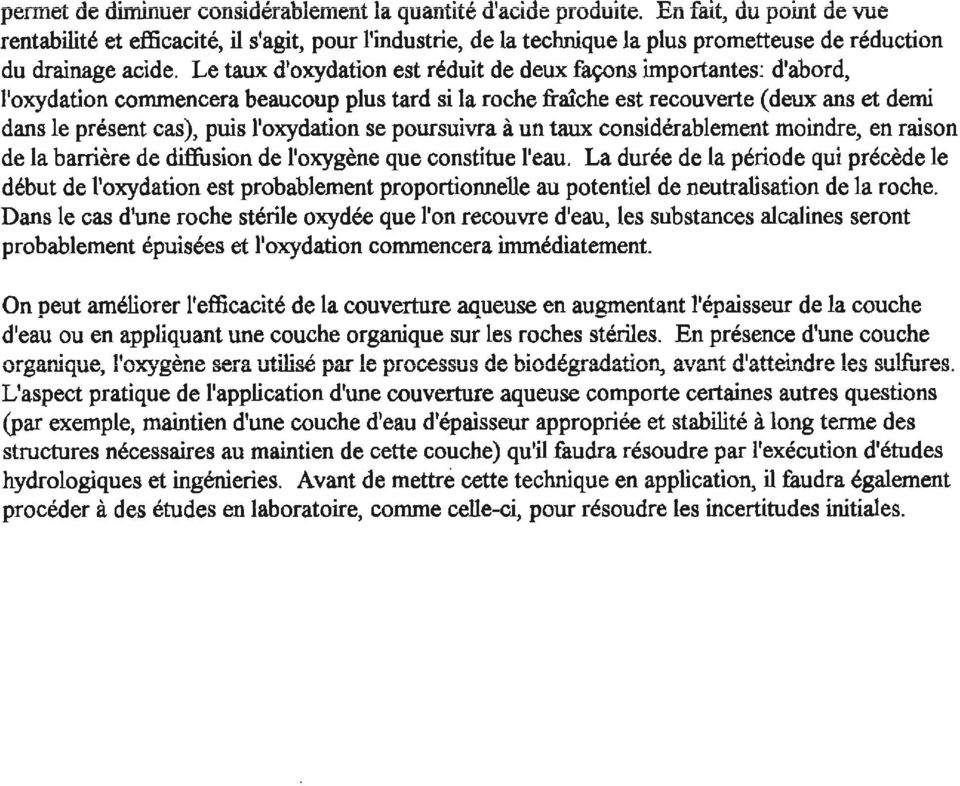
30 600 INDOOR STRATMAT CUMULATIVE ACIDITY 600 CONT 3% P 1% Ca 3% Ca BARK CLAY WATER ACIDITY IN DRAINAGE WATER (154 WEEKS) CONT. l%p BARK CLAY WATER ACIDITY STORED IN THE COLUMNS Figure 4-l : Acidity produced in indoor Stratmat tests 22
31 ACIDITY (g CaC03) CUMULATIVE ACIDITY (g of CaC03)
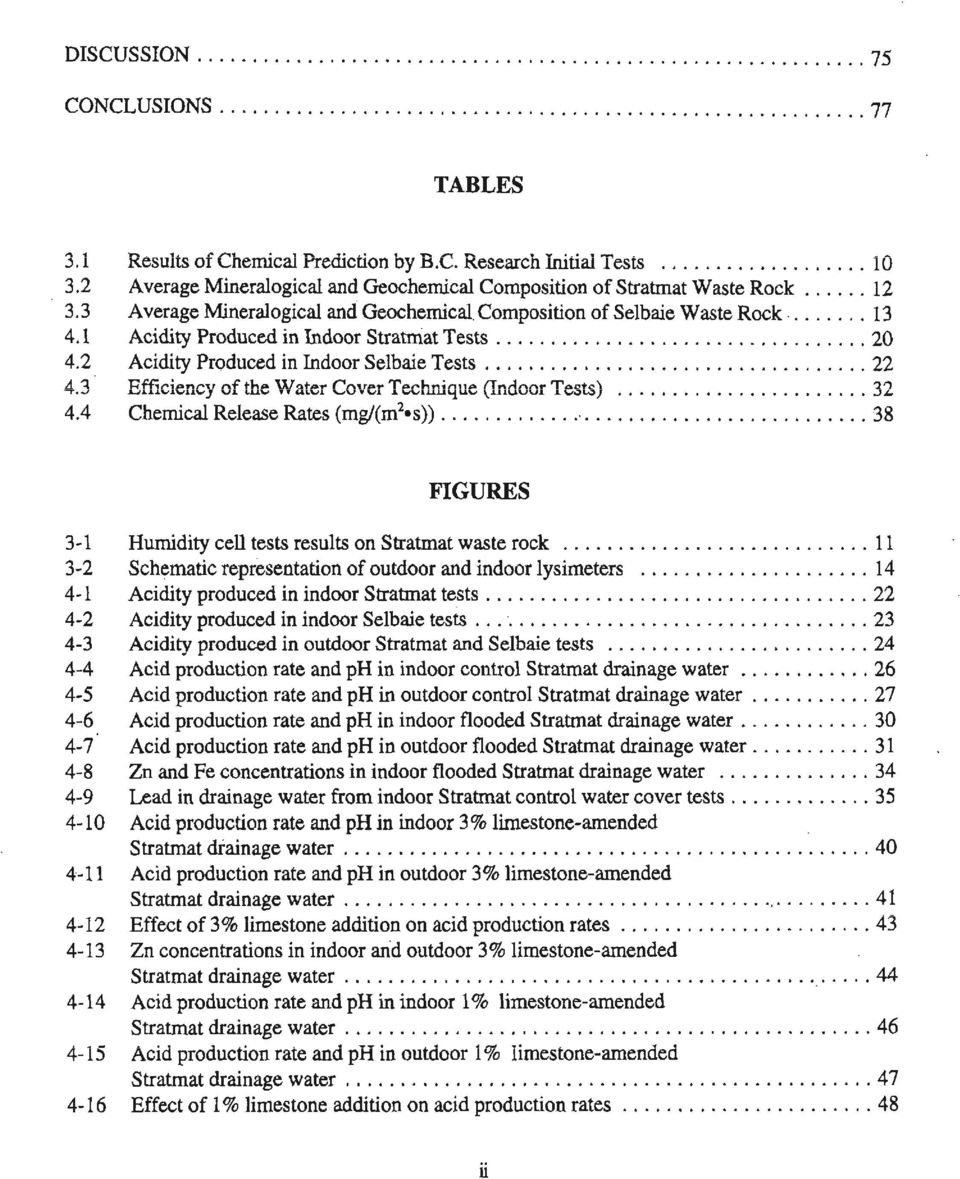
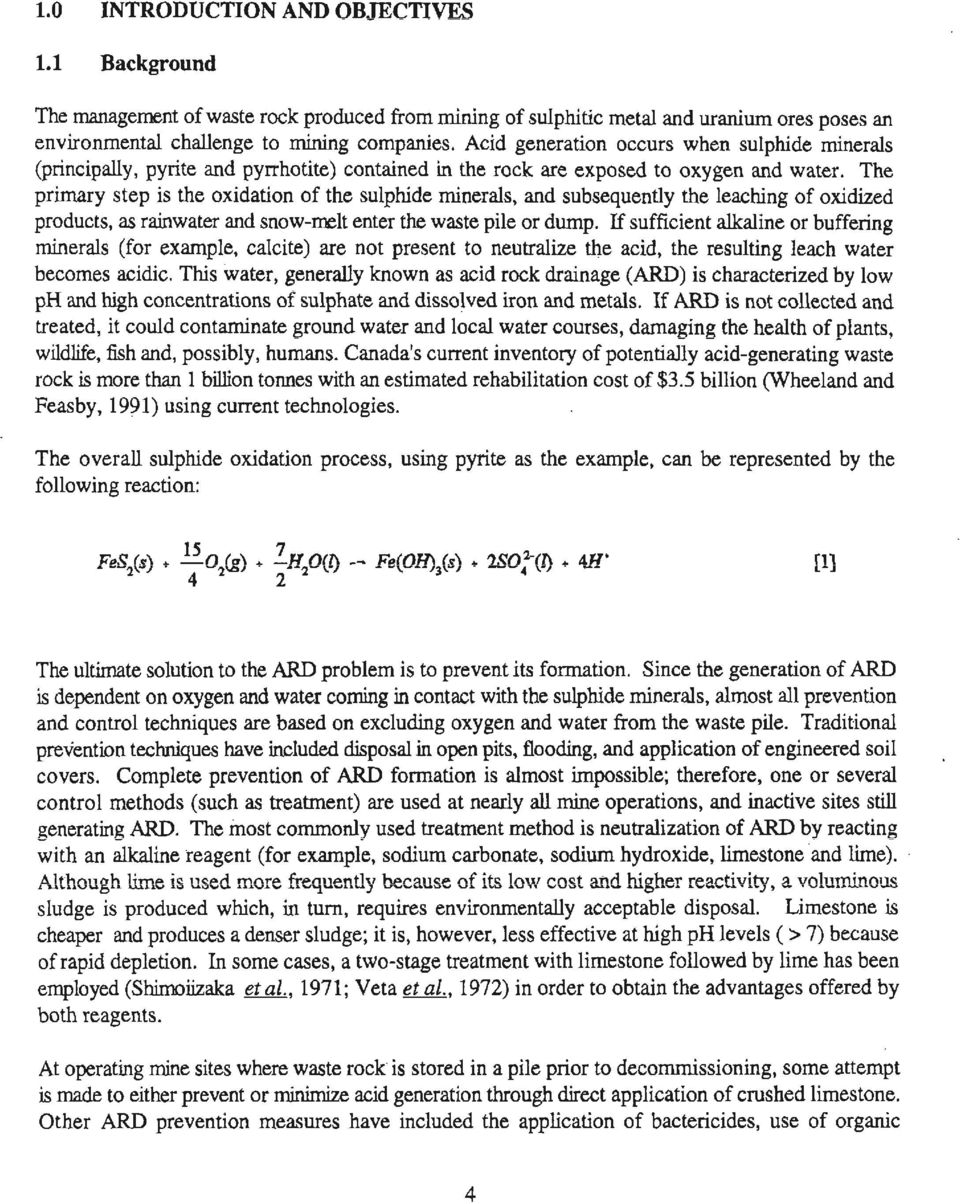
32 OUTDOOR STRATMAT CUMULATIVE ACIDITY CONT 1% Ca BARK CLAY WATER ACIDITY IN DRAINAGE WATER (125 WEEKS) 3000 OUTDOOR CUMULATIVE ACIDITY CONTROL ACIDITY IN DRAINAGE WATER (115 WEEKS) Figure 4-3: Acidity produced in outdoor Stratmat and Selbaie tests 24
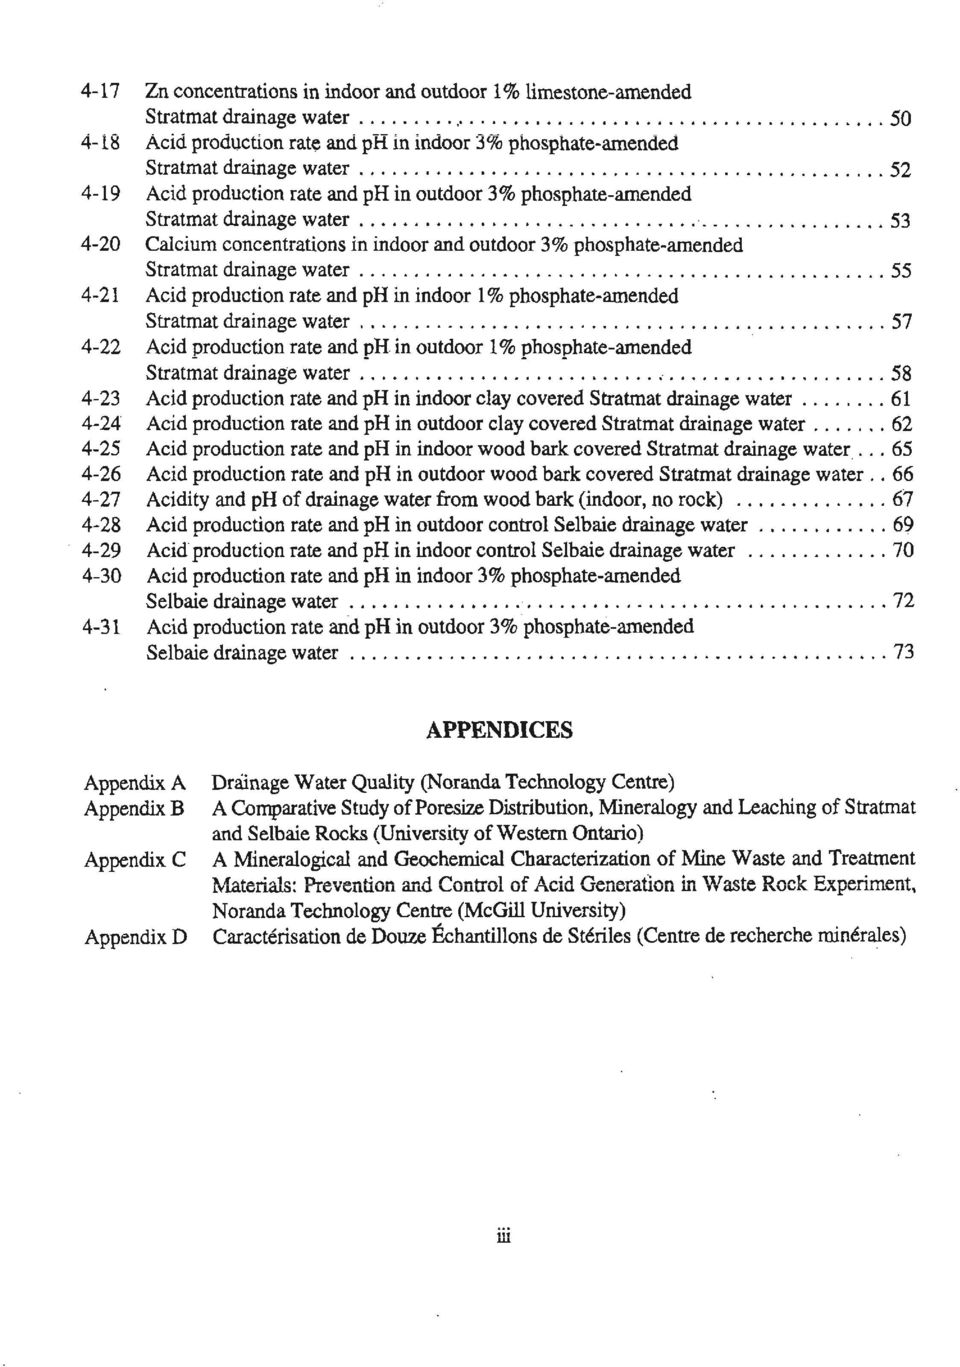
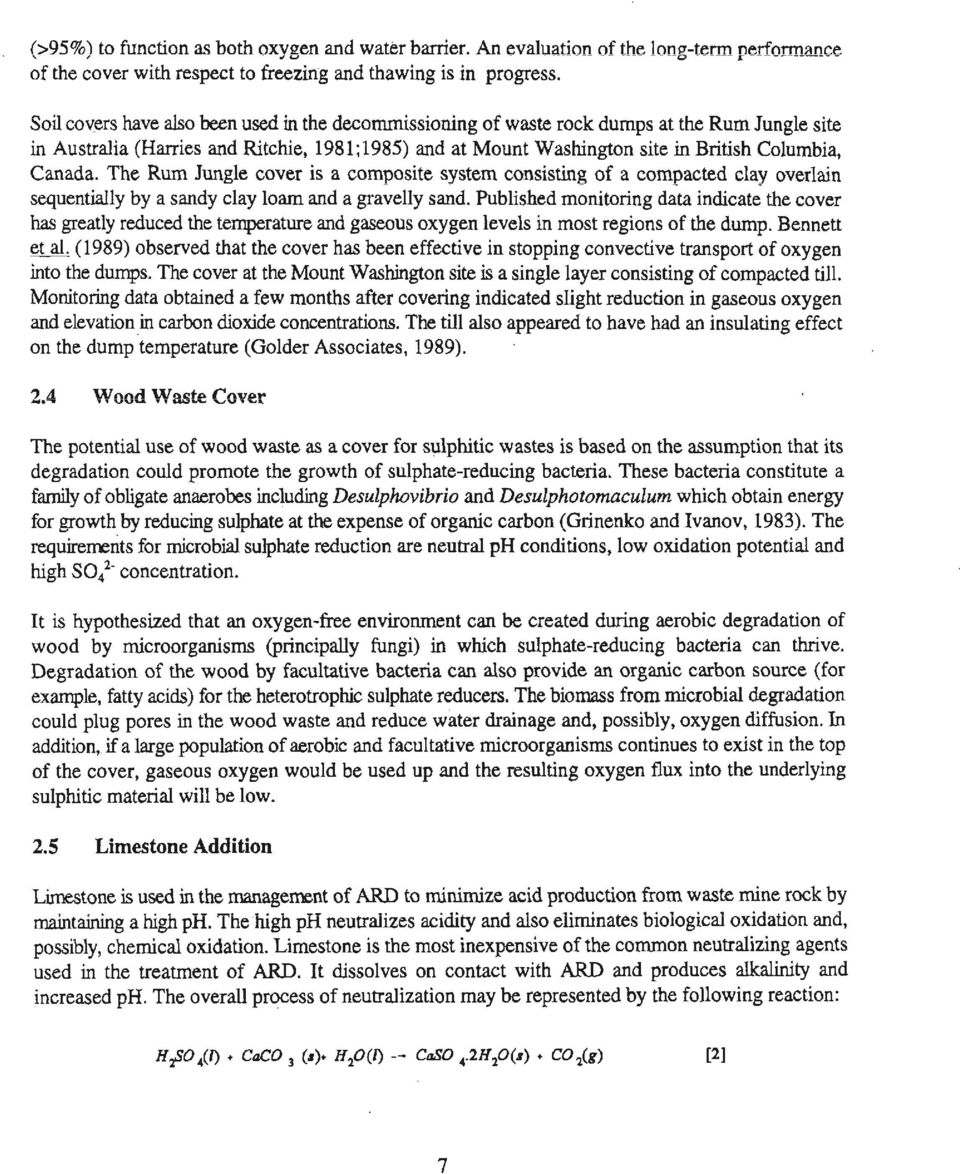
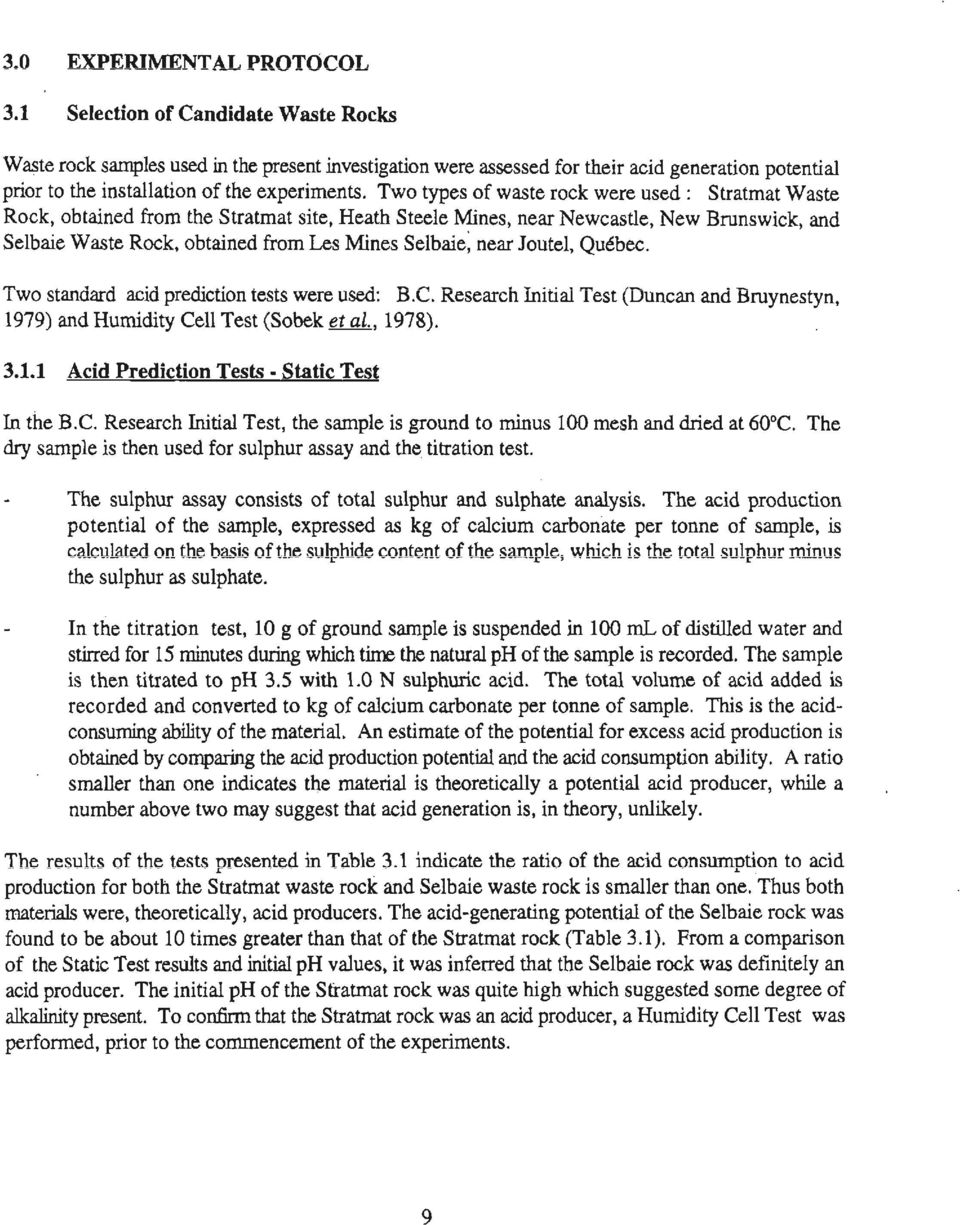
33 4.1 Stratmat Control Results Acid production rate and The acidity measured in the drainage water from the indoor Stratmat control columns averaged 380 g of In addition, an acidity of 21 g of was measured as the oxidation product stored in the columns during the testing period, giving a total acid production of 401 g of The average acid production rate was calculated at 130 mg of during a testing period of 154 weeks. The outdoor Stratmat waste rock produced an average of 872 g of the average acid production rate was calculated at 41 mg of for a testing period of 125 weeks. The amount of pyrite oxidized in the indoor tests was calculated to be 320 g based on acidity measurements and 305 g based on released. This represents approximately 7.5% of the pyrite initially present in the waste rock. The same calculation done for the outdoor tests resulted in 2.1% of the pyrite being oxidized during the testing period. The results indicate that the oxidation of the waste rock was 68% slower in the outdoor tests; variation in temperature is the most probable reason for the lower acid production rate outdoors. Acid production rates versus time for indoor and outdoor tests are presented in Figures 4-4 and 4-5, respectively. The drainage water from the indoor tests started generating acidity early in the study and the dropped rapidly to 2.0. After 25 weeks, the acid production rate was near 100 mg of as shown in Figure 4-4. The acid production rate then remained constant from week 25 to the end of the study (week 154). Figure 4-5 shows that the oxidation stopped completely during the winter time. In addition, the outdoor waste rock tests did not generate significant acidity during the first summer and the remained between 3.0 and 4.0. The acid production rates of the waste rock in outdoor tests during the summer months of the second and third year were similar to the acid production rates of the waste rock of the indoor tests at respectively, 100 mg of and 135 mg of 25
34 200 CONTROL STRATMAT INDOOR Id8 TIME (weeks) TIME (weeks) Figure 4-4: Acid production rate and in indoor control Stratmat drainage water 26
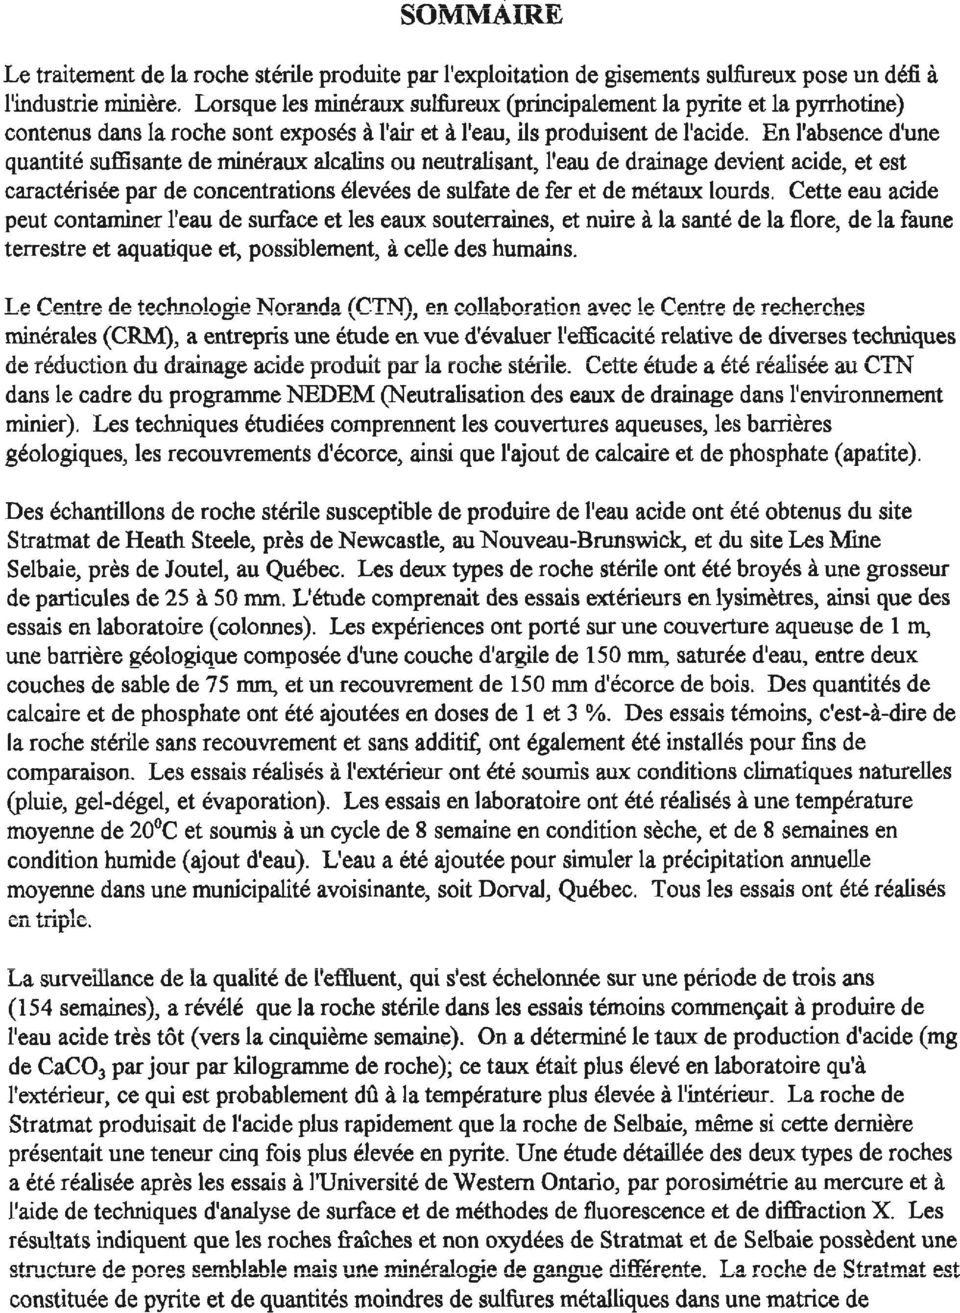
35 200 CONTROL STRATMAT OUTDOOR July 91 Nov 91 April 92 Nov 92 April 93 Nov 93 MONTH STRATMAT CONTRO 0 I I TIME (weeks) Figure 4-5 : Acid production rate and in outdoor control Stratmat drainage water 27
36 Metals and non-metals released The complete chemical analysis results are presented in Appendix A, Tables I to III and to Metals in the indoor and outdoor drainage waters were detected as early as the first week; however, the metal concentrations in the outdoor tests remained low throughout the first summer, as observed for the acidity results shown in Figure 4-5. The metal concentrations increased rapidly in the indoor tests and stabilized around week 25. The major metals released indoor were: Fe ( Al ( and Zn ( Other species detected were SO, ( Mg ( Ca ( Mn (15 50 As (10 25 and Si (40 The drainage water for the outdoor tests showed wider variation in concentrations due to seasonal temperature changes, but the same species were present at similar concentrations during peak acid production rate which took place during summer time. A few samples of drainage water were analysed for the results indicated that an average of 92% of the Fe was oxidized to (ferric state) Results The amount of acidity stored in the indoor columns was 21 g of this amount of acidity was added to the acidity measured in the drainage water to calculate the average total cumulative acidity and the average acid production rate. The metal and non-metal loadings stored in the columns are presented in Appendix A, Table LXI. The density profile of the waste rock showed that the surface rocks were slightly denser (2.98 g/cc) compared to the bottom rocks (2.74 g/cc). This suggests that the sulphide content of the bottom rocks was slightly lower than that of the surface rocks. This may have been due to the column configuration (Figure 3-2): reduced drainage of percolating acid at the bottom of the column may have provided a longer contact time of the acid water with the bottom rocks and could have led to a greater dissolution of sulphide minerals. 4.2 Stratmat Water Cover Results The water cover on Stratmat waste rock was found to be the most efficient technique tested. Unfortunately, the outdoor lysimeters were severely damaged during the first winter, two lysimeters were tom and the bottom valve of the third one was broken because of freezing. The outdoor column water cover was therefore lost during the first winter. The lysimeters were repaired and refilled immediately with water to oxidation. To avoid further damage during the following winter, the lysimeters were drained at the end of the fall; the water was kept and then returned to the lysimeters the following spring. In addition, from June 1993 to the end of the study (November
37 for the outdoor tests), no drainage water was collected from the water cover tests because of warm, dry weather which resulted in more evaporation than precipitation. Analysis of the water cover technique presented in this report was based mainly on the indoor tests because of the above limitations in the outdoor tests. In addition, the laboratory offered a much better environment for controlling parameters such as temperature, precipitation, evaporation and collection of the samples. Nevertheless, partial outdoor results were collected and are presented in this section. Acid production rate and The indoor water covered columns produced an average of 2.44 g of including the acidity stored in the water cover. However, the acidity from the water covered columns (indoor and outdoor) was highly overestimated because the level of acidity in the effluent was normally below the detection limit of the titration technique for measuring acidity. The detection limit was 50 of for the first 69 weeks, based on manual titration; a more accurate method using an automatic titrator subsequently gave a lower detection limit of 10 of The acidity of the drainage water from the water covered column was found to be below this limit as well. For a conservative estimate, the calculations assumed a value at the detection limit when no acidity was detected by either titration method, This means that, for the first one and a third years,, the acidity was overestimated at least five-fold. The acidities presented in this report for water covered columns are therefore considered as maximum possible values. 154 weeks, the average total acidity from the control columns (load in drainage water plus load stored) was calculated to be 401 g ; the average total (overestimated) acidity from the water covered columns was calculated to be 2.44 g This represents a minimum efficiency of 99.5% in reducing acidity in the effluent (see Table 4.2). The acid production rate from the water covered rocks was below 1 mg of for the indoor and the outdoor tests. Figures 4-6 and 4-7 show that the acid production rate and were generally constant throughout the testing period and did not change significantly toward the end of the tests. The of the drainage water remained around
38 STRATMAT WATER COVER INDOOR -- CONTROL WATER COVER TIME (weeks) WATER COVER TIME (weeks) Figure 4-6: Acid production rate and 30 in indoor flooded Stratmat drainage water
39 1000 STRATMAT WATER COVER OUTDOOR - CONTROL WATER COVER I I I I I July91 April 92 April 93 MONTH TIME (weeks) Figure 4-7: Acid production rate and 31 in outdoor flooded Stratmat drainage water
40 Metals and non-metals released The complete chemical analysis results are presented in Appendix A, Tables X to XII and XL to XLII. Table 4.2 shows the total release of the components considered most important in this investigation. The average percent decrease in release from the water covered columns (load in drainage water + load in cover water) over the control is also displayed for each component. Table 4.3 Efficiency of the Water Cover Technique (Indoor Tests) Acidity Fe I I I I I of I I I I CONTROL Drainage I Stored 21.2 I WATER COVER Drainage Water Cover REDUCTION 99.4% 97.9% 99.9% 97.2% The ion concentrations in the effluent from the water covered columns did not vary as much as those in the control tests, and could simply be averaged over each sampling set to obtain a reasonable estimate of the release rate. Also, since the acidity of the water covered columns was normally below the detection limit, it was impossible to obtain a correlation between acidity and other species, as was the case in the control tests. The total mass of released acidity, Fe, Zn and SO, for both the water cover and control columns is presented in Table 4.2; they show that the acidity, Fe, Zn and loading from the water covered columns is much smaller than that from the control columns. It is clear from the data presented in Table 4.2 that it is important to consider the amount of oxidation product retained in the water cover itself (water column above the waste rock). The mass of acidity, Fe, Zn and measured in the water cover and in the drainage water are of the same order of magnitude.. Figure 4-8 shows the release of Zn and Fe from the water covered test columns over time. Fe and Zn concentrations in the effluent the water covered columns did not exceed 1.O until after one full year (Figure 4-8). Between 1 to 2 years, the concentrations of Fe and Zn remained between 1.0 and 4.0 From week 122, to the next sampling at week 131, the average Fe and Zn concentrations more than doubled, and subsequently remained high. At the last sampling (week the average concentration had reached 4.7 for Fe and 6.6 for Zn. In comparison, average Fe and Zn concentrations from the control test effluents ranged, respectively, from 2000 to 4000 and from 50 to 200 and were at 1880 and 86 at the last sampling. 32
41 From Figure 4-8, it seems there are two separate rates of and Fe release from the water columns. The first rate is constant until approximately 122 weeks of operation, while the second rate is active from week 122 to the end of the test. The two rates will be discussed further in this section of the report. 33
42 STRATMAT WATER COVER INDOOR 10 REPLICATE REPLICATE REPLICATE TIME (weeks) 8 REPLICATE REPLICATE REPLICATE I,. 80 TIME Figure 4-8: Zn and Fe concentrations in indoor flooded Stratmat drainage water 34
43 Lead release pattern was difficult to explain. Figure 4-9 shows that the concentration of released from the water cover columns generally followed the same trend observed for Fe and Zn. was detected in the drainage water around week 120 at an average concentration of approximately 2.0 On the other hand, the control tests started generating Pb during the first month of the study, as observed for Fe and Zn. Whereas the mass of Fe and Zn produced by the water cover was only a fraction (1%) of the mass produced in the control tests, even with the stored oxidation product, the water cover tests produced 5 times more Pb than the control tests. The average mass of Pb including stored material was 38 mg for the control tests and 188 mg for the water cover tests. The rapid but early and short release of Pb from the control tests suggests that a soluble Pb mineral was probably initially present in the rock. The Pb released from the water covered rock was most likely a result of oxidation, as was observed for Fe and Zn. The outdoor tests showed the same tendency, as indicated in Tables and XL in Appendix A Figure TIME (weeks) Lead in Drainage Water from Indoor Stratmat Control Water Cover Tests In addition, flushing time was long because of the large volume of water stored in the water covered column; actually only 1.6 cover volumes of drainage were collected during the 154 weeks of testing. It was therefore unlikely that the sudden release of metals would have been due to flushing of initial pore water. 35
44 Dissolved in Water Cover The dissolved oxygen (DO) concentration in the Indoor water covers was measured regularly after 130 weeks of operation, both at the surface of the water and near the waste rock-water interface. The DO concentrations ranged from 6.1 to 7.4 near the surface and from 5.9 to 7.3 near the bottom of the cover. These DO concentrations are equivalent to about 75% saturation. The observed range in DO concentrations indicates a gradient of 0.1 to 0.2 per metre between the top and bottom of the water cover and it was found to be consistent in all the three water covered columns. This gradient cannot be used for flux calculations as the precision of the DO meter is of 0.1 and is not considered accurate enough for measurements of such small differences. Rate Calculations Morin (1993) has proposed equations for calculating the flux of oxygen into waste rock. The equations assume that the oxidation reaction is first order with respect to dissolved oxygen concentration, and that the dissolved oxygen concentration in the water cover is homogeneous and saturated throughout its depth. This is true only in well-mixed or well-aerated water covers. Other tests, using a 1 m water cover over tailings (St-Arnaud, 1994) have shown a DO gradient from 5.5 at the water surface, to 1.8 near the tailings surface. The following equations can be found in either Morin (1993) or Lapakko ( 1994): (l-n) d J = PR = 36
45 where: k n %PYR d J DO(cover) D T PR FACT first order rate constant porosity (volume over volume) percentage of pyrite in rock [ 19 %] representative particle diameter (m) to oxygen flux at the water/waste rock interface (mg 0, dissolved oxygen concentration in water cover (mg assuming homogeneity throughout depth) dissolved oxygen diffusion coefficient (2x tortuosity (assume 3 for rock) production rate of acid, Fe or SO, (mg stoichiometric factor which, when equation 1 is affecting the system is equal to 3.33 mg equivalent per mg 0, for acid production, 1.6 for SO, production, and for Fe production, if it is assumed that all iron leaves the system in ferric form and does not precipitate. Using a porosity of 0.3, an average pyrite concentration of a worst-case diameter of m and a DO concentration of 7 an oxygen flux of mg 0, is obtained. This is equivalent to an acid production rate of mg equivalent using equation 1. The acid production rate cannot be compared to the experimental column results, as the measured acidity was often below the detection limit. The production rates of Fe and SO, obtained from the above equations are instead compared to actual rates in Table 4.3. Also included in Table 4.3 is the result of regression analysis on partial Fe data from Figure 4-8. The overall release rate, designated as Experimental, was calculated using all the data and resulted in a correlation coefficient of Linear regression done on the first 122 weeks data is called Rate 1, and resulted in a correlation of 0.98, while Rate 2 ( weeks), gave a correlation coefficient of These regression results suggest that separating the Fe release into two separate rates is more representative than the overall result. The difference between the two rates is more than an order of magnitude. This large increase occurred at the same time as the initial drop, but cannot be related directly to as the recovered in the last sampling round whereas the Fe release continued to increase. 37
46 Table 4.4 Chemical release rates Water Cover Predicted max Water Cover Predicted min Water Cover Experimental Percent of Predicted max Fe Rate Weeks O-122 Fe Rate Weeks 154 Diameter Fe The calculated Fe release rates fit reasonably well, they are actually between the two divided rates. Sulphate release rates are nearly 50 times higher than predicted. This high sulphate release is probably due to a separate source, such as the dissolution of sulphate solids already present in the waste rock. The initial characterization showed that 0.11% of the original rock contained sulphate; this represents a total mass of 22 g, while the total sulphate (both collected and stored in the water cover) accounts for only g. This means that not all the soluble SO, in the rock dissolved. The metal and non-metal loadings stored in the column are presented in Appendix A, Table LXI. 4.3 Stratmat Limestone (3%) Testing Results Acid production rate and Acidity measured in the drainage water the indoor Stratmat waste rock treated with a limestone dosage of 3% averaged a cumulative value of 8.57 g of This amount of acidity was added to the 0.53 g of the oxidation product stored in the column. After 154 weeks, the total average acidity production was 9.10 g of which represents an acid reduction of 97.7% relative to the control tests. The acid production rate was calculated to be 2.96 mg of /kg/week. The drainage water from the outdoor 3% limestone amended Stratmat rock, on the other hand, produced an average of 49.3 g of with the calculated average acid production rate being 2.32 mg of /kg/week for a testing period of 125 weeks. The acid reduction was 94.3%. 38
47 In spite of the high acid reduction, two of the indoor replicates showed a sharp drop in from week 140. The decreased from 7.0 to 3.0 within a few weeks. A similar drop in was observed in one of the outdoor test replicates after week 100. The acid production rate showed exactly the same trend for the indoor and outdoor tests (Figures 4-10 and 4-l 1). The effectiveness of the 3% limestone was near 100% for 100 weeks, after which period it dropped sharply to probably due to depletion of the limestone. 39
48 I I STRATMAT LIMESTONE (3%) INDOOR TIME (weeks) 8 I TIME (weeks) Figure 4-10: Acid production rate and in indoor 3% limestone-amended Stratmat drainage water 40
49 STRATMAT LIMESTONE (3%) OUTDOOR 200 CONTROL LIMESTONE (3%) July 91 Nov 91 April 92 Nov 92 April 93 MONTH Nov 93 a 6 I \I I TIME (weeks) Figure 4-l 1: Acid production rate and in outdoor 3% limestone-amended Stratmat drainage water 41
50 To evaluate whether the limestone reacted and neutralized the oxidation products or was just washed out by regular water addition or ram, SO, concentrations measured in the drainage water were used to calculate the actual acid production rate of the waste rock. Since SO, is formed by the oxidation of sulphide mineral, according to reaction and does not react with limestone, the SO, concentration was used to calculate the real amount of pyrite oxidized during the testing period. Acidity measured on the drainage water was, however, used to calculate the apparent acid production rate. Figure 4-12 shows that the estimated amounts of pyrite oxidized in the indoor and outdoor control tests based on either acidity or sulphate are similar. The figure, also indicates that limestone treatment reduced the amount of pyrite oxidized significantly and that the limestone not only neutralized the oxidation products but also delayed pyrite oxidation by approximately three years. The sulphate loading measured in the drainage water was overestimated because of dissolution of sulphate solids already present in the waste rock. The initial characterization showed that 0.11% of the original rock contained sulphate. Since sulphate was used to calculate the amount of pyrite oxidized, the results described in Figure 4-12 can be considered to represent a maximum possible mass of pyrite oxidized. Even by assuming that all the sulphate was produced by oxidation, only 55 g and 180 g of limestone were consumed in indoor and outdoor tests respectively, to neutralize the oxidation products. These consumed amounts of limestone were equivalent to 9.1% and 3.5% of the total mass added to the waste rock. Since the effectiveness of the limestone was decreasing toward the end of the tests, it was concluded that the limestone was not consumed but may have either being through the formation of ferric hydroxide or washed through regular water addition. 42
51 Indoor Outdoor Figure 12 Effect of 3% Limestone Addition on Acid production rates Metals and Non-Metals Released The results of complete chemical analysis of metals and non-metals released during the tests are presented in Appendix A, Tables VII to IX and XXXVII Metal concentrations in the drainage water from the 3% limestone amended indoor and outdoor tests were near the detection limit for most of the testing period. Zinc, however, was released early in the study as shown in Figure 4-13, Zn concentrations of approximately 20 were found in the drainage water of the indoor tests as early as week 55. The outdoor tests released Zn even earlier; around week 20 the concentration of Zn in the drainage water in one of the replicates was as high as the Zn concentration in the control tests
C&A MM Inventory Relieve & Post to Job Cost Installation and Setup Instructions with Process Flow
 4820 8 TH STREET SALEM, OREGON 97301 C&A MM Inventory Relieve & Post to Job Cost Installation and Setup Instructions with Process Flow The general purpose of this program is to relieve parts from inventory
CHEMICAL REACTIONS AND REACTING MASSES AND VOLUMES
 CHEMICAL REACTIONS AND REACTING MASSES AND VOLUMES The meaning of stoichiometric coefficients: 2 H 2 (g) + O 2 (g) 2 H 2 O(l) number of reacting particles 2 molecules of hydrogen react with 1 molecule
Calcite PH Nutralizer System
 Calcite PH Nutralizer System Installation, Operation & Maintenance Manual Facts About Calcite Ph Neutralizers Calcite is a crushed and screened white marble media which can inexpensively be used to neutralize
Material and methods. Värmeforsk report 1212 2012 Niklas Hansson DIANAS utilization of waste inciniration bottom ash in bound construction materials
 Värmeforsk report 1212 2012 Niklas Hansson DIANAS utilization of waste inciniration bottom ash in bound construction materials Executive Summary Introduction In an international perspective waste incineration
KS3 Science: Chemistry Contents
 summary KS3 Science MyWorks Guide Chemistry KS3 Science: Chemistry Mini zes: 40 Super zes: 5 Extension zes: 4 Skills zes: 6 TOTAL 54 What are MyWorks zes? MyWorks zes are short individual learning tasks
CONSTANT HEAD AND FALLING HEAD PERMEABILITY TEST
 CONSTANT HEAD AND FALLING HEAD PERMEABILITY TEST 1 Permeability is a measure of the ease in which water can flow through a soil volume. It is one of the most important geotechnical parameters. However,
Exposure of Copper in Äspö Groundwaters
 C O N T R A C T W O R K R E P O R T C O N F I D E N T I A L Exposure of Copper in Äspö Groundwaters Author: Claes Taxén Department: 70 Phone: 08-6741739 E-mail: claes.taxen@swerea.se Date: 2009-04-16 Your
THE NWF WATER PURIFICATION PROCESS FRESH WATER IN A NATURAL WAY. Esko Meloni Ferroplan Oy
 THE NWF WATER PURIFICATION PROCESS FRESH WATER IN A NATURAL WAY Esko Meloni Ferroplan Oy 1 The NWF Water Purification Process: list of contents 1. NWF biological purification of groundwater Iron and manganese
Molarity of Ions in Solution
 APPENDIX A Molarity of Ions in Solution ften it is necessary to calculate not only the concentration (in molarity) of a compound in aqueous solution but also the concentration of each ion in aqueous solution.
Name: PLSOIL 105 & 106 First Hour Exam February 27, 2012. Part A. Place answers on bubble sheet. 2 pts. each.
 Name: PLSOIL 105 & 106 First Hour Exam February 27, 2012 Part A. Place answers on bubble sheet. 2 pts. each. 1. A soil with 15% clay and 20% sand would belong to what textural class? A. Clay C. Loamy sand
EXPERIMENT 10 CONSTANT HEAD METHOD
 EXPERIMENT 10 PERMEABILITY (HYDRAULIC CONDUCTIVITY) TEST CONSTANT HEAD METHOD 106 Purpose: The purpose of this test is to determine the permeability (hydraulic conductivity) of a sandy soil by the constant
Determination of calcium by Standardized EDTA Solution
 Determination of calcium by Standardized EDTA Solution Introduction The classic method of determining calcium and other suitable cations is titration with a standardized solution of ethylenediaminetetraacetic
72% of Online Adults are Social Networking Site Users
 www.pewresearch.org AUGUST 5, 2013 72% of Online Adults are Social Networking Site Users Social networking sites remain most popular among young adults, but other age groups continue to increase their
GUIDELINES FOR ONLINE SUBMISSION OF APPLICATIONS
 GUIDELINES FOR ONLINE SUBMISSION OF APPLICATIONS Important Note/Information for the applicants: It is in the interest of the applicants to study in detail and thoroughly observe the guidelines given in
Treatment options for hydrogen sulfide. Testing for hydrogen sulfide
 Sometimes hot water will have a sour smell, similar to that of an old damp rag. This smell often develops when the thermostat has been lowered to save energy or reduce the potential for scalding. Odor-causing
LANDSCAPING AQUA SPORT. Rainwater treatment using filter substrate channel. DIBt approval applied for
 CIVILS LANDSCAPING AQUA SPORT Drainfix Clean Rainwater treatment using filter substrate channel DIBt approval applied for CIVILS LANDSCAPING AQUA SPORT Drainfix Clean Application areas For the treatment
KINETIC TESTS AND RISK ASSESSMENT FOR ARD
 th Presented at the 5 Annual BC Metal Leaching and ARD Workshop, December 9-10, 1998, Vancouver, Canada KINETIC TESTS AND RISK ASSESSMENT FOR ARD by Kevin A. Morin and Nora M. Hutt Minesite Drainage Assessment
ENE 806, Project Report 3 CHEMICAL PRECIPITATION: WATER SOFTENING. Grégoire Seyrig Wenqian Shan
 ENE 806, Project Report 3 CHEMICAL PRECIPITATION: WATER SOFTENING Grégoire Seyrig Wenqian Shan College of Engineering, Michigan State University Spring 2007 ABSTRACT The groundwater with high level initial
TERRA TEK LIMITED GUIDE TO SAMPLE HANDLING. Version 1.06
 TERRA TEK LIMITED GUIDE TO SAMPLE HANDLING Version 1.06 September 2009 Guidance on Sample Containers & Storage Conditions - SOIL SAMPLES 500ml Plastic Tub Suitable for: Inorganic Parameters, usually sufficient
Corrosivity of Water Supplies
 WD-DWGB-3-4 2009 Corrosivity of Water Supplies What is meant by Corrosivity? Corrosive water can be defined as a condition of water quality which will dissolve metals from metallic plumbing at an excessive
DURABILITY OF MORTAR LININGS IN DUCTILE IRON PIPES Durability of mortar linings
 DURABILITY OF MORTAR LININGS IN DUCTILE IRON PIPES Durability of mortar linings I. S. MELAND SINTEF Civil and Environmental Engineering, Cement and Concrete, Trondheim, Norway Durability of Building Materials
EXPERIMENT 7 Reaction Stoichiometry and Percent Yield
 EXPERIMENT 7 Reaction Stoichiometry and Percent Yield INTRODUCTION Stoichiometry calculations are about calculating the amounts of substances that react and form in a chemical reaction. The word stoichiometry
How To Remove Iron From Water
 ISR IRON REMOVAL MEDIA Description INDION ISR is a special media designed to provide excellent catalytic properties to remove dissolved iron from ground water. INDION ISR is an insoluble media which oxidizes
Chapter D9. Irrigation scheduling
 Chapter D9. Irrigation scheduling PURPOSE OF THIS CHAPTER To explain how to plan and schedule your irrigation program CHAPTER CONTENTS factors affecting irrigation intervals influence of soil water using
A discussion of condensate removal systems for clarifier and thickener drives for water and wastewater facilities.
 A discussion of condensate removal systems for clarifier and thickener drives for water and wastewater facilities. Richard L. Dornfeld, BSME, P.E. Staff Engineer September 25, 2014 Moisture can be a problem
OXIDATION-REDUCTION TITRATIONS-Permanganometry
 Experiment No. Date OXIDATION-REDUCTION TITRATIONS-Permanganometry INTRODUCTION Potassium permanganate, KMnO 4, is probably the most widely used of all volumetric oxidizing agents. It is a powerful oxidant
1952-1953 (Academic year)
") Group 63 Seminar on Magnetism Massachusetts Institute of Technology Digital Computer Laboratory Archives Collection No. 12 Donor: Division VI Document Room Restriction: MITRE Personnel Contract a19( 122)
Group 63 Seminar on Magnetism Massachusetts Institute of Technology Digital Computer Laboratory Archives Collection No. 12 Donor: Division VI Document Room Restriction: MITRE Personnel Contract a19( 122)
TABLE OF CONTENTS CHAPTER NO. TITLE PAGE NO. ABSTRACT
 vii TABLE OF CONTENTS CHAPTER NO. TITLE PAGE NO. ABSTRACT LIST OF TABLES LIST OF FIGURES LIST OF SYMBOLS AND ABBREVIATIONS iii xvii xix xxvii 1 INTRODUCTION 1 1.1 GENERAL 1 1.2 OBJECTIVES AND SCOPE OF
GUIDELINES FOR SOIL FILTER MEDIA IN BIORETENTION SYSTEMS (Version 2.01) March 2008
 March 2008") GUIDELINES FOR SOIL FILTER MEDIA IN BIORETENTION SYSTEMS (Version 2.01) March 2008 The following guidelines for soil filter media in bioretention systems have been prepared on behalf of the Facility for
GUIDELINES FOR SOIL FILTER MEDIA IN BIORETENTION SYSTEMS (Version 2.01) March 2008 The following guidelines for soil filter media in bioretention systems have been prepared on behalf of the Facility for
Honors Chemistry: Unit 6 Test Stoichiometry PRACTICE TEST ANSWER KEY Page 1. A chemical equation. (C-4.4)
") Honors Chemistry: Unit 6 Test Stoichiometry PRACTICE TEST ANSWER KEY Page 1 1. 2. 3. 4. 5. 6. Question What is a symbolic representation of a chemical reaction? What 3 things (values) is a mole of a chemical
Honors Chemistry: Unit 6 Test Stoichiometry PRACTICE TEST ANSWER KEY Page 1 1. 2. 3. 4. 5. 6. Question What is a symbolic representation of a chemical reaction? What 3 things (values) is a mole of a chemical
Neutralization of Acid Mine Drainage Using Stabilized Flue Gas Desulfurization Material
 Neutralization of Acid Mine Drainage Using Stabilized Flue Gas Desulfurization Material W. Wolfe 1, C.-M. Cheng 1, R. Baker 1, T. Butalia 1, J. Massey-Norton 2 1 The Ohio State University, 2 American Electric
PART I SIEVE ANALYSIS OF MATERIAL RETAINED ON THE 425 M (NO. 40) SIEVE
 SIEVE") Test Procedure for PARTICLE SIZE ANALYSIS OF SOILS TxDOT Designation: Tex-110-E Effective Date: August 1999 1. SCOPE 1.1 This method covers the quantitative determination of the distribution of particle
Test Procedure for PARTICLE SIZE ANALYSIS OF SOILS TxDOT Designation: Tex-110-E Effective Date: August 1999 1. SCOPE 1.1 This method covers the quantitative determination of the distribution of particle
The formation of polluted mine water
 The formation of polluted mine water Abandoned Mine Drainage How it happens How we can fix it Bruce Golden Western PA Coalition for Abandoned Mine Reclamation What we ll cover Brief Discussion about Mining
5.0 EXPERIMENT ON DETERMINATION OF TOTAL HARDNESS
 5.0 EXPERIMENT ON DETERMINATION OF TOTAL HARDNESS Sl. No. Contents Preamble 5.1 Aim 5.2 Introduction 5.2.1 Environmental Significance 5.3 Principle 5.4 Materials Required 5.4.1 Apparatus Required 5.4.2
Determining the Quantity of Iron in a Vitamin Tablet. Evaluation copy
 Determining the Quantity of Iron in a Vitamin Tablet Computer 34 As biochemical research becomes more sophisticated, we are learning more about the role of metallic elements in the human body. For example,
Methods for the preparation of the test sample from the laboratory sample (Part 1 Material & Methods) Work Package 6 Task 6.4
 Work Package 6 Task 6.4") Methods for the preparation of the test sample from the laboratory sample (Part 1 Material & Methods) Work Package 6 Task 6.4 Validation of prcen/ts 15413 (WI 343027) Paolo de Zorzi APAT - Italian Environmental
Methods for the preparation of the test sample from the laboratory sample (Part 1 Material & Methods) Work Package 6 Task 6.4 Validation of prcen/ts 15413 (WI 343027) Paolo de Zorzi APAT - Italian Environmental
Summary of Basalt-Seawater Interaction
 Summary of Basalt-Seawater Interaction Mg 2+ is taken up from seawater into clay minerals, chlorite, and amphiboles, in exchange for Ca 2+, which is leached from silicates into solution. K + is taken up
USE OF GEOSYNTHETICS FOR FILTRATION AND DRAINAGE
 USE OF GEOSYNTHETICS FOR FILTRATION AND DRAINAGE Prof. G L Sivakumar Babu Department of Civil Engineering Indian Institute of Science Bangalore 560012 Functions of a Filter Retain particles of the base
6 H2O + 6 CO 2 (g) + energy
 + energy") AEROBIC RESPIRATION LAB DO 2.CALC From Biology with Calculators, Vernier Software & Technology, 2000. INTRODUCTION Aerobic cellular respiration is the process of converting the chemical energy of organic
AEROBIC RESPIRATION LAB DO 2.CALC From Biology with Calculators, Vernier Software & Technology, 2000. INTRODUCTION Aerobic cellular respiration is the process of converting the chemical energy of organic
Drainage Water Management Phosphorus Loss from a Tile Drained Field in Northern New York. Justin Geibel, Eric Young, and Stephen Kramer
 Drainage Water Management Phosphorus Loss from a Tile Drained Field in Northern New York Justin Geibel, Eric Young, and Stephen Kramer Tile Drainage Widespread use in US and NNY o Accessibility o Extends
IB Chemistry. DP Chemistry Review
 DP Chemistry Review Topic 1: Quantitative chemistry 1.1 The mole concept and Avogadro s constant Assessment statement Apply the mole concept to substances. Determine the number of particles and the amount
John Allan November 5, 1884 Dunphaile Castle IV December 12, 1884 Laurel II January 17, 1885 Umvoti XV January 29, 1885 Dunphaile Castle V March 16,
 SHIPS FROM MADRAS NAME OF SHIP DATE OF ARRIVAL Truro November 16, 1860 Lord George Bentinck December 24, 1860 Tyburnia March 20, 1861 Earl of Hardwick September 21, 1863 Scindian October 29, 1863 Rajasthana
Dimethylglyoxime Method Method 10220 0.1 to 6.0 mg/l Ni TNTplus 856
 Nickel DOC316.53.01065 Dimethylglyoxime Method Method 10220 0.1 to 6.0 mg/l Ni TNTplus 856 Scope and application: For water and wastewater. Test preparation Instrument-specific information Table 1 shows
CHEMICAL PRECIPITATION: WATER SOFTENING
 CHEMICAL PRECIPITATION: WATER SOFTENING Submitted to: Dr. Hashsham Research Complex Engineering Department of Civil and Environmental Engineering Michigan State University East Lansing, MI 4884 Authors
Cambridge International Examinations Cambridge International General Certificate of Secondary Education
 Cambridge International Examinations Cambridge International General Certificate of Secondary Education *0123456789* CHEMISTRY 0620/03 Paper 3 Theory (Core) For Examination from 2016 SPECIMEN PAPER 1 hour
APPENDIX B: EXERCISES
 BUILDING CHEMISTRY LABORATORY SESSIONS APPENDIX B: EXERCISES Molecular mass, the mole, and mass percent Relative atomic and molecular mass Relative atomic mass (A r ) is a constant that expresses the ratio
Internet, broadband, and cell phone statistics
 Internet, broadband, and cell phone statistics By: Lee Rainie, Director January 5, 2010 Overview In a national survey between November 30 and December 27, 2009, we find: 74% of American adults (ages 18
A perforated conduit such as pipe, tubing or tile installed beneath the ground to intercept and convey ground water. or structures.
 BMP: SUBSURFACE DRAIN Definition A perforated conduit such as pipe, tubing or tile installed beneath the ground to intercept and convey ground water. PurRoses 1. To prevent sloping soils from becoming
Topic 4 National Chemistry Summary Notes. Formulae, Equations, Balancing Equations and The Mole
 Topic 4 National Chemistry Summary Notes Formulae, Equations, Balancing Equations and The Mole LI 1 The chemical formula of a covalent molecular compound tells us the number of atoms of each element present
Use of Fly ash from KKAB, for sealing of landfills
 Use of Fly ash from KKAB, for sealing of landfills Kristina Hargelius M.Sc. Civ. Eng. Kristina.hargelius@ramboll.se Abstract The paper must include an abstract, which should be no more than and 150 words.
Enhanced Organic Precursor Removals Using Aged Filter Media Page 1. Enhanced Organic Precursor Removals Using Aged Filter Media
 Enhanced Organic Precursor Removals Using Aged Media Page 1 Enhanced Organic Precursor Removals Using Aged Media O b j e c t i v e s The main goals of this project was to evaluate the dissolved organic
7. 1.00 atm = 760 torr = 760 mm Hg = 101.325 kpa = 14.70 psi. = 0.446 atm. = 0.993 atm. = 107 kpa 760 torr 1 atm 760 mm Hg = 790.
 CHATER 3. The atmosphere is a homogeneous mixture (a solution) of gases.. Solids and liquids have essentially fixed volumes and are not able to be compressed easily. have volumes that depend on their conditions,
HIGHWAYS DEPARTMENT GUIDANCE NOTES ON SOIL TEST FOR PAVEMENT DESIGN
 HIGHWAYS DEPARTMENT GUIDANCE NOTES ON SOIL TEST FOR PAVEMENT DESIGN Research & Development Division RD/GN/012 August 1990 HIGHWAYS DEPARTMENT GUIDANCE NOTES (RD/GN/012) SOIL TEST FOR PAVEMENT DESIGN Prepared
Lead Testing and On Site Calibration for Water Testing Detection Range: 2 100ppb
 Document: AND Lead 100 7 2013 Lead Testing and On Site Calibration for Water Testing Detection Range: 2 100ppb July, 2013 Edition 1 ANDalyze, Inc., 2012. All rights reserved. Printed in USA. Table of Contents
Preventing Basement Flooding
 Preventing Basement Flooding Perry Lindquist Land Resources Manager Waukesha County Dept. of Parks & Land Use Waukesha County Storm Water Workshop April 10, 2013 Presentation Outline Background Case study
Onsite Wastewater Concepts, Materials, Regulations & The Application Process Part I
 Onsite Wastewater Concepts, Materials, Regulations & The Application Process Part I B Onsite Sewage System Materials Instructors: Bart Harriss, RS, Environmental Manager Florida Department of Health Division
Chapter Test B. Chapter: Measurements and Calculations
 Assessment Chapter Test B Chapter: Measurements and Calculations PART I In the space provided, write the letter of the term or phrase that best completes each statement or best answers each question. 1.
BIOHEAPLEACHING Marja Riekkola-Vanhanen Senior Biotechnology Adviser
 BIOHEAPLEACHING Marja Riekkola-Vanhanen Senior Biotechnology Adviser 2 Short history of bioleaching Copper recovery from mine waters in the Mediterranean area 3000 years ago Heapleaching in Spain in big
Determination of the Mass Percentage of Copper in a Penny. Introduction
 Determination of the Mass Percentage of Copper in a Penny Introduction This experiment will cost you one penny ($0.01). The penny must be minted after 1983. Any penny will do; for best results the penny
ph Measurements of Common Substances
 Chem 100 Section Experiment 10 Name Partner s Name Introduction ph Measurements of Common Substances The concentration of an acid or base is frequently expressed as ph. Historically, ph stands for the
Chapter 8 - Chemical Equations and Reactions
 Chapter 8 - Chemical Equations and Reactions 8-1 Describing Chemical Reactions I. Introduction A. Reactants 1. Original substances entering into a chemical rxn B. Products 1. The resulting substances from
8 plumbing. plumbing. 2010 PulteGroup, Inc. All Rights Reserved.
 8 90 2010 PulteGroup, Inc. All Rights Reserved. drains All the water you use leaves the home through a drain. Maintaining drains prevents clogging, overflows, water damage, and other problems. care and
9.00 THE USE OF HUNTER LAND DRAINAGE PERFORATED PIPES. Hunter Underground Systems
 9.00 THE USE OF HUNTER LAND DRAINAGE PERFORATED PIPES Hunter Underground Systems 9.01 General 9.02 Surface water Drainage 9.03 Groundwater Drainage 9.04 Dispersal of Septic Tank Effluent 9.01 The use of
2. PREPARATION OF TEST SPECIMENS
 Leaching of Cement Lining in Newly-Laid Water Mains (Part II) Ong Tuan Chin and Dr. Wong Sook Fun School of Civil and Environmental Engineering, Nanyang Technological University, 5 Nanyang Avenue, Singapore
Subject: Technical Letter 22 April 1977 Removal of Water Supply Contaminants -- Copper and Zinc
 STATE OF ILLINOIS Department of Registration and Education JOAN G. ANDERSON DIRECTOR. SPRINGFIELD BOARD OF NATURAL RESOURCES AND CONSERVATION JOAN G. ANDERSON CHAIRMAN BIOLOGY THOMAS PARK CHEMISTRY H.
Chemistry 119: Experiment 7. Potentiometric Titration of Ascorbic Acid in Vitamin C Tablets
 Chemistry 119: Experiment 7 Potentiometric Titration of Ascorbic Acid in Vitamin C Tablets Vitamin C is another name for ascorbic acid (C 6 H 8 O 6, see below ), a weak acid that can be determined by titration
Laboratory and Field Performance Assessment of Geocomposite Alternative to Gravel Drainage Overliner in Heap Leach Pads
 Laboratory and Field Performance Assessment of Geocomposite Alternative to Gravel Drainage Overliner in Heap Leach Pads Aigen Zhao, PhD, PE, GSE Environmental, LLC, USA Mark Harris, GSE Environmental,
6 Reactions in Aqueous Solutions
 6 Reactions in Aqueous Solutions Water is by far the most common medium in which chemical reactions occur naturally. It is not hard to see this: 70% of our body mass is water and about 70% of the surface
GUIDELINES FOR LEACHATE CONTROL
 GUIDELINES FOR LEACHATE CONTROL The term leachate refers to liquids that migrate from the waste carrying dissolved or suspended contaminants. Leachate results from precipitation entering the landfill and
The rock cycle. Introduction. What are rocks?
 The rock cycle This Revision looks at the three types of rock: sedimentary, igneous and metamorphic. It looks at how they are formed, the weathering of rocks and the way one form of rock turns into another,
Best Practice in Boiler Water Treatment
 Best Practice in Boiler Water Treatment Boiler Water Treatment Part 2 Internal Treatment Objectives of Internal Water Treatment 1 To control the level of total dissolved solids (TDS) within the boiler
Removing Heavy Metals from Wastewater
 Removing Heavy Metals from Wastewater Engineering Research Center Report David M. Ayres Allen P. Davis Paul M. Gietka August 1994 1 2 Removing Heavy Metals From Wastewater Introduction This manual provides
Ion Exchange Design Hand calculation. Brian Windsor (Purolite International Ltd)
") Ion Exchange Design Hand calculation Brian Windsor (Purolite International Ltd) Introduction Before design programmes were introduced, every engineer had to calculate the design by hand using resin manufacturers
Ion Exchange Design Hand calculation Brian Windsor (Purolite International Ltd) Introduction Before design programmes were introduced, every engineer had to calculate the design by hand using resin manufacturers
Global Seasonal Phase Lag between Solar Heating and Surface Temperature
 Global Seasonal Phase Lag between Solar Heating and Surface Temperature Summer REU Program Professor Tom Witten By Abstract There is a seasonal phase lag between solar heating from the sun and the surface
Appendix B: Water Treatment Scenarios from AMD Treat
 Appendix B: Water Treatment Scenarios from AMD Treat 103 of 104 Jeddo Tunnel Abandoned Mine Drainage Passive vs. Active Treatment Cost Estimates Provided by Office of Surface Mining AMD Treat Software
Research on the Prediction of Mine Drainage and the Colloidal Transport of Metals
 Research on the Prediction of Mine Drainage and the Colloidal Transport of Metals Heather Jamieson, Martha Buckwalter-Davis, Jessica Dongas and Lindsay Fenwick Department of Geological Sciences and Geological
PERMEABILITY TEST. To determine the coefficient of permeability of a soil using constant head method.
 PERMEABILITY TEST A. CONSTANT HEAD OBJECTIVE To determine the coefficient of permeability of a soil using constant head method. need and Scope The knowledge of this property is much useful in solving problems
Balancing Reaction Equations Oxidation State Reduction-oxidation Reactions
 Balancing Reaction Equations Oxidation State Reduction-oxidation Reactions OCN 623 Chemical Oceanography Balanced chemical reactions are the math of chemistry They show the relationship between the reactants
4.0 EXPERIMENT ON DETERMINATION OF CHLORIDES
 4.0 EXPERIMENT ON DETERMINATION OF CHLORIDES Sl. No. Contents Preamble 4.1 Aim 4.2 Introduction 4.2.1 Environmental Significance 4.3 Principle 4.4 Materials Required 4.4.1 Apparatus Required 4.4.2 Chemicals
Storm Drain Inlet Protection for Construction Sites (1060)
") Storm Drain Inlet Protection for Construction Sites (1060) Wisconsin Department of Natural Resources Conservation Practice Standard I. Definition A temporary device installed in or around a storm drain
Storm Drain Inlet Protection for Construction Sites (1060) Wisconsin Department of Natural Resources Conservation Practice Standard I. Definition A temporary device installed in or around a storm drain
Hardness ions also interfere with many chemical processes such as chemical compounding and aqueous cleaners.
 Water Softeners Industrial Water Purification (800) CAL-WATER By Dave Peairs, Cal Water, Technical Director Rev: 06/08/2004 Before any discussion of water softeners, we must first define what hard water
Properties of Acids and Bases
 Properties of Acids and Bases (Adapted from Flinn Scientific Acid Base Test Kit I #AP4567) Introduction Battery acid, stomach acid, acid rain just a few acids in our everyday life! What does it mean when
Attachment G-1: Pit Latrine Diagram. Fig E.1a: Pit Latrine. Fig E.1b: Plan View of Twin Pits
 Attachment G-1: Pit Latrine Diagram Fig E.1a: Pit Latrine Fig E.1b: Plan View of Twin Pits Fig E.1c: Section of a water-sealed pan Fig E.1d: 3D view of Overflow Pipe Fig E.1e: 2D view of Overflow Pipe
PERFORMANCE EVALUATION OF WATER-FLOW WINDOW GLAZING
 PERFORMANCE EVALUATION OF WATER-FLOW WINDOW GLAZING LI CHUNYING DOCTOR OF PHILOSOPHY CITY UNIVERSITY OF HONG KONG FEBRUARY 2012 CITY UNIVERSITY OF HONG KONG 香 港 城 市 大 學 Performance Evaluation of Water-flow
Experiment 16-Acids, Bases and ph
 Definitions acid-an ionic compound that releases or reacts with water to form hydrogen ion (H + ) in aqueous solution. They taste sour and turn litmus red. Acids react with certain metals such as zinc,
7. Chemical Waste Disposal Procedures
 7. Chemical Waste Disposal Procedures Substances that Can and Cannot be Disposed of via Sink Drains or in Regular Solid Refuse Containers 1. It is prohibited to pour down a sink or floor drain, or place
Chapter 1: Moles and equations. Learning outcomes. you should be able to:
 Chapter 1: Moles and equations 1 Learning outcomes you should be able to: define and use the terms: relative atomic mass, isotopic mass and formula mass based on the 12 C scale perform calculations, including
Theoretical and Experimental Modeling of Multi-Species Transport in Soils Under Electric Fields
 United States National Risk Management Environmental Protection Research Laboratory Agency Cincinnati, OH 45268 Research and Development EPA/6/SR-97/54 August 997 Project Summary Theoretical and Experimental
SYLLABUS. Semester: Spring 2009. Requirements: Text: General Chemistry. 9 th Edition, Chang, 2007
 SYLLABUS Course: General Chemistry II: CHEM-1100-001 Lecture: 10:30 AM-12:00 PM Tues. & Thurs. in Room 6068 Recitation: 12:00 PM-12:50 PM in Room 3066 Laboratory: 01:00-03:50 PM Wed. in Room 3066 Semester:
ALS TRIBOLOGY Engine Coolant Reference Guide
 ALS TRIBOLOGY Engine Coolant Reference Guide Engine coolants are a mixture of, inhibitors, and water. Each formula is designed for specific protection and engine requirements. Mixing different coolants
KWANG SING ENGINEERING PTE LTD
 KWANG SING ENGINEERING PTE LTD 1. INTRODUCTION This report represents the soil investigation works at Aljunied Road / Geylang East Central. The objective of the soil investigation is to obtain soil parameters
What are the controls for calcium carbonate distribution in marine sediments?
 Lecture 14 Marine Sediments (1) The CCD is: (a) the depth at which no carbonate secreting organisms can live (b) the depth at which seawater is supersaturated with respect to calcite (c) the depth at which
ATOMS. Multiple Choice Questions
 Chapter 3 ATOMS AND MOLECULES Multiple Choice Questions 1. Which of the following correctly represents 360 g of water? (i) 2 moles of H 2 0 (ii) 20 moles of water (iii) 6.022 10 23 molecules of water (iv)
LAB 5 - PLANT NUTRITION. Chemical Ionic forms Approximate dry Element symbol Atomic weight Absorbed by plants tissue concentration
 LAB 5 PLANT NUTRITION I. General Introduction All living organisms require certain elements for their survival. Plants are known to require carbon (C), hydrogen (H), oxygen (O), nitrogen (N), phosphorus
XI / PHYSICS FLUIDS IN MOTION 11/PA
 Viscosity It is the property of a liquid due to which it flows in the form of layers and each layer opposes the motion of its adjacent layer. Cause of viscosity Consider two neighboring liquid layers A
EXPERIMENT 8: Activity Series (Single Displacement Reactions)
") EPERIMENT 8: Activity Series (Single Displacement Reactions) PURPOSE a) Reactions of metals with acids and salt solutions b) Determine the activity of metals c) Write a balanced molecular equation, complete
EPERIMENT 8: Activity Series (Single Displacement Reactions) PURPOSE a) Reactions of metals with acids and salt solutions b) Determine the activity of metals c) Write a balanced molecular equation, complete
Determination of the enthalpy of combustion using a bomb calorimeter TEC. Safety precautions
 Safety precautions Naphthalene is harmful if swallowed. May cause cancer. Is further very toxic to aquatic organisms and can have long-term harmful effects in bodies of water. Equipment 1 Bomb calorimeter
WATER CHEMISTRY AND POOL WATER BALANCE
 C R6 H A PT E WATER CHEMISTRY AND POOL WATER BALANCE LEARNING OBJECTIVES After completely studying this chapter, you should be able to: Understand and list the parameters upon which water balance is based.
Causes of Bacteria in Water Samples 1
 The Center at Keene: 149 Emerald Street, Keene NH 03431 Phone: (603) 357-2577 / Toll Free: (800) 760-4246 Fax: (603) 352-3899 Email: chem@eai-labs.com Causes of Bacteria in Water Samples 1 The purpose
Hands-On Labs SM-1 Lab Manual
 EXPERIMENT 4: Separation of a Mixture of Solids Read the entire experiment and organize time, materials, and work space before beginning. Remember to review the safety sections and wear goggles when appropriate.