Evaluation of all weather microwave-derived land surface temperatures with in situ CEOP measurements
|
|
|
- Raymond Porter
- 8 years ago
- Views:
Transcription
1 JOURNAL OF GEOPHYSICAL RESEARCH, VOL. 116,, doi: /2011jd016439, 2011 Evaluation of all weather microwave-derived land surface temperatures with in situ CEOP measurements J. Catherinot, 1,2 C. Prigent, 2 R. Maurer, 3 F. Papa, 1,4 C. Jiménez, 2 F. Aires, 2,5 and W. B. Rossow 1 Received 21 June 2011; revised 8 September 2011; accepted 25 September 2011; published 6 December [1] Land surface skin temperature Ts plays a key role in meteorological and climatological processes but the availability and the accuracy of Ts measurements over land are still limited, especially under cloudy conditions. Ts estimates from infrared satellite observations can only be derived under clear sky. Passive microwave measurements are much less affected by clouds and can provide Ts regardless of the cloud conditions. A neural network inversion including first guess information has been previously developed to retrieve Ts, along with atmospheric water vapor, cloud liquid water, and surface emissivities over land from Special Sensor Microwave/Imager measurements, with a spatial resolution of , at least twice daily. In this study, Ts estimates are evaluated through careful comparisons with in situ measurements in different environments over a full annual cycle. Under clear sky conditions, the quality of our microwave neural network retrieval is equivalent to the infrared International Satellite Cloud Climatology Project products, for most in situ stations, with errors 3 K as compared to in situ measurements. The performance of the microwave algorithm is similar under clear and cloudy conditions, confirming the potential of the microwaves under clouds. The Ts accuracy does not depend upon the surface emissivity, as the variability of this parameter is accounted for in the processing. Our microwave Ts have been calculated for more than 15 years (1993 to mid-2008). These all weather Ts are a very valuable complement to the IR-derived Ts, for use in atmospheric and surface models. Citation: Catherinot, J., C. Prigent, R. Maurer, F. Papa, C. Jiménez, F. Aires, and W. B. Rossow (2011), Evaluation of all weather microwave-derived land surface temperatures with in situ CEOP measurements, J. Geophys. Res., 116,, doi: /2011jd Introduction [2] Land surface skin temperature (Ts) controls and is determined by the balance of radiative heating/cooling and evaporative cooling at the surface. Despite the recognition of its key role in meteorological and climatological processes, accurate Ts measurements over land areas are not yet available for the whole globe under both clear and cloudy conditions. [3] Surface skin temperature can be obtained from measurements of infrared radiation at the surface, if the land surface emissivity is known; however, this measurement 1 NOAA Cooperative Remote Sensing Science and Technology Center, City College of New York, New York, New York, USA. 2 Laboratoire d Etudes du Rayonnement et de la Matière en Astrophysique, Observatoire de Paris, CNRS, Paris, France. 3 NASA Goddard Institute for Space Studies, Columbia University, New York, New York, USA. 4 Now at Laboratoire d Etudes en Géophysique et Océanographie Spatiales, IRD, Toulouse, France. 5 Estellus, Paris, France. Copyright 2011 by the American Geophysical Union /11/2011JD is not routinely performed at weather and other research stations. Skin temperatures have been estimated from satellite infrared radiance observations [e.g., Rossow and Garder, 1993; Rossow et al., 1993; Rossow and Schiffer, 1999; Prata, 1993, 1994; Trigo et al., 2008], but direct determinations are possible only under clear sky conditions because clouds block the surface view at these wavelengths. [4] Several studies have already explored the potential of satellite microwave measurements for land surface temperature retrieval. Microwave wavelengths, being much less affected by water vapor and clouds than infrared, are an attractive alternative especially under cloudy conditions. Note nevertheless that the spatial resolution of passive microwave is much lower than that provided in the infrared (above 10 km with the current microwave radiometers). In addition, passive microwave observations are only available from polar orbiters, contrarily to infrared also observed from geostationary orbits, limiting the time sampling of passive microwave. A few studies correlate the microwave brightness temperature measurements to in situ measurements of near-surface air temperatures made at surface weather stations: since the microwave measurements do not actually sense near-surface air temperature, this approach assumes 1of11
![[1] Land surface skin temperature Ts plays a key role in meteorological and climatological processes but the availability and the accuracy of Ts measurements over land are still limited, especially](/docs-images/53/11831736/images/page_1.jpg "under cloudy conditions. Ts estimates from infrared satellite observations can only be derived under clear sky.")
2 that the surface air and skin temperatures vary together, but this is only approximately true at small spatial and temporal scales and can be badly in error for arid or frozen locations. For instance, MacFarland et al. [1990] investigated the correlation between observations from the Special Sensor Microwave /Imager (SSM/I) and surface air temperature measurements and used a multivariate regression of the microwave brightness temperatures to retrieve the surface air temperature. Later, Basist et al. [1998] suggested including the variation of emissivity into account in the regression, using a simple land classification scheme (that algorithm has been evaluated by Williams et al. [2000]). Jones et al. [2010] also derived a daily estimate of the surface air temperature from AMSR-E observations. Njoku [1995] concluded from simulations that surface skin temperatures could be estimated from multichannel microwave observations with an accuracy between 2.0 and 2.5 K. A physical retrieval of surface skin temperature using SSM/I observations at 19 and 22 GHz has been developed by Weng and Grody [1998]: the two frequencies have approximately the same emissivities so that the emissivity effect on the measurements can be neglected. Note, however, that the actual temperature error is nearly 3 K for every 1% error in surface emissivity at microwave wavelengths. Compared to surface air temperature measurements, the Weng and Grody [1998] results exhibited root mean square (r.m.s.) differences of 4.4 K, with a larger bias in colder environments. Holmes et al. [2009] proposed a very simple land surface temperature algorithm, based on a single frequency channel (37 GHz in vertical polarization). Other methodologies have been developed for regional studies using algorithms that cannot be directly adopted globally, e.g., the methodology of Wen et al. [2003] for over the Tibetan Plateau or of Royer and Poirier [2010] for in Boreal North America. Aires et al. [2001] developed a global method based on a neural network inversion of a radiative transfer model and ancillary data sets describing the properties of the atmosphere. The scheme retrieves simultaneously over land the surface skin temperature (Ts), the atmospheric column water vapor abundance, the cloud liquid water path and the surface emissivities for all SSM/I channels. The algorithm uses precalculated monthly-mean emissivities, cloud and surface parameters from infrared and visible satellite information, and the meteorological reanalysis as first guess information. So far, the accuracy of these retrieved surface skin temperatures under cloudy conditions has only been evaluated by comparison with in situ surface air temperature [Prigent et al., 2003a]. [5] In this study, we evaluate the microwave-based Ts retrieval based on neural network inversion by comparison with in situ Ts measurements collected during the Coordinated Energy and water cycle Observations Project (CEOP). The comparisons cover diverse environments over a full annual cycle (for 2003). The neural network retrieval method is briefly described, along with the data sets used in the comparison study in Section 2. In section 3, the microwavederived Ts estimates are compared to the satellite IR retrievals under clear sky conditions, and then carefully evaluated with respect to the CEOP measurements, under both clear and cloudy conditions. Section 4 summarizes our results and argues for the value of producing merged satellite infraredand microwave-derived surface skin temperature to better characterize the energy exchanges at the land-atmosphere interface, regardless of the cloud conditions. 2. Ts Retrieval Methodology and Evaluation Data Sets 2.1. Microwave-Derived Ts Retrievals Neural Network Retrieval [6] A Neural Network (NN) inversion scheme with a novel feature of employing a first guess input has been developed by Aires et al. [2001] to retrieve simultaneously the land surface Ts, the atmospheric column water vapor abundance WV, the cloud liquid water path CLW, and the surface emissivities, ef, for all SSM/I channels between 19 and 85 GHz. This NN method optimizes the use of all the SSM/I channels and a priori information to constrain the inversion problem and retrieves simultaneously surface and atmospheric parameters that are consistent among themselves and with the satellite observations. [7] The database used to train the NN is calculated with a radiative transfer model and a global collection of coincident surface and atmospheric parameters extracted from the National Center for Environmental Prediction (NCEP) [Kalnay et al., 1996], the International Satellite Cloud Climatology Project (ISCCP) cloud parameters and Ts [Rossow and Schiffer, 1999], and pre-calculated monthly-mean land surface emissivities [Prigent et al., 1997, 2006]. [8] To the extent that the training data set provides a realistic joint distribution of the surface and atmospheric parameters, including their correlations, the neural network represents a global statistical fit of the inverse radiative transfer model. The training database is composed of 2 months of global data during 1993 (January and June). The atmospheric relative humidity and temperature are taken from the NCEP reanalysis data set, every 6 h with a spatial resolution of 2.5 in latitude and longitude. The WV is also used as the first guess a priori information with an assigned error of 40 % of the initial value. This first guess errors is similar to that obtained from the error covariance of each humidity level as given by Eyre et al. [1993]. In the ISCCP data set, cloud and surface parameters are retrieved from visible and infrared radiances provided by the set of polar and geostationary meteorological satellites. In this study, the ISCCP data set provides estimates of the cloud-top and surface skin temperatures ( The error assigned to the surface temperature values is estimated to be 4 K (see section below for more details on the ISCCP Ts estimates). The first guess information for the microwave emissivities at each location is derived from the monthly mean land surface emissivities previously estimated by Prigent et al. [1997, 2006]. The standard deviation of day-today variations of the retrieved emissivities within a month for each channel and location is used as the estimate of first guess errors. For more information on the a priori first guess information and related background errors, see the work of Aires et al. [2001]. [9] To better constrain the problem, the clear/cloudy flag information provided by the ISCCP data set is used to train two neural networks: one for clear scenes and one for cloudy scenes. Both NN retrieve simultaneously Ts, seven SSM/I ef and the WV. For the cloudy NN, CLW is also retrieved. 2of11
![[1990] investigated the correlation between observations from the Special Sensor Microwave /Imager (SSM/I) and surface air temperature measurements and used a multivariate regression of the microwave](/docs-images/53/11831736/images/page_2.jpg "brightness temperatures to retrieve the surface air temperature. Later, Basist et al.")
3 Continuity between the NN retrievals at very low CLW has been verified. [10] The inversion method provides Ts for each SSM/I observation over land with a theoretical r.m.s. error of 1.3 K in clear-sky and 1.6 K in cloudy scenes (see Aires [2004] and Aires et al. [2004a, 2004b] for further analysis of the theoretical inversion errors). Prigent et al. [2003a] evaluated the Ts values with respect to surface air temperature Tair by a comprehensive analysis of the differences expected between the estimated Ts and the Tair measured at meteorological stations as a function of diurnal and seasonal solar insulation, vegetation cover, and cloudiness variations. The method has also been applied with success over snow and ice [Prigent et al., 2003b] Single Microwave Channel Ts Estimate [11] The neural network Ts estimates (hereafter MW1) will be systematically compared to the single channel algorithm (hereafter MW2) developed by Holmes et al. [2009]. In MW2, the 37 GHz vertical polarization channel is selected for its low sensitivity to the surface characteristics and relatively high atmospheric transmittance. Over 2005, FLUX- NET observations were collected [Baldocchi et al., 2001] and the longwave fluxes were compared to the SSM/I brightness temperatures (Tb) at 37 GHz vertical polarization (Tb37V), using carefully determined infrared emissivities. A simple linear regression was developed from coincident data at 17 stations in midlatitudes, over a year (2005). Tb37V < K were discarded, as they likely represent frozen conditions. In addition, pixels with more than 4% coverage of standing water are excluded as the authors specify that the accuracy of the retrieval is reduced in cases of low emissivity surfaces (the fractional coverage of ocean and permanent inland water bodies is calculated from the International Geosphere-Biosphere Programme (IGBP) one-minute land ecosystem classification map [Loveland et al., 2000]). Radiative transfer simulations were conducted to assess the sensitivity of the retrieval to various parameters (atmospheric water vapor, scattering albedo, roughness, soil moisture, incidence angle, and frequency). The standard deviation of the estimates, as compared to the in situ measurements (not accounted for in the training of the regression but representative of similar environments) is of the order of 2 K for forests and up to 4 K for low density vegetation. The bias was estimated to be within 1 K for most surfaces. The technique is applicable to a large set of microwave imagers (SSM/I, TMI, AMSR-E) all of which provide observations close to 37 GHz in vertical polarization, with an incidence angle around 50. The authors specify that changes in overpassing time from a satellite to the other and satellite drift can increase the error budget, when calculating long time series Evaluation Data Sets Infrared-Derived Ts [12] The ISCCP data set provides the longest satellite Ts product available today, covering the period from 1983 to present every 3 hours with a spatial sampling interval of 30 km for the full globe under clear-sky conditions (a new version will soon be released with 10 km sampling). Some limitations of this product have been documented [e.g., Zhang et al., 2006] but its potential for climate studies makes it a unique data set. C. Jiménez et al. (manuscript in preparation, 2011) also compare the ISCCP Ts database with other more recent infrared estimates of Ts. Note that in the framework of the present work with SSM/I, MODIS estimates would not be usable, due to the mis-match of its overpass time with the SSM/I for a given location. In the ISCCP data, cloud parameters and related quantities are retrieved from visible (VIS 0.6 mm wavelength) and infrared (IR 11 mm wavelength) radiances provided by the set of polar and geostationary meteorological satellites [Rossow and Schiffer, 1999]. The surface skin temperature is retrieved from clear IR radiances using satellite-derived products to specify the atmospheric temperature and humidity profiles (TIROS Operational Vertical Sounder (TOVS) estimates). Rossow et al. [1993] show that the ISCCP sea surface temperatures are in good agreement with other measurements. The local uncertainty of about 2 K combines errors in cloud detection, the satellite radiance calibration, the atmospheric temperature and humidity used in the retrieval, the radiative transfer model treatment of the water vapor absorption, the assumption of unit surface emissivity (instead of roughly 0.98), and the effect of real differences between the skin and bulk surface temperatures. Thus the uncertainties of land surface temperatures associated with these same factors (cloud detection, atmospheric correction, and radiance calibration) are about the same magnitude, 2 K. Two other sources of surface temperature uncertainty that are more important over land are larger and much more rapid temperature variations and larger emissivity variations. Rossow and Garder [1993] and Rossow et al. [1993] show how the ISCCP algorithm successfully separates these two types of variations and confirm the accuracy of individual surface temperature variations to within about 4 K. In our study, the ISCCP Ts estimates, initially calculated with unit emissivity, are corrected for the spatial variation of the surface infrared emissivities at 11 mm [Zhang et al., 2010]. The correction is a simple fit to match the radiation calculations. The variation of emissivity depends on surface type, based on the vegetation database from Matthews [1983]. The impact of the correction is limited, less than 1 K even over deserts, because the decrease of upward radiance as emissivity decreases is partially offset by increasing reflection of the downwelling radiance from the atmosphere). We estimate that the infrared emissivity variability is equivalent to a spurious temperature variability smaller than 2 K, well within the 4 K uncertainty associated with synoptic variations [Zhang et al., 2006] CEOP Measurements [13] The CEOP network was designed to provide in situ measurements of meteorological parameters in a variety of environments during the period (see ceop.net/ for more details). Specific references are available for each of the measurement stations. In our study we use the surface skin and air temperature measurements from this network for comparison with the Ts derived from satellite data. Each data set in the CEOP network has been quality controlled by the provider by documented procedures. We selected only those stations with good enough quality as specified by the providers over the selected year (2003). The uncertainties in the in situ Ts measurements are not discussed in detail in the CEOP documentations. Major sources of uncertainties are expected to be related to uncertainties in the IR emissivities, to radiometric noise, and to the variability of Ts during the measurement integration time. From very careful in situ measurements, Trigo et al. [2008] estimated an 3of11
![[2003a] evaluated the Ts values with respect to surface air temperature Tair by a comprehensive analysis of the differences expected between the estimated Ts and the Tair measured at meteorological](/docs-images/53/11831736/images/page_3.jpg "stations as a function of diurnal and seasonal solar insulation, vegetation cover, and cloudiness variations. The method has also been applied with success over snow and ice [Prigent et al., 2003b].")
4 Figure 1. Map of the selected CEOP stations. The colors indicate the different environments: green for temperature stations, orange for tropical ones, and blue for the boreal region. uncertainty of the order of 0.5 K during the night, and up to 1.5 K during the day. The uncertainties in the CEOP measurements are expected to be of the same order. The in situ measurements are matched to the nearest in space and time satellite observations: two measurements are considered coincident when they are within 30 min in time and 25 km in space. Only a limited number of stations in the network provide measurements coincident in time and space with the SSM/I retrievals. For a meaningful comparison of the satellite spatially integrated measurement and the in situ point measurement, stations located in heterogeneous environments are discarded, especially the ones located in coastal regions. Microwave observations are particularly sensitive to the presence of water (the ocean emissivity being much lower than the land emissivity). The presence of the ocean in even a small portion of the field-of-view can significantly impact the observations. Examination of maps (Google Maps) made it possible to filter out the stations located in heterogeneous areas. We also checked the spatial variability of the Ts IR estimates. The selected stations are grouped into three categories, temperate, tropical, and boreal, to provide a robust and consistent interpretation of the results (see Figure 1). 3. Evaluation of the Microwave-Derived Ts Estimates 3.1. Production of the Microwave-Derived Ts [14] The global SSM/I Ts product has been produced for a 15 year period from 1993 to mid This involves collecting all SSM/I observations available from the different platforms, along with the ISCCP cloud property and surface temperature data set, and atmospheric properties from the NCEP reanalysis. The products are collocated in space and time and are inputs to the trained neural network inversion process [Aires et al., 2001]. In this study, we concentrate on the evaluation of the Ts values retrieved in this analysis over the year To provide a simple reference, the retrieval by Holmes et al. [2009] is also applied for 2003; this method does not require any ancillary data. [15] At the end of the neural network inversion process, the quality is checked by applying a radiative transfer model to the retrieved parameters (Ts, ef, WV, and CLW) and comparing the results with the observed brightness temperatures. R.m.s. differences with the input Tbs are calculated. When this quantity is larger than a threshold corresponding to two standard deviations of the cost function distribution over a full year, the retrieval is labeled as bad. Bad retrievals account for 1% and 6% of the observations under clear sky and cloudy sky conditions, respectively. 61% of the bad cases are related to snow covered surfaces: since the snow emissivity is very variable in space and time, the surface and atmospheric retrieval is particularly difficult [Prigent et al., 2003b; Cordisco et al., 2006]. Unlike the NN method, the Holmes et al. [2009] method does not apply to land surfaces with more than 4% of open water, and to frozen or snow covered surfaces. Using the filter for frozen conditions (Tb37V < K) suppresses 18% (resp. 32%) under clear (resp. cloudy) sky Comparison With Infrared Estimates Under Clear-Sky Conditions [16] Under clear sky conditions, the microwave retrieval can be compared to the ISCCP collocated estimates obtained from infrared radiances. The overpass times of the SSM/I satellite are around 6:00 in the morning and 18:00 at night. These times correspond to significant changes in Ts within its diurnal cycle, but the largest variations observed around noon are avoided. Note that in the literature comparisons between Ts are often limited to nighttime to benefit from more thermal stability. Figure 2 presents maps of monthly mean Ts for July, calculated for the SSM/I morning overpasses, under clear sky condition only (as specified by the ISCCP cloud flag). The IR estimates and our retrieval present similar Ts spatial structures. In the Holmes et al. [2009] Ts map, 4of11

5 Figure 2. Averaged maps of the retrieved Ts for July morning orbits, for clear pixels (as indicated by the ISCCP cloud flag): (a) from the IR retrieval from ISCCP, (b) from the Neural Network inversion (MW1) [Aires et al., 2001], and (c) from the single frequency method (MW2) [Holmes et al., 2009]. specific patterns appear related more to changes in surface emissivities rather than to real changes in Ts. This is the case for all unfiltered hydrological structures such as the Amazon River, the Congo River, or the many lakes in Canada: the low emissivity of the standing water induces a decrease of the measured Tbs at 37 GHz that is confused with a decrease in Ts in this algorithm, which does not account for surface emissivity changes. By the same token, the carbonate outcrops in Oman or in Egypt that are associated with low emissivities [Prigent et al., 2005; Jiménez et al., 2010] are also falsely interpreted as low Ts. Figure 3 presents the histograms of the differences under clear sky conditions between the infrared Ts from ISCCP and the microwave Ts derived from the NN method (solid line) and the Holmes et al. [2009] scheme (dotted line), for January and July. The comparison is limited to the pixels for which both microwave retrievals are valid (as described above). Since the NN method uses the IR Ts as a priori information, only small biases are expected between the IR Ts and our microwave estimates. Note nevertheless that the NN methodology has been trained over 2 months of data in 1993: any changes in the ISCCP methodology or drifts in the different satellite observations (SSM/I and/or IR satellites) can introduce spurious biases. The r.m.s. for January and July are smaller than the r.m.s. differences assigned to the Ts first guess (4 K). Holmes et al. [2009] Ts shows much more bias: this methodology underestimates Ts since it was tuned for high emissivities (vegetated areas) and cannot account for lower values. Over snow, the NN method provides a mean difference of 1.0 K and a r.m.s. of 3.5 K in January (the method from Holmes et al. [2009] does not provide many estimates over snow because of the threshold on the Tbs). [17] In order to further analyze the microwave retrieval under clear condition, the comparison results are separated into microwave emissivity ranges. The microwave emissivity is highly variable in space and time, much more than the infrared emissivity. The lower the emissivity, the lower the contribution from the surface to the radiation (it is proportional to ef Ts). Table 1 provides the mean and r.m.s. difference between the ISCCP Ts estimates and the microwave retrievals, when stratified by the microwave 5 of 11
![[Aires et al., 2001], and (c) from the single frequency method (MW2) [Holmes et al., 2009]. specific patterns appear related more to changes in surface emissivities rather than to real changes in Ts.](/docs-images/53/11831736/images/page_5.jpg "This is the case for all unfiltered hydrological structures such as the Amazon River, the Congo River, or the many lakes in Canada: the low emissivity of the standing water induces a decrease of the")
6 Figure 3. For (left) January and (right) July, histograms of the difference under clear sky conditions between the infrared Ts from ISCCP and the microwave Ts derived from the NN method MW1 (solid line) and the single frequency scheme MW2 (dotted line). The comparison is limited to the pixels for which both retrievals are valid (condition on the cost function for the first algorithm and threshold on the Tb at 37 GHz V for the second one, see text). The mean values are indicated, along with the r.m.s. in brackets. emissivities at 37 GHz vertical polarization. The mean emissivities directly calculated from SSM/I data [Prigent et al., 2006] are used here. Table 1 shows that the NN results are insensitive to changes in surface emissivities with similar performance regardless of the emissivity. This is expected as the emissivity information is accounted for in the retrieval. In contrast, the Holmes et al. [2009] retrieval implicitly assumes a constant surface emissivity. As a consequence, varying surface emissivities (due for instance to the presence of soil moisture, standing water, or snow) affect the Ts retrieval. The land surface emissivities are typically close to 0.95 at 37 GHz vertical polarization and the Holmes et al. [2009] Ts retrieval performs better for high emissivities Comparison With the CEOP Measurements Detailed Analysis of Selected CEOP Stations [18] Detailed comparisons with the CEOP measurements are made for a few stations representing three very different environments over The selected stations provide quality measurements for most of the year. The two first stations (stations 2 and 67) are located in the temperate climate zone: station 2 is located in a rural landscape in eastern Germany and station 67 is located in Bondville, Illinois, USA, in corn and soybean crops. Station 44, located in northeast Thailand in a region of manioc fields, represents tropical conditions. Station 100 is representative of the arctic climate and is located in northern Alaska in a tundra environment. Note that this station is in a region of lakes and the Holmes et al. [2009] algorithm cannot be applied. Initially, we had also selected stations in Mongolia and Tibet, but found very large discrepancies between these measurements and all satellite estimates. An examination of the spatial variability exhibited by the satellite products suggested a correlation of the large discrepancies and very large spatial heterogeneity as would be expected in elevated, arid environments with significant variations of topographic height. Thus it was not possible to conclude if differences were related to the unrepresentativeness of the in situ measurements or to limitations of the satellite retrievals in these environments. [19] Figure 4 shows the time series of the Ts (Figure 4, left, top panel for each station) and the difference between the satellite estimates and the in situ measurement (Figure 4, left, lower panel for each station). The microwave-derived estimates have the lowest temporal sampling (about two overpasses a day), so the comparisons are limited to the times coincident with the SSM/I microwave observations. The infrared Ts estimates are available under clear sky condition only, so the statistics are separated into clear and cloudy sky (clear and cloudy Ts estimates are presented with different symbols in Figure 4, with the cloud flag derived from the ISCCP data set). Figure 4 (right) shows the scatterplots of the estimated Ts with respect to the in situ measurements. The mean and r.m.s. differences between the Ts CEOP measurements and the satellitederived estimates are indicated below each plot, along with the linear correlation coefficient. The Holmes et al. [2009] estimates are not available for low Ts values (Tb 37 GHz below K) so the statistical analysis is limited to the situations when the Holmes et al. [2009] estimates are available (in the plots the NN retrievals are shown whenever they are available). [20] The Ts time series and scatterplots show that the two microwave estimates, clear and cloudy, capture the in situ Ts variability reasonably well. For stations 2 and 67 (temperate zone) the annual cycle is correctly reproduced (high correlation coefficient between the satellite estimates and the in situ measurements), as well as significant synoptic changes (e.g., the cold air outbreak in mid-march at station 2). At station 44 in the Tropics, the amplitude of the annual cycle is small and, as a consequence, the correlation coefficient tends to be lower. There are notable very large Ts values reported at CEOP station 44 (in May for instance) that are not reproduced by the satellites (similar situations occur in summer for station 2). Measurements of the surface air temperature are more direct and easier to make than in situ Ts measurements: the consistency of the Ts CEOP measurements at station 44 has been evaluated by comparison to the observed surface air temperatures. These large fluctuations observed under cloudy conditions in May for this station do not coincide with comparable changes in surface air temperatures, so they are suspect. For the two temperate stations, the performances of the Holmes et al. [2009] algorithm are very different: for instance the bias is 1.5 K under clear conditions at station 2 but 5.16 K at station 67. This behavior is caused by different Table 1. Statistics of the Difference Between the IR and the Microwave Estimates for Different Surfaces, as Separated by Their Microwave Emissivities at 37 GHz Vertical Polarization a emis37v < < emis37v < < emis37v MW1 Retrieval January 0.70 (3.52) 0.52 (3.40) 0.47 (3.89) July 1.75 (4.43) 0.68 (3.54) 0.48 (3.49) MW2 Retrieval January (4.19) 4.52 (3.16) 1.50 (1.99) July (4.73) 4.45 (3.56) 1.31 (1.86) a The mean value is indicated as well as the standard deviation into brackets. MW1 indicates the neural network microwave retrieval [Aires et al., 2001], and MW2 the single channel algorithm [Holmes et al., 2009]. 6of11
.")
7 Figure 4 7of11
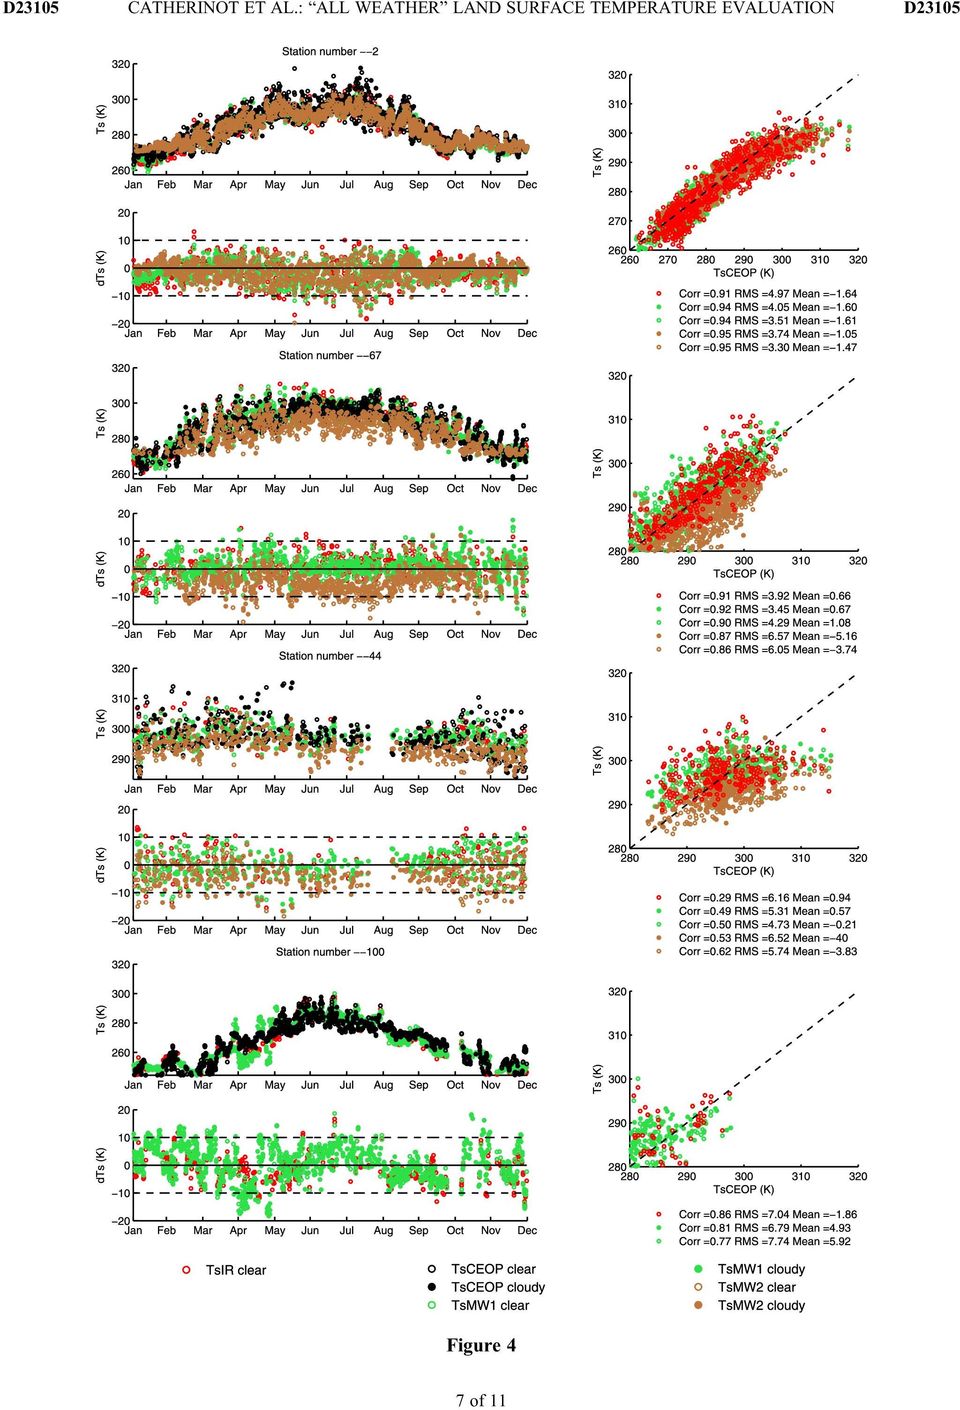
8 surface emissivities at these two locations, a variable that is not accounted for in this algorithm. Our NN retrieval obtained annual average emissivities at 37 GHz vertical of 0.92 and 0.95 at these two locations, which would explain temperature differences of nearly 6 K. At station 100 (boreal climate) the differences between the in situ and satellitederived estimates are larger than elsewhere, although the correlation coefficient is still good for our retrieval. The snow and ice emissivities are highly variable in time [Prigent et al., 2003b; Cordisco et al., 2006], and as a consequence, larger errors in the Ts estimates are expected over these surface types, especially during transition times, when the surface undergoes freezing and thawing cycles. [21] Regardless of the station, our microwave retrieval performances are similar to the infrared products under clear conditions. In addition, the microwave retrieval approach performs just about as well under cloudy as under clear conditions: the impact of clouds on the microwave measurements is correctly accounted for in the retrievals. This confirms the ability of the microwave observations to provide Ts estimates, regardless of the cloud conditions. [22] Figure 5 examines the problem of comparing spatially integrated satellite measurements and in situ point measurements. For two contrasted months (January and July), the difference between the CEOP Ts measurements and the satellite estimates are plotted, for stations 2 (temperate) and 44 (tropical). The analysis for the other stations showed similar results. Regardless of the satellite estimates, microwave or infrared, the relationship between the two variables shows a linear decrease with increasing CEOP Ts temperatures. Even larger variations and differences were found for other, less homogeneous locations. Closer examination of this relationship shows that it is related to the averaging effect of the satellite estimates: within a month, the extreme high and low temperatures that are captured by the CEOP in situ measurements are smoothed out within the satellite field-of-view, and, as a consequence, the satellite estimates tend to overestimate (resp. underestimate), the lowest (resp. the highest) values. [23] As a further evaluation of the satellite estimates, their sensitivity to the water vapor (WV) and to the cloud water (CLW) is analyzed. Figure 6 shows the difference between the CEOP and satellite Ts, for stations 2 and 44, first versus the WV derived from coincident NCEP reanalysis [Kalnay et al., 1996], second versus the CLW derived from ISCCP [Rossow and Schiffer, 1999]. There is no obvious influence of WV or CLW on the Ts retrieval, regardless of the method (of course, the IR estimates is not considered under cloudy conditions). The lack of sensitivity of the microwave retrieval to the cloud liquid water path is very encouraging, making this technique a powerful complement to the infrared methods under cloudy conditions. [24] To evaluate the sensitivity of the microwave satellite retrieval to the changes in surface emissivities, we compare differences between the CEOP and satellite Ts values Figure 5. Difference between the CEOP and the satellite Ts versus the CEOP Ts, for the two selected stations and for two months. versus the emissivities at 37 GHz (vertical polarization), for all midlatitude stations during 2003 (Figure 7). Here again, it appears that when the emissivity is not taken into account in the retrieval as in the Holmes et al. [2009] method, the quality Figure 4. (left) Time series for the selected stations, from top to bottom: two temperature stations (2 and 67), one tropical station (44), and one boreal station (100). For each of the stations, the top plot represents the different LST versus time and the lower one represents the Ts differences (CEOP Ts -satellite Ts) versus time, for year (right) Relationship between the satellite-derived Ts estimates and the CEOP measurements. The linear correlation (C), the r.m.s. of the difference (R), and the mean difference (M), are indicated for each satellite retrieval, separated by clear and cloudy conditions. 8of11

9 Figure 6. For two selected stations, difference between the CEOP and the satellite Ts versus the water vapor (WV) estimated by NCEP (top for each station) and versus the cloud liquid water path (CLW) estimated by ISCCP (bottom for each station). retrieval. For a specific environment, the results are similar among the stations, except for the Holmes et al. [2009] retrieval. To summarize the results, Figure 8 shows the standard deviation of the differences between CEOP and satellite Ts versus the correlation coefficient for all selected stations, along with the bias. For the IR and NN MW methodologies, the stations located in the temperate region show rather large correlation with small standard deviations and biases. For the microwave retrievals, the results are very similar for both clear and cloudy situations, confirming the role of the microwave estimates to complement the IR methodologies under cloudy conditions. [26] The r.m.s. differences are typically of the order of 4 K for the midlatitude environment, but can be larger for other environments. Particularly large errors are observed at station 6 in the Tropics, regardless of the satellite method. For this station, we compared the Tair and Ts in situ measurements, along with the satellite Ts from different sources under clear sky conditions (ISCCP, MODIS, AIRS) (see C. Jiménez et al., manuscript in preparation, 2011). Both Ts and Tair are lower during the day than during the night (more than 10 K lower in January) and it seems that the Ts and Tair variables have been switched because there is good agreement between the satellite Ts and the in situ Tair, but not with the in situ Ts. The validity of the in situ measurements at this station is suspect. [27] For all comparisons, a portion of the error is related to the comparison area-averaged satellite data with in situ point measurements. It has been shown that for a given location, satellite retrieval tends to underestimate the largest Ts values and to overestimate the smallest Ts values because of the averaging. The errors that are observed in this study are in line with other results, from independent comparisons involving satellite estimates and in situ measurements. For instance, Trigo et al. [2008] compared Ts derived from the Meteosat Second Generation SEVIRI instrument and in situ measurements under very controlled conditions and found biases up to 2.5 K, during nighttime. At SSM/I overpassing times (around 6:00 and 18:00), insolation can yield large temporal and spatial gradients of Ts, making it more difficult of the microwave estimate of Ts depends upon the situation, with more errors attached to the situations that are not well captured by the retrieval (the situations of lower emissivities in our case). This confirms what has already been observed in section 3.1. Note nevertheless that a slightly negative slope is also observed for the ISCCP and microwave NN results: It is actually related to the fact that higher emissivities tend to occur for higher temperatures in the data set we have, and larger differences are associated to these situations Statistical Analysis of the CEOP Data for Different Environments [25] The previous comparisons are extended to the complete set of selected CEOP stations over a full annual cycle. Table 2 presents the results for each station and each satellite Figure 7. For the stations in mid latitude environment (group 2), difference between the CEOP and the satellite Ts versus the surface microwave emissivity at 37 GHz vertical polarization. The linear fits have been added to the plots. 9of11
![by ISCCP (bottom for each station). retrieval. For a specific environment, the results are similar among the stations, except for the Holmes et al. [2009] retrieval.](/docs-images/53/11831736/images/page_9.jpg "To summarize the results, Figure 8 shows the standard deviation of the differences between CEOP and satellite Ts versus the correlation coefficient for all selected stations, along with the bias.")
10 Table 2. Statistics of the Difference Between the Satellite Estimates and the CEOP in Situ Measurements, Over 2003, for All Selected Stations a Region and Station T IR T CEOP T MW1 T CEOP T MW2 T CEOP Clear Clear Cloudy Clear Cloudy Mean RMS Corr Mean RMS Corr Mean RMS Corr Mean RMS Corr Mean RMS Corr MidLat Tropics Boreal a The mean, the r.m.s. and the correlation coefficient are indicated, separately for clear and cloudy situations, respectively for the IR ISCCP estimates, for the NN microwave retrieval (MW1), and for the single channel microwave retrieval (MW2). For the Boreal stations, MW2 cannot be applied as the pixels have more than 4% water coverage. to compare in situ and satellite observations that are not exactly coincident in time and space. 4. Conclusion [28] Microwave satellite estimates of surface skin temperature are carefully evaluated through comparisons with in situ CEOP measurements in different environments that include temperate, tropical, and boreal regions, over a full annual cycle (2003). In addition, the IR ISCCP Ts are also examined and compared to the other measurements. Comparison between satellite observations over extended pixels and in situ point measurements is always challenging and requires great care. In this exercise, we select in situ stations that are located in homogeneous environments and that provide a significant amount of data all year long. A total of twelve stations are analyzed. [29] Under clear sky conditions, the quality of our microwave neural network retrieval is equivalent to the IR ISCCP products, for most stations. For a given location, the performance of the microwave algorithm is similar under clear and cloudy conditions, confirming that our retrieval has accounted for the limited effect of the clouds. A simpler approach, the Holmes et al. [2009] algorithm also yields realistic estimates of Ts, when the surface emissivity at 37 GHz (vertical polarization) is similar to that for the locations used to test the algorithm, i. e., near unity. In these regions, this simple algorithm can provide a Ts first guess that could be further refined in a more complex algorithm, such as in our NN methodology. [30] Our microwave Ts estimates have been calculated for more than 15 years (1993 to mid 2008), from all available SSM/I observations. The same methodology could be applied to AMSR-E measurements. These all weather Ts estimates are a very valuable complement to the IR-derived Ts, for use in atmospheric and surface models. [31] However, the accuracy of the products has to be carefully considered, especially when used to calculate radiative and turbulent fluxes. The longwave fluxes at the surface vary by about 7 W.m 2 for every degree of temperature [Zhang et al., 1995]. For sensible flux estimation, the key variable is the difference between Ts and Tair and the uncertainty in one estimate can result in large errors in the fluxes. One of the objectives of the GEWEX LandFlux program [e.g., Jiménez et al., 2010] is to determine the Figure 8. Scatterplot of the standard deviation of the difference between CEOP and satellite Ts versus the correlation coefficient between the two variables, for each selected stations. Symbols (circles, squares, and triangles) indicate the considered satellite product. Empty symbols indicate clear sky conditions and filled symbols indicate cloudy conditions. The color of the symbols is representative of the station group (see Figure 1). The size of each symbol gives an idea of the bias (in absolute value). 10 of 11

11 potential for estimating the turbulent fluxes, given the available input data, including Ts, and to guide development of better products. [32] Acknowledgments. The authors wish to thank Thomas Holmes and Tom Jackson for their careful reading of the manuscript and their very valuable comments. They are also thankful to three anonymous reviewers for their careful reading and interesting suggestions. Work on this study by Catherinot and Rossow was supported by NASA grant NNXD7A090G, the NASA Energy and Water Study (NEWS). References Aires, F. (2004), Neural network uncertainty assessment using Bayesian statistics with application to remote sensing: 1. Network weights, J. Geophys. Res., 109, D10303, doi: /2003jd Aires, F., C. Prigent, W. B. Rossow, and M. Rothstein (2001), A new neural network approach including first guess for retrieval of atmospheric water vapor, cloud liquid water path, surface temperature, and emissivities over land from satellite microwave observations, J. Geophys. Res., 106, 14,887 14,907. Aires, F., C. Prigent, and W. B. Rossow (2004a), Neural network uncertainty assessment using Bayesian statistics with application to remote sensing: 2. Output errors, J. Geophys. Res., 109, D10304, doi: / 2003JD Aires, F., C. Prigent, and W. B. Rossow (2004b), Neural network uncertainty assessment using Bayesian statistics with application to remote sensing: 3. Network Jacobians, J. Geophys. Res., 109, D10305, doi: /2003jd Baldocchi, D., et al. (2001), FLUXNET: A new tool to study the temporal and spatial variability of ecosystem-scale carbon dioxide, water vapor, and energy flux densities, Bull. Am. Meteorol. Soc., 82, Basist, A., N. C. Grody, T. C. Peterson, and C. N. Williams (1998), Using the Special Sensor Microwave/Imager to monitor land surface temperatures, wetness, and snow cover, J. Atmos. Sci., 37, Cordisco, E., C. Prigent, and F. Aires (2006), Snow characterization at a global scale with passive microwave satellite observations, J. Geophys. Res., 111, D19102, doi: /2005jd Eyre, J. R., G. A. Kelly, A. P. McNally, E. Andersson, and A. Persson (1993), Assimilation of TOVS radiance information through one-dimensional variational analysis, Q. J. R. Meteorol. Soc., 119, Holmes, T. R. H., R. A. M. De Jeu, M. Owe, and A. J. Dolman (2009), Land surface temperature from Ka band (37 GHz) passive microwave observations, J. Geophys. Res., 114, D04113, doi: /2008jd Jiménez, C., J. Catherinot, C. Prigent, and J. Roger (2010), Relations between geological characteristics and satellite-derived infrared and microwave emissivities over deserts in northern Africa and the Arabian Peninsula, J. Geophys. Res., 115, D20311, doi: /2010jd Jones, L. A., C. R. Ferguson, J. S. Kimball, K. Zhang, S. T. K. Chan, K. C. McDonnald, E. G. Njoku, and E. Wood (2010), Satellite microwave remote sensing of daily land surface air temperature minima and maxima from AMSR-E, IIEEE J. Sel. Top. Appl. Earth Obs. Remote Sens., 3, Kalnay, E., et al. (1996), The NCEP/NCAR 40-year reanalysis project, Bull. Am. Meteorol. Soc., 77, Loveland, T. R., B. C. Reed, J. F. Brown, D. O. Ohlen, J. Zhu, L. Yang, and J. W. Merchant (2000), Development of a global land cover characteristics database and IGBP DISCover from 1 km AVHRR data, Int. J. Remote Sens., 21, MacFarland, J. M., R. L. Miller, and C. M. U. Neale (1990), Land surface temperature derived from the SSM/I passive microwave brightness temperatures, IEEE Trans. Geosci. Remote Sens., 28, Matthews, E. (1983), Global vegetation and land use: New high-resolution data bases for climate studies, J. Clim. Appl. Meteorol., 22, Njoku, E. G. (1995), Surface temperature estimation over land using satellite microwave radiometry, in Passive Microwave Remote Sensing of Land-Atmosphere Interaction, edited by B. J. Choudhury et al., pp , VSP, Utrecht, Netherlands. Prata, A. (1993), Land surface temperatures derived from the advanced very high resolution radiometer and the along-track scanning radiometer: 1. Theory, J. Geophys. Res., 98, 16,689 16,702. Prata, A. (1994), Land surface temperatures derived from the advanced very high resolution radiometer and the along-track scanning radiometer: 2. Experimental results and validation of AVHRR algorithms, J. Geophys. Res., 99, 13,025 13,058. Prigent, C., W. B. Rossow, and E. Matthews (1997), Microwave land surface emissivities estimated from SSM/I observations, J. Geophys. Res., 102, 21,867 21,890. Prigent, C., F. Aires, and W. B. Rossow (2003a), Land surface skin temperatures from a combined analysis of microwave and infrared satellite observations for an all-weather evaluation of the differences between air and skin temperatures, J. Geophys. Res., 108(D10), 4310, doi: / 2002JD Prigent, C., F. Aires, and W. B. Rossow (2003b), Retrieval of surface and atmospheric geophysical variables over snow-covered land from combined microwave and infrared satellite observations, J. Appl. Meteorol., 42, , doi: / (2003)042<0368:rosaag>2.0.co;2. Prigent, C., J. Munier, B. Thomas, and G. Ruffié (2005), Microwave signatures over carbonate sedimentary platforms in arid areas: Potential geological applications of passive microwave observations?, Geophys. Res. Lett., 32, L23405, doi: /2005gl Prigent, C., F. Aires, and W. B. Rossow (2006), Land surface microwave emissivities over the globe for a decade, Bull. Am. Meteorol. Soc., 87, , doi: /bams Rossow, W. B., and L. C. Garder (1993), Validation of ISCCP cloud detections, J. Clim., 6, Rossow, W. B., and R. A. Schiffer (1999), Advances in understanding clouds from ISCCP, Bull. Am. Meteorol. Soc., 80, , doi: / (1999)080<2261:aiucfi>2.0.co;2. Rossow, W. B., A. W. Walker, and L. C. Garder (1993), Comparison of ISCCP and other cloud amounts, J. Clim., 6, , doi: / (1993)006<2394:COIAOC>2.0.CO;2. Royer, A., and S. Poirier (2010), Surface temperature spatial and temporal variations in North America from homogenized satellite SMMR-SSM/I microwave measurements and reanalysis for , J. Geophys. Res., 115, D08110, doi: /2009jd Trigo, I. F., I. T. Monteiro, F. Olesen, and E. Kabsch (2008), An assessment of remotely sensed land surface temperature, J. Geophys. Res., 113, D17108, doi: /2008jd Wen, J., Z. Su, and Y. Ma (2003), Determination of land surface temperature and soil moisture from Tropical Rainfall Measuring Mission/ Microwave Imager remote sensing data, J. Geophys. Res., 108(D2), 4038, doi: /2002jd Weng, F., and N. C. Grody (1998), Physical retrieval of land surface temperature using the special sensor microwave imager, J. Geophys. Res., 103, Williams, C. N., A. Basist, T. C. Peterson, and N. Grody (2000), Calibration and verification of land surface temperature anomalies derived from the SSM/I, Bull. Am. Meteorol. Soc., 81, Zhang, Y.-C., W. B. Rossow, and A. A. Lacis (1995), Calculation of surface and top-of-atmosphere radiative fluxes from physical quantities based on ISCCP data sets: 1. Methods and sensitivity to input data uncertainties, J. Geophys. Res., 100, , doi: /94jd Zhang, Y.-C., W. B. Rossow, and P. W. Stackhouse Jr. (2006), Comparison of different global information sources used in surface radiative flux calculation: Radiative properties of the near-surface atmosphere, J. Geophys. Res., 111, D13106, doi: /2005jd Zhang, Y.-C., C. N. Long, W. B. Rossow, and E. G. Dutton (2010), Exploiting diurnal variations to evaluate the ISCCP-FD flux calculations and radiative-flux-analysis-processed surface observations from BSRN, ARM, and SURFRAD, J. Geophys. Res., 115, D15105, doi: / 2009JD F. Aires, Estellus, 93 Boulevard de Sébastopol, F Paris, France. J. Catherinot, C. Jiménez, and C. Prigent, Laboratoire d Etudes du Rayonnement et de la Matière en Astrophysique, Observatoire de Paris, CNRS, F Paris, France. (catherine.prigent@obspm.fr) R. Maurer, NASA Goddard Institute for Space Studies, Columbia University, 2880 Broadway, New York, NY 10025, USA. F. Papa, Laboratoire d Etudes en Géophysique et Océanographie Spatiales, IRD, 18 Avenue Edouard Belin, F Toulouse, France. W. B. Rossow, NOAA Cooperative Remote Sensing Science and Technology Center, City College of New York, New York, NY 10031, USA. 11 of 11
. References Aires, F.")
Evaluation of the Effect of Upper-Level Cirrus Clouds on Satellite Retrievals of Low-Level Cloud Droplet Effective Radius
 Evaluation of the Effect of Upper-Level Cirrus Clouds on Satellite Retrievals of Low-Level Cloud Droplet Effective Radius F.-L. Chang and Z. Li Earth System Science Interdisciplinary Center University
Clear Sky Radiance (CSR) Product from MTSAT-1R. UESAWA Daisaku* Abstract
 Product from MTSAT-1R. UESAWA Daisaku* Abstract") Clear Sky Radiance (CSR) Product from MTSAT-1R UESAWA Daisaku* Abstract The Meteorological Satellite Center (MSC) has developed a Clear Sky Radiance (CSR) product from MTSAT-1R and has been disseminating
Clear Sky Radiance (CSR) Product from MTSAT-1R UESAWA Daisaku* Abstract The Meteorological Satellite Center (MSC) has developed a Clear Sky Radiance (CSR) product from MTSAT-1R and has been disseminating
Radiative effects of clouds, ice sheet and sea ice in the Antarctic
 Snow and fee Covers: Interactions with the Atmosphere and Ecosystems (Proceedings of Yokohama Symposia J2 and J5, July 1993). IAHS Publ. no. 223, 1994. 29 Radiative effects of clouds, ice sheet and sea
Cloud detection and clearing for the MOPITT instrument
 Cloud detection and clearing for the MOPITT instrument Juying Warner, John Gille, David P. Edwards and Paul Bailey National Center for Atmospheric Research, Boulder, Colorado ABSTRACT The Measurement Of
Passive and Active Microwave Remote Sensing of Cold-Cloud Precipitation : Wakasa Bay Field Campaign 2003
 Passive and Active Microwave Remote Sensing of Cold-Cloud Precipitation : Wakasa Bay Field Campaign 3 Benjamin T. Johnson,, Gail Skofronick-Jackson 3, Jim Wang 3, Grant Petty jbenjam@neptune.gsfc.nasa.gov
Comparison of NOAA's Operational AVHRR Derived Cloud Amount to other Satellite Derived Cloud Climatologies.
 Comparison of NOAA's Operational AVHRR Derived Cloud Amount to other Satellite Derived Cloud Climatologies. Sarah M. Thomas University of Wisconsin, Cooperative Institute for Meteorological Satellite Studies
Authors: Thierry Phulpin, CNES Lydie Lavanant, Meteo France Claude Camy-Peyret, LPMAA/CNRS. Date: 15 June 2005
 Comments on the number of cloud free observations per day and location- LEO constellation vs. GEO - Annex in the final Technical Note on geostationary mission concepts Authors: Thierry Phulpin, CNES Lydie
SYNERGISTIC USE OF IMAGER WINDOW OBSERVATIONS FOR CLOUD- CLEARING OF SOUNDER OBSERVATION FOR INSAT-3D
 SYNERGISTIC USE OF IMAGER WINDOW OBSERVATIONS FOR CLOUD- CLEARING OF SOUNDER OBSERVATION FOR INSAT-3D ABSTRACT: Jyotirmayee Satapathy*, P.K. Thapliyal, M.V. Shukla, C. M. Kishtawal Atmospheric and Oceanic
Interactive comment on Total cloud cover from satellite observations and climate models by P. Probst et al.
 Interactive comment on Total cloud cover from satellite observations and climate models by P. Probst et al. Anonymous Referee #1 (Received and published: 20 October 2010) The paper compares CMIP3 model
Near Real Time Blended Surface Winds
 Near Real Time Blended Surface Winds I. Summary To enhance the spatial and temporal resolutions of surface wind, the remotely sensed retrievals are blended to the operational ECMWF wind analyses over the
Estimating Firn Emissivity, from 1994 to1998, at the Ski Hi Automatic Weather Station on the West Antarctic Ice Sheet Using Passive Microwave Data
 Estimating Firn Emissivity, from 1994 to1998, at the Ski Hi Automatic Weather Station on the West Antarctic Ice Sheet Using Passive Microwave Data Mentor: Dr. Malcolm LeCompte Elizabeth City State University
Technical note on MISR Cloud-Top-Height Optical-depth (CTH-OD) joint histogram product
 joint histogram product") Technical note on MISR Cloud-Top-Height Optical-depth (CTH-OD) joint histogram product 1. Intend of this document and POC 1.a) General purpose The MISR CTH-OD product contains 2D histograms (joint distributions)
Technical note on MISR Cloud-Top-Height Optical-depth (CTH-OD) joint histogram product 1. Intend of this document and POC 1.a) General purpose The MISR CTH-OD product contains 2D histograms (joint distributions)
ECMWF Aerosol and Cloud Detection Software. User Guide. version 1.2 20/01/2015. Reima Eresmaa ECMWF
 ECMWF Aerosol and Cloud User Guide version 1.2 20/01/2015 Reima Eresmaa ECMWF This documentation was developed within the context of the EUMETSAT Satellite Application Facility on Numerical Weather Prediction
Clouds and the Energy Cycle
 August 1999 NF-207 The Earth Science Enterprise Series These articles discuss Earth's many dynamic processes and their interactions Clouds and the Energy Cycle he study of clouds, where they occur, and
IMPACTS OF IN SITU AND ADDITIONAL SATELLITE DATA ON THE ACCURACY OF A SEA-SURFACE TEMPERATURE ANALYSIS FOR CLIMATE
 INTERNATIONAL JOURNAL OF CLIMATOLOGY Int. J. Climatol. 25: 857 864 (25) Published online in Wiley InterScience (www.interscience.wiley.com). DOI:.2/joc.68 IMPACTS OF IN SITU AND ADDITIONAL SATELLITE DATA
Overview of the IR channels and their applications
 Ján Kaňák Slovak Hydrometeorological Institute Jan.kanak@shmu.sk Overview of the IR channels and their applications EUMeTrain, 14 June 2011 Ján Kaňák, SHMÚ 1 Basics in satellite Infrared image interpretation
Temporal variation in snow cover over sea ice in Antarctica using AMSR-E data product
 Temporal variation in snow cover over sea ice in Antarctica using AMSR-E data product Michael J. Lewis Ph.D. Student, Department of Earth and Environmental Science University of Texas at San Antonio ABSTRACT
Fundamentals of Climate Change (PCC 587): Water Vapor
: Water Vapor") Fundamentals of Climate Change (PCC 587): Water Vapor DARGAN M. W. FRIERSON UNIVERSITY OF WASHINGTON, DEPARTMENT OF ATMOSPHERIC SCIENCES DAY 2: 9/30/13 Water Water is a remarkable molecule Water vapor
Fundamentals of Climate Change (PCC 587): Water Vapor DARGAN M. W. FRIERSON UNIVERSITY OF WASHINGTON, DEPARTMENT OF ATMOSPHERIC SCIENCES DAY 2: 9/30/13 Water Water is a remarkable molecule Water vapor
Daily High-resolution Blended Analyses for Sea Surface Temperature
 Daily High-resolution Blended Analyses for Sea Surface Temperature by Richard W. Reynolds 1, Thomas M. Smith 2, Chunying Liu 1, Dudley B. Chelton 3, Kenneth S. Casey 4, and Michael G. Schlax 3 1 NOAA National
Improvement in the Assessment of SIRS Broadband Longwave Radiation Data Quality
 Improvement in the Assessment of SIRS Broadband Longwave Radiation Data Quality M. E. Splitt University of Utah Salt Lake City, Utah C. P. Bahrmann Cooperative Institute for Meteorological Satellite Studies
RESULTS FROM A SIMPLE INFRARED CLOUD DETECTOR
 RESULTS FROM A SIMPLE INFRARED CLOUD DETECTOR A. Maghrabi 1 and R. Clay 2 1 Institute of Astronomical and Geophysical Research, King Abdulaziz City For Science and Technology, P.O. Box 6086 Riyadh 11442,
Precipitation Remote Sensing
 Precipitation Remote Sensing Huade Guan Prepared for Remote Sensing class Earth & Environmental Science University of Texas at San Antonio November 14, 2005 Outline Background Remote sensing technique
Seasonal & Daily Temperatures. Seasons & Sun's Distance. Solstice & Equinox. Seasons & Solar Intensity
 Seasonal & Daily Temperatures Seasons & Sun's Distance The role of Earth's tilt, revolution, & rotation in causing spatial, seasonal, & daily temperature variations Please read Chapter 3 in Ahrens Figure
The Next Generation Flux Analysis: Adding Clear-Sky LW and LW Cloud Effects, Cloud Optical Depths, and Improved Sky Cover Estimates
 The Next Generation Flux Analysis: Adding Clear-Sky LW and LW Cloud Effects, Cloud Optical Depths, and Improved Sky Cover Estimates C. N. Long Pacific Northwest National Laboratory Richland, Washington
Improved diagnosis of low-level cloud from MSG SEVIRI data for assimilation into Met Office limited area models
 Improved diagnosis of low-level cloud from MSG SEVIRI data for assimilation into Met Office limited area models Peter N. Francis, James A. Hocking & Roger W. Saunders Met Office, Exeter, U.K. Abstract
A SURVEY OF CLOUD COVER OVER MĂGURELE, ROMANIA, USING CEILOMETER AND SATELLITE DATA
 Romanian Reports in Physics, Vol. 66, No. 3, P. 812 822, 2014 ATMOSPHERE PHYSICS A SURVEY OF CLOUD COVER OVER MĂGURELE, ROMANIA, USING CEILOMETER AND SATELLITE DATA S. STEFAN, I. UNGUREANU, C. GRIGORAS
VALIDATION OF SAFNWC / MSG CLOUD PRODUCTS WITH ONE YEAR OF SEVIRI DATA
 VALIDATION OF SAFNWC / MSG CLOUD PRODUCTS WITH ONE YEAR OF SEVIRI DATA M.Derrien 1, H.Le Gléau 1, Jean-François Daloze 2, Martial Haeffelin 2 1 Météo-France / DP / Centre de Météorologie Spatiale. BP 50747.
Studying cloud properties from space using sounder data: A preparatory study for INSAT-3D
 Studying cloud properties from space using sounder data: A preparatory study for INSAT-3D Munn V. Shukla and P. K. Thapliyal Atmospheric Sciences Division Atmospheric and Oceanic Sciences Group Space Applications
AATSR Technical Note. Improvements to the AATSR IPF relating to Land Surface Temperature Retrieval and Cloud Clearing over Land
 AATSR Technical Note Improvements to the AATSR IPF relating to Land Surface Temperature Retrieval and Cloud Clearing over Land Author: Andrew R. Birks RUTHERFORD APPLETON LABORATORY Chilton, Didcot, Oxfordshire
16 th IOCCG Committee annual meeting. Plymouth, UK 15 17 February 2011. mission: Present status and near future
 16 th IOCCG Committee annual meeting Plymouth, UK 15 17 February 2011 The Meteor 3M Mt satellite mission: Present status and near future plans MISSION AIMS Satellites of the series METEOR M M are purposed
Observed Cloud Cover Trends and Global Climate Change. Joel Norris Scripps Institution of Oceanography
 Observed Cloud Cover Trends and Global Climate Change Joel Norris Scripps Institution of Oceanography Increasing Global Temperature from www.giss.nasa.gov Increasing Greenhouse Gases from ess.geology.ufl.edu
Analysis of Cloud Variability and Sampling Errors in Surface and Satellite Measurements
 Analysis of Cloud Variability and Sampling Errors in Surface and Satellite Measurements Z. Li, M. C. Cribb, and F.-L. Chang Earth System Science Interdisciplinary Center University of Maryland College
3.4 Cryosphere-related Algorithms
 3.4 Cryosphere-related Algorithms GLI Algorithm Description 3.4.-1 3.4.1 CTSK1 A. Algorithm Outline (1) Algorithm Code: CTSK1 (2) Product Code: CLFLG_p (3) PI Name: Dr. Knut Stamnes (4) Overview of Algorithm
Volcanic Ash Monitoring: Product Guide
 Doc.No. Issue : : EUM/TSS/MAN/15/802120 v1a EUMETSAT Eumetsat-Allee 1, D-64295 Darmstadt, Germany Tel: +49 6151 807-7 Fax: +49 6151 807 555 Date : 2 June 2015 http://www.eumetsat.int WBS/DBS : EUMETSAT
NCDC s SATELLITE DATA, PRODUCTS, and SERVICES
 **** NCDC s SATELLITE DATA, PRODUCTS, and SERVICES Satellite data and derived products from NOAA s satellite systems are available through the National Climatic Data Center. The two primary systems are
Towards assimilating IASI satellite observations over cold surfaces - the cloud detection aspect
 Towards assimilating IASI satellite observations over cold surfaces - the cloud detection aspect Tuuli Perttula, FMI + Thanks to: Nadia Fourrié, Lydie Lavanant, Florence Rabier and Vincent Guidard, Météo
Assessing Cloud Spatial and Vertical Distribution with Infrared Cloud Analyzer
 Assessing Cloud Spatial and Vertical Distribution with Infrared Cloud Analyzer I. Genkova and C. N. Long Pacific Northwest National Laboratory Richland, Washington T. Besnard ATMOS SARL Le Mans, France
Validating MOPITT Cloud Detection Techniques with MAS Images
 Validating MOPITT Cloud Detection Techniques with MAS Images Daniel Ziskin, Juying Warner, Paul Bailey, John Gille National Center for Atmospheric Research, P.O. Box 3000, Boulder, CO 80307 ABSTRACT The
The Surface Energy Budget
 The Surface Energy Budget The radiation (R) budget Shortwave (solar) Radiation Longwave Radiation R SW R SW α α = surface albedo R LW εσt 4 ε = emissivity σ = Stefan-Boltzman constant T = temperature Subsurface
Measurement of the effect of biomass burning aerosol on inhibition of cloud formation over the Amazon
 Supporting Online Material for Koren et al. Measurement of the effect of biomass burning aerosol on inhibition of cloud formation over the Amazon 1. MODIS new cloud detection algorithm The operational
Solar Flux and Flux Density. Lecture 3: Global Energy Cycle. Solar Energy Incident On the Earth. Solar Flux Density Reaching Earth
 Lecture 3: Global Energy Cycle Solar Flux and Flux Density Planetary energy balance Greenhouse Effect Vertical energy balance Latitudinal energy balance Seasonal and diurnal cycles Solar Luminosity (L)
Evaluation of VIIRS cloud top property climate data records and their potential improvement with CrIS
 Evaluation of VIIRS cloud top property climate data records and their potential improvement with CrIS Dr. Bryan A. Baum (PI) Space Science and Engineering Center University of Wisconsin-Madison Madison,
Developing Continuous SCM/CRM Forcing Using NWP Products Constrained by ARM Observations
 Developing Continuous SCM/CRM Forcing Using NWP Products Constrained by ARM Observations S. C. Xie, R. T. Cederwall, and J. J. Yio Lawrence Livermore National Laboratory Livermore, California M. H. Zhang
Global Seasonal Phase Lag between Solar Heating and Surface Temperature
 Global Seasonal Phase Lag between Solar Heating and Surface Temperature Summer REU Program Professor Tom Witten By Abstract There is a seasonal phase lag between solar heating from the sun and the surface
Sensitivity of Surface Cloud Radiative Forcing to Arctic Cloud Properties
 Sensitivity of Surface Cloud Radiative Forcing to Arctic Cloud Properties J. M. Intrieri National Oceanic and Atmospheric Administration Environmental Technology Laboratory Boulder, Colorado M. D. Shupe
Precipitation, cloud cover and Forbush decreases in galactic cosmic rays. Dominic R. Kniveton 1. Journal of Atmosphere and Solar-Terrestrial Physics
 Precipitation, cloud cover and Forbush decreases in galactic cosmic rays Dominic R. Kniveton 1 Journal of Atmosphere and Solar-Terrestrial Physics 1 School of Chemistry, Physics and Environmental Science,
Use of ARM/NSA Data to Validate and Improve the Remote Sensing Retrieval of Cloud and Surface Properties in the Arctic from AVHRR Data
 Use of ARM/NSA Data to Validate and Improve the Remote Sensing Retrieval of Cloud and Surface Properties in the Arctic from AVHRR Data X. Xiong QSS Group, Inc. National Oceanic and Atmospheric Administration
All-sky assimilation of microwave imager observations sensitive to water vapour, cloud and rain
 All-sky assimilation of microwave imager observations sensitive to water vapour, cloud and rain A.J. Geer, P. Bauer, P. Lopez and D. Salmond European Centre for Medium-Range Weather Forecasts, Reading,
Cloud Masking and Cloud Products
 Cloud Masking and Cloud Products MODIS Operational Algorithm MOD35 Paul Menzel, Steve Ackerman, Richard Frey, Kathy Strabala, Chris Moeller, Liam Gumley, Bryan Baum MODIS Cloud Masking Often done with
ATM S 111, Global Warming: Understanding the Forecast
 ATM S 111, Global Warming: Understanding the Forecast DARGAN M. W. FRIERSON DEPARTMENT OF ATMOSPHERIC SCIENCES DAY 1: OCTOBER 1, 2015 Outline How exactly the Sun heats the Earth How strong? Important concept
Seasonal Temperature Variations
 Seasonal and Daily Temperatures Fig. 3-CO, p. 54 Seasonal Temperature Variations What causes the seasons What governs the seasons is the amount of solar radiation reaching the ground What two primary factors
Outline. Case Study over Vale do Paraiba 11 February 2012. Comparison of different rain rate retrievals for heavy. Future Work
 Outline Short description of the algorithms for rain rate retrievals from passive microwave radiometers on board low-orbiting satellites (i.e., SSMI/S) Case Study over Vale do Paraiba 11 February 2012
CERES Edition 2 & Edition 3 Cloud Cover, Cloud Altitude and Temperature
 CERES Edition 2 & Edition 3 Cloud Cover, Cloud Altitude and Temperature S. Sun-Mack 1, P. Minnis 2, Y. Chen 1, R. Smith 1, Q. Z. Trepte 1, F. -L. Chang, D. Winker 2 (1) SSAI, Hampton, VA (2) NASA Langley
Passive Remote Sensing of Clouds from Airborne Platforms
 Passive Remote Sensing of Clouds from Airborne Platforms Why airborne measurements? My instrument: the Solar Spectral Flux Radiometer (SSFR) Some spectrometry/radiometry basics How can we infer cloud properties
Supporting Online Material for
 www.sciencemag.org/cgi/content/full/1117368/dc1 Supporting Online Material for Role of Land-Surface Changes in Arctic Summer Warming F. S. Chapin III, 1 * M. Sturm, 2 M. C. Serreze, 3 J. P. McFadden, 4
Total radiative heating/cooling rates.
 Lecture. Total radiative heating/cooling rates. Objectives:. Solar heating rates.. Total radiative heating/cooling rates in a cloudy atmosphere.. Total radiative heating/cooling rates in different aerosol-laden
A review of cloud top height and optical depth histograms from MISR, ISCCP, and MODIS
 JOURNAL OF GEOPHYSICAL RESEARCH, VOL. 115,, doi:10.1029/2009jd013422, 2010 A review of cloud top height and optical depth histograms from MISR, ISCCP, and MODIS Roger Marchand, 1 Thomas Ackerman, 1 Mike
P1.21 GOES CLOUD DETECTION AT THE GLOBAL HYDROLOGY AND CLIMATE CENTER
 P1.21 GOES CLOUD DETECTION AT THE GLOBAL HYDROLOGY AND CLIMATE CENTER Gary J. Jedlovec* NASA/MSFC/Global Hydrology and Climate Center National Space Science and Technology Center Huntsville, Alabama and
Active Fire Monitoring: Product Guide
 Active Fire Monitoring: Product Guide Doc.No. Issue : : EUM/TSS/MAN/15/801989 v1c EUMETSAT Eumetsat-Allee 1, D-64295 Darmstadt, Germany Tel: +49 6151 807-7 Fax: +49 6151 807 555 Date : 14 April 2015 http://www.eumetsat.int
P1.24 USE OF ACTIVE REMOTE SENSORS TO IMPROVE THE ACCURACY OF CLOUD TOP HEIGHTS DERIVED FROM THERMAL SATELLITE OBSERVATIONS
 P1.24 USE OF ACTIVE REMOTE SENSORS TO IMPROVE THE ACCURACY OF CLOUD TOP HEIGHTS DERIVED FROM THERMAL SATELLITE OBSERVATIONS Chris R. Yost* Patrick Minnis NASA Langley Research Center, Hampton, Virginia
Evaluations of the CALIPSO Cloud Optical Depth Algorithm Through Comparisons with a GOES Derived Cloud Analysis
 Generated using V3.0 of the official AMS LATEX template Evaluations of the CALIPSO Cloud Optical Depth Algorithm Through Comparisons with a GOES Derived Cloud Analysis Katie Carbonari, Heather Kiley, and
Microwave observations in the presence of cloud and precipitation
 Microwave observations in the presence of cloud and precipitation Alan Geer Thanks to: Bill Bell, Peter Bauer, Fabrizio Baordo, Niels Bormann Slide 1 ECMWF/EUMETSAT satellite course 2015: Microwave 2 Slide
Cloud Oxygen Pressure Algorithm for POLDER-2
 Cloud Oxygen ressure Algorithm for OLDER-2 1/7 Cloud Oxygen ressure Algorithm for OLDER-2 Aim of the : Determination of cloud gen pressure from arent pressure by removing the contribution. Date of the
RADIATION IN THE TROPICAL ATMOSPHERE and the SAHEL SURFACE HEAT BALANCE. Peter J. Lamb. Cooperative Institute for Mesoscale Meteorological Studies
 RADIATION IN THE TROPICAL ATMOSPHERE and the SAHEL SURFACE HEAT BALANCE by Peter J. Lamb Cooperative Institute for Mesoscale Meteorological Studies and School of Meteorology The University of Oklahoma
The ozone hole indirect effect: Cloud-radiative anomalies accompanying the poleward shift of the eddy-driven jet in the Southern Hemisphere
 GEOPHYSICAL RESEARCH LETTERS, VOL., 1 5, doi:1.1/grl.575, 1 The ozone hole indirect effect: Cloud-radiative anomalies accompanying the poleward shift of the eddy-driven jet in the Southern Hemisphere Kevin
Land Use/Land Cover Map of the Central Facility of ARM in the Southern Great Plains Site Using DOE s Multi-Spectral Thermal Imager Satellite Images
 Land Use/Land Cover Map of the Central Facility of ARM in the Southern Great Plains Site Using DOE s Multi-Spectral Thermal Imager Satellite Images S. E. Báez Cazull Pre-Service Teacher Program University
How To Understand Cloud Properties From Satellite Imagery
 P1.70 NIGHTTIME RETRIEVAL OF CLOUD MICROPHYSICAL PROPERTIES FOR GOES-R Patrick W. Heck * Cooperative Institute for Meteorological Satellite Studies, University of Wisconsin-Madison Madison, Wisconsin P.
Huai-Min Zhang & NOAAGlobalTemp Team
 Improving Global Observations for Climate Change Monitoring using Global Surface Temperature (& beyond) Huai-Min Zhang & NOAAGlobalTemp Team NOAA National Centers for Environmental Information (NCEI) [formerly:
The NASA NEESPI Data Portal to Support Studies of Climate and Environmental Changes in Non-boreal Europe
 The NASA NEESPI Data Portal to Support Studies of Climate and Environmental Changes in Non-boreal Europe Suhung Shen NASA Goddard Space Flight Center/George Mason University Gregory Leptoukh, Tatiana Loboda,
Validation of SEVIRI cloud-top height retrievals from A-Train data
 Validation of SEVIRI cloud-top height retrievals from A-Train data Chu-Yong Chung, Pete N Francis, and Roger Saunders Contents Introduction MO GeoCloud AVAC-S Long-term monitoring Comparison with OCA Summary
Cloud Thickness Estimation from GOES-8 Satellite Data Over the ARM-SGP Site
 Cloud Thickness Estimation from GOES-8 Satellite Data Over the ARM-SGP Site V. Chakrapani, D. R. Doelling, and A. D. Rapp Analytical Services and Materials, Inc. Hampton, Virginia P. Minnis National Aeronautics
Climate and Global Dynamics e-mail: swensosc@ucar.edu National Center for Atmospheric Research phone: (303) 497-1761 Boulder, CO 80307
 497-1761 Boulder, CO 80307") Sean C. Swenson Climate and Global Dynamics P.O. Box 3000 swensosc@ucar.edu National Center for Atmospheric Research (303) 497-1761 Boulder, CO 80307 Education Ph.D. University of Colorado at Boulder,
Sean C. Swenson Climate and Global Dynamics P.O. Box 3000 swensosc@ucar.edu National Center for Atmospheric Research (303) 497-1761 Boulder, CO 80307 Education Ph.D. University of Colorado at Boulder,
5.5. San Diego (8/22/03 10/4/04)
") NSF UV SPECTRORADIOMETER NETWORK 23-24 OPERATIONS REPORT 5.5. San Diego (8/22/3 1/4/4) The 23-24 season at San Diego includes the period 8/22/3 1/4/4. In contrast to other network sites, San Diego serves
NSF UV SPECTRORADIOMETER NETWORK 23-24 OPERATIONS REPORT 5.5. San Diego (8/22/3 1/4/4) The 23-24 season at San Diego includes the period 8/22/3 1/4/4. In contrast to other network sites, San Diego serves
User Perspectives on Project Feasibility Data
 User Perspectives on Project Feasibility Data Marcel Šúri Tomáš Cebecauer GeoModel Solar s.r.o., Bratislava, Slovakia marcel.suri@geomodel.eu http://geomodelsolar.eu http://solargis.info Solar Resources
Comparison of Shortwave Cloud Radiative Forcing Derived from ARM SGP Surface and GOES-8 Satellite Measurements During ARESE-I and ARESE-II
 Comparison of Shortwave Cloud Radiative Forcing Derived from ARM SGP Surface and GOES-8 Satellite Measurements During ARESE-I and ARESE-II A. D. Rapp, D. R. Doelling, and M. M. Khaiyer Analytical Services
Impact of dataset choice on calculations of the short-term cloud feedback
 JOURNAL OF GEOPHYSICAL RESEARCH: ATMOSPHERES, VOL. 118, 2821 2826, doi:10.1002/jgrd.50199, 2013 Impact of dataset choice on calculations of the short-term cloud feedback A. E. Dessler 1 and N.G. Loeb 2
VIIRS-CrIS mapping. NWP SAF AAPP VIIRS-CrIS Mapping
 NWP SAF AAPP VIIRS-CrIS Mapping This documentation was developed within the context of the EUMETSAT Satellite Application Facility on Numerical Weather Prediction (NWP SAF), under the Cooperation Agreement
Diurnal Cycle of Convection at the ARM SGP Site: Role of Large-Scale Forcing, Surface Fluxes, and Convective Inhibition
 Thirteenth ARM Science Team Meeting Proceedings, Broomfield, Colorado, March 31-April 4, 23 Diurnal Cycle of Convection at the ARM SGP Site: Role of Large-Scale Forcing, Surface Fluxes, and Convective
SAMPLE MIDTERM QUESTIONS
 Geography 309 Sample MidTerm Questions Page 1 SAMPLE MIDTERM QUESTIONS Textbook Questions Chapter 1 Questions 4, 5, 6, Chapter 2 Questions 4, 7, 10 Chapter 4 Questions 8, 9 Chapter 10 Questions 1, 4, 7
Evaluating GCM clouds using instrument simulators
 Evaluating GCM clouds using instrument simulators University of Washington September 24, 2009 Why do we care about evaluation of clouds in GCMs? General Circulation Models (GCMs) project future climate
FRESCO. Product Specification Document FRESCO. Authors : P. Wang, R.J. van der A (KNMI) REF : TEM/PSD2/003 ISSUE : 3.0 DATE : 30.05.
 REF : TEM/PSD2/003 ISSUE : 3.0 DATE : 30.05.") PAGE : 1/11 TITLE: Product Specification Authors : P. Wang, R.J. van der A (KNMI) PAGE : 2/11 DOCUMENT STATUS SHEET Issue Date Modified Items / Reason for Change 0.9 19.01.06 First Version 1.0 22.01.06
PAGE : 1/11 TITLE: Product Specification Authors : P. Wang, R.J. van der A (KNMI) PAGE : 2/11 DOCUMENT STATUS SHEET Issue Date Modified Items / Reason for Change 0.9 19.01.06 First Version 1.0 22.01.06
Remote Sensing of Clouds from Polarization
 Remote Sensing of Clouds from Polarization What polarization can tell us about clouds... and what not? J. Riedi Laboratoire d'optique Atmosphérique University of Science and Technology Lille / CNRS FRANCE
CALCULATION OF CLOUD MOTION WIND WITH GMS-5 IMAGES IN CHINA. Satellite Meteorological Center Beijing 100081, China ABSTRACT
 CALCULATION OF CLOUD MOTION WIND WITH GMS-5 IMAGES IN CHINA Xu Jianmin Zhang Qisong Satellite Meteorological Center Beijing 100081, China ABSTRACT With GMS-5 images, cloud motion wind was calculated. For
CHAPTER 2 Energy and Earth
 CHAPTER 2 Energy and Earth This chapter is concerned with the nature of energy and how it interacts with Earth. At this stage we are looking at energy in an abstract form though relate it to how it affect
The Effect of Droplet Size Distribution on the Determination of Cloud Droplet Effective Radius
 Eleventh ARM Science Team Meeting Proceedings, Atlanta, Georgia, March 9-, The Effect of Droplet Size Distribution on the Determination of Cloud Droplet Effective Radius F.-L. Chang and Z. Li ESSIC/Department
JOURNAL OF GEOPHYSICAL RESEARCH, VOL. 115, XXXXXX, doi:10.1029/2008jd011189, 2010
 Click Here for Full Article JOURNAL OF GEOPHYSICAL RESEARCH, VOL. 115,, doi:10.1029/2008jd011189, 2010 2 Comment on Variations of tropical upper 3 tropospheric clouds with sea surface temperature and 4
REMOTE SENSING OF CLOUD-AEROSOL RADIATIVE EFFECTS FROM SATELLITE DATA: A CASE STUDY OVER THE SOUTH OF PORTUGAL
 REMOTE SENSING OF CLOUD-AEROSOL RADIATIVE EFFECTS FROM SATELLITE DATA: A CASE STUDY OVER THE SOUTH OF PORTUGAL D. Santos (1), M. J. Costa (1,2), D. Bortoli (1,3) and A. M. Silva (1,2) (1) Évora Geophysics
Application of global 1-degree data sets to simulate runoff from MOPEX experimental river basins
 18 Large Sample Basin Experiments for Hydrological Model Parameterization: Results of the Model Parameter Experiment. IAHS Publ. 37, 26. Application of global 1-degree data sets to simulate from experimental
The ARM-GCSS Intercomparison Study of Single-Column Models and Cloud System Models
 The ARM-GCSS Intercomparison Study of Single-Column Models and Cloud System Models R. T. Cederwall and D. J. Rodriguez Atmospheric Science Division Lawrence Livermore National Laboratory Livermore, California
163 ANALYSIS OF THE URBAN HEAT ISLAND EFFECT COMPARISON OF GROUND-BASED AND REMOTELY SENSED TEMPERATURE OBSERVATIONS
 ANALYSIS OF THE URBAN HEAT ISLAND EFFECT COMPARISON OF GROUND-BASED AND REMOTELY SENSED TEMPERATURE OBSERVATIONS Rita Pongrácz *, Judit Bartholy, Enikő Lelovics, Zsuzsanna Dezső Eötvös Loránd University,
Global LAnd Surface Satellite (GLASS) Products: Characteristics and Preliminary Applications. Shunlin Liang & GLASS data production team
 Products: Characteristics and Preliminary Applications. Shunlin Liang & GLASS data production team") Global LAnd Surface Satellite (GLASS) Products: Characteristics and Preliminary Applications Shunlin Liang & GLASS data production team University of Maryland and Beijing Normal University GV2M, Avignon,
Global LAnd Surface Satellite (GLASS) Products: Characteristics and Preliminary Applications Shunlin Liang & GLASS data production team University of Maryland and Beijing Normal University GV2M, Avignon,
Marko Markovic Department of Earth and Atmospheric Sciences. University of Quebec at Montreal
 An Evaluation of the Surface Radiation Budget Over North America for a Suite of Regional Climate Models and Reanalysis Data, Part 1: Comparison to Surface Stations Observations Marko Markovic Department
Monsoon Variability and Extreme Weather Events
 Monsoon Variability and Extreme Weather Events M Rajeevan National Climate Centre India Meteorological Department Pune 411 005 rajeevan@imdpune.gov.in Outline of the presentation Monsoon rainfall Variability
The APOLLO cloud product statistics Web service
 The APOLLO cloud product statistics Web service Introduction DLR and Transvalor are preparing a new Web service to disseminate the statistics of the APOLLO cloud physical parameters as a further help in
GCOS science conference, 2 Mar. 2016, Amsterdam. Japan Meteorological Agency (JMA)
") GCOS science conference, 2 Mar. 2016, Amsterdam Status of Surface Radiation Budget Observation for Climate Nozomu Ohkawara Japan Meteorological Agency (JMA) Contents 1. Background 2. Status t of surface
GCOS science conference, 2 Mar. 2016, Amsterdam Status of Surface Radiation Budget Observation for Climate Nozomu Ohkawara Japan Meteorological Agency (JMA) Contents 1. Background 2. Status t of surface
The APOLLO cloud product statistics Web service The APOLLO cloud product statistics Web service
 The APOLLO cloud product statistics Web service Introduction DLR and Transvalor are preparing a new Web service to disseminate the statistics of the APOLLO cloud physical parameters as a further help in
Denis Botambekov 1, Andrew Heidinger 2, Andi Walther 1, and Nick Bearson 1
 Denis Botambekov 1, Andrew Heidinger 2, Andi Walther 1, and Nick Bearson 1 1 - CIMSS / SSEC / University of Wisconsin Madison, WI, USA 2 NOAA / NESDIS / STAR @ University of Wisconsin Madison, WI, USA
SAFNWC/MSG Cloud type/height. Application for fog/low cloud situations
 SAFNWC/MSG Cloud type/height. Application for fog/low cloud situations 22 September 2011 Hervé LE GLEAU, Marcel DERRIEN Centre de météorologie Spatiale. Lannion Météo-France 1 Fog or low level clouds?
1. Theoretical background
 1. Theoretical background We consider the energy budget at the soil surface (equation 1). Energy flux components absorbed or emitted by the soil surface are: net radiation, latent heat flux, sensible heat
Synoptic assessment of AMV errors
 NWP SAF Satellite Application Facility for Numerical Weather Prediction Visiting Scientist mission report Document NWPSAF-MO-VS-038 Version 1.0 4 June 2009 Synoptic assessment of AMV errors Renato Galante