RENEWABLE ENERGY IN NORTH CAROLINA: THE POTENTIAL SUPPLY CHAIN
|
|
|
- Lambert Spencer
- 8 years ago
- Views:
Transcription
1 RENEWABLE ENERGY IN NORTH CAROLINA: THE POTENTIAL SUPPLY CHAIN PREPARED FOR THE INSTITUTE FOR EMERGING ISSUES, AUGUST 2008 BY DR. KEITH G. GLAXOSMITHKLINE FACULTY FELLOW, INSTITUTE FOR EMERGING ISSUES & PROFESSOR OF URBAN GEOGRAPHY UNIVERSITY OF NORTH CAROLINA AT GREENSBORO (WITH JACOB F. KIDD, RESEARCH ASSISTANT)

2 TABLE OF CONTENTS PAGE NO. EXECUTIVE SUMMARY 1 1. INTRODUCTION AND BACKGROUND 5 2. PURPOSE AND RATIONALE 6 3. PROJECT METHODOLOGY 7 A. IDENTIFYING THE POTENTIAL NORTH CAROLINA RENEWABLE ENERGY SUPPLY CHAIN: BY ECONOMIC ACTIVITY 7 B. IDENTIFYING THE POTENTIAL NORTH CAROLINA RENEWABLE ENERGY SUPPLY CHAIN: BY INDIVIDUAL FIRM 9 4. FINDINGS 11 A. WIND POWER 12 B. SOLAR POWER 12 C. BIOMASS 19 D. GEOTHERMAL ENERGY CONCLUSION AND IMPLICATIONS 27 APPENDIX A: INVENTORY OF POTENTIAL RENEWABLE ENERGY SUPPLY CHAIN FIRMS: BY NAICS CODE 28

3 ABOUT THE RESEARCHERS Dr. Keith G. Debbage is a professor of urban development in the Department of Geography at the University of North Carolina at Greensboro. He was appointed in 2007 to the UNC Tomorrow Scholars Council by UNC System President Erskine Bowles. In 2008, Dr. Debbage was selected as a GlaxoSmithKline Faculty Fellow with the Institute for Emerging Issues at North Carolina State University. He has conducted numerous, funded studies for Action Greensboro, the Alamance County Chamber of Commerce, the City of Greensboro Planning Department, the Greensboro Partnership, the North Carolina Biotechnology Center, and the Triad Chambers of Commerce. He was a sub-consultant to HDR Inc. on the Heart of the Triad Study jointly funded by the Piedmont Authority for Regional Transportation and the Triad Chambers of Commerce. Dr. Debbage is also the author of over 50 research publications in book chapters, contracted reports and various academic journals including the Annals of Tourism Research, the Journal of Air Transport Management, the Journal of Transport Geography, Policy Studies Review, Regional Studies, Tourism Management, Transportation Quarterly, and Urban Geography. He has been quoted in the New York Times and the Wall Street Journal, published a book with Routledge Press titled The Economic Geography of the Tourist Industry and published eight other book chapters. Dr. Debbage has also published over 60 op-ed columns with the Greensboro News and Record or the Triad Business Journal. Jacob F. Kidd is a M.A. candidate in the economic development and city planning program of the Geography Department at the University of North Carolina at Greensboro. He is currently working on his thesis focused on the spatial distribution of existing and potential renewable energy firms in North Carolina. Mr. Kidd is currently a GlaxoSmithKline Graduate Intern for the Institute for Emerging Issues at North Carolina State University. He is also currently working in the City of Greensboro Planning Department as a planning intern and was formerly a planning intern for the City of Archdale, NC.

4 INTRODUCTION AND BACKGROUND EXECUTIVE SUMMARY North Carolina could be a significant source of renewable energy although there have been few commercial-scale proposals so far. However, recent state legislation has the potential to act as a catalyst for renewable energy development in the state. In 2007, North Carolina leaders passed a law requiring utilities to meet 12.5% of energy demand by 2021 with cleaner energy sources such as wind and solar power. Although the North Carolina renewable energy industry is rapidly growing, it remains in an incipient stage of development that has yet to fully mature and diversify. As North Carolina begins to diversify and grow its alternative energy industries, it is important that our local communities benefit from the transition by growing new jobs and employment opportunities in this vital niche of the contemporary economy. A major portion of the potential benefits flowing from the development of renewable energy will go to the manufacturers who supply the component parts and equipment necessary to build the new energy economy. PURPOSE OF REPORT The purpose of this report is to: Better understand the spatial distribution and economic magnitude of North Carolina s renewable energy supply chain in wind, solar, biomass and geothermal. Identify those companies with the technical potential to enter the renewable energy market in North Carolina. Rigorously inventorying those firms that could supply the component parts of North Carolina s incipient renewable energy industry could help revitalize the state s manufacturing industries. Build general support and educate regional economic development stakeholders from across the state regarding the economic development opportunities in the new energy economy and raise awareness of the opportunities our state s existing manufacturers have to serve renewable energy markets. METHODS To assess the spatial distribution and economic magnitude of the new energy economy supply chain in North Carolina, this report utilized the methodology developed by the U.S. Department of Energy funded Renewable Energy Policy Project (REPP). The 2008 data source for the North Carolina inventory of the potential new energy supply chain firms was ReferenceUSA. 1

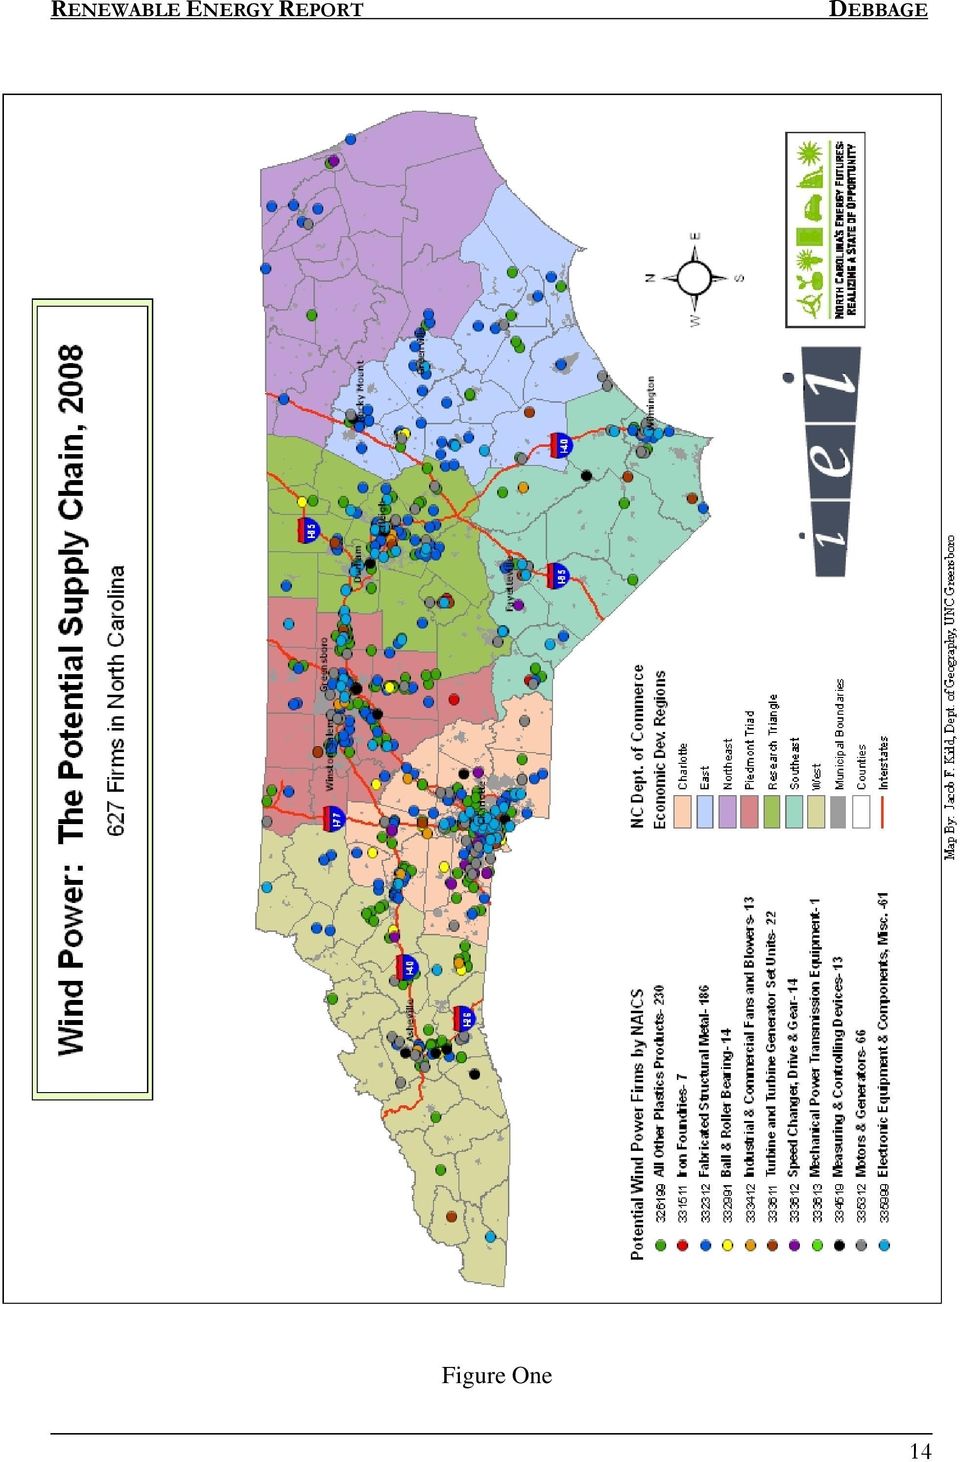
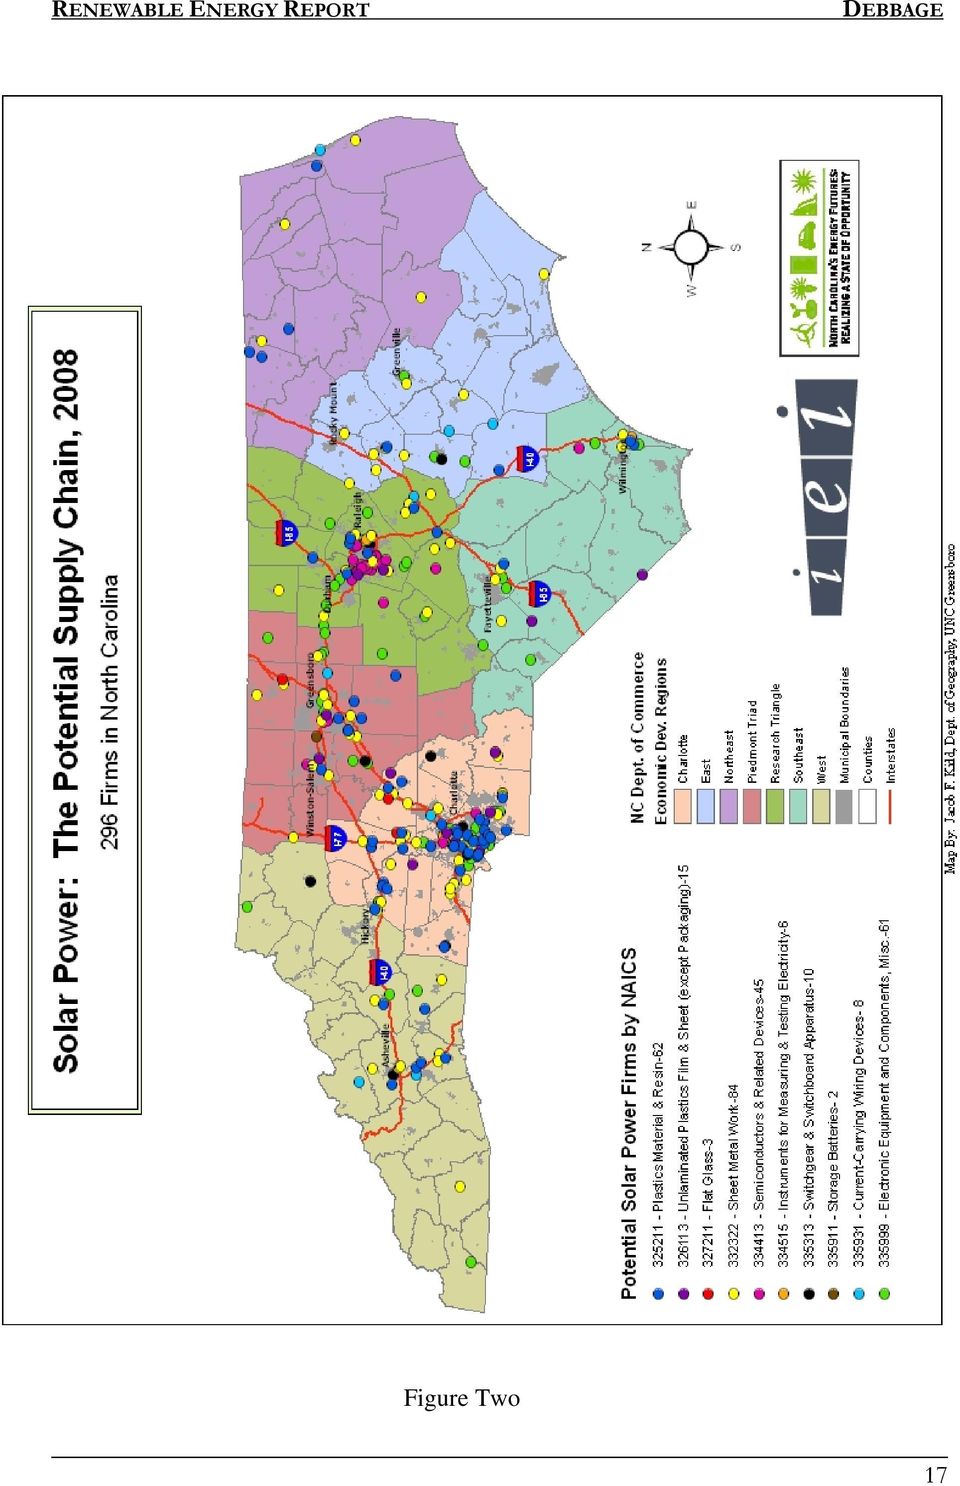
5 MAJOR FINDINGS North Carolina s potential new energy economy supply chain is a diverse and mature sector of the state economy comprising just over 1,300 firms and employing just over 61,000 workers A. WIND POWER The largest potential supply chain appeared to be wind power since it generated the largest number of firms (627) and jobs (32,534) (Table 1). In 2008, the Charlotte region Table 1. North Carolina s Potential Supply Chain, 2008 Renewable Number of Firms 1 Employment 1 Wind ,534 Solar ,122 Biomass ,925 Geothermal 98 4,287 1 It is inappropriate to aggregate this data since some firms are listed for more than one of the renewables. had 195 firms that could potentially play a role in the wind power supply chain and these firms generated 12,770 jobs in the region. Many of these jobs were concentrated in just a few specialties including various forms of plastic product manufacturing, fabricated structural metal manufacturing, electrical equipment manufacturing and ball and roller bearing manufacturing. Given the manufacturing orientation of the Piedmont Triad region, it is perhaps not surprising that the Triad region generated more jobs in wind power supply chain-related industries than the Research Triangle (6,520 and 4,099, respectively). The Piedmont Triad also generated more firms (133) than the Research Triangle (101). Another region that featured prominently was the West especially the Asheville market. B. SOLAR POWER The statewide geography of the solar power supply chain is noticeably different to that for wind power. Given the technological propensities of solar power suppliers (e.g., semiconductors and related devices manufacturing), this supply chain does not proliferate across North Carolina in the same way as the wind energy supply chain. That said, the potential solar power supply chain included 296 firms and 16,122 workers statewide (Table 1). A much more pronounced and tightly circumscribed cluster of industries exists in both Charlotte and the Research Triangle while the West region does not feature as prominently especially when compared to wind energy. The solar energy related 2

6 industries seem to prefer the more highly skilled labor pools in Charlotte and Raleigh Durham. In 2008, the Charlotte region included 109 solar energy-related firms which generated 5,011 jobs far more than any other region in North Carolina. Other important regions included the Research Triangle region (i..e., 83 firms and 3,538 jobs) and the Piedmont Triad (i.e., 38 firms and 3,876 jobs). These three regions generated 77% of all the jobs in North Carolina s potential solar energy supply chain. C. BIOMASS The geography of the potential biomass supply chain is tightly concentrated along the I- 85 corridor between Charlotte, the Triad and the Research Triangle region with significant outposts in Asheville, Hickory and Wilmington. Unlike the wind power supply chain, far fewer firms are located in eastern North Carolina. In aggregate, the biomass supply chain included 508 firms and 20,925 workers statewide (Table 1). Approximately 75% of the potential biomass supply chain in North Carolina in terms of firms are located in one of three regions Charlotte (181 firms), the Research Triangle (101) and the Piedmont Triad (97). Significant specializations include General Purpose Machinery manufacturing (148 firms), Electrical Equipment (61), Sawmill and Wood Working Machinery (49) and Construction Machinery manufacturing (41). These four specializations accounted for nearly 60% of the potential statewide supply chain in biomass. D. GEOTHERMAL POWER The geothermal supply chain in North Carolina is not nearly as pervasive as for wind, solar or biomass both in terms of number of firms or employment generation including just 98 firms and 4,287 workers statewide (Table 1). The geography of the state s potential geothermal suppliers reflects the scaled-down economic profile with a much more even and less prolific distribution across the state. Although Charlotte generated more potential geothermal suppliers (34 firms) than any other region, the outlying regions (East, Northeast, Southeast and West) together produced as many companies (34) in CONCLUSION Affordable, reliable and clean energy produced from diverse, domestic sources is critical to North Carolina s continued prosperity and security. North Carolina is a leader in enabling technologies, including biotechnology and advanced manufacturing processes that are capable of driving the next generation of energy technologies and products. The new energy economy has the potential to be a major part of North Carolina s competitive advantage. 3

7 Although North Carolina has yet to develop a mature and diversified new energy economy and has yet to birth many large commercial applications, the state is home to over 1,300 companies and 61,000 workers that operate within the supply chain of renewable energy equipment. Specific strengths include plastics product manufacturing, fabricated structural metal manufacturing, sheet metal work manufacturing, semiconductors and related devices, general purpose machinery manufacturing, pumps and pumping equipment and electrical equipment. The geography of the new energy supply chain is tightly concentrated along the I-85 corridor between Charlotte, the Triad and the Research Triangle region with significant outposts in Hickory, Wilmington and especially Asheville. Better understanding of where the potential manufacturers are that could supply the critical component parts should help economic development practitioners to craft appropriate policies and incentives that allow innovative renewable energy companies to move efficiently into the industry. One simple next step could be to develop a better understanding of the supply chain needs of the new energy economy firms already located in North Carolina. Cultivating inter-industry linkages between the fledgling new economy and the state s existing manufacturers could generate a bigger bang for the buck. It is important that North Carolina is nimble and quick in this policy arena since the recently passed Renewable Energy and Efficiency Standards Portfolio expects that 12.5% of utility energy demand by 2021 is met by renewables. 4

8 INTRODUCTION AND BACKGROUND North Carolina is a net energy importer like most U.S. states because of our heavy reliance on fossilized fuels as a major energy source for the state s contemporary economy. That said, renewable energy is now attracting a significant amount of attention as many communities attempt to reduce greenhouse gas emissions such as carbon dioxide. Many U.S. states are now actively engaged in developing renewable energy initiatives in wind, solar, biomass and geothermal-based programs. For example, billionaire Texas oilman T. Boone Pickens has already invested $2 billion in his company Mesa Power to build the world s largest wind farm in Pampa, a small town in the Texas panhandle. A recent report by the U.S. Department of Energy (2008) has indicated that America could build enough wind farms to provide 20% of the nation s electricity by According to Bob Leker, renewables program manager for the North Carolina Energy Office, the state of North Carolina could be a significant source of renewable energy although there have been few commercial-scale proposals so far. However, recent state legislation has the potential to act a catalyst for renewable energy development in the state. In 2007, North Carolina leaders passed a law requiring utilities to meet 12.5% of energy demand by 2021 with cleaner energy sources such as wind and solar power. Partly in response to the new state legislation, Sun Edison in partnership with Duke Power recently announced plans to build the nation s largest solar farm in Davidson County just south of Winston Salem, N.C (Greensboro News and Record 2008). Duke Power expects to generate 16 megawatts of power from the 100 to 200 acre solar farm by 2010 enough energy to power 2,647 homes for a year. Renewable energy manufacturing has the potential to become big business in North Carolina. For example, a 2005 study done by Appalachian State University and the N.C. Solar Center at North Carolina State University projected that a capacity of 1,430 megawatts of electricity could be generated by 500 to 700 new windmills on shore and in sounds in eastern North Carolina. Furthermore, the 2008 North Carolina Economic Developer s Guide to the Renewable Energy Industries published by the State Energy Office recently listed just over 100 new energy companies, up from only 28 in early

9 PURPOSE AND RATIONALE Although the North Carolina renewable energy industry is rapidly growing, it remains in an incipient stage of development that has yet to fully mature and diversify. As North Carolina begins to diversify and grow its alternative energy industries, it is important that our local communities benefit from the transition by growing new jobs and employment opportunities in this vital niche of the contemporary economy. A major portion of the potential benefits flowing from the development of renewable energy will go to the manufacturers who supply the component parts and equipment necessary to build the new energy economy. For example, wind turbines have emerged as one of the largest sources of demand for fiber-reinforced plastics as each turbine has several blades that can be as long as a football field. Precision Fabrics in Greensboro N.C. is the type of company that might benefit from the new energy economy since they manufacture textiles that are used in turbine blade manufacture such as advanced peelply fabrics which are used in building the composite parts found in aerospace, marine, and wind energy manufacturing. The purpose of this report is to: Better understand the spatial distribution and economic magnitude of North Carolina s renewable energy supply chain in wind, solar, biomass and geothermal. Identify those companies with the technical potential to enter the renewable energy market in North Carolina. Rigorously inventorying those firms that could supply the component parts of North Carolina s incipient renewable energy industry could help revitalize the state s manufacturing industries. Build general support and educate regional economic development stakeholders from across the state regarding the economic development opportunities in the new energy economy. Raise awareness of the opportunities our state s existing manufacturers have to serve renewable energy markets 6

10 PROJECT METHODOLOGY A. IDENTIFYING THE POTENTIAL NORTH CAROLINA RENEWABLE ENERGY SUPPLY CHAIN: BY ECONOMIC ACTIVITY To assess the spatial distribution and economic magnitude of the new energy economy supply chain in North Carolina, this report utilized the methodology developed by the U.S. Department of Energy funded Renewable Energy Policy Project (REPP). A major objective of REPP is to define growth strategies for renewables that simultaneously respond to both competitive energy markets and environmental needs. REPP has developed a methodology that disaggregates renewable generation technologies into their individual component parts and then catalogues where existing conventional industries are located that could become suppliers of the new energy economy. In order to examine the spatial distribution and magnitude of this potential market, REPP utilized an approach based on the North American Industrial Classification System (NAICS). In the Economic Census conducted by the U.S. Census Bureau, every firm operating in North America reports one or more NAICS codes, indicating what type of products or services they provide. The NAICS codes have several levels of detail. For example, a first digit of 3 indicates Manufacturing, 334 is Computer and Electronic Product Manufacturing, and is Semiconductor and Related Device Manufacturing. The 6-digit NAICS are the standard level reported by all companies in North America. Companies reporting the same NAICS code are involved in similar activities, for example, every company that reports manufactures some type of pump. REPP identified all the 6-digit NAICS codes that include firms involved in activities similar to the manufacturing of the individual renewable energy components found in wind, solar, biomass or geothermal production. For example, a company that makes glass plate (NAICS Flat Glass Manufacturing) could potentially transfer their capabilities to making the top surface glass for photovoltaic solar modules. The relevant NAICS codes identified by REPP included: NAICS Code NAICS Description A. Wind All Other Plastics Products Iron Foundries Fabricated Structural Metal Ball & Roller Bearing Industrial & Commercial Fans and Blowers Turbine and Turbine Generator Set Units Speed Changer, Drive & Gear Mechanical Power Transmission Equipment 7

11 Printed Circuits & Electronics Assemblies* Measuring & Controlling Devices Motors & Generators Electronic Equipment & Components, Misc. B. Solar Plastics Material & Resin Unlaminated Plastics Film & Sheet (except Packaging) Flat Glass Copper Wire (except Mechanical) Drawing* Sheet Metal Work Semiconductors & Related Devices Instruments for Measuring & Testing Electricity & Electrical Signals Switchgear & Switchboard Apparatus Storage Batteries Current-Carrying Wiring Devices Electronic Equipment and Components, Misc. C. Biomass Mineral Wool Iron, Steel Pipe & Tube from Purchased Steel Power Boiler & Heat Exchanger Metal Tank (Heavy Gauge) Industrial Valve Construction Machinery Sawmill & Woodworking Machinery Air Purification Equipment Heating Equipment (except Warm Air Furnaces) AC and Warm Air Heating Equipment and Commercial and Industrial Refrigeration Equipment Manufacturing Pump & Pumping Equipment Air & Gas Compressor Conveyor & Conveying Equipment Overhead Traveling Crane, Hoist & Monorail System General Purpose Machinery, Misc Instruments and Related Products for Measuring, Displaying, and Controlling Industrial Process Variables Power, Distribution, and Specialty Transformer Electronic Equipment & Components, Misc Railroad Rolling Stock 8

12 D. Geothermal Iron, Steel Pipe & Tube from Purchased Steel Power Boiler & Heat Exchanger Metal Tank (Heavy Gauge) AC and Warm Air Heating Equipment and Commercial and Industrial Refrigeration Equipment Manufacturing Pump & Pumping Equipment Air & Gas Compressor Overhead Traveling Crane, Hoist & Monorail System Caveats to Using the 6-digit Codes According to REPP, when interpreting the results of a 6-digit code search, it is important to be aware of the potential broadness of companies included. Some of the specific NAICS codes include a broad range of products some of which are not wholly related to renewable energy production. Additionally, it is important to recognize that some NAICS codes appear in more than one of the four renewable categories (i.e., wind, solar, biomass and geothermal). For example, all the NAICS codes listed for geothermal also are included in the list of NAICS codes for potential biomass suppliers. Therefore, it would not be appropriate to aggregate across the four major classes of renewables since the double-counting would inflate the economic data. B. INVENTORYING THE POTENTIAL NORTH CAROLINA RENEWABLE ENERGY SUPPLY CHAIN: BY INDIVIDUAL FIRM Identifying the various economic specializations necessary to sustain a thriving new energy economy supply chain is one matter. Cataloguing and mapping the specific firms that might be part of a successful supply chain is a completely different task. The 2008 data source for the North Carolina inventory of the potential new energy supply chain firms was ReferenceUSA. The ReferenceUSA database contains detailed information on more than 14 million U.S. businesses. Information is compiled from the following public sources: more than 5,600 Yellow Page and Business White Page telephone directories; annual reports; 10-Ks and other SEC information; federal, state, and municipal government data; Chamber of Commerce information; leading business magazines, trade publications, newsletters, major newspapers, industry and specialty directories; and postal service information. Businesses with 100 or more employees are phone-verified at least twice a year and the database is continually updated. ReferenceUSA is an excellent database for mapping specific firms since it provides a precise map coordinate location for all listed companies by NAICS code. The data utilized to build the North Carolina renewable energy supply chain inventory were accessed in summer Only those firms that listed under the NAICS codes identified by the REPP methodology were included in the inventory. 9

13 However, it should be noted that some company data are not fully reported in ReferenceUSA for reasons of confidentiality. For example, some companies report data ranges rather than precise figures for employment, sales volume, and floor space. Despite this caveat, the report captured well over 1,300 North Carolina firms that have the potential to act as suppliers to the state s fledgling new energy economy based on a fairly conservative and rigorously defined methodology. * Neither NAICS Printed Circuits and Electronic Assemblies nor NAICS Copper Wire (except Mechanical) Drawing were listed in the ReferenceUSA database for North Carolina. 10

14 FINDINGS: North Carolina s potential new energy economy supply chain is a diverse and mature sector of the state economy comprising just over 1,300 firms and employing just over 61,000 workers. The largest potential supply chain appears to be wind energy since it generated the largest number of firms (627) and jobs (32,534) relative to the other three forms of renewable energy (Table 1). Table 1. North Carolina s Potential Supply Chain, 2008 Renewable Number of Firms 1 Employment 1 Wind ,534 Solar ,122 Biomass ,925 Geothermal 98 4,287 1 It is inappropriate to aggregate this data since some firms are listed in more than one of the renewables. Given the long history of manufacturing in the North Carolina economy, it is not surprising that some of the leading sectors of the new energy supply chain economy are manufacturing intensive. The leading potential suppliers are listed in Table Two. Table 2. North Carolina s Leading Supply Chain Industries, 2008 Renewable # of Firms Employment WIND All Other Plastics Product Manufacturing ,710 Fabricated Structural Metal Manufacturing 186 4,611 Ball and Roller Bearing Manufacturing 14 2,019 SOLAR Sheet Metal Work Manufacturing 84 3,487 Plastic Material and Resin Manufacturing 62 2,876 Semiconductor and Related Devices 45 2,271 BIOMASS/GEOTHERMAL General Purpose Machinery, Misc ,935 Pumps and Pumping Equipment 24 2,032 ALL RENEWABLES Electrical Equipment, Misc. 61 4,254 We now turn to a more detailed examination of each renewable energy supply chain. 11

15 A. WIND POWER Although the statewide geography of the wind energy supply chain is more evenly distributed than for solar energy an important cluster of wind energy related suppliers exists in the highly diversified Charlotte region (Figure One). The regions used in this report are defined based on the North Carolina Department of Commerce Economic Development Regions. In 2008, the Charlotte region had 195 firms that could potentially play a role in the wind energy supply chain (Table 3) and these firms generated 12,770 jobs in the region (Table 4). Many of these jobs were concentrated in just a few specialties including various forms of plastic product manufacturing, fabricated structural metal manufacturing, electrical equipment manufacturing and ball and roller bearing manufacturing. Given the manufacturing orientation of the Piedmont Triad region, it is perhaps not surprising that the Triad region generated more jobs in wind energy supply chain-related industries than the Research Triangle (6,520 and 4,099, respectively) (Table 4). The Piedmont Triad also generated more firms (133) than the Research Triangle (101) (Table 3). Another region that featured prominently was the West region which included Asheville. It is perhaps expected that a substantive cluster of wind energy related industries might thrive in the Asheville area especially given the high winds associated with its mountainous topography. Asheville is already a region noted for its green collar economy and the area already appears blessed with a disproportionately large cluster of industries linked to potential wind energy applications. For example, the West region generated more jobs (4,770) than the Research Triangle region (4,099) in this niche. North Carolina s wind energy-related supply chain is characterized by a preponderance of firms with sales volume between $1-5 million (258 firms or 41.7% of total sales) (Table 5). Only one firm generated between $500 million to $1 billion in sales and that was Siemens Power Generation in Charlotte with 799 workers (Appendix A NAICS Turbine Manufacturing). Most of the potential wind energy suppliers are also fairly small in terms of floorspace with 440 firms (70.2%) below 40,000 square feet (Table 6). B. SOLAR POWER The statewide geography of the solar power supply chain is noticeably different to that for wind energy. Given the technological propensities of solar energy suppliers (e.g., semiconductors and related devices manufacturing), this supply chain does not proliferate across North Carolina in the same way as the wind energy supply chain. A much more pronounced and tightly circumscribed cluster of industries exists in both Charlotte and the Research Triangle (Figure 2) while the West region does not feature as prominently 12

16 Table 3. Potential Wind Power Supply Chain Firms by Region, 2008 NAICS NAICS Description NC Department of Commerce Economic Development Regions Total Percent Piedmont Research Firms Firms West Charlotte Triad Triangle Southeast East Northeast All Other Plastics Products Iron Foundries Fabricated Structural Metal Ball & Roller Bearing Industrial and Commercial Fans and Blowers Turbine & Turbine Generators Speed Changer, Drive, & Gear Mechanical Power Transmission Equipment Measuring & Controlling Devices Motors & Generators Electrical Equipment, Misc Total especially when compared to wind energy (Figure 1). The solar energy related industries seem to prefer the more highly skilled labor pools in Charlotte and Raleigh-Durham. In 2008, the Charlotte region included 109 solar energy-related firms (Table 7) which generated 5,011 jobs (Table 8) far more than any other region in North Carolina. Other important regions included the Research Triangle (i..e, 83 firms and 3,538 jobs) and the Piedmont Triad (i.e., 38 firms and 3,876 jobs). These three regions generated 77% of all the jobs in North Carolina s potential solar energy supply chain compared to just 72% for wind energy. It should also be noted that the Piedmont Triad may have generated fewer firms than the Research Triangle region but it did produce more jobs suggesting that average firm size is larger in the Triad. North Carolina s solar power-related supply chain features a disproportionate number of firms with sales volume between $1 10 million (172 firms or 61.3% of total sales) (Table 9). Unlike the wind-related firms, a larger proportion of solar-related firms generated between $5 10 million in sales (24.8% versus 14.1%) and one firm generated over $1 billion in sales (i.e., Goodrich Corporation in Charlotte) (Appendix A NAICS Plastics Material and Resin Manufacturing) 13

17 Figure One 14
18 NAICS Table 4. Potential Wind Power Supply Chain Employment by Region, 2008 NC Department of Commerce Economic Development Regions NAICS Description Piedmont Research West Charlotte Triad Triangle Southeast East Northeast Total Empl. All Other Plastics Product Manufacturing Percent Empl Iron Foundries Fabricated Structural Metal Manufacturing Ball & Roller Bearing Manufacturing Industrial and Commercial Fan and Blower Manufacturing Turbine & Turbine Generator Set Units Manufacturing Speed Changer, Drive, & Gear Manufacturing Mechanical Power Transmission Equipment Manufacturing Other Measuring & Controlling Device Manufacturing Motor & Generator Manufacturing Misc Electrical Equipment Manufacturing Total Table 5. Wind Power-Related Sales, 2008 Sales Range Firms Percentage Less Than $500, $500,000 to $1 Million $1 to $2.5 Million $2.5 to $5 Million $5 to $10 Million $10 to $20 Million $20 to $50 Million $50 to $100 Million $100 to $500 Million $500 Million to $1 Billion *9 firms did not disclose

19 Table 6. Wind Power-Related Floor Space, 2008 Sq. Ft. Firms Percentage 2,500-9, ,000-39, , Table 7. Potential Solar Power Supply Chain Firms by Region, 2008 NAICS NAICS Description NC Department of Commerce Economic Development Regions Total Percent Piedmont Research Firms Firms West Charlotte Triad Triangle Southeast East Northeast Plastics Material & Resin Nonpackaging Plastics Film & Sheet Flat Glass Sheet Metal Work Semiconductors & Related Devices Electricity & Signal Testing Instruments Switchgear & Switchboard Apparatus Storage Battery Current-Carrying Wiring Device Misc Electrical Equipment Total Most of the solar energy-related suppliers are fairly small in terms of floorspace with 53.7% of all firms between 10,000 and 39,999 square feet in size (Table 10). That said, a significant proportion of firms were larger than 40,000 square feet (111 firms or 37.5% of the total) especially when compared to the equivalent proportion of wind energy-related firms (29.8%). 16

20 Figure Two 17
21 Table 8. Potential Solar Power Supply Chain Employment by Region, 2008 NAICS NAICS Description West NC Dept. of Commerce Economic Development Regions Piedmont Research Charlotte Triad Triangle Southeast East Northeast Total Empl. Percent Empl Plastics Material & Resin Unlaminated Plastics Film & Sheet (except Packaging) Flat Glass Sheet Metal Work Semiconductors & Related Devices Instruments for Measuring & Testing Electricity & Electrical Signals Switchgear & Switchboard Apparatus Storage Batteries Current-Carrying Wiring Devices Electronic Equipment and Components, Misc Total Table 9. Solar Power-Related Sales, 2008 Sales Range Firms Percentage Less Than $500, $500,000 to $1 Million $1 to $2.5 Million $2.5 to $5 Million $5 to $10 Million $10 to $20 Million $20 to $50 Million $50 to $100 Million $100 to $500 Million $500 Million to $1 Billion $1 Billion or more *7 firms did not disclose 296 Total Firms 18
22 Table 10. Solar Power-Related Floor Space, 2008 Sq. Ft. Firms Percentage 2,500-9, ,000-39, , C. BIOMASS For biomass power generation, this report analyzed the potential supply chain that could provide the component parts needed to construct a dedicated biomass plant. The biomass is burned in a boiler to generate steam that is then passed through a steam turbine-generator. (Note: the biomass data are only for direct combustion equipment since they are the only technology widely ready for commercialization. It does not include biotech-oriented technology such as gasification or bio-fuels). The geography of the potential biomass supply chain is tightly concentrated along the I-85 corridor between Charlotte, the Triad and the Research Triangle region with significant outposts in Asheville, Hickory and Wilmington (Figure Three). Unlike the wind power supply chain, far fewer firms are located in eastern North Carolina. Approximately 75% of the potential biomass supply chain in North Carolina are located in one of three regions Charlotte (181 firms), the Research Triangle (101) and the Piedmont Triad (97) (Table 11). Significant specializations include General Purpose Machinery manufacturing (148 firms), Electrical Equipment (61), Sawmill and Wood Working Machinery (49) and Construction Machinery manufacturing (41). These four specializations account for nearly 60% of the statewide supply chain in biomass. In employment terms, the geography is comparable to that for biomass firms with two exceptions to the rule. First, the largest biomass supply chain labor market is in the Research Triangle region (5,334 workers) and not Charlotte (4,857) (Table 12) even though Charlotte generated more firms. Second, both the West (2,748) and the Southeast (1,773) are well represented in employment terms even though both regions have only a modest number of total firms (42 and 32, respectively). Over one-quarter (130 firms) of all those firms in North Carolina capable of being potential biomass suppliers generated between $1million and $2.5 million in sales in 2008 (Table 13). Overall sales figures lagged behind those for the wind and solar power supply chain firms. Nearly half of the biomass suppliers generated less than $2.5 million in sales compared to 41.7% for wind power companies and 30.4% for solar power. Furthermore, no biomass supplier generated more than $500 million in sales. 19
23 Figure Three 20
24 Table 11. Potential Biomass Power Supply Chain Firms by Region, 2008 NC Department of Commerce Economic Development Regions Total Percent NAICS NAICS Description Piedmont Research Firms Firms West Charlotte Triad Triangle Southeast East Northeast Mineral Wool % Iron, Steel Pipe & Tube From Purchased Steel % Power Boiler & Heat Exchanger % Metal Tank (Heavy Gauge) % Industrial Valve % Construction Machinery % Sawmill & Wood Working Machinery % Air Purification Equipment % Heating Equipment (Except Warm Air Furnaces) % AC, Warm Air Heating and Refrigeration Equipment % Pump & Pumping Equipment % Air & Gas Compressor % Conveyor & Conveying Equipment % Overhead Traveling Crane, Hoist & Monorail System % General Purpose Machinery, Misc % Inst. for Measuring, Displaying, and Controlling Process Variables % Electric Power & Specialty Transformer % Electronic Equipment & Components, Misc % Railroad Rolling Stock % Total In terms of floorspace, most of the biomass supply chain firms were between 10,000 39,999 square feet in size (297 companies or 58.5% of the total) (Table 14). The biomass firms had a larger share of smaller firms (20.9%) and fewer large firms (20.7%) than their wind or solar energy counterparts. 21
25 NAICS NAICS Description Table 12. Potential Biomass Power Supply Chain Employment by Region, 2008 West NC Department. of Commerce Economic Development Regions Piedmont Research Charlotte Triad Triangle Southeast East Northeast Total Empl. Percent Empl. Mineral Wool Manufacturing % Iron, Steel Pipe & Tube From Purchased Steel % Power Boiler & Heat Exchanger % Metal Tank, Heavy Gauge % Industrial Valve Manufacturing % Construction Machinery % Sawmill & Wood Working Machinery % Air Purification Equipment % Heating Equip., Except Warm Air Furnaces % Ac, Refrigeration, & Forced Air Heating % Pump & Pumping Equipment % Air & Gas Compressor Manufacturing % Conveyor & Conveying Equipment % Overhead Cranes, Hoists, & Monorail Systems % Misc. General Purpose Machinery % Industrial Process Variable Instruments % Electric Power & Specialty Transformer % Misc. Electrical Equipment Manufacturing % Railroad Rolling Stock Manufacturing % Total
26 Table 13. Potential Biomass Power Manufacturing Sales, 2008 Sales Range Firms Percentage Less Than $500, $500,000 to $1 Million $1 to $2.5 Million $2.5 to $5 Million $5 to $10 Million $10 to $20 Million $20 to $50 Million $50 to $100 Million $100 to $500 Million *15 firms did not disclose 509 Total Firms Table 14. Potential Biomass Power Manufacturing Floor Space, 2008 Sq. Ft. Firms Percentage 2,500-9, ,000-39, , D. GEOTHERMAL ENERGY The geothermal energy supply chain includes firms with the potential to act as suppliers to geothermal power generation through both flash steam plants and binary cycle plants. Most of the components that make up these plants are similar, such as various pumps, heat exchangers and piping and all of the components are directly applicable to biomass power generation. The geothermal supply chain in North Carolina is not nearly as pervasive as for wind, solar or biomass both in terms of number of firms or employment generation. The geography of the state s potential geothermal suppliers reflects the scaled-down economic profile with a much more even and less prolific distribution across the state (Figure Four). Although Charlotte generated more potential geothermal suppliers (34 firms) than any other region, the outlying regions (East, Northeast, Southeast and West) together produced as many companies (34) in 2008 (Table 15). Most of these companies statewide specialized in Air Conditioning, Refrigeration and Forced Air Heating (29.6% of the state total), Pumps and Pumping Equipment (24.5%) or Overhead Cranes, Hoists and Monorail Systems (21.4%). 23
27 NAICS Table 15. Potential Geothermal Power Supply Chain Firms by Region, 2008 NC Department of Commerce Economic Development Regions NAICS Description Piedmont Research West Charlotte Triad Triangle Southeast East Northeast Total Firms Percent Firms Iron, Steel Pipe & Tube From Purchased Steel Power Boiler & Heat Exchanger Metal Tank (Heavy Gauge) AC, Warm Air Heating and Refrigeration Equipment Pump & Pumping Equipment Air & Gas Compressor Overhead Traveling Crane, Hoist & Monorail System Total Although Charlotte produced more geothermal supply chain firms, it is the Piedmont Triad that is the largest market in terms of employment generation (1,765 workers) compared to just 1,188 jobs in the Charlotte region (Table 16). Ironically, while the spatial distribution of the geothermal supply chain (Figure Four) implies a relatively even playing field, it is the most clustered of the four renewable energies in terms of employment generation. Nearly 88% (3,770 workers) of the geothermal supply chain jobs are located in either the Piedmont Triad, Charlotte or the Research Triangle. For North Carolina as a whole, nearly 50% of these jobs are concentrated in Pumps and Pumping Equipment manufacturing. Much like the biomass supply chain, no geothermal-related company generated more than $500 million in sales in 2008 (Table 17). However, the potential geothermal supply chain generated a smaller share of firms generating less than $500,000 (7.3% compared to 11.4% for biomass). In addition, a greater proportion of geothermalrelated firms generated sales between $1 - $2.5 million when compared to biomass (32.3% compared to 26.1%). Neither the biomass nor geothermal suppliers appeared to have the sales clout of the potential wind or solar supply chain providers. Most of the geothermal-related companies generated between 10,000 to 39,999 square feet in floor-space needs (57 firms or 58.2% of the total) (Table 18). However, only 13.3% of all geothermal firms were less than 10,000 square feet in size (compared to 20.9% for biomass). Geothermal also generated a greater proportion of large firms needing more than 40,000 square feet (28.6% compared to 20.7% for biomass). 24
28 Figure Four. 25
29 Table 16. Potential Geothermal Power Supply Chain Employment by Region, 2008 NAICS NAICS Description West NC Dept. of Commerce Economic Development Regions Piedmont Research Charlotte Triad Triangle Southeast East Northeast Total Empl. Percent Empl Iron, Steel Pipe & Tube From Purchased Steel Power Boiler & Heat Exchanger Metal Tank (Heavy Gauge) AC, Warm Air Heating and Refrigeration Equipment Pump & Pumping Equipment Air & Gas Compressor Overhead Traveling Crane, Hoist & Monorail System Total Table 17. Potential Geothermal Power Manufacturing Sales, 2008 Sales Range Firms Percentage Less Than $500, $500,000 to $1 Million $1 to $2.5 Million $2.5 to $5 Million $5 to $10 Million $10 to $20 Million $20 to $50 Million $50 to $100 Million $100 to $500 Million *2 firms did not disclose 98 Total Firms Table 18. Potential Geothermal Power Manufacturing Floor Space, 2008 Sq. Ft. Firms Percentage 2,500-9, ,000-39, ,
30 CONCLUSION AND IMPLICATIONS Affordable, reliable and clean energy produced from diverse, domestic sources is critical to North Carolina s continued prosperity and security. The integration of new energy technology development and North Carolina s existing strengths in manufacturing production has the potential to place the state at the forefront of energy development. North Carolina is a leader in enabling technologies, including biotechnology and advanced manufacturing processes that are capable of driving the next generation of energy technologies and products. The new energy economy has the potential to be a major part of North Carolina s competitive advantage. Although North Carolina has yet to develop a mature and diversified new energy economy and has yet to birth many large commercial applications, the state is home to over 1,300 companies and 61,000 workers that operate within the potential supply chain of renewable energy equipment. The state s supply chain includes companies that have potential applications to wind, solar, biomass and geothermal power generation. Specific strengths include plastics product manufacturing, fabricated structural metal manufacturing, sheet metal work manufacturing, semiconductors and related devices, general purpose machinery manufacturing, pumps and pumping equipment and electrical equipment. The geography of the new energy supply chain is tightly concentrated along the I-85 corridor between Charlotte, the Triad and the Research Triangle region with significant outposts in Hickory, Wilmington and especially Asheville. Inventorying North Carolina s new energy supply chain can be useful in the development of strategic economic development initiatives that identifies renewable energy-related industry cluster opportunities. Better understanding of where the potential manufacturers are that could supply the critical component parts should help economic development practitioners to craft appropriate policies and incentives that allow innovative renewable energy companies to move efficiently into the industry. It is important that North Carolina is nimble and quick in this policy arena. Ten years ago wind turbines were marginal. Now they are taken seriously, and in another decade they may contribute as much as a fifth of the world s electricity. Furthermore, manufacturing wind turbines could be a major component of North Carolina s industrial economy given our pre-existing strengths in manufacturing. One simple next step could be to develop a better understanding of the supply chain needs of the new energy economy firms already located in North Carolina. Cultivating inter-industry linkages between the fledgling new economy and the state s existing manufacturers could generate a bigger bang for the buck. One thing is for sure the state will have to move quickly if it is to match the expectations of the Renewable Energy and Efficiency Standards Portfolio where 12.5% of energy utility demand by 2021 is met by renewables. 27
31 APPENDIX A INVENTORY OF POTENTIAL RENEWABLE ENERGY SUPPLY CHAIN FIRMS: BY NAICS CODE 28
32 POTENTIAL RENEWABLE ENERGY SUPPLY CHAIN: WIND All Other Plastics Products (326199) Employment Size Sales Square Footage City Region Accuma Corp 150 $5 to $10 Million 40,000+ Statesville Charlotte Americhem Inc 120 $20 to $50 Million 40,000+ Concord Charlotte Ameritech Die & Mold 24 $5 to $10 Million 40,000+ Mooresville Charlotte Assembly Innovations 10 $1 to $2.5 Million 10,000-39,999 Statesville Charlotte Assembly Innovations 0 $1 to $2.5 Million 10,000-39,999 Statesville Charlotte Bull Engineered Products Inc 9 $1 to $2.5 Million 10,000-39,999 Charlotte Charlotte Cabarrus Plastics Inc 80 $10 to $20 Million 40,000+ Concord Charlotte Carlisle Food Svc Products 40 $5 to $10 Million 40,000+ Charlotte Charlotte Carolina Materials LLC 30 $5 to $10 Million 40,000+ Belmont Charlotte Carolina Plastic Co 2 Less Than $500,000 2,500-9,999 Charlotte Charlotte Caro-Polymers Inc 50 $10 to $20 Million 40,000+ Bessemer City Charlotte Conover Plastics Inc 12 $2.5 to $5 Million 10,000-39,999 Conover Charlotte Conquest Plastics 3 $500,000 to $1 Million 10,000-39,999 Charlotte Charlotte Consolidated Container Co 11 $1 to $2.5 Million 10,000-39,999 Statesville Charlotte Constar International Inc 60 $10 to $20 Million 40,000+ Charlotte Charlotte Covalence Plastics 120 $20 to $50 Million 40,000+ Charlotte Charlotte Custom Golf Car Supply 55 $10 to $20 Million 40,000+ Salisbury Charlotte Custom Plastic Forming 70 $10 to $20 Million 40,000+ Salisbury Charlotte Decor Originals Inc 80 $10 to $20 Million 40,000+ Conover Charlotte Diversified Fiberglass Inc 9 $1 to $2.5 Million 10,000-39,999 Cherryville Charlotte Diversified Plastic Svc 0 $2.5 to $5 Million 10,000-39,999 Charlotte Charlotte D-M-E Co 35 $5 to $10 Million 40,000+ Shelby Charlotte Double O Plastics 30 $5 to $10 Million 40,000+ Concord Charlotte Ehren-Haus Industries Inc 12 $2.5 to $5 Million 10,000-39,999 Charlotte Charlotte Etimex USA Inc 50 $10 to $20 Million 40,000+ Charlotte Charlotte Evergreen Manufacturing Co 1 Less Than $500,000 2,500-9,999 Dallas Charlotte Excellence In Design Inc 1 Less Than $500,000 2,500-9,999 Weddington Charlotte Fabri-Form Co 1 Less Than $500,000 2,500-9,999 Harrisburg Charlotte Glen Mauser Co 3 $500,000 to $1 Million 10,000-39,999 Newton Charlotte Granger Plastics Molding 15 $2.5 to $5 Million 10,000-39,999 Monroe Charlotte H & R Custom Injection Molding 20 $2.5 to $5 Million 40,000+ Monroe Charlotte Hope Plastics Corp 6 $1 to $2.5 Million 10,000-39,999 Bessemer City Charlotte International Display Systems 20 $2.5 to $5 Million 40,000+ Charlotte Charlotte Krauss-Maffei Corp 0 $2.5 to $5 Million 10,000-39,999 Concord Charlotte L B Plastics Inc 120 $10 to $20 Million 40,000+ Mooresville Charlotte 29
Renewable Energy in North Carolina
 Renewable Energy in North Carolina The Potential Supply Chain and Connections to Existing Renewable and Energy Efficiency Firms KEITH G. DEBBAGE University of North Carolina at Greensboro JACOB F. KIDD
Clean Energy Trends in North Carolina. www.energync.org
 Clean Energy Trends in North Carolina www.energync.org Agenda Background North Carolina Clean Energy Resources & Technologies North Carolina Clean Energy Policies North Carolina Clean Energy Trends Generation
Assessment of the Economic Benefits of Offshore Wind in the Mid-Atlantic
 Assessment of the Economic Benefits of Offshore Wind in the Mid-Atlantic February 2012 Delivered to: Overview Impact Results New Jersey Tipping Point Discussion Economic Impact Results Review Summary results
Module 7 Forms of energy generation
 INTRODUCTION In rich countries like Australia, our standard of living is dependent on easily available energy. Every time you catch a bus, turn on a light or watch television energy is being used up. Over
Renewable Energy Research
 Renewable Energy Research Georgia Power and Southern Company have been active in renewable energy research for many years. Over the last five years we have invested six million dollars in renewable energy
Activity Center Stratification North Carolina Strategic Transportation Corridors
 (1) Primary Employment Centers (2) High Priority Economic Development Sites Major Military Bases High-density employment centers Census tract groupings of more than 3,000 employees/sq. mile Logistics Villages
Massachusetts Clean Energy and Climate Plan for 2020. Executive Office of Energy and Environmental Affairs
 Massachusetts Clean Energy and Climate Plan for 2020 Massachusetts Clean Energy and Climate Plan for 2020 I. The Rationale: Launching the Clean Energy Revolution Energy Costs & Volatility; Energy Independence
APPENDIX 1: 8-DIGIT SIC CODES COMPRISING THE GREEN ECONOMY
 APPENDIX 1: 8-DIGIT SIC CODES COMPRISING THE GREEN ECONOMY SIC8 SIC8DESC GRSECTOR 1810103 Mats, preseeded: soil erosion, growing of Green building 8510102 Reforestation services Environmental services
A CITIZEN S GUIDE. North Carolina Renewable Energy & Energy Efficiency Portfolio Standard EFFICIENCY BIOMASS GEOTHERMAL
 SOLAR HYDROELECTRIC WIND ENERGY EFFICIENCY A CITIZEN S GUIDE North Carolina Renewable Energy & Energy Efficiency Portfolio Standard Produced by the North Carolina Sustainable Energy Association BIOMASS
Jen Banks Wind Energy Project Coordinator North Carolina Solar Center
 Jen Banks Wind Energy Project Coordinator North Carolina Solar Center North Carolina Solar Center Mission Statement to advance the use of renewable energy resources to ensure a sustainable economy that
North Carolina Department of Commerce Commerce Finance Center
 North Carolina Department of Commerce Commerce Finance Center Beverly Eaves Perdue, Governor J. Keith Crisco, Secretary Stewart J. Dickinson, Director July 8, 2011 In 2008, the United States Congress authorized
CHAPTER 4 SIMULATED IMPACT OF THE SAFEGUARD MEASURES
 CHAPTER 4 SIMULATED IMPACT OF THE SAFEGUARD MEASURES Introduction The request letter asked the Commission to provide an analysis of the economy-wide effects of the safeguard remedies using appropriate
NAD SB NAICS with $$
 113310 Logging 22 $ 3,090,552 115112 Soil Preparation, Planting, and Cultivating 94 $ 84,311 115310 Support Activities for Forestry 98 $ 69,242 211111 Crude Petroleum and Natural Gas Extraction 177 $ 7,398
SOUTH CAROLINA DEPARTMENT OF COMMERCE. Renewable Energy in South Carolina
 SOUTH CAROLINA DEPARTMENT OF COMMERCE Renewable Energy in South Carolina Renewable Energy in South Carolina The next time you are working on a Renewable Energy project, think of South Carolina. By the
Environmental Science 101 Energy. Web-Based Course. Lecture Outline: Terms You Should Know: Learning Objectives: Reading Assignment:
 Environmental Science 101 Energy 1 Web-Based Course Lecture Outline: 5. RENEWABLE ENERGY RESOURCES MODULE 5.1 Improving Energy Efficiency A. Improving Energy Efficiency MODULE 5.2 Geothermal, Hydro and
EXECUTIVE SUMMARY WASHINGTON & AROOSTOOK COUNTIES
 Introduction Renewable Energy has been an area of focus for the Mobilize Maine asset-based planning process in northern Maine since 2010 (http://www.gro-wa.org/aroostookrenewable-energy-analysis) and recent
Renewable Energy. SESE Curriculum Link: Content Strand Environmental Awareness and Care Strand Unit Environmental Awareness
 key message: Fossil fuels are becoming scarce and are non-renewable. We need to use renewable sources of energy which are less damaging to the environment. SESE Curriculum Link: Content Strand Environmental
Testimony of Barbara D. Lockwood, P.E. Manager, Renewable Energy Arizona Public Service Company
 Testimony of Barbara D. Lockwood, P.E. Manager, Renewable Energy Arizona Public Service Company Before the U.S. House of Representatives Select Committee on Energy Independence and Global Warming Blowing
Geothermal: The Clean Energy Secret May 7, 2008
 Geothermal: The Clean Energy Secret May 7, 2008 Published by Dr. Patrick Moore in conjunction with the New York Affordable Reliable Electricity Alliance (New York AREA) Geothermal: The Clean Energy Secret
Solar and Wind Energy for Greenhouses. A.J. Both 1 and Tom Manning 2
 Solar and Wind Energy for Greenhouses A.J. Both 1 and Tom Manning 2 1 Associate Extension Specialist 2 Project Engineer NJ Agricultural Experiment Station Rutgers University 20 Ag Extension Way New Brunswick,
Study Plan. MASTER IN (Energy Management) (Thesis Track)
 (Thesis Track)") Plan 2005 T Study Plan MASTER IN (Energy Management) (Thesis Track) A. General Rules and Conditions: 1. This plan conforms to the regulations of the general frame of the programs of graduate studies. 2.
Plan 2005 T Study Plan MASTER IN (Energy Management) (Thesis Track) A. General Rules and Conditions: 1. This plan conforms to the regulations of the general frame of the programs of graduate studies. 2.
Sustainable Energy Sources By: Sue Peterson
 www.k5learning.com Objective sight words (consumption, terrain, integral, orbit, originated, contemporary, remote); concepts (sustainable, renewable, photovoltaics, gasification) Vocabulary consumption
Utilities. Our environment helps companies to flourish. It does the same thing for our people.
 Utilities Our environment helps companies to flourish. It does the same thing for our people. Utilities North Carolina offers competitively priced utilities that enable businesses to thrive in today s
SAINSBURY S GREEN LOAN FRAMEWORK
 Under embargo until 00.01 BST on Sunday 20 July 2014 SAINSBURY S GREEN LOAN FRAMEWORK July 2014 Highlights: Innovative Green Loan aligned with the Green Bond Principles Strong alignment of Sainsbury s
Comparison of Recent Trends in Sustainable Energy Development in Japan, U.K., Germany and France
 Comparison of Recent Trends in Sustainable Energy Development in Japan, U.K., Germany and France Japan - U.S. Workshop on Sustainable Energy Future June 26, 2012 Naoya Kaneko, Fellow Center for Research
GroWNC Energy WG 1. www.gro wnc.org
 GroWNC Energy WG 1 www.gro wnc.org Existing Conditions Outline Energy Plan and Report Evaluation Local (GroWNC): County Plans, Comprehensive Economic Development Strategy (CEDS) Regional: Western North
AN OVERVIEW OF KENTUCKY S ENERGY CONSUMPTION AND ENERGY EFFICIENCY POTENTIAL
 AN OVERVIEW OF KENTUCKY S ENERGY CONSUMPTION AND ENERGY EFFICIENCY POTENTIAL KENTUCKY POLLUTION PREVENTION CENTER UNIVERSITY OF LOUISVILLE AMERICAN COUNCIL FOR AN ENERGY-EFFICIENT ECONOMY Prepared for:
Design Exercises and Projects in Energy Engineering Course
 Session XXXX Design Exercises and Projects in Energy Engineering Course Kendrick Aung Department of Mechanical Engineering Lamar University, Beaumont, Texas 77710 Abstract Energy Engineering is a senior
Introduction. So, What Is a Btu?
 Introduction The way of life that we Americans take for granted every day depends upon a stable and abundant supply of affordable energy. Energy shortages can quickly affect our everyday lives and harm
Mount Wachusett Community College. Energy Conservation & Conversion : A Cost Sharing Approach
 Mount Wachusett Community College Energy Conservation & Conversion : A Cost Sharing Approach Critical Issues The rising and disproportionate costs of energy in the Northeast The Nation s continued dependence
Genesee/Shiawassee Michigan Works!
 Genesee/Shiawassee Michigan Works! 711 N. Saginaw St Flint, Michigan 48503 810.233.5974 March 13, Highest Ranked Industries Report Shiawassee Country Economic Modeling Specialists, Int. www.economicmodeling.com
Station #1 Interpreting Infographs
 Energy Resources Stations Activity Page # 1 Station #1 Interpreting Infographs 1. Identify and explain each of the energy sources (5) illustrated in the infograph. 2. What do the white and black circles
Employment Change Due to Carbon Pricing, 2035 Policy Scenario Vs Baseline Industry Name North American Industrial Classification System # (NAICS)
") Employment Change Due to Carbon Pricing, 2035 Policy Scenario Vs Baseline Industry Name North American Industrial Classification System # (NAICS) 2035 (Net Jobs) Construction - 23 4774 1.21% Scientific
Employment Change Due to Carbon Pricing, 2035 Policy Scenario Vs Baseline Industry Name North American Industrial Classification System # (NAICS) 2035 (Net Jobs) Construction - 23 4774 1.21% Scientific
GOOGLE, ITOCHU AND SUMITOMO JOIN GE AND DEVELOPER CAITHNESS ENERGY AS OWNERS OF WORLD S LARGEST WIND FARM, IN OREGON
 GOOGLE, ITOCHU AND SUMITOMO JOIN GE AND DEVELOPER CAITHNESS ENERGY AS OWNERS OF WORLD S LARGEST WIND FARM, IN OREGON ARLINGTON, Ore., April 18, 2011 Expanding their renewable energy portfolios, three global
Creating and Retaining Sustainable Good Green Jobs
 RESOLUTION 10 Creating and Retaining Sustainable Good Green Jobs Submitted by the Executive Council Referred to the Legislation and Policy Committee ADDRESSING GLOBAL CLIMATE CHANGE, protecting our environment
Chicago Regional Energy Snapshot Profile and Strategy Analysis. Prepared for the Chicago Metropolitan Agency for Planning
 Chicago Regional Energy Snapshot Profile and Strategy Analysis Prepared for the Chicago Metropolitan Agency for Planning Table of Contents Executive Summary...1 Regional Energy Profile...3 Introduction...3
MACHINERY MANUFACTURING
 INDUSTRY AT A GLANCE: MACHINERY MANUFACTURING Nature of the Industry Goods and services. The development and deployment of Quick Reference machinery was responsible for one of the great advances in human
Chapter 5 Renewable Energy
 Chapter 5 Renewable Energy Introduction In FY 2012, 12.2% of the nation's electric power was generated via renewable resources. 26 The Administration s energy strategy encourages increased conventional
What s It All About? The Sun as a Power Source Instructor Guide
 What s It All About? The Sun as a Power Source Instructor Guide Subject Area Unit Grade Time Science Earth Science K - 1st grade 45 minutes Overview This activity reinforces the concept that the sun supplies
Alternative Energy. Terms and Concepts: Relative quantities of potential energy resources, Solar constant, Economies of scale
 Objectives Key Terms and Concepts Introduction Solar Wind Hydroelectric Power Geothermal Sources Biofuels Summary: Economies of Scale Questions for the video if time permits Alternative Energy Objectives:
The Economic Impacts and Occupational Analysis of the North Carolina Motorsports Industry for 2005
 The Economic Impacts and Occupational Analysis of the North Carolina Motorsports Industry for 2005 Prepared by John E. Connaughton TIAA-CREF Professor of Economics Ronald A. Madsen Professor of Economics
Economic Impact Study
 Economic Impact Study U.S.- Based Scrap Recycling Industry 2015 Prepared for the Institute for Scrap Recycling Industries, Inc. Executive Summary Scrap recycling is a major U.S.-based industry dedicated
Clean State Energy Actions 2011 Update. north carolina. Energy efficiency included in North Carolina s REPS
 Energy Efficiency Building Energy Codes Utility Demand-Side-Management Utility Rate Realignment Energy Savings Targets/Energy Efficiency Resource Standards 2009 North Carolina Energy Conservation Code
RENEWABLE ENERGY RESOURCES PROGRAM REPORT
 RENEWABLE ENERGY RESOURCES PROGRAM REPORT January through December 2008 Illinois Department of Commerce and Economic Opportunity Bureau of Energy and Recycling Renewable Energy Resources Program 620 East
GRID NEUTRAL CALIFORNIA SCHOOLS
 We are committed to achieving grid neutrality (i.e. zero net energy) in all new schools in California, a concept that means schools will not only self-generate all the energy they need, but will also put
Renewable Choice Energy
 Catawba College Table of Contents About Renewable Choice The Problem: Electricity Production Today The Solutions: Renewable Energy Sources Renewable Energy Credits (RECs) Who can participate in Renewable
ABSTRACT DCMCCT PROJECT OVERVIEW
 Title: Case Study of the Austin Energy Dell Regional Children s Medical Center of Central Texas Packaged Hybrid CHP Energy Plant in Austin, Texas Authors: Mr. Ed Mardiat, Burns & McDonnell Mr. Jim Teigen,
Energy Savings through Solar Energy for Municipalities
 Energy Savings through Solar Energy for Municipalities September 2014 2014 Sunvestment Group www.sunvestmentgroup.com Topics to Cover Who We Are RER Energy Group Sunvestment Group Why Now for Solar Energy
Overview of Long Island Electric Service Territory
 Overview of Long Island Electric Service Territory Long Island Electric Service Territory» Long Island s electric service customers are located in Nassau County and Suffolk County (except for the villages
MONITORING SCHOOL ENERGY CONSUMPTION
 MONITORING SCHOOL ENERGY CONSUMPTION Goal(s): The mains goal of the energy monitoring activity are: To make the pupils and all school staff aware of school energy consumption; and To show how changes in
Massachusetts $ Savings and Job Gains from Energy Efficiency in Buildings & Transportation
 Massachusetts $ Savings and Job Gains from Energy Efficiency in Buildings & Transportation Marc Breslow, Ph.D. Director of Transportation & Buildings Policy Executive Office of Energy & Environmental Affairs
Do-Now. 1.) Get out notebook.
 Get out notebook.") Do-Now 1.) Get out notebook. 2.) Answer the following questions on the first clean sheet in your notebook. 1.) What are renewable resources? 2.) What are nonrenewable resources? Alternative Sources of
Do-Now 1.) Get out notebook. 2.) Answer the following questions on the first clean sheet in your notebook. 1.) What are renewable resources? 2.) What are nonrenewable resources? Alternative Sources of
Economic and Rate Impact Analysis of Clean Energy Development in North Carolina 2015 Update
 February 2015 Economic and Rate Impact Analysis of Clean Energy Development in North Carolina 2015 Update Prepared for North Carolina Sustainable Energy Association 4800 Six Forks Rd Suite 300 Raleigh,
Rainwater Harvesting
 Rainwater Harvesting With climate change now a reality rather than a speculated possibility, the demand on water resources has gone up, whilst the amount of water available for supply has gone down. Forth
Consider How can you collect solar energy for use in your school? What are other alternatives?
 5 a 5 Energy Sources a - Energy from the sun Purpose To explore sourcing our energy from the sun Key concepts Solar energy is a natural and renewable resource Heat energy from the sun can be used to heat
Post graduate program for engineering leading to M.Tech in renewable energy systems with specialization in solar energy
 Post graduate program for engineering leading to M.Tech in renewable energy systems with specialization in solar energy 1.0 Introduction India s growing energy needs mixed with world s order for reducing
Texas Wind: The New Oil. The earth is slowly, but surely, exhausting its resources. Fossil Fuels like coal and
 Charles Budney English 138T Friday, April 5, 2013 Texas Wind: The New Oil The earth is slowly, but surely, exhausting its resources. Fossil Fuels like coal and petroleum are undeniably a finite resource.
Economic Impact Analysis of Clean Energy Development in North Carolina 2014 Update
 April 2014 Economic Impact Analysis of Clean Energy Development in North Carolina 2014 Update Prepared for North Carolina Sustainable Energy Association P.O. Box 6465 Raleigh, NC 27628 Prepared by RTI
 CLASSIFICATION SYSTEM BY FIELD AND SUB-FIELD OF EXPERTISE SUPPLIERS REGISTRY OF GOODS AND SERVICES ENAP GROUP OF COMPANIES I. Suppliers are classified in three groups: Classification Equipments, materials
NORTH CAROLINA INCENTIVES
 NORTH CAROLINA INCENTIVES Name: Asheville - Building Permit Fee Waiver Type: Green Building Incentive, Builder Technologies eligible: Energy Star Rating, Healthy Built Home Certification, LEED Certification,
Levelized Cost and Levelized Avoided Cost of New Generation Resources in the Annual Energy Outlook 2015
 June 2015 Levelized Cost and Levelized Avoided Cost of New Generation Resources in the Annual Energy Outlook 2015 This paper presents average values of levelized costs for generating technologies that
Renewable Energy: Solar and Wind. Jim Zuber Acting Advanced Energy Manager Ohio Department of Development Ohio Energy Office October 29, 2007
 Renewable Energy: Solar and Wind Jim Zuber Acting Advanced Energy Manager Ohio Department of Development Ohio Energy Office October 29, 2007 Wind Energy Generation of electricity from wind, typically 3-bladed
HOW TO SELECT GREEN TECHNOLOGIES IN A HARBOUR SETUP
 HOW TO SELECT GREEN TECHNOLOGIES IN A HARBOUR SETUP E-Harbours towards sustainable, clean and energetic innovative harbour cities in the rth Sea Region ACKNOWLEDGEMENT This report has been realised with
Lab 10. Solar and Wind Power
 1 Name Lab 10. Solar and Wind Power INTRODUCTION Sunlight can be used to create heat or generate electrical power. This is referred to as solar energy. It is a clean form of energy production, which doesn't
Using Renewable Energy to Pump Water
 L-5457 6/04 Using Renewable Energy to Pump Water Juan Enciso and Michael Mecke* You can save money and help reduce air pollution by using renewable energy sources such as solar or wind power for your home,
Multiple sources of energy will be available, giving the consumer choices. A Higher Percentage of Energy will come from renewable energy sources
 Editor s comments: Numbers in parentheses indicate the number of duplicate or extremely similar comments made. The headings are editor s best attempt to draft vision statements reflecting the participants
SOUTHEAST ENERGY EFFICIENCY ALLIANCE. Clean Energy Greenville, SC May 29, 2009
 SOUTHEAST ENERGY EFFICIENCY ALLIANCE Clean Energy Greenville, SC May 29, 2009 Who is SEEA? The Southeast Energy Efficiency Alliance builds regional partnerships to promote and achieve energy efficiency
Casper Wind Power Project Using Our Land Wisely
 Casper Wind Power Project Using Our Land Wisely Chevron Global Power Company The solutions are not either/or. It s not a choice between more drilling or more efficiency. It s not a choice between coal
Alternative Energy Resources
 Alternative Energy Resources Energy Resource Advantages Disadvantages What are some renewable energy resources? A nonrenewable resource cannot be replaced in a reasonable amount of time. Fossil fuels such
Generating Current Electricity: Complete the following summary table for each way that electrical energy is generated. Pros:
 P a g e 1 Generating Current Electricity: Complete the following summary table for each way that electrical energy is generated. Generating Electrical Energy Using Moving Water: Hydro-Electric Generation
KING COLLEGE SCHOOL OF BUSINESS KING COLLEGE REGIONAL ECONOMIC STUDIES (KCRES) KCRES PAPER NO. 4, May 2012
 KCRES PAPER NO. 4, May 2012") KING COLLEGE SCHOOL OF BUSINESS KING COLLEGE REGIONAL ECONOMIC STUDIES (KCRES) KCRES PAPER NO. 4, May 2012 Economic Impact Multipliers for the Coalfield Region of Southwestern Virginia The Coalfield Region
KING COLLEGE SCHOOL OF BUSINESS KING COLLEGE REGIONAL ECONOMIC STUDIES (KCRES) KCRES PAPER NO. 4, May 2012 Economic Impact Multipliers for the Coalfield Region of Southwestern Virginia The Coalfield Region
Role of Natural Gas in a Sustainable Energy Future
 Role of Natural Gas in a Sustainable Energy Future Alexander Medvedev, Deputy Chairman of Gazprom Management Committee, Director General of Gazprom Export 2 nd Ministerial Gas Forum Doha, 30 November 2010
ALASKA S GREEN ECONOMY SUMMARY
 ALASKA S GREEN ECONOMY SUMMARY The emerging green economy is diverse and widespread. To varying degrees, every state is witnessing growth in some green industry segment, and more often than not, this business
North Carolina Clean Energy Industry Census. February 2015
 North Carolina Clean Energy Industry Census February 2015 Authors: Robin Aldina Ellis Baehr William Supple Ivan Urlaub Design: Jaqueta Abbey North Carolina Sustainable Energy Association: The NC Sustainable
Prepared for. FORWARD ATLANTA The Atlanta Chamber of Commerce. by George W. Morris, Jr.
 AIR CONDITIONING AND REFRIGERATION EQUIPMENT A MANUFACTURING OPPORTUNITY IN ATLANTA Prepared for FORWARD ATLANTA The Atlanta Chamber of Commerce by George W. Morris, Jr. Industrial Development Division
POWER & RENEWABLE ENERGY SERVICES
 POWER & RENEWABLE ENERGY SERVICES Nuclea Siting - Assistance to permitting Environmental Impact Assessment Safety and environmental audits Construction code compliance and design review Supplier Technical
Solar Energy in Egypt Advantages and Obstacles
 Solar Energy in Egypt Advantages and Obstacles By Samir S. Ayad Professor of Mechanical Engineering Faculty of Engineering Benha University Email:samir_ayad@mail.com Cell Phone: +2 012 7871281 President
Clean Energy Jobs Plan
 Clean Energy Jobs Plan Introduction When I was governor, California was the world leader in renewable energy and it led the nation in efficiency standards. Our programs saved California consumers billions
Where and Why Does the Wind Blow?
 EXPLORATION Where and Why Does the Wind Blow? Examine the map and the key. Most sources say that areas with annual average wind speeds greater than 6.5 meters per second at 80-100 m are suitable for utility
The Economic Impact of Dominion Capital Expenditure Projects
 The Economic Impact of Dominion Capital Expenditure Projects Prepared for Dominion Virginia Power October 22, 2015 1309 E Cary Street, Richmond, VA 23219 1025 Huron Road East, Cleveland, OH 44115 chmuraecon.com
Renewable Energy on Regional Power Grids Can Help States Meet Federal Carbon Standards
 FACT SHEET Renewable Energy on Regional Power Grids Can Help States Meet Federal Carbon Standards In June 2014, the U.S. Environmental Protection Agency (EPA) used its authority under Section 111(d) of
T E A C H E R S N O T E S
 T E A C H E R S N O T E S Focus: Students explore energy: its sources, forms, and transformations. Students also consider the benefits of energy-efficient technologies and energy conservation. Learning
Green Financial Options in North Carolina
 Green Financial Options in North Carolina Presented by Scott Suddreth Technical Program Director Building Performance Engineering October 2008 RENEWABLES NORTH CAROLINA SEO North Carolina - Energy Improvement
AE BIO SOLAR AE BIO SOLAR HYBRID PLANT SOLAR/BIOMASS ADESSO ENERGIA SRL HYBRID PLANT SOLAR/BIOMASS THE BEGINNING OF A NEW ENERGY PRESENTATION
 ADESSO ENERGIA SRL AE BIO SOLAR THE BEGINNING OF A NEW ENERGY PRESENTATION Tel.0918887364 14.05.2014 fax 0917480735 Pagina 1 INTRODUCTION Adesso Energia is an innovative startup based in Palermo created
LADWP GREEN POWER PROGRAM
 LADWP GREEN POWER PROGRAM INTRODUCTION The Los Angeles Department of Water and Power (DWP), as the power provider for the City of Los Angeles, is offering its customers a comprehensive green power program
GEOTHERMAL HEAT PUMP SYSTEMS ARE RED HOT BUT ARE THEY REALLY GREEN?
 GEOTHERMAL HEAT PUMP SYSTEMS ARE RED HOT BUT ARE THEY REALLY GREEN? Richard C. Niess 1 Gilbert & Associates / Apogee Interactive, Inc., Gloucester Point, Virginia 23062 Phone & Fax (804) 642 0400 ABSTRACT
Solar systems provide a range of flexible heating
 f a c t s h e e t 7 Solar Power Production photo by Alex Nikada Why solar? Solar systems provide a range of flexible heating and electricity options and are particularly wellsuited to remote or off-grid
Reducing Greenhouse Gas Emissions through Alternative Energy
 Reducing Greenhouse Gas Emissions through Alternative Energy Transferable Solution Project Summary Project Activities Project Benefits Lessons Learned Contact Information Project Title : Reducing Greenhouse
Detroit Regional Chamber
 Detroit Regional Chamber Maureen Krauss Vice President, Economic Development Email: mkrauss@detroitchamber.com Detroit Regional Chamber Overview The Detroit Regional Chamber is the premier business development
Appendix F Alternatives for Estimating Energy Consumption
 Appendix F Alternatives Estimating Energy Consumption This appendix is reprinted from the Annual Energy Review 200. EIA continues to review alternative options accounting energy consumption and related
Developing Ocean Energy in Ireland. Belmullet Wave Energy Test Site
 Developing Ocean Energy in Ireland Belmullet Wave Energy Test Site Where does our energy come from? Most of the energy we use in Ireland comes from fossil fuels such as oil, coal, peat and gas. We burn
North Carolina in the Global Economy
 North Carolina in the Global Economy Presentation to the 2015 mfgcon NC State McKimmon Conference & Training Center Lukas Brun Senior Research Analyst October 20, 2015 Agenda Center background & activities
Is a Green Economy the Key to Job Growth? Employment Trends and Opportunities for ESL Learners
 Is a Green Economy the Key to Job Growth? Employment Trends and Opportunities for ESL Learners OBJECTIVES At the end of this session, students will be able to: Understand the connection between carbon
Summary technical description of the SUNSTORE 4 plant in Marstal
 Summary technical description of the SUNSTORE 4 plant in Marstal The purpose of the SUNSTORE concept implemented in Marstal is to show that district heating can be produced with 100 % RES of which solar
ASSOCIATION INC Geothermal Energy: New Zealand s most reliable sustainable energy resource
 NEW PO Box 11-595 ZEALAND GEOTHERMAL Tel: 64-9-474 2187 ASSOCIATION INC Geothermal Energy: New Zealand s most reliable sustainable energy resource Current Status, Costs and Advantages of Geothermal East
How to Earn the LEED Green Power Credit
 3D EG REES WH ITE PAPER How to Earn the LEED Green Power Credit Using on-site and off-site renewable energy to mitigate the impact of greenhouse gas emissions associated with a LEED project s energy use
Preparatory Paper on Focal Areas to Support a Sustainable Energy System in the Electricity Sector
 Preparatory Paper on Focal Areas to Support a Sustainable Energy System in the Electricity Sector C. Agert, Th. Vogt EWE Research Centre NEXT ENERGY, Oldenburg, Germany corresponding author: Carsten.Agert@next-energy.de
Port Jackson Partners
 Port Jackson Partners NOT JUST A CARBON HIT ON ELECTRICITY PRICES Many factors will drive a doubling of electricity prices in many states by 15. This will have a major impact on virtually all businesses.
United States SECURITIES AND EXCHANGE COMMISSION Washington, D.C. 20549 FORM 8-K
 United States SECURITIES AND EXCHANGE COMMISSION Washington, D.C. 20549 FORM 8-K CURRENT REPORT Pursuant to Section 13 or 15(d) of the Securities Exchange Act of 1934 January 19, 2006 Date of report (date
Aggregated Cluster Definitions
 Aggregated Cluster Definitions To minimize the problems caused by data suppression in the nationwide county analysis, the research team revised the six-digit cluster definitions to use three-digit NAICS