Cool Tools for PROC LOGISTIC
|
|
|
- Jesse Wilkerson
- 10 years ago
- Views:
Transcription
1 Cool Tools for PROC LOGISTIC Paul D. Allison Statistical Horizons LLC and the University of Pennsylvania March

2 New Features in LOGISTIC ODDSRATIO statement EFFECTPLOT statement ROC comparisons FIRTH option 2

3 Based on Recent Book 3

4 Also covered in 2-day course Logistic Regression Using SAS June 6-7, Philadelphia Temple University Center City Other SAS courses offered by Statistical Horizons: Introduction to Structural Equation Modeling Paul Allison, Instructor April 12-13, Washington, DC Longitudinal Data Analysis Using SAS Paul Allison, Instructor April 19-20, Philadelphia Missing Data Paul Allison, Instructor May 17-18, Los Angeles Mediation and Moderation Andrew Hayes & Kristopher Preacher July 15-19, Philadelphia Event History & Survival Analysis Paul Allison, Instructor July 15-19, Philadelphia Get more info at StatisticalHorizons.com 4

5 Example Data Set Data: 5960 loan customers BAD 1=customer defaults, otherwise 0 (dependent variable) LOAN Amount of the loan DEBTCON 1=debt consolidation, 0=home improvement DELINQ Number of delinquent trade lines NINQ Number of recent credit inquiries. DEBTINC Debt to income ratio 5

6 ODDSRATIO Statement Good for interactions Fit the following model: PROC LOGISTIC DATA=my.credit DESC; MODEL bad = loan debtcon delinq ninq debtinc debtcon*ninq ; RUN; 6

7 Coefficients Analysis of Maximum Likelihood Estimates Parameter DF Estimate Standard Error Wald Chi-Square Pr > ChiSq Intercept <.0001 loan E debtcon delinq <.0001 ninq <.0001 debtinc <.0001 debtcon*ninq

8 Odds Ratios Odds Ratio Estimates Effect Point Estimate 95% Wald Confidence Limits LOAN DELINQ DEBTINC Odds ratios not reported for the variables in the interaction. But now we can get them: PROC LOGISTIC DATA=my.credit DESC; MODEL bad = loan debtcon delinq ninq debtinc debtcon*ninq ; ODDSRATIO ninq / AT(debtcon=0 1); ODDSRATIO debtcon / AT(ninq= ); RUN; 8

9 Odds Ratios for Interactions Odds Ratio Estimates and Wald Confidence Intervals Label Estimate 95% Confidence Limits NINQ at debtcon= NINQ at debtcon= debtcon at NINQ= debtcon at NINQ= debtcon at NINQ= debtcon at NINQ= debtcon at NINQ= debtcon at NINQ= debtcon at NINQ=

10 ODS Graphics 10

11 EFFECTPLOT Statement The EFFECTPLOT statement offers many possibilities for plotting predicted values as a function of one or more predictors. Here s how to get a graph for one predictor, holding the others at their means (or reference category for CLASS variables). ODS GRAPHICS ON; PROC LOGISTIC DATA=my.credit DESC; MODEL bad = loan debtcon delinq ninq debtinc; EFFECTPLOT FIT(X=debtinc); RUN; ODS GRAPHICS OFF; 11
. ODS GRAPHICS ON; PROC LOGISTIC DATA=my.")
12 12

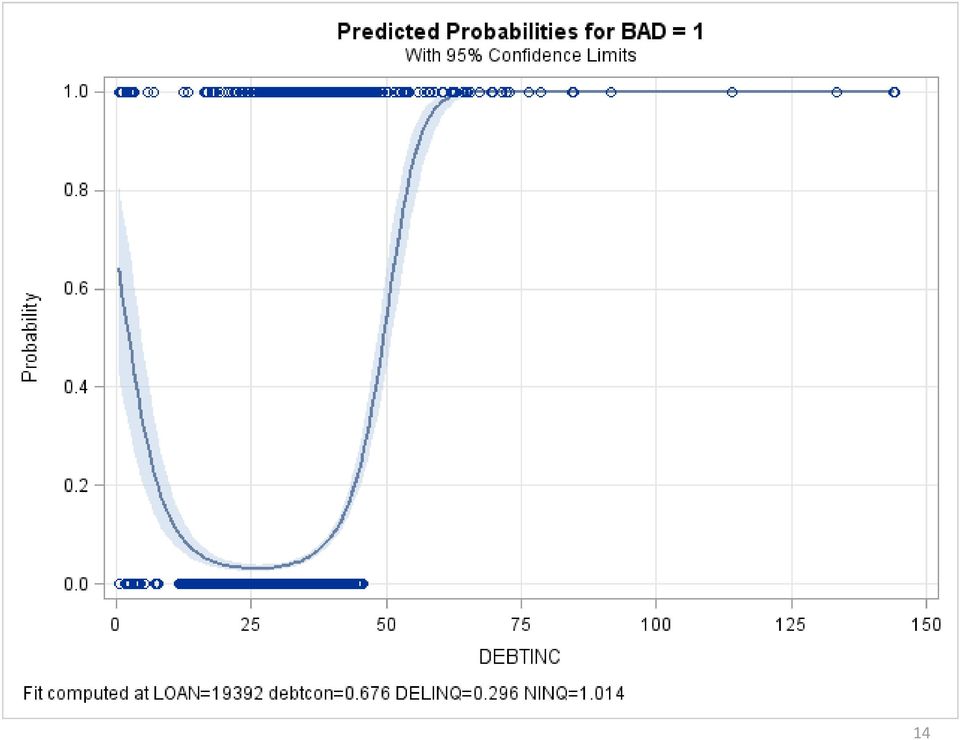
13 Polynomial Functions Things get more interesting with polynomial functions: ODS GRAPHICS ON; PROC LOGISTIC DATA=my.credit DESC; MODEL bad = loan debtcon delinq ninq debtinc debtinc*debtinc; EFFECTPLOT FIT(X=debtinc); RUN; ODS GRAPHICS OFF; The squared term is highly significant. 13
; RUN; ODS GRAPHICS OFF; The")
14 14
15 EFFECTPLOT with Interactions EFFECTPLOT is also very useful for visualizing interactions: ODS GRAPHICS ON; PROC LOGISTIC DATA=my.credit DESC; MODEL bad = loan debtcon delinq ninq debtinc debtcon*ninq ; EFFECTPLOT FIT(X=ninq) / AT(debtcon=0 1); RUN; ODS GRAPHICS OFF; 15
 / AT(debtcon=0 1); RUN; ODS")
16 16

17 EFFECTPLOT with Interactions If you want the two graphs on the same axes, use the SLICEFIT option: ODS GRAPHICS ON; PROC LOGISTIC DATA=my.credit DESC; MODEL bad = loan debtcon delinq ninq debtinc debtcon*ninq ; EFFECTPLOT SLICEFIT(X=ninq SLICEBY=debtcon=0 1); RUN; ODS GRAPHICS OFF; 17
; RUN; ODS GRAPHICS")
18 18

19 ROC Curves The Receiver Operating Characteristic curve is a way of evaluating the predictive power of a model for a binary outcome. It s a graph of sensitivity vs. 1-specificity. Sensitivity = probability of predicting an event, given that the individual has an event. Sensitivity = probability of predicting a non-event, given that the individual does not have an event. Both of these depend on the cut-point for determining whether a predicted probability is evaluated as an event prediction or a non-event prediction. Here s how to get the curve: PROC LOGISTIC DATA=my.credit PLOTS(ONLY)=ROC; MODEL bad = loan debtcon delinq ninq debtinc debtcon*ninq debtinc*debtinc; RUN; 19

20 The area under the curve (the C statistic) is a summary measure of predictive power 20

21 ROCCONTRAST With the ROC and ROCCONTRAST statements, we can get confidence intervals around the C statistic and compare different curves: PROC LOGISTIC DATA=my.credit; MODEL bad = loan debtcon delinq ninq debtinc debtcon*ninq debtinc*debtinc; ROC 'omit debtcon*ninq' loan debtcon delinq ninq debtinc*debtinc; ROC 'omit debtinc*debtinc' loan delinq ninq debtinc debtcon*ninq; ROC 'omit both' loan debtcon delinq ninq debtinc; ROCCONTRAST / ESTIMATE=ALLPAIRS; RUN; 21
22 ROC Results 1 ROC Association Statistics ROC Model Mann-Whitney Area Standard Error 95% Wald Confidence Limits Somers' D (Gini) Gamma Tau-a Model omit debtcon *ninq omit debtinc* debtinc omit both
23 ROC Results 2 ROC Contrast Test Results Contrast DF Chi-Square Pr > ChiSq Reference = Model <.0001 ROC Contrast Estimation and Testing Results by Row Contrast Estimate Standard Error Model - omit debtcon*ninq Model - omit debtinc*debtinc 95% Wald Confidence Limits Chi-Square Pr > ChiSq Model - omit both omit debtcon*ninq - omit debtinc*debtinc omit debtcon*ninq - omit both omit debtinc*debtinc - omit both <
24 ROC Results 24
25 FIRTH Option A solution to the problem of quasi-complete separation failure of the ML algorithm to converge because some coefficients are infinite. Example: PROC LOGISTIC DATA=my.credit ; CLASS derog /PARAM=GLM DESC; MODEL bad = derog; RUN; DEROG is the number of derogatory reports. This code produces the following in both the log and output windows. WARNING: There is possibly a quasi-complete separation of data points. The maximum likelihood estimate may not exist. WARNING: The LOGISTIC procedure continues in spite of the above warning. Results shown are based on the last maximum likelihood iteration. Validity of the model fit is questionable. 25
26 Odds Ratio Estimates Effect Point Estimate 95% Wald Confidence Limits DEROG 10 vs 0 <0.001 <0.001 > DEROG 9 vs 0 <0.001 <0.001 > DEROG 8 vs 0 <0.001 <0.001 > DEROG 7 vs 0 <0.001 <0.001 > DEROG 6 vs DEROG 5 vs DEROG 4 vs DEROG 3 vs DEROG 2 vs DEROG 1 vs
27 Frequency BAD Table of BAD by DEROG DEROG Total Total Why does this happen? Because for values of DEROG > 6, every individual had BAD=1. Quasi-complete separation occurs when, for one or more categories of a CLASS variable, either everyone has the event or no one has the event. 27
28 Penalized Likelihood An effective solution is to invoke penalized likelihood by the FIRTH option: PROC LOGISTIC DATA=my.credit ; CLASS derog / PARAM=GLM DESC; MODEL bad = derog /FIRTH CLODDS=PL; RUN; The CLODDS options requests confidence intervals for the odds ratios based on the profile likelihood method. 28
29 Odds Ratio Estimates and Profile-Likelihood Confidence Intervals Effect Unit Estimate 95% Confidence Limits DEROG 10 vs < DEROG 9 vs < DEROG 8 vs < DEROG 7 vs < DEROG 6 vs DEROG 5 vs DEROG 4 vs DEROG 3 vs DEROG 2 vs DEROG 1 vs
SUGI 29 Statistics and Data Analysis
 Paper 194-29 Head of the CLASS: Impress your colleagues with a superior understanding of the CLASS statement in PROC LOGISTIC Michelle L. Pritchard and David J. Pasta Ovation Research Group, San Francisco,
PROC LOGISTIC: Traps for the unwary Peter L. Flom, Independent statistical consultant, New York, NY
 PROC LOGISTIC: Traps for the unwary Peter L. Flom, Independent statistical consultant, New York, NY ABSTRACT Keywords: Logistic. INTRODUCTION This paper covers some gotchas in SAS R PROC LOGISTIC. A gotcha
Basic Statistical and Modeling Procedures Using SAS
 Basic Statistical and Modeling Procedures Using SAS One-Sample Tests The statistical procedures illustrated in this handout use two datasets. The first, Pulse, has information collected in a classroom
Improved Interaction Interpretation: Application of the EFFECTPLOT statement and other useful features in PROC LOGISTIC
 Paper AA08-2013 Improved Interaction Interpretation: Application of the EFFECTPLOT statement and other useful features in PROC LOGISTIC Robert G. Downer, Grand Valley State University, Allendale, MI ABSTRACT
VI. Introduction to Logistic Regression
 VI. Introduction to Logistic Regression We turn our attention now to the topic of modeling a categorical outcome as a function of (possibly) several factors. The framework of generalized linear models
SAS Software to Fit the Generalized Linear Model
 SAS Software to Fit the Generalized Linear Model Gordon Johnston, SAS Institute Inc., Cary, NC Abstract In recent years, the class of generalized linear models has gained popularity as a statistical modeling
11. Analysis of Case-control Studies Logistic Regression
 Research methods II 113 11. Analysis of Case-control Studies Logistic Regression This chapter builds upon and further develops the concepts and strategies described in Ch.6 of Mother and Child Health:
SAS Rule-Based Codebook Generation for Exploratory Data Analysis Ross Bettinger, Senior Analytical Consultant, Seattle, WA
 SAS Rule-Based Codebook Generation for Exploratory Data Analysis Ross Bettinger, Senior Analytical Consultant, Seattle, WA ABSTRACT A codebook is a summary of a collection of data that reports significant
STATISTICA Formula Guide: Logistic Regression. Table of Contents
 : Table of Contents... 1 Overview of Model... 1 Dispersion... 2 Parameterization... 3 Sigma-Restricted Model... 3 Overparameterized Model... 4 Reference Coding... 4 Model Summary (Summary Tab)... 5 Summary
Developing Risk Adjustment Techniques Using the SAS@ System for Assessing Health Care Quality in the lmsystem@
 Developing Risk Adjustment Techniques Using the SAS@ System for Assessing Health Care Quality in the lmsystem@ Yanchun Xu, Andrius Kubilius Joint Commission on Accreditation of Healthcare Organizations,
Segmentation For Insurance Payments Michael Sherlock, Transcontinental Direct, Warminster, PA
 Segmentation For Insurance Payments Michael Sherlock, Transcontinental Direct, Warminster, PA ABSTRACT An online insurance agency has built a base of names that responded to different offers from various
ln(p/(1-p)) = α +β*age35plus, where p is the probability or odds of drinking
) = α +β*age35plus, where p is the probability or odds of drinking") Dummy Coding for Dummies Kathryn Martin, Maternal, Child and Adolescent Health Program, California Department of Public Health ABSTRACT There are a number of ways to incorporate categorical variables into
Dummy Coding for Dummies Kathryn Martin, Maternal, Child and Adolescent Health Program, California Department of Public Health ABSTRACT There are a number of ways to incorporate categorical variables into
ABSTRACT INTRODUCTION
 Paper SP03-2009 Illustrative Logistic Regression Examples using PROC LOGISTIC: New Features in SAS/STAT 9.2 Robert G. Downer, Grand Valley State University, Allendale, MI Patrick J. Richardson, Van Andel
Chapter 29 The GENMOD Procedure. Chapter Table of Contents
 Chapter 29 The GENMOD Procedure Chapter Table of Contents OVERVIEW...1365 WhatisaGeneralizedLinearModel?...1366 ExamplesofGeneralizedLinearModels...1367 TheGENMODProcedure...1368 GETTING STARTED...1370
Statistics in Retail Finance. Chapter 2: Statistical models of default
 Statistics in Retail Finance 1 Overview > We consider how to build statistical models of default, or delinquency, and how such models are traditionally used for credit application scoring and decision
Chapter 39 The LOGISTIC Procedure. Chapter Table of Contents
 Chapter 39 The LOGISTIC Procedure Chapter Table of Contents OVERVIEW...1903 GETTING STARTED...1906 SYNTAX...1910 PROCLOGISTICStatement...1910 BYStatement...1912 CLASSStatement...1913 CONTRAST Statement.....1916
CHAPTER 3 EXAMPLES: REGRESSION AND PATH ANALYSIS
 Examples: Regression And Path Analysis CHAPTER 3 EXAMPLES: REGRESSION AND PATH ANALYSIS Regression analysis with univariate or multivariate dependent variables is a standard procedure for modeling relationships
Lecture 19: Conditional Logistic Regression
 Lecture 19: Conditional Logistic Regression Dipankar Bandyopadhyay, Ph.D. BMTRY 711: Analysis of Categorical Data Spring 2011 Division of Biostatistics and Epidemiology Medical University of South Carolina
Statistics and Data Analysis
 NESUG 27 PRO LOGISTI: The Logistics ehind Interpreting ategorical Variable Effects Taylor Lewis, U.S. Office of Personnel Management, Washington, D STRT The goal of this paper is to demystify how SS models
Logistic Regression. http://faculty.chass.ncsu.edu/garson/pa765/logistic.htm#sigtests
 Logistic Regression http://faculty.chass.ncsu.edu/garson/pa765/logistic.htm#sigtests Overview Binary (or binomial) logistic regression is a form of regression which is used when the dependent is a dichotomy
This can dilute the significance of a departure from the null hypothesis. We can focus the test on departures of a particular form.
 One-Degree-of-Freedom Tests Test for group occasion interactions has (number of groups 1) number of occasions 1) degrees of freedom. This can dilute the significance of a departure from the null hypothesis.
Credit Risk Analysis Using Logistic Regression Modeling
 Credit Risk Analysis Using Logistic Regression Modeling Introduction A loan officer at a bank wants to be able to identify characteristics that are indicative of people who are likely to default on loans,
Using An Ordered Logistic Regression Model with SAS Vartanian: SW 541
 Using An Ordered Logistic Regression Model with SAS Vartanian: SW 541 libname in1 >c:\=; Data first; Set in1.extract; A=1; PROC LOGIST OUTEST=DD MAXITER=100 ORDER=DATA; OUTPUT OUT=CC XBETA=XB P=PROB; MODEL
SUMAN DUVVURU STAT 567 PROJECT REPORT
 SUMAN DUVVURU STAT 567 PROJECT REPORT SURVIVAL ANALYSIS OF HEROIN ADDICTS Background and introduction: Current illicit drug use among teens is continuing to increase in many countries around the world.
An Application of the Cox Proportional Hazards Model to the Construction of Objective Vintages for Credit in Financial Institutions, Using PROC PHREG
 Paper 3140-2015 An Application of the Cox Proportional Hazards Model to the Construction of Objective Vintages for Credit in Financial Institutions, Using PROC PHREG Iván Darío Atehortua Rojas, Banco Colpatria
Overview Classes. 12-3 Logistic regression (5) 19-3 Building and applying logistic regression (6) 26-3 Generalizations of logistic regression (7)
 19-3 Building and applying logistic regression (6) 26-3 Generalizations of logistic regression (7)") Overview Classes 12-3 Logistic regression (5) 19-3 Building and applying logistic regression (6) 26-3 Generalizations of logistic regression (7) 2-4 Loglinear models (8) 5-4 15-17 hrs; 5B02 Building and
Overview Classes 12-3 Logistic regression (5) 19-3 Building and applying logistic regression (6) 26-3 Generalizations of logistic regression (7) 2-4 Loglinear models (8) 5-4 15-17 hrs; 5B02 Building and
Generalized Linear Models
 Generalized Linear Models We have previously worked with regression models where the response variable is quantitative and normally distributed. Now we turn our attention to two types of models where the
Despite its emphasis on credit-scoring/rating model validation,
 RETAIL RISK MANAGEMENT Empirical Validation of Retail Always a good idea, development of a systematic, enterprise-wide method to continuously validate credit-scoring/rating models nonetheless received
Introduction to Multilevel Modeling Using HLM 6. By ATS Statistical Consulting Group
 Introduction to Multilevel Modeling Using HLM 6 By ATS Statistical Consulting Group Multilevel data structure Students nested within schools Children nested within families Respondents nested within interviewers
Ordinal Regression. Chapter
 Ordinal Regression Chapter 4 Many variables of interest are ordinal. That is, you can rank the values, but the real distance between categories is unknown. Diseases are graded on scales from least severe
Charles Secolsky County College of Morris. Sathasivam 'Kris' Krishnan The Richard Stockton College of New Jersey
 Using logistic regression for validating or invalidating initial statewide cut-off scores on basic skills placement tests at the community college level Abstract Charles Secolsky County College of Morris
Example: Credit card default, we may be more interested in predicting the probabilty of a default than classifying individuals as default or not.
 Statistical Learning: Chapter 4 Classification 4.1 Introduction Supervised learning with a categorical (Qualitative) response Notation: - Feature vector X, - qualitative response Y, taking values in C
Probit Analysis By: Kim Vincent
 Probit Analysis By: Kim Vincent Quick Overview Probit analysis is a type of regression used to analyze binomial response variables. It transforms the sigmoid dose-response curve to a straight line that
Modeling Lifetime Value in the Insurance Industry
 Modeling Lifetime Value in the Insurance Industry C. Olivia Parr Rud, Executive Vice President, Data Square, LLC ABSTRACT Acquisition modeling for direct mail insurance has the unique challenge of targeting
Regression Clustering
 Chapter 449 Introduction This algorithm provides for clustering in the multiple regression setting in which you have a dependent variable Y and one or more independent variables, the X s. The algorithm
Regression Modeling Strategies
 Frank E. Harrell, Jr. Regression Modeling Strategies With Applications to Linear Models, Logistic Regression, and Survival Analysis With 141 Figures Springer Contents Preface Typographical Conventions
Binary Logistic Regression
 Binary Logistic Regression Main Effects Model Logistic regression will accept quantitative, binary or categorical predictors and will code the latter two in various ways. Here s a simple model including
Data Mining: An Overview of Methods and Technologies for Increasing Profits in Direct Marketing. C. Olivia Rud, VP, Fleet Bank
 Data Mining: An Overview of Methods and Technologies for Increasing Profits in Direct Marketing C. Olivia Rud, VP, Fleet Bank ABSTRACT Data Mining is a new term for the common practice of searching through
Gamma Distribution Fitting
 Chapter 552 Gamma Distribution Fitting Introduction This module fits the gamma probability distributions to a complete or censored set of individual or grouped data values. It outputs various statistics
Statistics, Data Analysis & Econometrics
 Using the LOGISTIC Procedure to Model Responses to Financial Services Direct Marketing David Marsh, Senior Credit Risk Modeler, Canadian Tire Financial Services, Welland, Ontario ABSTRACT It is more important
Students' Opinion about Universities: The Faculty of Economics and Political Science (Case Study)
") Cairo University Faculty of Economics and Political Science Statistics Department English Section Students' Opinion about Universities: The Faculty of Economics and Political Science (Case Study) Prepared
Cairo University Faculty of Economics and Political Science Statistics Department English Section Students' Opinion about Universities: The Faculty of Economics and Political Science (Case Study) Prepared
Data Mining and Data Warehousing. Henryk Maciejewski. Data Mining Predictive modelling: regression
 Data Mining and Data Warehousing Henryk Maciejewski Data Mining Predictive modelling: regression Algorithms for Predictive Modelling Contents Regression Classification Auxiliary topics: Estimation of prediction
Sun Li Centre for Academic Computing [email protected]
 Sun Li Centre for Academic Computing [email protected] Elementary Data Analysis Group Comparison & One-way ANOVA Non-parametric Tests Correlations General Linear Regression Logistic Models Binary Logistic
Weight of Evidence Module
 Formula Guide The purpose of the Weight of Evidence (WoE) module is to provide flexible tools to recode the values in continuous and categorical predictor variables into discrete categories automatically,
Analysis of Survey Data Using the SAS SURVEY Procedures: A Primer
 Analysis of Survey Data Using the SAS SURVEY Procedures: A Primer Patricia A. Berglund, Institute for Social Research - University of Michigan Wisconsin and Illinois SAS User s Group June 25, 2014 1 Overview
Electronic Thesis and Dissertations UCLA
 Electronic Thesis and Dissertations UCLA Peer Reviewed Title: A Multilevel Longitudinal Analysis of Teaching Effectiveness Across Five Years Author: Wang, Kairong Acceptance Date: 2013 Series: UCLA Electronic
Chapter 13 Introduction to Nonlinear Regression( 非 線 性 迴 歸 )
") Chapter 13 Introduction to Nonlinear Regression( 非 線 性 迴 歸 ) and Neural Networks( 類 神 經 網 路 ) 許 湘 伶 Applied Linear Regression Models (Kutner, Nachtsheim, Neter, Li) hsuhl (NUK) LR Chap 10 1 / 35 13 Examples
Chapter 13 Introduction to Nonlinear Regression( 非 線 性 迴 歸 ) and Neural Networks( 類 神 經 網 路 ) 許 湘 伶 Applied Linear Regression Models (Kutner, Nachtsheim, Neter, Li) hsuhl (NUK) LR Chap 10 1 / 35 13 Examples
CHAPTER 9 EXAMPLES: MULTILEVEL MODELING WITH COMPLEX SURVEY DATA
 Examples: Multilevel Modeling With Complex Survey Data CHAPTER 9 EXAMPLES: MULTILEVEL MODELING WITH COMPLEX SURVEY DATA Complex survey data refers to data obtained by stratification, cluster sampling and/or
ECLT5810 E-Commerce Data Mining Technique SAS Enterprise Miner -- Regression Model I. Regression Node
 Enterprise Miner - Regression 1 ECLT5810 E-Commerce Data Mining Technique SAS Enterprise Miner -- Regression Model I. Regression Node 1. Some background: Linear attempts to predict the value of a continuous
Chapter 7: Simple linear regression Learning Objectives
 Chapter 7: Simple linear regression Learning Objectives Reading: Section 7.1 of OpenIntro Statistics Video: Correlation vs. causation, YouTube (2:19) Video: Intro to Linear Regression, YouTube (5:18) -
Moderation. Moderation
 Stats - Moderation Moderation A moderator is a variable that specifies conditions under which a given predictor is related to an outcome. The moderator explains when a DV and IV are related. Moderation
Examining a Fitted Logistic Model
 STAT 536 Lecture 16 1 Examining a Fitted Logistic Model Deviance Test for Lack of Fit The data below describes the male birth fraction male births/total births over the years 1931 to 1990. A simple logistic
Statistics in Retail Finance. Chapter 6: Behavioural models
 Statistics in Retail Finance 1 Overview > So far we have focussed mainly on application scorecards. In this chapter we shall look at behavioural models. We shall cover the following topics:- Behavioural
Lecture 14: GLM Estimation and Logistic Regression
 Lecture 14: GLM Estimation and Logistic Regression Dipankar Bandyopadhyay, Ph.D. BMTRY 711: Analysis of Categorical Data Spring 2011 Division of Biostatistics and Epidemiology Medical University of South
A LOGISTIC REGRESSION MODEL TO PREDICT FRESHMEN ENROLLMENTS Vijayalakshmi Sampath, Andrew Flagel, Carolina Figueroa
 A LOGISTIC REGRESSION MODEL TO PREDICT FRESHMEN ENROLLMENTS Vijayalakshmi Sampath, Andrew Flagel, Carolina Figueroa ABSTRACT Predictive modeling is the technique of using historical information on a certain
not possible or was possible at a high cost for collecting the data.
 Data Mining and Knowledge Discovery Generating knowledge from data Knowledge Discovery Data Mining White Paper Organizations collect a vast amount of data in the process of carrying out their day-to-day
Statistics 305: Introduction to Biostatistical Methods for Health Sciences
 Statistics 305: Introduction to Biostatistical Methods for Health Sciences Modelling the Log Odds Logistic Regression (Chap 20) Instructor: Liangliang Wang Statistics and Actuarial Science, Simon Fraser
Logistic Regression (1/24/13)
") STA63/CBB540: Statistical methods in computational biology Logistic Regression (/24/3) Lecturer: Barbara Engelhardt Scribe: Dinesh Manandhar Introduction Logistic regression is model for regression used
STA63/CBB540: Statistical methods in computational biology Logistic Regression (/24/3) Lecturer: Barbara Engelhardt Scribe: Dinesh Manandhar Introduction Logistic regression is model for regression used
HLM software has been one of the leading statistical packages for hierarchical
 Introductory Guide to HLM With HLM 7 Software 3 G. David Garson HLM software has been one of the leading statistical packages for hierarchical linear modeling due to the pioneering work of Stephen Raudenbush
Multinomial and ordinal logistic regression using PROC LOGISTIC Peter L. Flom National Development and Research Institutes, Inc
 ABSTRACT Multinomial and ordinal logistic regression using PROC LOGISTIC Peter L. Flom National Development and Research Institutes, Inc Logistic regression may be useful when we are trying to model a
Statistical Models in R
 Statistical Models in R Some Examples Steven Buechler Department of Mathematics 276B Hurley Hall; 1-6233 Fall, 2007 Outline Statistical Models Structure of models in R Model Assessment (Part IA) Anova
LOGISTIC REGRESSION ANALYSIS
 LOGISTIC REGRESSION ANALYSIS C. Mitchell Dayton Department of Measurement, Statistics & Evaluation Room 1230D Benjamin Building University of Maryland September 1992 1. Introduction and Model Logistic
A Handbook of Statistical Analyses Using R. Brian S. Everitt and Torsten Hothorn
 A Handbook of Statistical Analyses Using R Brian S. Everitt and Torsten Hothorn CHAPTER 6 Logistic Regression and Generalised Linear Models: Blood Screening, Women s Role in Society, and Colonic Polyps
Scatter Plots with Error Bars
 Chapter 165 Scatter Plots with Error Bars Introduction The procedure extends the capability of the basic scatter plot by allowing you to plot the variability in Y and X corresponding to each point. Each
MISSING DATA TECHNIQUES WITH SAS. IDRE Statistical Consulting Group
 MISSING DATA TECHNIQUES WITH SAS IDRE Statistical Consulting Group ROAD MAP FOR TODAY To discuss: 1. Commonly used techniques for handling missing data, focusing on multiple imputation 2. Issues that could
Two Correlated Proportions (McNemar Test)
") Chapter 50 Two Correlated Proportions (Mcemar Test) Introduction This procedure computes confidence intervals and hypothesis tests for the comparison of the marginal frequencies of two factors (each with
Chapter 50 Two Correlated Proportions (Mcemar Test) Introduction This procedure computes confidence intervals and hypothesis tests for the comparison of the marginal frequencies of two factors (each with
IBM SPSS Regression 20
 IBM SPSS Regression 20 Note: Before using this information and the product it supports, read the general information under Notices on p. 41. This edition applies to IBM SPSS Statistics 20 and to all subsequent
Logistic (RLOGIST) Example #1
 Example #1") Logistic (RLOGIST) Example #1 SUDAAN Statements and Results Illustrated EFFECTS RFORMAT, RLABEL REFLEVEL EXP option on MODEL statement Hosmer-Lemeshow Test Input Data Set(s): BRFWGT.SAS7bdat Example Using
Logistic (RLOGIST) Example #1 SUDAAN Statements and Results Illustrated EFFECTS RFORMAT, RLABEL REFLEVEL EXP option on MODEL statement Hosmer-Lemeshow Test Input Data Set(s): BRFWGT.SAS7bdat Example Using
Agenda. Mathias Lanner Sas Institute. Predictive Modeling Applications. Predictive Modeling Training Data. Beslutsträd och andra prediktiva modeller
 Agenda Introduktion till Prediktiva modeller Beslutsträd Beslutsträd och andra prediktiva modeller Mathias Lanner Sas Institute Pruning Regressioner Neurala Nätverk Utvärdering av modeller 2 Predictive
Directions for using SPSS
 Directions for using SPSS Table of Contents Connecting and Working with Files 1. Accessing SPSS... 2 2. Transferring Files to N:\drive or your computer... 3 3. Importing Data from Another File Format...
In this tutorial, we try to build a roc curve from a logistic regression.
 Subject In this tutorial, we try to build a roc curve from a logistic regression. Regardless the software we used, even for commercial software, we have to prepare the following steps when we want build
Simple Predictive Analytics Curtis Seare
 Using Excel to Solve Business Problems: Simple Predictive Analytics Curtis Seare Copyright: Vault Analytics July 2010 Contents Section I: Background Information Why use Predictive Analytics? How to use
Data Mining Using SAS Enterprise Miner : A Case Study Approach, Second Edition
 Data Mining Using SAS Enterprise Miner : A Case Study Approach, Second Edition The correct bibliographic citation for this manual is as follows: SAS Institute Inc. 2003. Data Mining Using SAS Enterprise
i SPSS Regression 17.0
 i SPSS Regression 17.0 For more information about SPSS Inc. software products, please visit our Web site at http://www.spss.com or contact SPSS Inc. 233 South Wacker Drive, 11th Floor Chicago, IL 60606-6412
How to set the main menu of STATA to default factory settings standards
 University of Pretoria Data analysis for evaluation studies Examples in STATA version 11 List of data sets b1.dta (To be created by students in class) fp1.xls (To be provided to students) fp1.txt (To be
Auxiliary Variables in Mixture Modeling: 3-Step Approaches Using Mplus
 Auxiliary Variables in Mixture Modeling: 3-Step Approaches Using Mplus Tihomir Asparouhov and Bengt Muthén Mplus Web Notes: No. 15 Version 8, August 5, 2014 1 Abstract This paper discusses alternatives
Data Mining Techniques Chapter 6: Decision Trees
 Data Mining Techniques Chapter 6: Decision Trees What is a classification decision tree?.......................................... 2 Visualizing decision trees...................................................
S03-2008 The Difference Between Predictive Modeling and Regression Patricia B. Cerrito, University of Louisville, Louisville, KY
 S03-2008 The Difference Between Predictive Modeling and Regression Patricia B. Cerrito, University of Louisville, Louisville, KY ABSTRACT Predictive modeling includes regression, both logistic and linear,
A Hybrid Modeling Platform to meet Basel II Requirements in Banking Jeffery Morrision, SunTrust Bank, Inc.
 A Hybrid Modeling Platform to meet Basel II Requirements in Banking Jeffery Morrision, SunTrust Bank, Inc. Introduction: The Basel Capital Accord, ready for implementation in force around 2006, sets out
Improving the Performance of Data Mining Models with Data Preparation Using SAS Enterprise Miner Ricardo Galante, SAS Institute Brasil, São Paulo, SP
 Improving the Performance of Data Mining Models with Data Preparation Using SAS Enterprise Miner Ricardo Galante, SAS Institute Brasil, São Paulo, SP ABSTRACT In data mining modelling, data preparation
An Introduction to Modeling Longitudinal Data
 An Introduction to Modeling Longitudinal Data Session I: Basic Concepts and Looking at Data Robert Weiss Department of Biostatistics UCLA School of Public Health [email protected] August 2010 Robert Weiss
Numerical Issues in Statistical Computing for the Social Scientist
 Numerical Issues in Statistical Computing for the Social Scientist Micah Altman Jeff Gill Michael McDonald A Wiley-Interscience Publication JOHN WILEY & SONS, INC. New York / Chichester / Weinheim / Brisbane
Survey, Statistics and Psychometrics Core Research Facility University of Nebraska-Lincoln. Log-Rank Test for More Than Two Groups
 Survey, Statistics and Psychometrics Core Research Facility University of Nebraska-Lincoln Log-Rank Test for More Than Two Groups Prepared by Harlan Sayles (SRAM) Revised by Julia Soulakova (Statistics)
Logistic regression (with R)
") Logistic regression (with R) Christopher Manning 4 November 2007 1 Theory We can transform the output of a linear regression to be suitable for probabilities by using a logit link function on the lhs as
Logistic regression (with R) Christopher Manning 4 November 2007 1 Theory We can transform the output of a linear regression to be suitable for probabilities by using a logit link function on the lhs as
MORTGAGE LENDER PROTECTION UNDER INSURANCE ARRANGEMENTS Irina Genriha Latvian University, Tel. +371 26387099, e-mail: irina.genriha@inbox.
 MORTGAGE LENDER PROTECTION UNDER INSURANCE ARRANGEMENTS Irina Genriha Latvian University, Tel. +371 2638799, e-mail: [email protected] Since September 28, when the crisis deepened in the first place
Abbas S. Tavakoli, DrPH, MPH, ME 1 ; Nikki R. Wooten, PhD, LISW-CP 2,3, Jordan Brittingham, MSPH 4
 1 Paper 1680-2016 Using GENMOD to Analyze Correlated Data on Military System Beneficiaries Receiving Inpatient Behavioral Care in South Carolina Care Systems Abbas S. Tavakoli, DrPH, MPH, ME 1 ; Nikki
Multivariate Normal Distribution
 Multivariate Normal Distribution Lecture 4 July 21, 2011 Advanced Multivariate Statistical Methods ICPSR Summer Session #2 Lecture #4-7/21/2011 Slide 1 of 41 Last Time Matrices and vectors Eigenvalues
Virtual Site Event. Predictive Analytics: What Managers Need to Know. Presented by: Paul Arnest, MS, MBA, PMP February 11, 2015
 Virtual Site Event Predictive Analytics: What Managers Need to Know Presented by: Paul Arnest, MS, MBA, PMP February 11, 2015 1 Ground Rules Virtual Site Ground Rules PMI Code of Conduct applies for this
MORE ON LOGISTIC REGRESSION
 DEPARTMENT OF POLITICAL SCIENCE AND INTERNATIONAL RELATIONS Posc/Uapp 816 MORE ON LOGISTIC REGRESSION I. AGENDA: A. Logistic regression 1. Multiple independent variables 2. Example: The Bell Curve 3. Evaluation
Role of Customer Response Models in Customer Solicitation Center s Direct Marketing Campaign
 Role of Customer Response Models in Customer Solicitation Center s Direct Marketing Campaign Arun K Mandapaka, Amit Singh Kushwah, Dr.Goutam Chakraborty Oklahoma State University, OK, USA ABSTRACT Direct
ANALYSING LIKERT SCALE/TYPE DATA, ORDINAL LOGISTIC REGRESSION EXAMPLE IN R.
 ANALYSING LIKERT SCALE/TYPE DATA, ORDINAL LOGISTIC REGRESSION EXAMPLE IN R. 1. Motivation. Likert items are used to measure respondents attitudes to a particular question or statement. One must recall
Family economics data: total family income, expenditures, debt status for 50 families in two cohorts (A and B), annual records from 1990 1995.
, annual records from 1990 1995.") Lecture 18 1. Random intercepts and slopes 2. Notation for mixed effects models 3. Comparing nested models 4. Multilevel/Hierarchical models 5. SAS versions of R models in Gelman and Hill, chapter 12 1
Lecture 18 1. Random intercepts and slopes 2. Notation for mixed effects models 3. Comparing nested models 4. Multilevel/Hierarchical models 5. SAS versions of R models in Gelman and Hill, chapter 12 1
Analysing Questionnaires using Minitab (for SPSS queries contact -) [email protected]
 Graham.Currell@uwe.ac.uk") Analysing Questionnaires using Minitab (for SPSS queries contact -) [email protected] Structure As a starting point it is useful to consider a basic questionnaire as containing three main sections:
Analysing Questionnaires using Minitab (for SPSS queries contact -) [email protected] Structure As a starting point it is useful to consider a basic questionnaire as containing three main sections:
GLM I An Introduction to Generalized Linear Models
 GLM I An Introduction to Generalized Linear Models CAS Ratemaking and Product Management Seminar March 2009 Presented by: Tanya D. Havlicek, Actuarial Assistant 0 ANTITRUST Notice The Casualty Actuarial
Multinomial and Ordinal Logistic Regression
 Multinomial and Ordinal Logistic Regression ME104: Linear Regression Analysis Kenneth Benoit August 22, 2012 Regression with categorical dependent variables When the dependent variable is categorical,
Control Charts - SigmaXL Version 6.1
 Control Charts - SigmaXL Version 6.1 Control Charts: Overview Summary Report on Test for Special Causes Individuals & Moving Range Charts Use Historical Groups to Display Before VS After Improvement X-Bar
Linda K. Muthén Bengt Muthén. Copyright 2008 Muthén & Muthén www.statmodel.com. Table Of Contents
 Mplus Short Courses Topic 2 Regression Analysis, Eploratory Factor Analysis, Confirmatory Factor Analysis, And Structural Equation Modeling For Categorical, Censored, And Count Outcomes Linda K. Muthén