INTRODUCTION TO HANA & TABLEAU
|
|
|
- Bernice Wells
- 10 years ago
- Views:
Transcription
1 INTRODUCTION TO HANA & TABLEAU UKAT Institutional Research & Advanced Analytics

2 AGENDA Introductions What is HANA? What s in HANA? The HANA Codebook What is Tableau? What can I do with Tableau? Tableau Desktop vs. Tableau Server How to Get Access Tableau Software Resources and Support Demo

3 WHAT S IN HANA? Student Data t en m l l ro En Courses Majors and Minors Demog raphic s Degrees Scores The Study Graduation and Retention Credit Hours Attempted/Earned Grades

4 WHAT S IN HANA? Student Data There are currently so many tables t Majors and Minors n e m l l o nr Demog Courses Degrees E raphic and fields in HANA we screated Scorea s guide, we call the Code Book, that The S tudy Grades Graof duathe tion data in UK HANA. lists all and Retention Credit Hours Attempted/Earned

5 THE HANA CODE BOOK The Code Book is a reference guide that helps users to know what type of data is currently accessible in HANA. It includes model names, field definitions, and example data. It is located in the Student Reports project folder on Tableau Server.

6

7 AGENDA Introductions What is HANA? What s in HANA? The HANA Codebook What is Tableau? What can I do with Tableau? Tableau Desktop vs. Tableau Server How to Get Access Tableau Software Resources and Support Demo

8 WHAT IS TABLEAU? Tableau is a business intelligence and analytics tool that helps users see and understand their data. It is easy to use and allows for fast analytics. Tableau is not a Business Warehouse (BW) or Business Objects, and is way cooler than Excel. It is a powerful tool that does more than report rows and columns of data. Tableau is not a data editor. Tableau only shows what exists in SAP. Note: Advanced Analytics can not change data that is incorrect. [email protected] to report data that is incorrect.

9 WHY TABLEAU? Interactive data visualizations can greatly reduce the need for endless variations of reports (e.g. a report for each department). Sophisticated Tableau reports can be designed by existing staff who know the data well and understand executive reporting needs but who are not IT experts. Tableau is beautiful. Not only are the visualizations elegant, but it is easy to place Tableau created workbooks on Tableau server to share with your college or department. Tableau is FUN!

10 WHY SHOULD I USE TABLEAU? There are many reasons why one should use Tableau. A few are: It is very easy to use. You don t need to know programming of any sort. All you need is some data and Tableau to create visually enchanting reports which communicate a story that you need to tell your audience. With Tableau s drag and drop feature, you can easily create visual stories or reports using just your mouse and a little imagination. People with little or no training can see and understand data faster than ever in ways like never before.

11 How does UK & Advanced Analytics use Tableau? Tableau Desktop The main Tableau application installed on your local machine. Workbooks must be initially created using Tableau Desktop. Licenses must be purchased individually. To purchase Tableau Desktop, please contact Tom Byrum with Tableau Software for educational pricing Tableau Server An online tool for accessing and sharing published workbooks. Workbooks on Tableau Server can be customized. University-wide license ( for access). The following slides show examples of Tableau in use at UK.

12 Web Based Interactive Pages
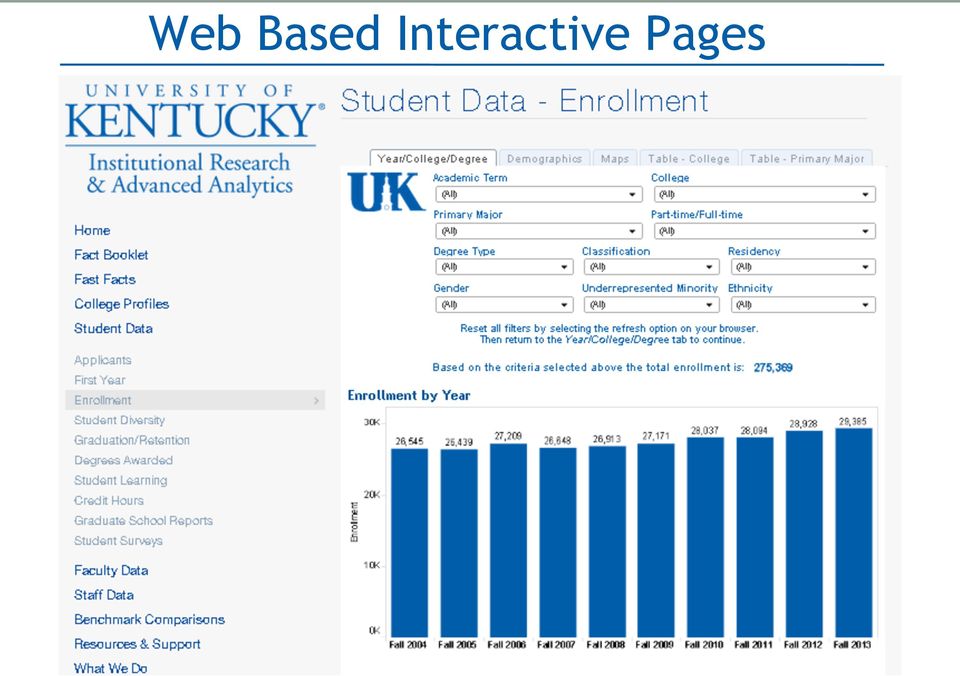
13 Web Based Interactive Pages

14 Web Based Interactive Pages

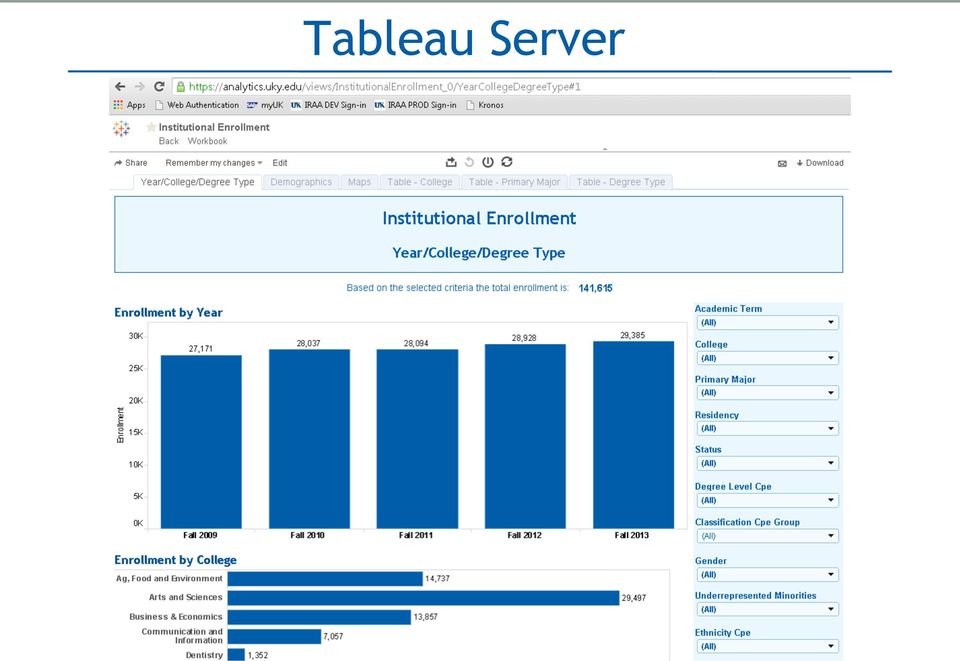
15 Tableau Server
16 DESKTOP VS. SERVER What s the difference?

17 Tableau Desktop A data visualization application that allows one to consume, build and publish virtually any type of structured data and produce highly interactive, graphs, dashboards, and reports in just minutes. We envision that each college/business area would purchase at least one Tableau Desktop license. The power user can then develop and publish reports customized to the needs of the college/organization.

18 Tableau Server A browser-based tool very similar to Tableau Desktop. The main limitation is you can not create a new workbook from a data source. NO license fee required as with Tableau Desktop. Tableau Server is a repository for Tableau workbooks created using Tableau Desktop. Tableau Server users can interact with, edit, and save changes made to the workbooks the college/organization power user published to Tableau Server. No expertise required to interact with the workbooks on Tableau Server.

19 AGENDA Introductions What is HANA? What s in HANA? The HANA Codebook What is Tableau? What can I do with Tableau? Tableau Desktop vs. Tableau Server How to Get Access Tableau Software Resources and Support Demo

20 HANA? Tableau Desktop? Tableau Server? How do I get started?

21 IRAA Resources & Support Webpage
22 Steps To Get Started How to Install HANA Client (pdf) In order to connect Tableau Desktop to data in HANA you will need to follow the steps in this document to connect to the HANA databases. The most up-to-date version of this document can be found on the Resources and Support page. Need assistance? Please complete the Advanced Analytics Contact Us form. Much, much more. Introduction to HANA and Tableau - This presentation document. Tableau A beginners guide to building a basic workbook using the Enrollment CPE model in HANA.
23 Tableau Software Training & Resources Quick Start Guides Get Started with Tableau Desktop - English Deutsch Español Français... Get Started with Tableau Server - English Deutsch Español Français... Training videos Free online training is internet-based recorded sessions that are available whenever you are. Learn online at your own pace. Introductory: Step-by-step instruction on connecting to data, creating views and more. Advanced: Over 30 videos covering topics like efficiency, calculations, statistics, mapping and more. Server: These videos cover everything from using to administering your Tableau Server. Chart Type: Learn how to build special charts - anything from funnel charts to Bollinger Bands. Tableau Community Join the Tableau Community Forums to find solutions for what you need to accomplish. Ask questions to receive help and feedback. Tableau Visual Gallery Get inspired by the many interactive visualizations in the Visual Gallery. Download the workbooks to play with on Tableau Desktop.

24 Questions?
Tableau Tutorial. User Documentation. Archit Sood, Neha Sinha, Shashank Dewjee, and Wei Zhao
 Tableau Tutorial User Documentation Archit Sood, Neha Sinha, Shashank Dewjee, and Wei Zhao Table of Contents Introduction... 2 Tableau desktop (Business analytics anyone can use)... 2 Tableau server...
Tableau's data visualization software is provided through the Tableau for Teaching program.
 A BEGINNER S GUIDE TO VISUALIZATION Featuring REU Site Collaborative Data Visualization Applications June 10, 2014 Vetria L. Byrd, PhD Advanced Visualization, Director REU Coordinator Visualization Scientist
How SAP Business Intelligence Solutions provide real-time insight into your organization
 How SAP Business Intelligence Solutions provide real-time insight into your organization 28 Oct 2015 Agenda 1) What is Business Intelligence (BI) 2) SAP BusinessObjects Features Overview 3) Demo & Report
<no narration for this slide>
 1 2 The standard narration text is : After completing this lesson, you will be able to: < > SAP Visual Intelligence is our latest innovation
and BI Services Overview CONTACT W: www.qualia.hr E: [email protected] M: +385 (91) 2010 075 A: Lastovska 23, 10000 Zagreb, Croatia
 2010 075 A: Lastovska 23, 10000 Zagreb, Croatia") and BI Services Overview CONTACT W: www.qualia.hr E: [email protected] M: +385 (91) 2010 075 A: Lastovska 23, 10000 Zagreb, Croatia Reports *web business intelligence software Easy to use, easy to deploy.
and BI Services Overview CONTACT W: www.qualia.hr E: [email protected] M: +385 (91) 2010 075 A: Lastovska 23, 10000 Zagreb, Croatia Reports *web business intelligence software Easy to use, easy to deploy.
Data Mining, Predictive Analytics with Microsoft Analysis Services and Excel PowerPivot
 www.etidaho.com (208) 327-0768 Data Mining, Predictive Analytics with Microsoft Analysis Services and Excel PowerPivot 3 Days About this Course This course is designed for the end users and analysts that
The DIY Guide to Dazzling Data. It s never been easier to delight colleagues, dazzle bosses, and boost your value in the workplace.
 50% The DIY Guide to Dazzling Data It s never been easier to delight colleagues, dazzle bosses, and boost your value in the workplace. 10k 50k 30.5k Introduction Data is the lifeblood of today s corporate
Session 3119 Mobilizing Your Dashboards Best Tips for the Mobile Market. Scott Leaver, SAP and Matt Lloyd, SAP
 Session 3119 Mobilizing Your Dashboards Best Tips for the Mobile Market Scott Leaver, SAP and Matt Lloyd, SAP Legal Disclaimer The information in this presentation is confidential and proprietary to SAP
A Look at Self Service BI with SAP Lumira Natasha Kishinevsky Dunn Solutions Group SESSION CODE: 1405
 A Look at Self Service BI with SAP Lumira Natasha Kishinevsky Dunn Solutions Group SESSION CODE: 1405 LEARNING POINTS How a business user analyzes data with Lumira Introduction to the SAP BI Lumira Connector
VISUALIZATION & DISCOVERY WITH SAP LUMIRA AT SAMSONITE EUROPE
 VISUALIZATION & DISCOVERY WITH SAP LUMIRA AT SAMSONITE EUROPE Public Benoit Regnier Senior Manager BI Intensum Olivier Bonneau du Martray Manager BI Intensum March 13, 2014 1 Samsonite Introduction 2 Samsonite,
Session 15 OF, Unpacking the Actuary's Technical Toolkit. Moderator: Albert Jeffrey Moore, ASA, MAAA
 Session 15 OF, Unpacking the Actuary's Technical Toolkit Moderator: Albert Jeffrey Moore, ASA, MAAA Presenters: Melissa Boudreau, FCAS Albert Jeffrey Moore, ASA, MAAA Christopher Kenneth Peek Yonasan Schwartz,
Data Doesn t Communicate Itself Using Visualization to Tell Better Stories
 SAP Brief Analytics SAP Lumira Objectives Data Doesn t Communicate Itself Using Visualization to Tell Better Stories Tap into your data big and small Tap into your data big and small In today s fast-paced
Ernesto Ongaro BI Consultant February 19, 2013. The 5 Levels of Embedded BI
 Ernesto Ongaro BI Consultant February 19, 2013 The 5 Levels of Embedded BI Saleforce.com CRM 2013 Jaspersoft Corporation. 2 Blogger 2013 Jaspersoft Corporation. 3 Linked In 2013 Jaspersoft Corporation.
Course Descriptions for Focused Learning Classes
 Course Descriptions for Focused Learning Classes Excel Word PowerPoint Access Outlook Adobe Visio Publisher FrontPage Dreamweaver EXCEL Classes Excel Pivot Tables 2 hours Understanding Pivot Tables Examining
Microsoft Dynamics NAV Reporting Options. Derek Lamb May 2010
 Microsoft Dynamics NAV Reporting Options Derek Lamb May 2010 Agenda Positioning of Products Why Business Intelligence? Intergen Offerings Reporting Services Power Pivot ZAP SharePoint 2010 Questions Choosing
Create Mobile, Compelling Dashboards with Trusted Business Warehouse Data
 SAP Brief SAP BusinessObjects Business Intelligence s SAP BusinessObjects Design Studio Objectives Create Mobile, Compelling Dashboards with Trusted Business Warehouse Data Increase the value of data with
QAD Business Intelligence Dashboards Demonstration Guide. May 2015 BI 3.11
 QAD Business Intelligence Dashboards Demonstration Guide May 2015 BI 3.11 Overview This demonstration focuses on one aspect of QAD Business Intelligence Business Intelligence Dashboards and shows how this
SAP Lumira Cloud: True Self-Service BI Without The Server
 September 9 11, 2013 Anaheim, California SAP Lumira Cloud: True Self-Service BI Without The Server Ashish Morzaria, SAP Christina Obry, SAP Learning Points How to enable self-service BI using Lumira on
Consuming Real Time Analytics and KPI powered by leveraging SAP Lumira and SAP Smart Business in Fiori SESSION CODE: 0611 Draft!!!
 Consuming Real Time Analytics and KPI powered by leveraging SAP Lumira and SAP Smart Business in Fiori SESSION CODE: 0611 Draft!!! Michael Sung SAP Consuming Real Time Analytics and KPI powered by leveraging
Agility for your Business with BW Workspaces for SAP BI Introduction, Motivation and benefits for IT and Business
 Agility for your Business with BW Workspaces for SAP BI Introduction, Motivation and benefits for IT and Business Mohamed Abdel Hadi Senior SAP BI Presales Architect SAP Press BI Author W E L C O M E Agenda
Session 805 -End-to-End SAP Lumira: Desktop to On-Premise, Cloud, and Mobile
 September 9 11, 2013 Anaheim, California Session 805 -End-to-End SAP Lumira: Desktop to On-Premise, Cloud, and Mobile Ashish C. Morzaria, SAP Disclaimer This presentation outlines our general product direction
penelope athena software TABLEAU ONLINE DASHBOARD INFORMATION PACKAGE case management software
 penelope case management software TABLEAU ONLINE DASHBOARD INFORMATION PACKAGE athena software It's kind of like a living organism. It helps us think fast, it helps us be more responsive, it helps us in
Release Document Version: 1.4-2013-05-30. User Guide: SAP BusinessObjects Analysis, edition for Microsoft Office
 Release Document Version: 1.4-2013-05-30 User Guide: SAP BusinessObjects Analysis, edition for Microsoft Office Table of Contents 1 About this guide....6 1.1 Who should read this guide?....6 1.2 User profiles....6
uncommon thinking ORACLE BUSINESS INTELLIGENCE ENTERPRISE EDITION ONSITE TRAINING OUTLINES
 OBIEE 11G: CREATE ANALYSIS AND DASHBOARDS: 11.1.1.7 DURATION: 4 DAYS Course Description: This course provides step-by-step instructions for creating analyses and dashboards, which compose business intelligence
Trial version of GADD Dashboards Builder
 Trial version of GADD Dashboards Builder Published 2014-02 gaddsoftware.com Table of content 1. Introduction... 3 2. Getting started... 3 2.1. Start the GADD Dashboard Builder... 3 2.2. Example 1... 3
Course: SharePoint 2013 Business Intelligence
 Course: SharePoint 2013 Business Intelligence Course Length: 3 days Course Code: M55042 Description This three-day instructor-led course provides students with the necessary knowledge to work with all
Creating a Project Management Tool for Institutional Research
 Creating a Project Management Tool for Institutional Research Presented by: Christina B. Butler Tufts University 40 th NEAIR Annual Conference, Newport, RI November, 2013 Presentation Overview Background
Creating a universe on Hive with Hortonworks HDP 2.0
 Creating a universe on Hive with Hortonworks HDP 2.0 Learn how to create an SAP BusinessObjects Universe on top of Apache Hive 2 using the Hortonworks HDP 2.0 distribution Author(s): Company: Ajay Singh
DATA VISUALIZATION: When Data Speaks Business PRODUCT ANALYSIS REPORT IBM COGNOS BUSINESS INTELLIGENCE. Technology Evaluation Centers
 PRODUCT ANALYSIS REPORT IBM COGNOS BUSINESS INTELLIGENCE DATA VISUALIZATION: When Data Speaks Business Jorge García, TEC Senior BI and Data Management Analyst Technology Evaluation Centers Contents About
(55042A) SharePoint 2013 Business Intelligence
 SharePoint 2013 Business Intelligence") (55042A) SharePoint 2013 Business Intelligence OBJECTIVE This three-day instructor-led course provides students with the necessary knowledge to work with all the associated SharePoint business intelligence
(55042A) SharePoint 2013 Business Intelligence OBJECTIVE This three-day instructor-led course provides students with the necessary knowledge to work with all the associated SharePoint business intelligence
Learn About Analysis, Interactive Reports, and Dashboards
 Learn About Analysis, Interactive Reports, and Dashboards This document supports Pentaho Business Analytics Suite 5.0 GA and Pentaho Data Integration 5.0 GA, documentation revision February 3, 2014, copyright
Empowering Teams and Departments with Agile Visualizations
 SAP Brief SAP Lumira, Edge Edition Objectives Empowering Teams and Departments with Agile Visualizations A data visualization solution for teams and departments A data visualization solution for teams
300 Intelligence Reporting. Sage 300 2016 Intelligence Reporting Customer Frequently asked questions
 300 Intelligence Reporting Sage 300 2016 Intelligence Reporting Customer Table of contents 1. Overview of Sage Intelligence Reporting 3 2. Comparisons of Sage Intelligence Reporting and Sage Enterprise
OpenText Information Hub (ihub) 3.1 and 3.1.1
 3.1 and 3.1.1") OpenText Information Hub (ihub) 3.1 and 3.1.1 OpenText Information Hub (ihub) 3.1.1 meets the growing demand for analytics-powered applications that deliver data and empower employees and customers to
OpenText Information Hub (ihub) 3.1 and 3.1.1 OpenText Information Hub (ihub) 3.1.1 meets the growing demand for analytics-powered applications that deliver data and empower employees and customers to
TOP New Features of Oracle Business Intelligence 11g
 10 TOP New Features of Oracle Business Intelligence 11g TABLE OF CONTENTS Feature 1 New Chart Choices Funnel Chart 2 Trellis Chart 3 Waterfall 4 Tile Diagram 5 Feature 2 Recommended Visualization 6 Feature
INTEROPERABILITY OF SAP BUSINESS OBJECTS 4.0 WITH GREENPLUM DATABASE - AN INTEGRATION GUIDE FOR WINDOWS USERS (64 BIT)
") White Paper INTEROPERABILITY OF SAP BUSINESS OBJECTS 4.0 WITH - AN INTEGRATION GUIDE FOR WINDOWS USERS (64 BIT) Abstract This paper presents interoperability of SAP Business Objects 4.0 with Greenplum.
White Paper INTEROPERABILITY OF SAP BUSINESS OBJECTS 4.0 WITH - AN INTEGRATION GUIDE FOR WINDOWS USERS (64 BIT) Abstract This paper presents interoperability of SAP Business Objects 4.0 with Greenplum.
Tableau Server. Permissions, Roles, and Content Authorization
 Tableau Server Permissions, Roles, and Content Authorization This document covers aspects of Tableau Server authorization. 1. Permissions and authorization in the abstract 2. Real-world examples 3. Best-practices
SharePoint 2013 Business Intelligence Course 55042; 3 Days
 Lincoln Land Community College Capital City Training Center 130 West Mason Springfield, IL 62702 217-782-7436 www.llcc.edu/cctc SharePoint 2013 Business Intelligence Course 55042; 3 Days Course Description
Course MS55003A Microsoft SharePoint 2010 Business Intelligence Services
 3 Riverchase Office Plaza Hoover, Alabama 35244 Phone: 205.989.4944 Fax: 855.317.2187 E-Mail: [email protected] Web: www.discoveritt.com Course MS55003A Microsoft SharePoint 2010 Business Intelligence
WHITE PAPER. Creating your Intranet Checklist
 WHITE PAPER Creating your Intranet Checklist About this guide It can be overwhelming to run and manage an Intranet project. As a provider of Intranet software and services to small, medium and large organizations,
Take control of your communications, to achieve productivity through intelligence and insight.
 Take control of your communications, to achieve productivity through intelligence and insight. icall suite Productivity through intelligence icall suite call management software icall suite provides complete
Welcome to the new SAP Predictive Analytics 2.0!
 Welcome to the new SAP Predictive Analytics 2.0! SAP quietly released the new generation of their user-facing predictive analytics offering in February 2015. This represents the first time their 2 separate
BI & ANALYTICS FOR NAV & AX
 BI & ANALYTICS FOR NAV & AX To survive in the modern business jungle, you need courage to act - especially if you want to reach the top of the corporate food chain. That kind of courage comes from identifying
Data Visualization & Dashboards. Toronto, ON February 27, 2014
 Data Visualization & Dashboards Toronto, ON February 27, 2014 Agenda 2:30 pm Welcome & Introductions Karen Ragotte, Marketing Director, Unilytics 2:35 pm KPIs and Dashboards Peder Enhorning, President
Aravind Gottapu Jerry Timko Embracing Lumira Session #3566
 Aravind Gottapu Jerry Timko Embracing Lumira Session #3566 AGENDA Choosing Lumira @ Cardinal Health What went wrong Data Discovery vs Traditional BI Why is this the right time to have strong business case
SA S P A BO B BJ B 4. 4 1. COURSE CONTENT 2015
 SAP BOBJ 4.1 COURSE CONTENT 2015 SAP Business Objects 4.1 Course Content SAP BI Launch Pad 4.1 SAP Business Objects Web Intelligence Web-Intelligence Rich Client (Desktop based tool) SAP Business Objects
The focus of this course is on the SharePoint 2013 business intelligence platform and not on the SQL business intelligence services.
 Course Page - Page 1 of 11 SharePoint 2013 Business Intelligence M-55042 Length: 3 days Price: $1,795.00 Course Description This three-day instructor-led course provides students with the necessary knowledge
SAS Add-In 2.1 for Microsoft Office: Getting Started with Data Analysis
 SAS Add-In 2.1 for Microsoft Office: Getting Started with Data Analysis The correct bibliographic citation for this manual is as follows: SAS Institute Inc. 2007. SAS Add-In 2.1 for Microsoft Office: Getting
Understanding the SAP BI Strategy
 Understanding the SAP BI Strategy Blair Wheadon, GM of Enterprise BI September 2014 Use this title slide only with an image Legal disclaimer The information in this presentation is confidential and proprietary
What s new in Tableau 10?
 What s new in Tableau 10? Talking points with customers: Beautiful by design: A fresh look and feel, beautiful viz defaults, and new formatting control all add up to vizzes with impact. Delightfully mobile:
SAP BusinessObjects BI Clients
 SAP BusinessObjects BI Clients April 2015 Customer Use this title slide only with an image BI Use Cases High Level View Agility Data Discovery Analyze and visualize data from multiple sources Data analysis
Business Intelligence with Maximizer CRM 10:
 Technical White Paper Business Intelligence with Maximizer CRM 10: Actionable Insight through Dashboards, Reports, and Analytics Contents Introduction...3 Maximizer CRM Dashboards...4 Reporting... 7 Crystal
Trends, Strategy, Roadmaps and Product Direction for SAP BI tools in SAP HANA environment
 September 9 11, 2013 Anaheim, California Trends, Strategy, Roadmaps and Product Direction for SAP BI tools in SAP HANA environment Surya K Dutta [email protected] Analytics New possibilities In-Memory
MATLAB as a Collaboration Platform Marta Wilczkowiak Senior Applications Engineer MathWorks
 MATLAB as a Collaboration Platform Marta Wilczkowiak Senior Applications Engineer MathWorks 2014 The MathWorks, Inc. 1 Agenda Use other people s code, apps and toolboxes Share your code with others Collaborate
Web Analytics with Google Analytics (GA) TRAINING MANUAL FOR WEB EDITORS
 TRAINING MANUAL FOR WEB EDITORS") Web Analytics with Google Analytics (GA) TRAINING MANUAL FOR WEB EDITORS LSA WEB SERVICES Google Analytics Training Manual LSA Web Services Haven Hall, Suite 6051 505 South State Street Ann Arbor, MI 48109-1045
Web Analytics with Google Analytics (GA) TRAINING MANUAL FOR WEB EDITORS LSA WEB SERVICES Google Analytics Training Manual LSA Web Services Haven Hall, Suite 6051 505 South State Street Ann Arbor, MI 48109-1045
Visualizing Clinical Trial Data Matt Becker, SAS Institute
 Visualizing Clinical Trial Data Matt Becker, SAS Institute ABSTRACT Today, all employees at health and life science corporations may need access to view operational data. There may be visualization needs
Creating Dashboards for Microsoft Project Server 2010
 Creating Dashboards for Microsoft Project Server 2010 Authors: Blaise Novakovic, Jean-Francois LeSaux, Steven Haden, Microsoft Consulting Services Information in the document, including URL and other Internet
Data warehousing/dimensional modeling/ SAP BW 7.3 Concepts
 Data warehousing/dimensional modeling/ SAP BW 7.3 Concepts 1. OLTP vs. OLAP 2. Types of OLAP 3. Multi Dimensional Modeling Of SAP BW 7.3 4. SAP BW 7.3 Cubes, DSO's,Multi Providers, Infosets 5. Business
QAD BUSINESS INTELLIGENCE
 QAD BUSINESS INTELLIGENCE QAD BUSINESS INTELLIGENCE QAD Business Intelligence unifies data from multiple sources across the enterprise, providing a comprehensive solution that enables key enterprise decision
SAP BusinessObjects Business Intelligence 4.1 One Strategy for Enterprise BI. May 2013
 SAP BusinessObjects Business Intelligence 4.1 One Strategy for Enterprise BI May 2013 SAP s Strategic Focus on Business Intelligence Core Self-service Mobile Extreme Social Core for innovation Complete
Creating an Enterprise Reporting Bus with SAP BusinessObjects
 September 10-13, 2012 Orlando, Florida Creating an Enterprise Reporting Bus with SAP BusinessObjects Kevin McManus LaunchWorks Session : 0313 Learning Points By consolidating people, process, data and
MOC 55072 Visualizing Data with SharePoint 2013, Report Builder, PowerPivot & PowerView with NO CODE
 To register or for more information call our office (208) 898-9036 or email [email protected] MOC 55072 Visualizing Data with SharePoint 2013, Report Builder, PowerPivot & PowerView with NO
How to Use Boards for Competitive Intelligence
 How to Use Boards for Competitive Intelligence Boards are highly customized, interactive dashboards that ubervu via Hootsuite users can personalize to fit a specific task, job function or use case like
Predictive analytics for the business analyst: your first steps with SAP InfiniteInsight
 Predictive analytics for the business analyst: your first steps with SAP InfiniteInsight Pierpaolo Vezzosi, SAP SESSION CODE: 0605 Summary Who said you need a PhD to do sophisticated predictive analysis?
Tableau Online. Understanding Data Updates
 Tableau Online Understanding Data Updates Author: Francois Ajenstat July 2013 p2 Whether your data is in an on-premise database, a database, a data warehouse, a cloud application or an Excel file, you
Oracle BI 11g R1: Create Analyses and Dashboards
 Oracle University Contact Us: Local: 1800 103 4775 Intl: +91 80 67863102 Oracle BI 11g R1: Create Analyses and Dashboards Duration: 5 Days What you will learn This Oracle BI 11g R1: Create Analyses and
Sales Performance Management Using Salesforce.com and Tableau 8 Desktop Professional & Server
 Sales Performance Management Using Salesforce.com and Tableau 8 Desktop Professional & Server Author: Phil Gilles Sales Operations Analyst, Tableau Software March 2013 p2 Executive Summary Managing sales
SAP Business One and SAP HANA
 SAP Business One and SAP HANA High Performance Analytic Appliance Supernova Forum May, 2014 Hana Adoption Continued innovation Key message HANA innovations adds more value for you the customer Key elements
SharePoint 2013 Business Intelligence
 Course 55042A: SharePoint 2013 Business Intelligence Course Details Course Outline Module 1: Course Overview This module explains how the class will be structured and introduces course materials and additional
FROM DATA TO DASHBOARD: IT TAKES
 1 FROM DATA TO DASHBOARD: IT TAKES MORE THAN GRAPHS Meihua Zhai Director, Office of Institutional Research, University of Georgia Shweta Doshi Business Intelligence Application Analyst, University of Georgia
Collaboration. Michael McCabe Information Architect [email protected]. black and white solutions for a grey world
 Collaboration Michael McCabe Information Architect [email protected] black and white solutions for a grey world Slide Deck & Webcast Recording links Questions and Answers We will answer questions at
Create an anonymous public survey for SharePoint in Office 365 - Ted Green, SharePoint Architect
 Create an anonymous public survey for SharePoint in Office 365 - Ted Green, SharePoint Architect Te One of the most asked for features I ve heard from companies over the years is a request to have a way
SAP Predictive Analysis: Strategy, Value Proposition
 September 10-13, 2012 Orlando, Florida SAP Predictive Analysis: Strategy, Value Proposition Charles Gadalla, Solution Management, SAP Business Intelligence Manavendra Misra, Chief Knowledge Officer, Cognilytics
MicroStrategy Desktop
 MicroStrategy Desktop Quick Start Guide MicroStrategy Desktop is designed to enable business professionals like you to explore data, simply and without needing direct support from IT. 1 Import data from
Toronto 26 th SAP BI. Leap Forward with SAP
 Toronto 26 th SAP BI Leap Forward with SAP Business Intelligence SAP BI 4.0 and SAP BW Operational BI with SAP ERP SAP HANA and BI Operational vs Decision making reporting Verify the evolution of the KPIs,
SAP BO 4.1 Online Training
 WWW.ARANICONSULTING.COM SAP BO 4.1 Online Training Arani consulting 2014 A R A N I C O N S U L T I N G, H Y D E R A B A D, I N D I A SAP BO 4.1 Training Topics In this training, attendees will learn: Data
Tableau Visual Intelligence Platform Rapid Fire Analytics for Everyone Everywhere
 Tableau Visual Intelligence Platform Rapid Fire Analytics for Everyone Everywhere Agenda 1. Introductions & Objectives 2. Tableau Overview 3. Tableau Products 4. Tableau Architecture 5. Why Tableau? 6.
SAP BUSINESS OBJECTS BO BI 4.1 amron
 0 Training Details Course Duration: 65 hours Training + Assignments + Actual Project Based Case Studies Training Materials: All attendees will receive, Assignment after each module, Video recording of
Microsoft 55042 - SharePoint 2013 Business Intelligence
 1800 ULEARN (853 276) www.ddls.com.au Microsoft 55042 - SharePoint 2013 Business Intelligence Length 3 days Price $2629.00 (inc GST) Version A Overview This three-day instructor-led course provides students
Visual Scoring the 360 View: 5 Steps for Getting Started with Easier, Faster and More Effective Lead Scoring
 Visual Scoring the 360 View: 5 Steps for Getting Started with Easier, Faster and More Effective Lead Scoring Authors: Elissa Fink Wade Tibke Tableau Software p2 Lead Scoring For Most a Great Idea in Concept,
TABLEAU COURSE CONTENT. Presented By 3S Business Corporation Inc www.3sbc.com Call us at : 281-823-9222 Mail us at : [email protected]
 TABLEAU COURSE CONTENT Presented By 3S Business Corporation Inc www.3sbc.com Call us at : 281-823-9222 Mail us at : [email protected] Introduction and Overview Why Tableau? Why Visualization? Level Setting
Predictive Analytics Powered by SAP HANA. Cary Bourgeois Principal Solution Advisor Platform and Analytics
 Predictive Analytics Powered by SAP HANA Cary Bourgeois Principal Solution Advisor Platform and Analytics Agenda Introduction to Predictive Analytics Key capabilities of SAP HANA for in-memory predictive
Getting Started with Scratch
 Getting Started with Scratch a guide to designing introductory Scratch workshops draft version, september 2009 Overview There s no one way to host a Scratch workshop. Workshops can take on a variety of
Microsoft Courses. Microsoft Office 2007
 Microsoft Courses Course Overview With over 90% of UK businesses using Microsoft Office, it's the world's leading software package. Our Microsoft Office course will show you how to operate the three main
SharePoint 2013 PerformancePoint Services
 3 Riverchase Office Plaza Hoover, Alabama 35244 Phone: 205.989.4944 Fax: 855.317.2187 E-Mail: [email protected] Web: www.discoveritt.com Course 55057A: SharePoint 2013 PerformancePoint Services
Building Better Dashboards PART 1: BASIC DASHBOARDS
 Building Better Dashboards PART 1: BASIC DASHBOARDS For Questions or Feedback Alexandria Skrivanich or Michael Carpenter [email protected] [email protected] 1 CREATING & LABELING
SWIFT Data Warehouse Frequently Asked Questions & Glossary of Terms
 Page 1 of 30 SWIFT Data Warehouse Frequently Asked Questions & Glossary of Terms This FAQ is organized into the following categories of questions: Access and Security focus is on how users access the SWIFT
Data Is Integral To Our Culture
 Data Is Integral To Our Culture In the news On the streets Progress Update Recommendation #3 of ITSM Top 5 Service Recommendations from February 2013 Recommendation #3 summary Expand the Enterprise Data
Agil visualisering och dataanalys
 Agil visualisering och dataanalys True Business and IT collaboration in Analytics Niklas Packendorff @packendorff SAPSA Impuls 2014 Legal disclaimer The information in this presentation is confidential
Getting Started with Companyweb
 Getting Started with Companyweb By Robert Crane Computer Information Agency http://www.ciaops.com Index What is Companyweb? Page 2 What does this document contain? Page 3 How can I use Companyweb? Page
Dynamics CRM Tips and Tricks
 Dynamics CRM Tips and Tricks Steven Foster, CRM Product Manager [email protected] @FozzyNZ http://www.linkedin.com/in/stevefoster http://nakedcrm.com http://www.intergen.co.nz/blog #dynamicsday