Public School Transportation National and Regional Perspectives: An Update
|
|
|
- Diana Caldwell
- 10 years ago
- Views:
Transcription
1 Public School Transportation National and Regional Perspectives: An Update Presented to Education Subcommittee C Public School Finance January 2009 Amy Higginbotham Jared Pincin Dr. Tami Gurley-Calvez Dr. Tom Witt Bureau of Business and Economic Research College of Business and Economics West Virginia University

2 Table of Contents I. Current Transportation Funding Policies... 1 A. Basic Statistics... 1 B. Transportation Funding Options Used by States... 1 II. West Virginia s Public School Transportation Funding System... 4 A. Current statistics... 4 B. HB 4588 changes to transportation funding (step 4) Counties affected by changes III. Comparison with Neighboring States A. Kentucky Pupil Transportation Funding State Requirements Local Decision Making Reimbursement Rates B. Maryland Pupil Transportation Funding State Requirements Local Decision Making Reimbursement Rates C. Ohio Pupil Transportation Funding State Requirements Local Decision Making Reimbursement Rates D. Pennsylvania Pupil Transportation Funding State Requirements Local Decision Making Reimbursement Rates E. Virginia Pupil Transportation Funding... 21

3 1. State Requirements Local Decision Making Reimbursement Rates IV. Current Problems Facing West Virginia s School Transportation System A. Substitute School Bus Operator Shortages V. Alternative Policy Options for Addressing Density Adjustments A. Regression Analysis B. Continuous Density Adjustment C. Implementation of a Four Day School Week D. Other Policies to Limit Growth in Transportation Costs Efficiency Frontier or Bonuses for Efficiency Mass Transit/Privatization VI. Appendix A Additional State Transportation Policy Details A. West Virginia Policy Prior to HB State Requirements Local Decision Making Reimbursement Rates B. Kentucky C. Maryland D. Ohio E. Pennsylvania F. Virginia VII. Appendix B Sample of Regression Analysis... 34

4 List of Tables and Figures Figure 1: School Transportation Expenditure Comparison... 5 Figure2: West Virginia Students Transported by School Bus Statistics Table 1: Public School Support Program History of Funds Appropriated (Inflation Adjusted)... 4 Table 2: Public School Transportation Expenditures by County: School Year... 7 Table 3: West Virginia School Bus Operators as a Percentage of Total Service Personnel... 8 Table 4: School Transportation Expenditures: School Year Table 5: Percentage of Transportation Costs for Maintenance, Operation, and Related Costs Exclusive of All Salaries Funded Through Foundation Allowance Table 6: Pennsylvania School Transportation Payment Schedule Table 7: School Bus Operator Qualifications by State Table 8: Kentucky School Transportation Budget Table 9: Maryland School Transportation Budget Table 10: Maryland County by County Transportation Funding: School Year Table 11: Ohio School Transportation Budget Table 12: Pennsylvania School Transportation Budget... 31

5 I. Current Transportation Funding Policies Public funds are used to transport about 82 percent of students in West Virginia s public schools at an average cost per student of $ With one exception, total expenditures on transportation have increased in real terms every school year since Given recent increases in energy costs, there is an increasing need to examine how school transportation is funded including how differences in costs across school districts are addressed. This section provides an overview of basic transportation statistics and describes the main policy approaches used by each state. More detailed information is provided for West Virginia and neighboring states in the following sections. A. Basic Statistics The National Center for Education Statistics reports in the Digest of Education Statistics 2007 that as of the school year approximately 25.2 million (55.3 percent) of students in public schools were transported at public expense. In the same school year the state of West Virginia transported 225,759 students. Nationally, the percentage of public school students transported at the public expense has decreased slowly from its peak of 61.3 percent in , though it is still above the average of 44.8 percent of students in public schools being transported at public expense from The total expenditures for transportation by the fifty states in were over $17.4 billion. In the same school year the state of West Virginia spent $159 million. The average expenditure per student transported as of was $692. In the same school year the average expenditure per student in West Virginia transported was $ This difference of over $12 per student means that West Virginia spent $2.8 million (2 percent) more than if the state had the national average transportation cost per student. The School Transportation News reports that for the school year approximately 474,380 school buses were used in the transportation of school pupils. In the same school year West Virginia used approximately 3,650 buses. The national average was 53 students transported per bus while the number for West Virginia was 62. B. Transportation Funding Options Used by States There exists a variety of regulations across all fifty states concerning the transportation of school age pupils. These differences arise for an assortment of reasons including but not limited to diverse geographical, demographic, and economic constraints, varying philosophical positions about the role of state government in local school decisions, and the gradual metamorphosing of pupil transportation over time. Some states require all resident school pupils K-8 to be transported to and from school activities (Ohio), some states mandate school districts are only required to provide transportation for charter school students (Pennsylvania) 2, some states require school districts to provide transportation to students (public and private) with disabilities but not do not force the school districts to provide pupil transportation for public, private, and 1 Expenditures for transportation in constant dollars has increased every school year from to except for Pennsylvania does provide a transportation subsidy to school districts for the express purpose of transporting pupils K-12 in private, public, and charter schools. Also school districts do not have to provide transportation for charter school pupils carte blanche. See below for details. 1

6 charter schools (Virginia) 3, while other states employ various other pupil transportation methods. According to the School Transportation News, twenty eight states have Share the Ride programs that allow public schools to enter into contracts with non-public schools to transport pupils while some states allow school districts to discriminate against non-public schools by not requiring them to transport non-public pupils even if they opt to transport public school students. 4 Just as there are various ways states determine if or how school districts are required to provide pupil transportation, considerable differences exist in the approaches states employ to finance pupil transportation. The Joint Legislative Audit and Review Committee 5 of Washington state and the Educational Service District 6 of Washington state conducted surveys of the fifty states and identified six ways states allocated funds for pupil transportation. The six methods are summarized below as well as listing which states ascribe to each method. The first method states employ to allocate state funds for pupil transportation is no state funding for pupil transportation. Local school districts are responsible for providing public transportation services. Each state provides basic aid to for K-12 education which may be used for a variety of services but none of these states explicitly provides funds for pupil transportation. Currently there are five states that utilize this method: Massachusetts 7, Nevada, New Hampshire, Rhode Island, and Vermont. The second approach of allocating state funds for pupil transportation is pure block grant funding. Within this method are two separate policies. Some states give school districts block grants separate from their basic educational foundation grant while other states distribute transportation funds within the educational foundation grant. States in the former category include Arkansas, Indiana, Iowa, Kansas, Louisiana, Minnesota, and South Dakota while states in the latter category include Maryland and Michigan. In some cases the state disperses funding based on the school district s total enrollment or the number of pupils it transports, expressed as a proportion of the corresponding number statewide. These lump sum grants are intended to offset transportation costs incurred by school districts while providing the schools districts with options of how the money should be efficiently and equitably spent. The third approach of allocating state funds for pupil transportation is often summarized as the approved costs method. Under this method states provide reimbursement for specific cost items incurred by the transportation programs. The state provides a list of what expenditures are approved and often provides the percentage that each type of expenditure will be reimbursed. Often times the different demographic and geographic differences of each district are incorporated into the state s decision of what is an approved cost and what is not. States that do not adjust the approved costs allocation for wealth are California, Idaho, Illinois, Missouri, 3 Virginia Code The report can be found on the state website: 6 The report can be found at ing%20approaches%20for%20pupil%20transportation.pdf 7 While the state of Massachusetts does not provide funds for pupil transportation directly to local school districts, they do provide funding to regional districts to help subsidize regional transportation costs. 2

7 Oregon, West Virginia and Wyoming. States that do adjust the approved costs allocation for wealth are Connecticut and Tennessee. Within this method of funding pupil transportation are two general approaches. The first approach is for a state to reimburse all or a percentage of approved costs. The second approach is for a state to set a maximum expenditure cap for school districts to observe and limit reimbursement up to that cap. This cap is usually based on statewide average costs. The fourth approach of allocating state funds for pupil transportation is the per unit allocation funding. This method provides a fixed amount of funding for a specified (in advance) and measurable unit of service. States have differing ways of establishing the unit reimbursement rate with some states using the total number of pupils transported, the total miles driven, the number of trips per day, etc. Demographic and other site characteristics are accounted for in Alabama, Colorado, Hawaii, Montana, Nebraska, Pennsylvania, South Carolina, and Utah. The states of Alaska, Arizona, Delaware, Florida, Georgia, New Jersey, New York, Texas, Virginia, and Wisconsin do not adjust their unit allocation for demographic and other site characteristics. The fifth approach of allocating state funds for pupil transportation is the expected cost approach. States that follow this approach often employ standard multivariate statistical methodology (like multiple regression analysis) in order to establish a set of coefficients (or unit value) for pupil transportation activities and site characteristics (demographic and geographic differences). These coefficients are used to compute for each district the expected cost of transporting pupils under the given site characteristics in the district. The formulas used by each state are different but most of the formulas used are designed to promote certain behaviors that reduce transportation costs while increasing efficiency. States that employ this method are Kentucky, Maine, Mississippi, New Mexico, North Dakota, and Oklahoma. Ohio previously used this method. 8 The last approach of allocating state funds for pupil transportation is the efficiency approach. The method is currently used by only one state, North Carolina, and is considerably similar to the expected cost method. The state establishes a minimum expenditure level for each school district based on the number of pupils transported and the number of buses used, called an efficient frontier. This efficient frontier adjusts for site characteristics and each school district receives an allocation based on the distance from the efficient frontier along with a stateestablished buffer. The buffer is designed to capture conditions that are beyond the control of local school districts. 8 Ohio is currently using a different approach to pupil transportation. See details below. 3

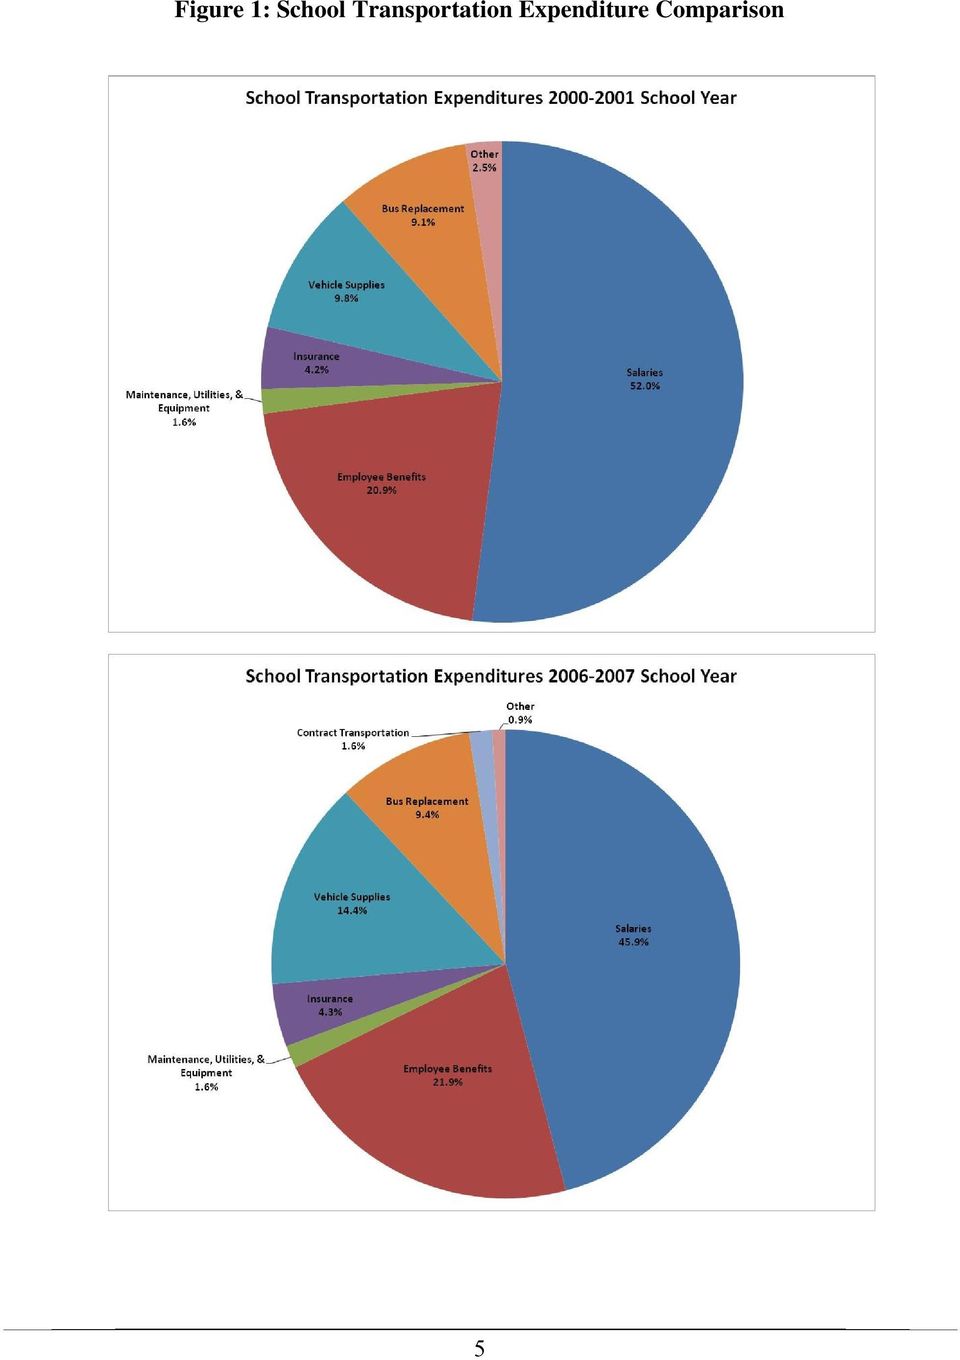
8 II. West Virginia s Public School Transportation Funding System A. Current statistics The West Virginia public school transportation system (exclusive of salaries and employee benefits) is funded through step 4 of the West Virginia Public School Support Program. All transportation personnel are funded through step 2 of the funding program. Total funds appropriated through this system since the school year have change dramatically. As shown in Table 1, after factoring in inflation, transportation support for public schools in the state hit a high of $51.8 million for the school year. Service personnel support, which includes allowances for school bus transportation personnel, has declined in real terms since the school year. Table 1: Public School Support Program History of Funds Appropriated (Inflation Adjusted) (Base Year = 2006) Professional Educators $812,363,032 $887,147,669 $825,347,837 $870,619,271 $825,727,243 $793,945,358 Service Personnel $287,516,583 $320,877,538 $282,084,207 $268,568,620 $271,454,477 $259,242,494 Fixed Charges $119,935,663 $129,983,511 $93,024,291 $100,932,052 $98,965,792 $98,367,745 Transportation Support $45,564,255 $48,041,791 $39,380,166 $40,211,334 $40,971,877 $51,792,029 Administrative costs $5,686,539 $6,210,008 $4,968,174 $4,212,468 $3,590,545 $3,088,910 Current Expense $71,488,476 $78,521,639 $133,861,320 $127,353,809 $136,153,319 $135,650,057 Improve Instr. Programs - $51,768,587 $46,207,112 $41,786,225 $37,563,900 $33,000,000 Total Basic Support $1,342,554,549 $1,522,550,743 $1,424,873,107 $1,453,683,778 $1,414,427,153 $1,375,086,593 Source: West Virginia Department of Education Office of School Finance The amount funded by the Public School Support Program only accounts for a part of the actual expenditures made for public school transportation. The total expenditures, like the amounts appropriated, have changed over time. In examining the school transportation expenditures from the school year to the school year (Figure 1), it is apparent that salaries have been the largest expenditure for West Virginia. Salary expenditures have, however, fallen from 52.0% of total transportation expenditures to 45.9% by the school year. The second highest expenditure has been employee benefits, which include payments made by the state for health care and retirement as well as worker s compensation. Vehicle supply expenditures increased over this time period to 14.4% of total transportation expenditures. Also contract transportation became an expenditure category in the school year accounting for $3,152,834. The most stable expenditures from the school year to the school year have been expenditures for the following: maintenance, utilities, and equipment; insurance; and bus replacement. 4

9 Figure 1: School Transportation Expenditure Comparison 5
10 West Virginia s total public school transportation expenditures for the school year were $199,733,456. This total expenditure was the combination of expenditures made in all fifty-five of the state s counties. Public school transportation expenditures in West Virginia counties, however, vary greatly. As shown in Table 2, in the school year transportation total expenditures were between $831,984 in Gilmer County to $13,425,026 in Kanawha County. All fifty-five counties had salary, employee benefit and vehicle supply expenses for the school year 9. The highest level of salary expenditures occurred in Kanawha County, who spent $5,674,208 to employ 154 FTE school bus operators and nine other transportation employees. Consequently, Kanawha also had the highest level of employee benefit expenditures. Five counties (Harrison, Pleasants, Summers, Tucker, and Wayne) reported zero contract transportation expenditures for the school year. For the school year, the salary and employee benefits expenditures supported 2,814.5 full-time equivalent (FTE) school bus operator positions in the state. As Table 3 indicates, the FTE school bus operators accounted for 20.7 percent of total public school service personnel. The newest data indicates that for the school year, the number of school bus operators increased in the state to 2, FTE. However, this increase in school bus operators does not result in a large increase in percent of total public school service personnel. For the school year, the highest percentage of school bus operators to total service personnel were found in the more rural counties in the state, such as Tyler, Roane, and Pendleton counties. Kanawha County, who had the largest school transportation salary and employee benefit expenditures in , had the lowest number of school bus operators as a percentage of total service personnel for both the and school years. In comparison to the rest of the nation, West Virginia has a high concentration of school bus operators. According to the U.S. Bureau of Labor Statistics (BLS), West Virginia was one of the top five states with the highest concentration of school bus operators in May Nationally, BLS estimated that 461,590 school bus operators were employed with 3,570 of those being employed in West Virginia. This amount of school bus operators accounted for the fifth highest concentration in the nation at percent of total state employment. The average age of school bus operators in West Virginia is 50 with average experience of approximately 12 years. These statistics fall in line with national averages. According to a national survey of school bus operators conducted by School Bus Fleet magazine, 36 percent of school bus drivers are in the 41 to 50 year old age bracket. Twenty eight percent were between the ages of 51 and 60 while only 22 percent were between 18 and 40 years old County transportation expenditure category totals vary for all counties due to the way each county codes their expenditures. Also, for bus replacement expenditures, it can be noted that some counties in West Virginia do not purchase buses each year, but schedule their purchases every other year. 10 Source: Respect Trust: Key Issues for Drivers. (March, 2007). School Bus Fleet:

11 Table 2: Public School Transportation Expenditures by County School Year Maintenance, Employee Utilities & Vehicle Bus Contract County Salaries Benefits Equipment Insurance Supplies Replacement Transportation Other Total Barbour $ 860,502 $ 411,841 $ 57,529 $ 96,500 $ 316,435 $ 144,352 $ 10,576 $ 52,852 $ 1,950,587 Berkeley 5,132,337 2,374,755 81, ,460 1,493,296 1,292, , ,168 11,834,493 Boone 1,601, ,786 44,745 60, , ,248 96,283 20,775 3,458,837 Braxton 871, ,147 18,783 80, , ,326 85,019 8,850 1,974,149 Brooke 907, ,825 58, , , ,749 10,912 7,345 2,148,107 Cabell 3,416,653 1,688, , ,841 1,005, , ,501 76,922 7,301,029 Calhoun 562, ,193 13,338 59, ,770 67,387 34,899 3,089 1,197,653 Clay 897, ,807 23,784 71, , , ,779 9,950 2,138,108 Doddridge 592, ,134 65,859 46, , ,645 2,597 10,090 1,352,220 Fayette 2,272,942 1,113,879 94, , , ,385 6,700 60,640 5,010,060 Gilmer 407, ,959 13,681 33, ,521 65,273 1,051 12, ,984 Grant 612, ,073 7, , , ,863 24,474 11,954 1,422,492 Greenbrier 1,930,420 1,001,450 42,769 74, , ,456 14,143 21,592 4,039,967 Hampshire 1,380, , , , ,841-11,207 29,053 3,047,941 Hancock 1,443, ,565 58,932 91, , ,265 15,236 62,156 2,998,945 Hardy 753, ,948 85, , , ,273 25,868 12,649 1,664,801 Harrison 3,478,414 1,706, , , , ,341-41,124 6,719,105 Jackson 1,830, ,807 44, , , ,175 17,583 27,279 3,753,577 Jefferson 2,694,665 1,141,268 81, , , ,859 3,950 38,142 6,004,111 Kanawha 5,674,208 2,761, , ,000 1,393,903 1,900, ,167 69,517 13,425,026 Lewis 1,134, ,281 17,281 90, , ,385 3,950 5,580 2,319,593 Lincoln 1,508, ,731 24, , , ,601 28,910 28,143 3,356,437 Logan 2,046,445 1,270, , , , ,477 26,173 59,642 4,937,122 Marion 2,453,441 1,088,723 70, ,000 1,005, ,140 1,093 37,645 5,312,583 Marshall 2,222,789 1,095,483 89, , , ,220 1,140 40,627 4,507,508 Mason 1,744, ,532 17, , , ,905 2,460 16,255 3,522,958 McDowell 1,741, ,943 53, , , ,074 1,900 12,283 3,818,733 Mercer 2,652,935 1,346,820 87, , , ,459 42,737 33,188 5,679,933 Mineral 1,747, ,040 71, , , ,975 16,116 42,038 3,945,520 Mingo 1,500, ,747 22, , , ,234 19,649 8,129 3,422,537 Monongalia 3,039,532 1,326,503 46, ,449 1,298, , , ,727 6,797,742 Monroe 950, ,046 2, , , ,045 1,784,016 Morgan 955, ,393 32, , , ,580 8,342 96,072 2,108,900 Nicholas 1,674, ,761 46, , , , ,403 9,462 3,899,476 Ohio 1,543, ,091 72,212 82, , ,560 31,452 29,253 3,197,248 Pendleton 554, ,774 11,149 70, , ,158 35,999 10,232 1,217,341 Pleasants 639, ,948 30,867 40, , ,090-16,484 1,264,962 Pocahontas 644, ,221 8,292 79, , ,475 3,781 14,612 1,382,225 Preston 1,768, ,927 31,562 66, , ,450 3,218 21,265 3,751,818 Putnam 2,728,197 1,219,833 66, , , ,055 80,562 16,649 5,824,603 Raleigh 4,450,689 1,870, , ,951 1,519, ,044 74, ,942 9,463,955 Randolph 1,247, ,417 32, , , ,369 2,511,046 Ritchie 608, ,871 8,464 69, , ,890 23,095 27,259 1,355,755 Roane 1,145, ,787 43,262 75, , ,804 67,672 17,018 2,525,173 Summers 681, ,805 13,693 28, , ,990-18,269 1,382,157 Taylor 900, ,294 14,853 60, , , ,065 1,889,808 Tucker 377, ,547 13,932 67, , ,821-10, ,698 Tyler 846, ,888 49,476 59, , ,008 3,025 24,267 1,858,366 Upshur 1,357, ,271 32, , , ,765 3,636 26,051 3,007,493 Wayne 2,465, ,340 38, ,104 1,153, ,946-37,648 5,589,512 Webster 694, ,625 15, , , ,920 58,666 10,148 1,679,685 Wetzel 1,068, ,073 6,677 60, , ,983 3,569 38,468 2,192,696 Wirt 417, ,819 18,360 30,722 96, ,324 4,901 3, ,406 Wood 3,188,038 1,490,139 52, ,182 1,177, ,476 54, ,376 6,944,109 Wyoming 1,416, ,122-88, , ,275 2,777 8,282 3,115,151 Total $ 91,434,077 $ 43,577,210 $ 3,115,797 $ 8,668,565 $ 28,732,735 $ 18,819,648 $ 3,152,834 $ 2,232,590 $ 199,733,456 Source: West Virginia Department of Education 7

12 Table 3: West Virginia School Bus Operators as a Percentage of Total Service Personnel Percentage Rank (High to Low) Barbour Berkeley Boone Braxton Brooke Cabell Calhoun Clay Doddridge Fayette Gilmer Grant Greenbrier Hampshire Hancock Hardy Harrison Jackson Jefferson Kanawha Lewis Lincoln Logan Marion Marshall Mason Mercer Mineral Mingo Monongalia Monroe Morgan McDowell Nicholas Ohio Pendleton Pleasants Pocahontas Preston Putnam Raleigh Randolph Ritchie Roane Summers Taylor Tucker Tyler Upsher Wayne Webster Wetzel Wirt Wood Wyoming Source: West Virginia Department of Education 8

13 As shown in Table 4, the total public school transportation expenditures resulted in 42,481,687 total miles traveled for West Virginia schools during the school year. The counties with the most total miles, which include regular, vocational, extra-curricular, and curricular travel, were Kanawha with 13,425,026 miles and Berkeley with 11,834,493 miles. These two counties, however, do not have the largest area in square foot. Instead their school bus miles are attributable to the total number of students being transported. For the school year, Berkeley and Kanawha had the highest number of students being transported by bus. In terms of school transportation costs per pupil transported, the amount varied from $ in Kanawha County to $1, in Tyler County. Along the 42,481,687 miles, school bus accidents have occurred. In fact, for 2006 West Virginia school buses were involved in 215 accidents. Of these 215 accidents, 75 injuries and one fatality occurred. In comparison with the surrounding states, West Virginia school buses had the lowest number of accidents. Both Kentucky and Virginia had slightly over 800 school bus related traffic accidents each with 250 to 300 injuries. Pennsylvania school buses were involved in 523 accidents which resulted in 798 injuries and 13 fatalities. For the nation, on average, school transportation accidents account for 140 fatalities per year. As the number of miles traveled by school bus varies from county to county so did the number of students transported by school bus. As Figure 2 shows, the number of students transported by bus per bus operator during the school year ranged from in Kanawha to in Summers. The number of students transported per square mile ranged from in Hancock to only 1.19 in Pocahontas. Thirty-seven of the state s 55 counties transported less than 10 students per square mile during the school year. Large mountainous counties, such as Greenbrier, Randolph, Pendleton, and Pocahontas, transported less than four students per square mile. 9

14 Table 4: School Transportation Expenditures School Year Transportation Total Miles Cost Per Pupils Cost Per County Expenditures Traveled Mile Transported Pupil Barbour $ 1,950, ,157 $ ,428 $ Berkeley 11,834,493 2,338, , Boone 3,458, , , Braxton 1,974, , , Brooke 2,148, , , Cabell 7,301,029 1,352, , Calhoun 1,197, , ,035 1, Clay 2,138, , ,018 1, Doddridge 1,352, , ,137 1, Fayette 5,010,060 1,138, , Gilmer 831, , , Grant 1,422, , , Greenbrier 4,039, , , Hampshire 3,047, , , Hancock 2,998, , , Hardy 1,664, , , Harrison 6,719,105 1,132, , Jackson 3,753, , , Jefferson 6,004,111 1,268, , Kanawha 13,425,026 3,023, , Lewis 2,319, , ,074 1, Lincoln 3,356, , ,247 1, Logan 4,937, , ,594 1, Marion 5,312, , , Marshall 4,507, , ,087 1, Mason 3,522, , , McDowell 3,818, , ,446 1, Mercer 5,679,933 1,326, , Mineral 3,945, , ,621 1, Mingo 3,422, , , Monongalia 6,797,742 1,616, , Monroe 1,784, , ,762 1, Morgan 2,108, , , Nicholas 3,899, , ,077 1, Ohio 3,197, , , Pendleton 1,217, , ,053 1, Pleasants 1,264, , ,169 1, Pocahontas 1,382, , ,123 1, Preston 3,751, , , Putnam 5,824,603 1,063, , Raleigh 9,463,955 1,837, ,229 1, Randolph 2,511, , , Ritchie 1,355, , ,267 1, Roane 2,525, , ,333 1, Summers 1,382, , ,320 1, Taylor 1,889, , , Tucker 954, , , Tyler 1,858, , ,451 1, Upshur 3,007, , , Wayne 5,589,512 1,252, , Webster 1,679, , ,370 1, Wetzel 2,192, , , Wirt 939, , , Wood 6,944,109 1,559, , Wyoming 3,115, , , Total $ 199,733,456 42,481,687 $ ,719 $ Source: West Virginia Department of Education Office of School Finance 10

15 Figure 2: West Virginia Students Transported by School Bus Statistics Number of Students Transported Per Bus Operator School Year Kanawha Wood Putnam Hancock Ohio Cabell Brooke Berkeley Boone Monroe Wayne Jefferson Clay Wyoming Harrison Fayette Mineral Wetzel Raleigh Grant Monongalia Barbour Logan Tucker Marion Jackson Lincoln McDowell Upsher Mason Pleasants Taylor Wirt Hardy Mingo Webster Hampshire Mercer Braxton Marshall Preston Calhoun Randolph Greenbrier Gilmer Ritchie Lewis Roane Nicholas Tyler Doddridge Pendleton Morgan Pocahontas Summers Number of Students Transported Per Square Mile School Year Hancock Berkeley Cabell Ohio Jefferson Brooke Wood Putnam Kanawha Monroe Harrison Marion Mineral Raleigh Marshall Taylor Wayne Mingo Logan McDowell Upsher Fayette Boone Mason Monongalia Pleasants Jackson Lincoln Wyoming Barbour Wetzel Mercer Preston Clay Tyler Hampshire Lewis Roane Nicholas Greenbrier Braxton Grant Morgan Calhoun Wirt Summers Doddridge Hardy Ritchie Randolph Tucker Webster Gilmer Pendleton Pocahontas 11

16 B. HB 4588 changes to transportation funding (step 4) During the 2008 regular session of the West Virginia Legislature, HB4588 was passed dramatically altering the current Public School Support System 11 in the state. This bill, which went into effect on July 1, 2008, included the following: Made major changes to the Public School Support Program and phase-in changes over a five-year time period Eliminated adjusted enrollment limits and bases calculations in the first two steps of the funding formula on net enrollments only Divided districts into four groups based on student density per square mile: o Sparse-density county = less than five per square mile o Low-density county = greater than or equal to five but less than ten o Medium-density county = greater than or equal to ten but less than twenty o High-density county = greater than or equal to twenty Set net enrollment funding limits for professional educators and service personnel allowed to be funded and the minimum required limit for professional instructional personnel and bases personnel funded on these limits For districts with net enrollment of less than 1,400, increased the net enrollment by an amount determined by a formula Excluded school counselors and nurses from definition of professional educators and identified them as professional student support personnel Based the allowance for fixed charges (step 3) on the allowances for professional educators, service personnel and administrative costs Continued the allowance for other current expenses to be at 10 percent of allowances for professional educators and service personnel Provided for allowance for advanced placement programs at 1 percent of the state average per pupil aid times the number of students enrolled Provided the West Virginia Department of Education to have funds that would be used for funding support for high acuity needs that exceed the capacity of county boards to provide and required Superintendent to review annual state and federal laws, rules, policies and standards for serving needs of exceptional children enrolled in public schools And numerous other modifications to the Public School Support System This legislation made significant modifications to the foundation allowance for transportation cost ( 18-9A-7). The total allowance for each county, as laid out in West Virginia Code, is determined by the costs incurred for maintenance, operation, and related transportation costs (exclusive of all salaries), insurance costs, current replacement value of the bus fleet, and aid in lieu of transportation. The percentage of transportation costs incurred by each county for maintenance, operation and related costs exclusive of all salaries that are funded are determined by the following student density categories: 11 The Public School Support Program prior to the passage of HB 4588 is described in detail in the Appendix. 12

17 Sparse-density counties 95 percent Low-density counties 92.5 percent Medium-density counties 90 percent High-density counties 87.5 percent The percentage funded for transporting students to and from classes at a multi-county vocational center or using an alternative fuel such as compressed natural gas or other acceptable alternative fuel is the percent provided from density category plus an additional ten percent. The total foundation allowance for transportation also includes the following: total cost of insurance premiums on buses, buildings and equipment used in transportation; an amount equal to 8.33% of the current replacement value of the bus fleet; and aid in lieu of transportation equal to the state average amount per pupil for each pupil receiving aid within each county. 1. Counties affected by changes Prior to HB 4588, school transportation funding (step 4) was based on only two student density categories. Low density counties were counties whose student enrollment per square mile was less than the state average. Those counties determined to be low density counties received 90 % of transportation costs incurred for maintenance, operation, and related costs exclusive of all salaries. High density counties were counties whose student enrollment per square mile was more than the state average. Those counties determined to be high density counties received 85% of transportation costs incurred for maintenance, operation, and related costs exclusive of all salaries. In comparing the old school transportation funding option for costs incurred for maintenance, operation and related costs exclusive of all salaries to the allowance options in HB 4588 for the school year, there is an increase in funding for approximately 50 of the 55 counties. The only counties estimated not to change allowance percentages would be low density counties in the old system and medium density counties under HB These counties are estimated to be: Fayette, Jackson, Mason, Mineral, and Upshur. As shown in Table 5, using projected headcount enrollments for the school year 12, the old school transportation funding would have made 90% allowance for 35 counties leaving 20 receiving an 85% allowance. Under HB 4588, all of West Virginia s counties would receive foundation allowances above 85% with 29 counties receiving allowances above 90 %. The average increase in transportation allowance for West Virginia counties with the implementation of HB 4588 is estimated to be 3.2% for the school year. Further increases in allowances for transportation will be issued to counties running buses for students taking courses at multicounty vocational centers and to those counties using alternative fuels. 12 Projected headcount enrollments were calculated by the West Virginia Department of Education Office of School Finance. Actual second-month headcount enrollment counts for all West Virginia counties will not be available until November

18 Table 5 : Percentage of Transportation Costs For Maintenance, Operation and Related Costs Exclusive of All Salaries Funded Through Foundation Allowance School Year Projected Headcount Enrollment Prior to HB 4558 % Category HB 4558 % Category Barbour 2,554 90% 92.5% 2.5% Berkeley 17, Boone 4, Braxton 2, Brooke 3, Cabell 12, Calhoun 1, Clay 1, Doddridge 1, Fayette 6, Gilmer Grant 1, Greenbrier 5, Hampshire 3, Hancock 4, Hardy 2, Harrison 11, Jackson 5, Jefferson 8, Kanawha 28, Lewis 2, Lincoln 3, Logan 6, Marion 8, Marshall 4, Mason 4, Mercer 9, Mineral 4, Mingo 4, Monongalia 10, Monroe 2, Morgan 2, McDowell 3, Nicholas 4, Ohio 5, Pendleton 1, Pleasants 1, Pocahontas 1, Preston 4, Putnam 9, Raleigh 12, Randolph 4, Ritchie 1, Roane 2, Summers 1, Taylor 2, Tucker 1, Tyler 1, Upshur 3, Wayne 7, Webster 1, Wetzel 2, Wirt 1, Wood 13, Wyoming 4, Increased % Note: Calculations are based on student enrollment only. Does not included calculations for transportation costs for multi-county vocational center or alternative fuel usage. 14

19 III. Comparison with Neighboring States A. Kentucky Pupil Transportation Funding The School Transportation News reports that as of the school year 68 percent of public school students were transported at public expense at an average transportation cost per pupil of $ The percent school transportation cost of total annual K-12 expenditure was 6.1. Over 9,700 district-owned school buses were used in the transporting of pupils. 1. State Requirements Kentucky law 13 states that boards of education may, but are not required to, provide transportation from their general funds or otherwise for any pupil of any grade to the nearest school to the pupil s residence within the district if the pupil does not live within a reasonable walking distance 14 to such nearest school of appropriate grade level. If space is not available at the nearest school of appropriate grade level, boards of education may provide transportation from their general funds for any pupil of any grade who does not live within a reasonable walking distance to the nearest school of appropriate grade level where space is available. 2. Local Decision Making Boards of education may use district-owned and operated transportation systems, local government mass transit systems, contracted pupil transportation system, and supplemental contracts with private transportation services. The board of directors of a school district are also required by state law to have a policy on responsibilities of pupils who are transported in district vehicles, including but not limited to route planning, school bus stop placement, and the maximum amount of time a pupil may be ride the school bus. 3. Reimbursement Rates Kentucky follows the expected cost method of pupil transportation reimbursement. In particular, local school districts in Kentucky are reimbursed from the fund to Support Educational Excellence in Kentucky (SEEK) for transportation costs. The funding is based on a cost/density formula. The number of pupils transported per square mile served and the actual cost are the basis for determining transportation allocations. The transportation formula aims to provide funding for school districts providing transportation to students who live one mile or more from school on the basis of what the average cost of providing pupil transportation for students living one or more miles from school in school districts with similar transported pupil density. If a local school district s actual cost per pupil is less than predicted cost the district receives a bonus. If a local school district s actual cost per pupil is more than predicted cost the district is required to provide more local funds. 13 Kentucky Revised Statutes Chapter dictates pupil transportation policy. 14 Pupils who reside one or more miles from school and where safety conditions are not in school are eligible for pupil transportation If traffic or other safety conditions make walking to school extremely hazardous, no matter the distance from the nearest school of appropriate grade level, the transportation director of the local school district may arrange for transportation for such students. 15

20 Two calculations are made for each school year to determine each school district s allotment for pupil transportation. The first calculation provides specific information concerning the method by which each district s formula adjusted transportation cost is determined. The second calculation shows each district s projection for growth in students who live one or more miles from school and the final calculated pupil transportation costs. Factors that affect the funding formula are as follows: transporting expenditures, reimbursements for the cost of transportation other than the SEEK allotment (whether local, state, or federal), density (the average daily number of pupils transported divided by the square miles served in each school district), and bus depreciation. The amount added to a district s transportation program cost for vehicle depreciation is 12 percent of the state bid price for vehicles aged 1 to 2 years, 10 percent for those aged 3 to 8 years, 8 percent for those aged 9 or 10 years and 6 percent for those aged 11 to 14 years. The Pupil Transportation Tentative Funding Calculation for for Kentucky counties uses a spreadsheet to determine pupil transportation funding for each county. Criteria used in the calculation include net square miles in the district, gross average daily attendance, handicapped factor, net transported pupil density per square mile, and depreciation. In regards to density adjustment, school districts are compared to other school districts of similar densities and funding is adjusted accordingly. A school district transporting twenty pupils per square mile is not directly compared to a school district transporting five students per square mile. Instead, a school district transporting twenty pupils per square mile is compared to all other school districts transporting twenty students per square mile. If a school district s transportation costs are higher than the average transportation costs of the density group they are in the school district is penalized by not receiving additional funds above the state average for their density group (the additional money must be made up by local funds). If the school district s transportation costs are below the average transportation costs of the density group they are in the school district is rewarded with a bonus. This system creates downward pressure on each school district to restrict transportation costs. B. Maryland Pupil Transportation Funding The Maryland State Department of Education Fact Book of reports that as of the school year over 605,000 pupils were eligible for school transportation for the 24 public school districts throughout the state. This number includes over 24,000 students who are disabled. 15 In all, 71 percent of public school students were transported at public expense. The total expenditure for pupil transportation in the school year was $497,316,742 with only $187,123,542 (37.6%) being provided through state aid. The average expenditure per pupil on transportation as of the school year was $822. The total number of publicly-owned vehicles used in transporting students was over 3,700 while the number of contracted vehicles used in transporting students was over 3,300. The total number of miles traveled was 121,209,195 with more than half of those miles being used to transport students who are disabled. 15 The number of disabled pupils eligible for pupil transportation includes disabled students in nonpublic schools as of
,")
21 1. State Requirements Maryland law 16 stipulates that at its own expense a county governing body may, but are not required to, provide transportation for public school students in addition to the transportation provided by the state. A school bus may be used to transport any student who lives within the mileage limit set by the local board of education if the school bus is not already filled to capacity, no additional bus stops are added to the route, and the local transportation officer has identified a specific existing hardship that justifies the student to be transported. Maryland provides funds from the general budget to each school district for pupil transportation through the means of block grants. If the amount budgeted to a county is more than the actual cost of providing student transportation services in the county, the county board may apply any excess funds to costs of pupil transportation services in subsequent years. The additional funds may not be transferred to any other category. 2. Local Decision Making The board of directors of a school district is involved in the transportation program including but not limited to the decision of bus stop locations, the actual routing and planning of school bus routes, the mileage limits of pupil transportation, and the maximum time a student may ride the school bus. Maryland state law stipulates that at its own expense a county governing body may provide transportation for public school students in addition to the transportation provided by the state. 3. Reimbursement Rates The transportation grant for each county is equal to the amount of the county s base grant for student transportation for the previous year allowing for increases in costs and student population. Specifically, the grant is increased by the same percentage as the increase in the private transportation category of the Consumer Price Index (CPI) for all urban consumers in the Washington-Baltimore metropolitan area as of July of the fiscal year preceding the year for which the amount is being calculated. The CPI increase may not be less than 3 percent nor more than 8 percent of the amount of the grant for the previous year. 17 Additionally, an adjustment is made for increased enrollment and based on the portion of increased state enrollment attributable to each school district. Districts with zero or negative growth receive an adjustment of zero. C. Ohio Pupil Transportation Funding The School Transportation News reports that as of the school year 70 percent of public school students were transported at public expense at an average transportation cost per pupil of $ The percent school transportation cost of total annual K-12 expenditure was 4.6. Over 17,800 districts owned school buses and over 1,000 contractor owned buses were used in the transporting of pupils. 16 Annotated Code of Maryland Education Article Title 7 Subtitle The base year for increases is
22 1. State Requirements Ohio law 18 states that transportation shall be provided for all resident school pupils in grades K-8 who live more than two miles from the school to which they are assigned by the board of education of the district of residence. Pupils attending community or nonpublic schools for which the state board of education prescribes minimum standards are also entitled to the same transportation services. Transportation for special needs students are required by state law, regardless of grade. 2. Local Decision Making School districts may, though are not required to, provide transportation for resident school pupils in grades 9 through 12 as well as for students who live less than two miles from school. School districts have the option to provide state minimum transportation where the district only transports students K-8 who reside more than 2 miles from school. Transportation service above the state minimum is considered discretionary spending, although it is subsidized. The board of directors of a school district is involved in the transportation program including but not limited to the decision of bus stop locations (which must be provided with ½ mile of the child s residence), the actual routing and planning of school bus routes, and the maximum time a student may ride the school bus. Only students in preschool, those having special needs, and those enrolled in alternative schools may be transported by van or vehicles other than school buses. Regular education students may only be transported by this method for athletic and extracurricular trips. 3. Reimbursement Rates Ohio follows the expected cost method of pupil transportation reimbursement. Funding is provided for all eligible students transported over 1 mile from school. However Ohio s pupil transportation reimbursement system is presently in limbo per se, until the adoption of the next biennial budget, at which time the hope is that a new pupil transportation funding formula will be installed. At present, regular education services is and has been paid on a guaranteed annual increase over the fiscal year 2005 data reported: 2% for fiscal year 2006, 2% for fiscal year 2007, 1% for fiscal year 2008, and 1% for fiscal year Prior to the guaranteed annual increases, the department of education annually determined the average efficient transportation cost per student using regression analysis. The regression equation estimates the cost of transportation as a function of an intercept, the number of daily bus miles per student and the transported student percentage. In other words, the regression allows for a basic fixed cost (the intercept) and variable costs depending on miles traveled and the percentage of students transported. The intercept and regression coefficients, or effects of miles and percent of students transported, were updated using data from the prior fiscal year. Reimbursement to school districts for transportation of school pupils were made on a current basis according to an estimate filed with the state board of education by respective school 18 Ohio Revised Code Title 33 Chapter 3327 dictates pupil transportation. 18
23 districts with adjustments for inflation due to the use of prior year data in the regression analysis. 19 An example of the regression that was used for reimbursement of pupil transportation is as follows (note: coefficients are from 1998 data): ( x daily bus miles per student 20 ) + ( x transported student percentage) Under certain conditions, a school district also received a rough road subsidy based in part on student density. The formula used to determine the rough road subsidy is: (Per rough mile subsidy 21 x total rough road miles) x density multiplier 22 D. Pennsylvania Pupil Transportation Funding The School Transportation News reports that as of the school year 84 percent of public school students were transported at public expense at an average transportation cost per pupil of $644. Over 4,500 district owned school buses and 12,800 contractor owned buses were used in the transporting of pupils. 1. State Requirements With the exception of charter school students, Pennsylvania state law 23 does not require a school district to provide transportation for its students, though they may opt to do so. School districts are only required to provide transportation for charter school students when the charter school is located within the district, the charter school is not located more than ten miles by the nearest public highway beyond the district boundary, or the charter school is a regional charter school in which the district is participating. 2. Local Decision Making Since 1973, if a school district chooses to provide transportation for its public pupils it must provide transportation to nonpublic pupils of the same grade level it provides transportation for its public students. The board of directors of a school district is responsible for all aspects of transportation programs, including among others the decision of how long a student may be 19 See appendix for more details. 20 The daily bus miles per student equals the number of bus miles traveled per day, divided by transportation base. The transportation base equals total student count as defined in section of the Revised Code, minus the number of students enrolled in units for preschool children with disabilities, plus the number of nonpublic school students included in transportation average daily attendance (ADM). 21 The per rough mile subside equals the amount calculated in accordance with the following formula: 0.75 {0.75 x [(maximum rough road percentage county rough road percentage)/(maximum rough road percentage statewide rough road percentage)]} 22 The density multiplier is a figure calculated in accordance with the following formula: 1 [(minimum student density district student density)/(minimum student density statewide student density)]. Minimum student density is defined as the lowest district density in the state. District student density is defined as a school district s transportation base divided by the number of square miles in the district. Statewide student density is defined as the sum of the transportation bases for all school districts divided by the sum of the square miles in all school districts. 23 Pennsylvania code Title 22 Chapter 23 dictates pupil transportation. 19
24 required to ride on a bus, the location of school bus stops, the actual routing and planning of school bus routes, and the selection of means of transportation as long as they are approved by the Pennsylvania Department of Education. 3. Reimbursement Rates Pennsylvania follows the per unit allocation method of pupil transportation reimbursement. Reimbursement is calculated by multiplying the approved reimbursable costs from the preceding year times the aid ratio for each school district. Depreciation payments are also made to qualifying school districts. According to chapter 23 of the Pennsylvania Code the formula allocations are $540 times the rated pupil capacity for vehicles with capacities of more than 10 and $360 for those with a capacity of less than 10. These rates are the same for district-owned and contract vehicles. An additional $15 per rated pupil capacity is provided for district-owned vehicles aged 1 to 10 years and $12 per pupil capacity is provided for vehicles aged more than 11 years. The adjustments are larger for contract own vehicles, $20 for vehicles aged 1 to 3 years, $18 for those aged 4 to 6 years, $16 for those aged 7 to 10 years, and $12 for those more than 10 years old. Adjustments are made for district-owned vehicles that are not used for the full term, are only used to transport to or from school, or travel less than 20 miles per day. 24 Contract vehicles used only for one-way transportation receive 50 percent of the allowance. The school district regular pupil transportation subsidy payment schedule is as shown in Table 6. Table 6: Pennsylvania School Transportation Payment Schedule Month August Payment Schedule 10% of prior year s total reimbursement September, October, November 20% of prior year s total reimbursement in the month following Pennsylvania Department of Educations s (PDE s) receipt of prior year s end-of-year reports 25% of prior year s total reimbursement, if both the prior year s end-of-year reports and the current year s December Certification of Intent to Provide Pupil Transportation Services have been received by PDE. 25% (approximately) of current year s estimated total March reimbursement 20 % (approximately) of current year s total June reimbursement.[1] [1] This final reconciliation payment is calculated by subtracting the total of the first four payments, and any other adjustments required, from the current year s actual total reimbursement. 24 See Appendix for more details. 20
25 E. Virginia Pupil Transportation Funding The School Transportation News reports that as of the school year 75 percent of public school students were transported at public expense. Over 13,400 total school buses were used in the transporting of pupils for the 132 public school districts (1,792 total number of public schools). The transportation expenditure for K-12 was $5.417 billion. 1. State Requirements Virginia law 25 states that school boards may, but are not required to, provide for the transportation of pupils but are not required to provide transportation. The exception is for students with disabilities. Virginia law mandates that school boards must provide transportation to and from school or class at no cost if the transportation is necessary to enable such child to obtain the benefit of educational programs and opportunities. The school board does have the right, in lieu of providing transportation on an approved school bus for students with disabilities, to allot funds to pay the reasonable cost of special arrangement transportation. The school board is reimbursed sixty percent of such cost if the funds are available. 2. Local Decision Making Local school boards may, but are not required to decide whether or not to allow private and parochial students to ride on public school buses. The board of directors of a school district is involved in the transportation program including but not limited to the decision of bus stop locations, the actual routing and planning of school bus routes, the decision of whether or not to build school bus shelters at bus stops, and the maximum time a student may ride the school bus. 3. Reimbursement Rates Virginia provides funds from the general budget to each school district for pupil transportation through the means of per until allocation funding. Chapter 70, section 235 of the Virginia Administrative Code states that Funding for pupil transportation shall be pursuant to the provisions of the appropriation act. Specifically, state funds for pupil transportation (operational costs and bus replacement) are provided through the Basic Aid component of Virginia s Standards of Quality funding formula instead of a reimbursement basis. Funding for operational costs is based on a prevailing cost methodology (i.e. reflects what most school divisions spend per pupil transportation). Local home-to-school operational costs in four areas are supported by state funds: regular education, special education, special arrangements for special education students, and public transit. The aid payments are distributed to school divisions on a monthly basis over the course of the fiscal year Virginia Code Title 22.1 Chapter 12 dictates pupil transportation. 26 See Appendix for further detail. 21
26 IV. Current Problems Facing West Virginia s School Transportation System A. Substitute School Bus Operator Shortages For the school year, several West Virginia school districts are dealing with a shortage of substitute school bus operators. According to an poll completed by the Bureau of Business and Economic Research at West Virginia University, 10 school districts out of the 22 that responded were dealing with a shortage of substitute school bus drivers after the school year had started. Many of those in short supply of substitute drivers blamed rigorous certification standards set by the state for school bus operators as the main reason for the shortage. In comparison to the four of the five surrounding states, the certification requirements for school bus operators seem to be more restrictive. As shown in Table 7, Kentucky, Ohio, Pennsylvania, and Virginia as well as West Virginia require a physical exam prior to being certified. However, only West Virginia and Kentucky require operators to be at least 21. When it comes to training hours, West Virginia requires 40 classroom hours, which is at least 15 hours more than required by surrounding states. West Virginia also requires 12 behind-the-wheel hours of training. Table 7: School Bus Operator Qualifications by State Instructional Training minimum # of years with any license behind-thewheel training hours classroom minimum age training hours Kentucky 21 NA 25 8 yes Ohio legal age yes Pennsylvania 18 NA 14 6 yes Virginia 18 NA yes West Virginia yes physical exam Current qualification standards are not the only disincentive for individuals choosing school bus driving as a career in West Virginia. Low salaries versus alternative careers requiring the same skill set is also a major deterrent. For the school year, the average annual salary for a full-time public school bus operator in the state was $22,523. While, according to the U.S. Bureau of Labor Statistics, general freight truck operators for 2007 in West Virginia had an average annual salary of $37,718 and specialized freight truck operators had an average annual salary of $34,961. For substitute bus operators, salaries are an even larger issue due to the unknown number of days or hours they will be needed to work throughout the school year. 22
27 V. Alternative Policy Options for Addressing Density Adjustments A. Regression Analysis Data collected from school districts would be employed to estimate the cost of transportation based on several factors including miles traveled and number of students. Any number of additional factors thought to be important in determining transportation costs, such as population density, mountain roads, and salary differentials could also be included. The main advantage to this approach is that it is based on actual expenditures and does not require any arbitrary cut-offs. Regression analysis would provide new estimates each funding year, so that trends such as rising prices will be captured without further legislation. It allows for a fixed cost component (intercept) such that there is some level of expenditure needed to provide transportation regardless of the number of students transported or miles driven. In addition, this method is flexible enough to include a county-specific adjustment factor for counties that have unusually high or low transportation costs. It is also simple to implement as the calculation takes a matter of minutes after the data are compiled. The main drawback of this approach is that the estimates are only as current as the data used and there is certain to be a lag between when expenses are incurred and when the estimates are generated. This lag likely necessitates an adjustment for inflation. Another potential drawback is that the estimates are derived from actual expenditures and do not necessarily reflect minimum costs or best-practices but there would be an incentive for a district to keep its costs close to the average costs for similar districts. See Appendix B for further discussion and a example of regression analysis applied to West Virginia counties. B. Continuous Density Adjustment Instead of adjusting density based on cut-points, a continuous density adjustment could be used. Such an adjustment would provide an increase or decrease from a starting reimbursement rate (e.g percent) and would increase the reimbursement for low-density districts and decrease the reimbursement rate for higher density locations based on actual density levels. The advantage of this approach is that it avoids making arbitrary cut-offs, which might not be closely aligned with actual costs and might become irrelevant over time. In addition, it is county specific and adjusts automatically with changes in population. The main disadvantage of this approach is the uncertainty it creates in reimbursement rates as school districts establish their budgets. Further, as with the adjustments under HB 4588, it controls only for density, which may not be perfectly correlated with differences in costs. For instance, a district that has a medium number of students per square mile might actually face high costs based on geographic factors (such as mountain roads). Additionally, costs would be 23
28 higher if the students are distributed at larger intervals as compared with an equal density district that has a few main population centers where all the students are concentrated. C. Implementation of a Four Day School Week A few states are considering the option of a four day school week in order to cut costs of transportation. In fact, according to an American Association of School Administrators survey of school superintendents, 15% of school districts in the United States are considering moving to a four day school week 27. Mostly rural school districts have been the leaders in experimenting with altering their school calendar. These districts are finding that four day school weeks provide for considerable savings by reducing not only transportation costs but also heating and other overhead costs. Prior to the school year, at least 14 states had passed legislation allowing for four day school weeks. Those states include: Arizona, Arkansas, California, Colorado, Illinois, Louisiana, Minnesota, New Mexico, Oregon, South Dakota, Virginia, Wisconsin, and Wyoming 28 Currently, the Tennessee School Boards Association and Department of Education are undertaking a state-wide study of the cost ramifications of implementing a four day school week. Issues the study is dealing with include the actual cost savings in fuel for school buses, problem of paying school bus operators for the fifth day of the week, and the safety of students if the school day is extended 29. With state legislation already in place, one school district in Minnesota, M.A.C.C.R.A.Y School District, moved to a four day school week for the school year. This initiative in M.A.C.C.R.A.Y was spurred by rising fuel costs that would have required the district to spend an extra $65,000 to fill its buses fuel tanks for the school year. The district also lengthened the regular school day in order to compensate for the few school days associated with the four day school week. D. Other Policies to Limit Growth in Transportation Costs 1. Efficiency Frontier or Bonuses for Efficiency Similar to the regression approach, data would be used to estimate the cost of providing transportation in a district. The main difference with the regression approach is that the goal of this analysis would be to create an efficiency frontier, or an efficient cost level for each district based on characteristics such as number of students, miles traveled, and density. This can be done through statistical analysis, or like KY, districts of similar characteristics can be compared to establish a minimum spending level. Actual expenditures might differ from the efficient level. Thus, by reimbursing only based on the efficient level of expenditures, inefficient districts will receive less than their expenditures and have an incentive to reduce costs. Additional bonuses 27 Source: Toppo, Greg. Fuel prices force schools to weigh class, staff cuts. USA Today. July 29, <http//: 28 Source: National Conference of State Legislatures. Four Day School Week. < 29 Source: Four-Day Weeks Not Allowed, Survey Looks at Desire to Change. School Transportation News. Sept. 25, < 24
29 might be provided to efficient districts to further encourage efficient provision of transportation. These bonuses can be general in nature, allowing school districts to spend them wherever they are most needed or they can be restricted to transportation expenditures. 2. Mass Transit/Privatization Implementation of this alternative would depend on the current state of mass transit or the prospective availability of private operators in the district. For instance, in districts where mass transit operations already exist, the current system could be altered to accommodate school students. For instance, some bus routes might be added or made student only. In districts where mass transit is not currently offered, there might be an opportunity for groups to come together and establish a system, possibly using buses currently owned by the school district, to offer year-round mass transit for a variety of individuals including school children and senior citizens. The specifics of mass transit or private provision contracts are likely to be districtspecific as the cost savings from such arrangements would vary by county. However, the state would play an important role in setting standards and minimum requirements. 25
30 VI. Appendix A Additional State Transportation Policy Details A. West Virginia Policy Prior to HB State Requirements West Virginia state 30 law stipulates that each school board may, but is not required to, provide at the public expense adequate means of transportation for: All children of school age who live more than two miles distance from school by the nearest available road School children participating in county board-approved curricular and extracurricular activities Across county lines for students transferred from one district to another by mutual agreement of both county boards Within available revenues, for students within two miles distance of the school And to provide transportation for participants in projects operated, financed, sponsored or approved by the Bureau of Senior Services Local Decision Making The board of directors of a school district is responsible for all aspects of transportation programs, including the decision of how long a student may be required to ride on a bus 32, the location of school bus stops 33, the actual routing and planning of school bus routes, and any other policy necessary (pursuant to state guidelines) needed in the transporting of students to and from school and approved school related activities. 3. Reimbursement Rates West Virginia Code Chapter 18 article 5 stipulates that the allowance in the foundation school program for each county for transportation shall be the sum of the following computations: 85% of the transportation cost within each high-density county and 90% of the transportation cost within each low-density county for maintenance, operation, and related costs, exclusive of all salaries West Virginia Code This transportation shall be provided at no cost to the county board. All costs and expenses incident in any way to this transportation shall be borne by the Bureau or the local or county affiliate of the Bureau. 32 The West Virginia School Bus Transportation Policy and Procedures Manual recommends one way transportation time as follows: for Pre-K through grade 4 up to but no more than thirty minutes, for grades 5-8 or 7-9 up to but no more than forty-five minutes, and for grades 9-12 or up to but no more than sixty minutes. 33 Bus stops should be located out of the traffic stream and at least 0,2 miles apart. See the West Virginia School Bus Transportation Policy and Procedures Manual for more information. 34 Low density county is defined as a county whose ratio of student population to square miles is less than or equl to the state average ratio as computed by the state department of education. High density county is defined as a county whose ration of student population to square miles is greater than the state average ratio as computed by the state department of education. 26
31 For each county that uses an approved alternative fuel for the operation of all or any portion of its school bus system, the allowance for the county for that portion of its school bus system shall be 95% of the transportation cost for maintenance, operation, and related costs, exclusive of all salaries, incurred by the use of the alternatively fueled school buses Any county using an alternative fuel and qualifying for the additional allowance shall submit a plan regarding the intended future use of alternatively fueled school buses. The total cost, within each county, of insurance premiums on buses, buildings, and equipment used in transportation as long as the premiums were procured through competitive bidding An amount equal to eight and one-third percent of the current replacement value of the bus fleet within each county as determined by the state board. The amount shall only be used for the replacement of buses. Buses purchased after the first day of July 1999, that are driven 180,000 miles, regardless of year model, will be subject to the replacement value of eight and one-third percent as determined by the state board, provided that for the school year beginning on July 1, 2004, only, the allowance in the foundation school program for each county for transportation shall not include an amount for the replacement of buses. In addition, in any school year in which its net enrollment increases when compared to the net enrollment the year immediately preceding, a school district may apply to the state superintendent for funding for an additional bus. 85% of the cost of contracted transportation services and public utility transportation within each high-density county and 90% of the cost of contracted transportation services and public utility transportation within each low-density county Aid in lieu of transportation equal to the state average amount per pupil for each pupil receiving the aid with each county 95% of the transportation cost for maintenance, operation, and related costs, exclusive of all salaries, for transporting students to and from classes at a multicounty vocational center West Virginia Code Chapter 18 article 9 states the total state share for transportation cost shall be the sum of the county shares. No county shall receive an allowance which is greater than one-third above the computed state average allowance per transportation mile multiplied by the total transportation mileage in the county provided, however, that one half of one percent of the transportation allowance distributed to each county shall be for the purpose of trips related to academic classroom curriculum not related to any extracurricular activity and for the school year beginning July 2004 only the transportation allowance of each county for the purpose of trips related to academic classroom curriculum and not related to any extracurricular activity. The allocation shall equal the amount distributed to the county for this purpose in the school year beginning on the first day of July 2003 and provided that any remaining funds credited to a county for the purpose of trips related to academic classroom curriculum during the fiscal year shall be carried over for use in the same manner the next fiscal year and shall be separate and apart from, and in addition to, the appropriation for the next fiscal year and that the state board 27
32 may request a county to document the use of funds for trips related to academic classroom curriculum if the board determines that it is necessary. B. Kentucky Table 8: Kentucky School Transportation Budget Vocational Year Pupil Transportation Expenditure Education Transportation Expenditure Total 2003 $202,216,300 $2,416,900 $204,633, $212,106,200 $2,416,900 $214,523, $211,953,500 $2,416,900 $241,370, $211,953,500 $2,416,900 $241,370, $211,953,500 $2,416,900 $241,370, $214,752,800 $2,416,900 $217,169, $214,752,800 $2,416,900 $217,169, $214,752,800 $2,416,900 $217,169,700 Kentucky law is not as generous as some state laws in the provision of pupil transportation for students who attend a school outside their own attendance area and reside more than one mile from the school of attendance. The Hitcher Provision requires that school buses are not allowed to add either time or mileage or in any way alter the designated bus route to provide transportation for said students. Also the said student is only granted access to the bus if space is available. Local school districts are reimbursed separately from the SEEK program for the cost of transporting pupils from a parent school to a vocational-technical school or to a vocational education center. Local school districts are also required by law to provide transportation of its resident pupils who are enrolled in the Kentucky Schools for the Deaf or Blind, as resident pupils, to and from school on a regularly scheduled basis, at intervals of not less than once per week. This funding is a separate appropriation from the SEEK funding. When a local school system approves the placement of a special needs student in a program it does not operate, it must ensure that transportation is provided at no cost to the parents. 28
33 C. Maryland Table 9: Maryland School Transportation Budget Pupil Transportation Expenditures Percentage of Education Spending for Pupil Transportation Total Education Year Spending 2004 $167,009,034 $4,320,816, % 2005 $175,534,529 $4,673,098, % 2006 $187,123,730 $5,110,133, % 2007 $202,079,378 $5,368,596, % 2008 $219,023,786 $6,407,601, % In Calvert County, the school board may provide transportation to and from school on a public school bus for a student who attends a nonpublic school if the school bus is not already filled to capacity, if the student resides on, along, or near a public highway in the county on which a public school bus or conveyance operate, if the student resides in the public school transportation district served by the public school bus, if the routes, school days, and hours of transportation coincide with the routes, school days, and hours of transportation for students attending public schools in the county, and in the case of a student who attends a nonpublic school that is not on the public school bus route, only to the public school on the route which is nearest to the nonpublic school. In Montgomery County, a fee may not be charged for transporting public school students to school from their designated bus stop locations or from school to their designated bus stop locations. Each local school system must provide or arrange for the transportation during the regular school year of each child with a disability if the student attends a public school, a school maintained by a state agency, or a non public school with the county of residence. If the transportation is needed for outside the county of residency the local school system of the county in which the child with a disability resides shall certify and pay the cost of his daily or other reasonable transportation to school if state aid has provide for the education of the child. The disabled student grant is calculated by multiplying the number of students who are disabled by $1000 (for fiscal year 2008). 29
34 Table 10: Maryland County by County Transportation Funding School Year Total Expenditures for Pupil Transportation State Aid for Pupil Transportation Percentage of State Aid for Pupil Transportation County Allegany $5,389,731 $3,359, % Anne Arundel $36,231,351 $15,663, % Baltimore City $31,282,582 $15,476, % Baltimore $50,260,823 $20,591, % Calvert $10,047,923 $4,119, % Caroline $3,208,248 $1,859, % Carroll $16,775,017 $7,119, % Cecil $8,282,647 $3,752, % Charles $17,056,799 $7,327, % Dorchester $2,915,720 $1,715, % Frederick $20,384,576 $8,402, % Garrett $3,823,777 $2,140, % Harford $22,612,770 $8,903, % Howard $27,253,701 $10,982, % Kent $1,729,682 $1,145, % Montgomery $92,691,187 $25,920, % Prince George s $107,137,363 $28,767, % Queen Anne s $5,169,727 $2,330, % St. Mary s $10,889,401 $4,573, % Somerset $2,164,638 $1,327, % Talbot $2,080,578 $1,121, % Washington $9,123,632 $4,754, % Wicomico $6,474,499 $3,643, % Worcester $4,330,371 $2,123, % D. Ohio Table 11: Ohio School Transportation Budget Pupil Year Transportation Expenditure Bus Purchase Expenditure Total 2004 $420,271,400 $18,674,944 $438,946, $404,301,894 $17,048,756 $421,350, $412,170,713 $14,400,931 $426,571, $420,577,343 $14,000,000 $434,577, $424,783,117 $14,000,000 $438,783, $429,030,948 $14,000,000 $443,030,948 Each district that transports some students (transported student percentage greater than zero) received an adjustment to account for inflation because the regression analysis was based on prior year data. The payment was equal to a percentage of the product of the district s 30
35 transportation base from the prior fiscal year times the updated average efficient transportation use cost per student times an inflation factor of two and eight tenths per cent. Payment for extra service miles run on days public school is not in session was made by multiplying the extra miles by a per mile amount approved by the state board of education. The formula for calculation of regular education payment amounts depends on what type of transportation the school district uses in transporting its students. If they use board-owned and operated school buses (Type 1) or contractor owned and operated school buses (Type II) then the above formula is used for reimbursement. If the district uses public utilities (Type III) then the reimbursement is determined by multiplying the number of eligible pupils by a per pupil amount approved by the state board of education. If the district provides payments to a parent or guardian for pupil transportation (Type IV) then reimbursement is determined by multiplying the number of eligible pupils by a per pupil amount approved by the state board of education. If the district uses board-owned vehicles other than school buses (Type V) than the reimbursement is determined by multiplying the total annual miles by a per mile amount approved by the state board of education. Finally, if the district uses privately owned vehicles other than school buses (Type VI) then the reimbursement is determined by multiplying the total annual miles by a per mile amount approved by the state board of education. E. Pennsylvania Table 12: Pennsylvania School Transportation Budget Non-public & Year Pupil Transportation Expenditure Charter School Pupil Transportation Total ,413,000 76,663, ,076, ,761,000 74,037, ,798, ,244,000 69,938, ,182, ,067,000 69,041, ,108, ,620,000 78,817, ,437,000 Source: Pennsylvania Department of Education According to state law, a local school board is only required to provide pupil transportation for charter schools if the charter school is located within the district s boundary, or located not more than ten miles by the nearest public highway beyond the district boundary, or the charter school is a regional charter school in which the district is participating. As of February 2004, Pennsylvania law prohibits the use of 12 and 15 passenger vans for the transportation of pupils to and from school and to and from school related events. 35 Pennsylvania law allows a school district to ask a pupil, regardless of age, to walk a mile and a half to either a bus stop or school. 35 This law is relaxed if the van was registered as a bus in Pennsylvania prior to March 1, 1993 or titled to a public, private, or parochial school prior to March 1, 1993 and was registered as a buss to such school prior to September 15,
36 Vehicles used for less than the full school term, used only for one-way transportation (to or from school), or traveling less than 20 miles per day receive a reduced reimbursement rate. For one-way transportation or short distances, the reimbursement is multiplied by the fraction of number of approved miles divided by 20, or the basic reimbursement is reduced by 50 percent. For vehicles used part of the year, the annual reimbursement amount is prorated based on the portion of the term that the vehicle was in use. The depreciation allowance for district-owned vehicles is the lesser of 10 percent of the approved purchase price or $700 per vehicles. Allowances for vehicles shared by more than one school district are prorated to each district based on annual pupil miles of service. The school district nonpublic and charter school transportation subsidy (which is $385 per pupil) 36 is distributed as follows: December o 50% (approximately) of current year s total reimbursement using nonpublic pupil count recorded on prior year s end-of-year report June: o 50% (approximately) of current year s total reimbursement 37 F. Virginia In a controversial new law passed and signed by Governor Timothy M. Kaine, local school boards may, but are not required to decide whether or not to allow private and parochial students to ride on public school buses. If a local school board decides to transport private and parochial students to ride on public school buses, the local school board may enter into busing agreements with private schools. Such agreements may include, but are not limited to, arrangements relating to cost-sharing, fees, insurance, and liability. If a school board provides transportation to pupils for extracurricular activities, outside of those extracurricular activities that are not covered by an activity fund 38, the school board may accept contributions for such transportation or charge each pupil using such transportation a reasonable fee not to exceed his pro rata share of the cost of providing such transportation. If the guardian or parent of a student is not financially able to pay for such transportation then the school board may, but is not required to, waive such fees. If the school board provides transportation to pupils for field trips which are part of the program of the pupil s school or are sponsored by such school, the school board may, but is not required to, accept contributions for such transportation. 36 This includes public school pupils transported to a charter school located outside of their district residence. 37 This final reconciliation payment is calculated by subtracting the first payment from the current year s actual total reimbursement. 38 Activity funds are funds that are sponsored by the pupils school apart from the regular instructional program and which the pupils are not required to attend or participate. 32
37 To determine regular and special education transportation costs, school districts are assigned to one of six groups according to their square mileage and the average number of pupils transported daily. For each of the six cost clusters, a weighted average (prevailing) per pupil cost is calculated based on actual district s expenditures and pupils transported. For the special arrangement category, only one statewide prevailing per pupil cost is calculated and applied to all districts; for the transit category, each division s corresponding regular education prevailing per pupil amount is used. For each school district, the applicable prevailing per pupil operational cost for each transportation category is multiplied by the projected number of pupils transported in each category to derive the projected cost for that category, adjusted for inflation. For each division, the total projected operational cost across all four categories is added to the Basic Aid account, which is paid out on a per pupil basis using a state-local share based on local ability to pay. Funding for bus replacement is also based on a prevailing cost methodology. State funds are provided on a 12 year replacement cycle to support local bus replacement costs for regular and special education. To determine regular and special education bus replacement costs, school districts are assigned to one of six groups according to their square mileage and the average number of pupils transported daily. For each of the six groups, a weighted average (prevailing) number of buses per 100 pupils is calculated based on actual buses reported by the districts. A unit of per 100 pupils is used to accommodate school districts with small enrollments. For each district, the applicable prevailing number of buses per 100 pupils for regular and special education is multiplied by the projected number of regular and special education pupils in units of 100 to derive the projected prevailing number of buses for regular and special education. The small of the prevailing or actual number of regular and special education buses is divided by 12 (as a proxy) to derived the number of buses to be replaced on a 12 year replacement cycle. The number of buses to be replaced is multiplied by a unit cost for a standard bus configuration to derive the total bus replacement cost, adjusted for inflation. For each district, the total bus replacement cost is added to the Basic Aid account, which is paid out on a per pupil basis using a state-local share based on the composite index of local ability to pay. 33
38 VII. Appendix B Sample of Regression Analysis Standard Ordinary Least Squares (OLS) Regression analysis is used to estimate the average effects of total miles traveled, percentage of service personnel who are bus drivers, time, and county-specific affects on transportation costs. Over time this method generally encourages convergence to the mean. For example, a county with unusually high transportation costs per mile traveled will receive the average allowance for counties with similar characteristics, providing an incentive to reduce costs to the mean. However, the method also allows for a county-specific effect to account for differences in factors (such as road conditions) that are unique to a county. The estimates presented below are based on the following specification: Ln(Transportation) = α + β 1 Ln(Miles) + β 2 Ln(Bus_Operators) + β 3 (Year) + β 4 (County) + ε where Transportation represents transportation costs exclusive of salaries and Miles is the total number of miles traveled. Bus_Operators represents the percent of service personnel who are bus drivers. This variable is included to account for counties where transportation costs are a larger than average portion of total expenditures, such as a sparsely populated county. Natural logs are used to better achieve the distributional assumptions of the model. Year is a set of dummy variables for the years included in the dataset (2003 through 2007) and county represents a fixed effect for each county. Because the data include several years, County can be used as a powerful tool to account for missing control variables (such as road conditions). The county fixed effect will capture all factors that affect transportation costs within the county that do not change over time. Results for each county are summarized in the table below and indicate that on average a 10 percent increase in miles traveled results in an 11.2 percent increase in transportation costs. Two main factors affected the decision to focus on the above model, namely multicolinearity amongst available control variables and fit of the model. First, other factors including number of pupils transported and number of FTE bus operators were initially included in the specification. It was determined that including these additional factors was inappropriate as the correlation factor between the additional control variables and total miles traveled was greater than 95 percent. In other words, the effects of these additional variables on transportation costs were already being captured in total miles traveled. Second, specifications were run with and without county and year effects and with a time trend. The above model was superior to the others based on standard measures of fit (R-squared) as well as examining how closely the predicted costs align with actual costs and transportation allowance amounts. The R-squared for the above model is.96, indicating that the control variables in the model account for 96 percent of the variation in transportation costs. It was also the best performing model in terms of accurately predicting actual transportation costs. On average, the predictions are within 10.6 percent of the observed amounts over whole time period of 2003 to 2007 and the predictions became more accurate over time. Results by county for 2007 and a comparison of 2004 transportation costs and 2005 allowances (a lag is used to account for the time lag between incurring costs and compiling the 34
39 data) are included in Table 12. There are several counties for which the predictions are more than 20 percent less than actual costs, Wirt, Grant, and Jefferson and for which the predictions are more than 20 percent larger than actual costs, Randolph, Lincoln, Mercer, Monongalia, and Monroe. The next step toward implementing a regression methodology for allocating transportation allowances would be to assess why the predictions are so imprecise for these counties and whether there are important control variables that need to be included in the specification. 35
40 County Transportation Costs Results for 2007 Regression Prediction Percent Difference Comparison of 2004 Cost Results and 2005 Allowances Allowance Transportation Costs Regression Prediction Percent Difference Barbour Berkeley Boone Braxton Brooke Cabell Calhoun Clay Doddridge Fayette Gilmer Grant Greenbrier Hampshire Hancock Hardy Harrison Jackson Jefferson Kanawha Lewis Lincoln Logan Marion Marshall Mason McDowell Mercer Mineral Mingo Monongalia Monroe Morgan Nicholas Ohio Pendleton Pleasants Pocahontas Preston Putnam Raleigh Randolph Ritchie Roane Summers Taylor Tucker Tyler Upshur Wayne Webster Wetzel Wirt Wood Wyoming
DIVISION OF REHABILITATION SERVICES SSI Contact List
 DIVISION OF REHABILITATION SERVICES SSI Contact List Barbour 722 W. Pike Street Berkeley Boone Judy Reed District 1 Manager Charleston District Office P.O. Box 547 City, State, Zip: Institute, WV 25112
Wyoming 3600 -Elementary Education
 TABLE D6: FIRST CLASS PERMITS FOR FULL-TIME EMPLOYEES BY COUNTY First Class Permits Specializations (81) Issued by County School Year Expiring 14 County Endorsement Code Endorsement Count Applicant 4115
Public School Teacher Experience Distribution. Public School Teacher Experience Distribution
 Public School Teacher Experience Distribution Lower Quartile Median Upper Quartile Mode Alabama Percent of Teachers FY Public School Teacher Experience Distribution Lower Quartile Median Upper Quartile
Three-Year Moving Averages by States % Home Internet Access
 Three-Year Moving Averages by States % Home Internet Access Alabama Alaska Arizona Arkansas California Colorado Connecticut Delaware Florida Georgia Hawaii Idaho Illinois Indiana Iowa Kansas Kentucky Louisiana
MAINE (Augusta) Maryland (Annapolis) MICHIGAN (Lansing) MINNESOTA (St. Paul) MISSISSIPPI (Jackson) MISSOURI (Jefferson City) MONTANA (Helena)
 Maryland (Annapolis) MICHIGAN (Lansing) MINNESOTA (St. Paul) MISSISSIPPI (Jackson) MISSOURI (Jefferson City) MONTANA (Helena)") HAWAII () IDAHO () Illinois () MAINE () Maryland () MASSACHUSETTS () NEBRASKA () NEVADA (Carson ) NEW HAMPSHIRE () OHIO () OKLAHOMA ( ) OREGON () TEXAS () UTAH ( ) VERMONT () ALABAMA () COLORADO () INDIANA
HAWAII () IDAHO () Illinois () MAINE () Maryland () MASSACHUSETTS () NEBRASKA () NEVADA (Carson ) NEW HAMPSHIRE () OHIO () OKLAHOMA ( ) OREGON () TEXAS () UTAH ( ) VERMONT () ALABAMA () COLORADO () INDIANA
NON-RESIDENT INDEPENDENT, PUBLIC, AND COMPANY ADJUSTER LICENSING CHECKLIST
 NON-RESIDENT INDEPENDENT, PUBLIC, AND COMPANY ADJUSTER LICENSING CHECKLIST ** Utilize this list to determine whether or not a non-resident applicant may waive the Oklahoma examination or become licensed
BUSINESS DEVELOPMENT OUTCOMES
 BUSINESS DEVELOPMENT OUTCOMES Small Business Ownership Description Total number of employer firms and self-employment in the state per 100 people in the labor force, 2003. Explanation Business ownership
Workers Compensation State Guidelines & Availability
 ALABAMA Alabama State Specific Release Form Control\Release Forms_pdf\Alabama 1-2 Weeks ALASKA ARIZONA Arizona State Specific Release Form Control\Release Forms_pdf\Arizona 7-8 Weeks by mail By Mail ARKANSAS
Englishinusa.com Positions in MSN under different search terms.
 Englishinusa.com Positions in MSN under different search terms. Search Term Position 1 Accent Reduction Programs in USA 1 2 American English for Business Students 1 3 American English for Graduate Students
Impacts of Sequestration on the States
 Impacts of Sequestration on the States Alabama Alabama will lose about $230,000 in Justice Assistance Grants that support law STOP Violence Against Women Program: Alabama could lose up to $102,000 in funds
State Tax Information
 State Tax Information The information contained in this document is not intended or written as specific legal or tax advice and may not be relied on for purposes of avoiding any state tax penalties. Neither
WV County GIS Tax Mapping Programs (January 2012)
") WV County GIS Tax Mapping Programs (January 2012) Populous Counties Utilize GIS A survey that compares 2010 Census population data to county assessors mapping programs reveals that most assessors who reside
WV County GIS Tax Mapping Programs (January 2012) Populous Counties Utilize GIS A survey that compares 2010 Census population data to county assessors mapping programs reveals that most assessors who reside
State Tax Information
 State Tax Information The information contained in this document is not intended or written as specific legal or tax advice and may not be relied on for purposes of avoiding any state tax penalties. Neither
High Risk Health Pools and Plans by State
 High Risk Health Pools and Plans by State State Program Contact Alabama Alabama Health 1-866-833-3375 Insurance Plan 1-334-263-8311 http://www.alseib.org/healthinsurance/ahip/ Alaska Alaska Comprehensive
Chex Systems, Inc. does not currently charge a fee to place, lift or remove a freeze; however, we reserve the right to apply the following fees:
 Chex Systems, Inc. does not currently charge a fee to place, lift or remove a freeze; however, we reserve the right to apply the following fees: Security Freeze Table AA, AP and AE Military addresses*
Licensure Resources by State
 Licensure Resources by State Alabama Alabama State Board of Social Work Examiners http://socialwork.alabama.gov/ Alaska Alaska Board of Social Work Examiners http://commerce.state.ak.us/dnn/cbpl/professionallicensing/socialworkexaminers.as
STATISTICAL BRIEF #273
 STATISTICAL BRIEF #273 December 29 Employer-Sponsored Health Insurance for Employees of State and Local Governments, by Census Division, 28 Beth Levin Crimmel, M.S. Introduction Employees of state and
Net-Temps Job Distribution Network
 Net-Temps Job Distribution Network The Net-Temps Job Distribution Network is a group of 25,000 employment-related websites with a local, regional, national, industry and niche focus. Net-Temps customers'
American C.E. Requirements
 American C.E. Requirements Alaska Board of Nursing Two of the following: 30 contact hours 30 hours of professional nursing activities 320 hours of nursing employment Arizona State Board of Nursing Arkansas
2009-10 STATE AND LOCAL GOVERNMENT TAX AND REVENUE RANKINGS. By Jacek Cianciara
 2009-10 STATE AND LOCAL GOVERNMENT TAX AND REVENUE RANKINGS By Jacek Cianciara Wisconsin Department of Revenue Division of Research and Policy December 12, 2012 TABLE OF CONTENTS Key Findings 3 Introduction
OAK HILL, WEST VIRGINIA
 AVAILABLE SPACE 298 INDUSTRIAL DRIVE BUILDING OAK HILL, WEST VIRGINIA LOCATION Building Address - 298 Industrial Drive Oak Hill, WV 25901 Located in City Limits - No Zoning - Industrial County - Fayette
State Government Subsidies for Retirement Plans Sponsored by Local Governments. National Conference of State Legislatures, January 2010
 Government Subsidies for Retirement Plans Sponsored by Local Governments National Conference of State Legislatures, January 2010 In many states, city and county governments, independent school districts,
Fuel Taxes: December 2012. A State-by-State Comparison
 Fuel Taxes: A -by- Comparison December 2012 The 18th Amendment to the Washington Constitution dedicates motor fuel tax collections to highway purposes. Strategic Planning and Finance Number of s Fuel
Acceptable Certificates from States other than New York
 Alabama 2 2 Professional Educator Certificate 5 Years Teacher Yes Professional Educator Certificate 5 Years Support Services Yes Alaska 2 Regular Certificate, Type A 5 Years, renewable Teacher Yes At least
SOCIAL SECURITY ADMINISTRATION - FIELD OFFICE LIAISONS SSI Contact List
 SOCIAL SECURITY ADMINISTRATION - FIELD OFFICE LIAISONS SSI Contact List Barbour Toni Alfera 320 W Pike Street, Suite 100 City, State, Zip: Clarksburg, WV 26301 Phone: 304-623-5641 TTY: Fax: 304-622-3234
What to Know About State CPA Reciprocity Rules. John Gillett, PhD, CPA Chair, Department of Accounting Bradley University, Peoria, IL
 What to Know About State CPA Reciprocity Rules Paul Swanson, MBA, CPA Instructor of Accounting John Gillett, PhD, CPA Chair, Department of Accounting Kevin Berry, PhD, Assistant Professor of Accounting
AVAILABLE SPACE COLLIERS STEEL BUILDING
 AVAILABLE SPACE COLLIERS STEEL BUILDING LOCATION Building Address - RR 2 Box 450 Located in City Limits - Yes County - Brooke Located in Business/Industrial Park - No Can the Building be Multi-Tenant -
Changes in the Cost of Medicare Prescription Drug Plans, 2007-2008
 Issue Brief November 2007 Changes in the Cost of Medicare Prescription Drug Plans, 2007-2008 BY JOSHUA LANIER AND DEAN BAKER* The average premium for Medicare Part D prescription drug plans rose by 24.5
STATE DATA CENTER. District of Columbia MONTHLY BRIEF
 District of Columbia STATE DATA CENTER MONTHLY BRIEF N o v e m b e r 2 0 1 2 District Residents Health Insurance Coverage 2000-2010 By Minwuyelet Azimeraw Joy Phillips, Ph.D. This report is based on data
How to FindVeterans and Troubled People in Your State
 Y ou ve heard about our computer centers around the state that offer free Internet access and computer instruction, but did you know that our mentors are also trained to help Veterans find resources and
Data show key role for community colleges in 4-year
 Page 1 of 7 (https://www.insidehighered.com) Data show key role for community colleges in 4-year degree production Submitted by Doug Lederman on September 10, 2012-3:00am The notion that community colleges
Part II: Special Education Revenues and Expenditures
 State Special Education Finance Systems, 1999-2000 Part II: Special Education Revenues and Expenditures Thomas Parrish, Jenifer Harr, Jean Wolman, Jennifer Anthony, Amy Merickel, and Phil Esra March 2004
State-Specific Annuity Suitability Requirements
 Alabama Alaska Arizona Arkansas California Colorado Connecticut Delaware District of Columbia Effective 10/16/11: Producers holding a life line of authority on or before 10/16/11 who sell or wish to sell
State Individual Income Taxes: Treatment of Select Itemized Deductions, 2006
 State Individual Income Taxes: Treatment of Select Itemized Deductions, 2006 State Federal Income Tax State General Sales Tax State Personal Property Tax Interest Expenses Medical Expenses Charitable Contributions
State Pest Control/Pesticide Application Laws & Regulations. As Compiled by NPMA, as of December 2011
 State Pest Control/Pesticide Application Laws & As Compiled by NPMA, as of December 2011 Alabama http://alabamaadministrativecode.state.al.us/docs/agr/mcword10agr9.pdf Alabama Pest Control Alaska http://dec.alaska.gov/commish/regulations/pdfs/18%20aac%2090.pdf
NAIC ANNUITY TRAINING Regulations By State
 Select a state below to display the current regulation and requirements, or continue to scroll down. Light grey text signifies states that have not adopted an annuity training program. Alabama Illinois
Schedule B DS1 & DS3 Service
 Schedule B DS1 & DS3 Service SCHEDULE B Private Line Data Services DS1 & DS3 Service... 2 DS-1 Local Access Channel... 2 DS-1 Local Access Channel, New Jersey... 2 DS-1 Local Access Channel, Out-of-State...
Real Progress in Food Code Adoption
 Real Progress in Food Code Adoption The Association of Food and Drug Officials (AFDO), under contract to the Food and Drug Administration, is gathering data on the progress of FDA Food Code adoptions by
The Obama Administration and Community Health Centers
 The Obama Administration and Community Health Centers Community health centers are a critical source of health care for millions of Americans particularly those in underserved communities. Thanks primarily
National Heavy Duty Truck Transportation Efficiency Macroeconomic Impact Analysis
 National Heavy Duty Truck Transportation Efficiency Macroeconomic Impact Analysis Prepared for the: Union of Concerned Scientists 2397 Shattuck Ave., Suite 203 Berkeley, CA 94704 Prepared by: Marshall
Overview of School Choice Policies
 Overview of School Choice Policies Tonette Salazar, Director of State Relations Micah Wixom, Policy Analyst CSG West Education Committee July 29, 2015 Who we are The essential, indispensable member of
BLUEFIELD, WEST VIRGINIA
 AVAILABLE SPACE FRYE ROOFING INC BUILDING LOCATION Building Address - 2000 Princeton Avenue Bluefield, WV 24701 Located in City Limits - Yes Zoning - County - Mercer Located in Business/Industrial Park
LESAGE, WEST VIRGINIA
 AVAILABLE SPACE HADCO BUSINESS PARK BUILDING V LOCATION Building Address - HADCO Business Park 8201 Frazier s Lane (Rte. 2) Lesage, WV 25537 Located in City Limits - No County - Cabell Located in Business/Industrial
In-state Tuition & Fees at Flagship Universities by State 2014-15 Rank School State In-state Tuition & Fees Penn State University Park Pennsylvania 1
 In-state Tuition & Fees at Flagship Universities by State 2014-15 Rank School State In-state Tuition & Fees Penn State University Park Pennsylvania 1 $18,464 New New Hampshire 2 Hampshire $16,552 3 Vermont
State Tax of Social Security Income. State Tax of Pension Income. State
 State Taxation of Retirement Income The following chart shows generally which states tax retirement income, including and pension States shaded indicate they do not tax these forms of retirement State
When the workers compensation system in New York was reformed in 2007, the system worked poorly for both employers and employees.
 New York's workers' comp: High benefits, higher costs New York s workers' comp benefits have risen to enter the mainstream but they cannot explain why employers costs remain so high By Paul Jahn Executive
$7.5 appropriation $6.5 2011 2012 2013 2014 2015 2016. Preschool Development Grants
 School Readiness: High-Quality Early Learning Head Start $10.5 $9.5 $10.1 +$1.5 +17.7% $8.5 $7.5 +$2.1 +27.0% $6.5 for fiscal year 2010 Included in the budget is $1.078 billion to ensure that every Head
Recruitment and Retention Resources By State List
 Recruitment and Retention Resources By State List Alabama $5,000 rural physician tax credit o http://codes.lp.findlaw.com/alcode/40/18/4a/40-18-132 o http://adph.org/ruralhealth/index.asp?id=882 Area Health
14-Sep-15 State and Local Tax Deduction by State, Tax Year 2013
 14-Sep-15 State and Local Tax Deduction by State, Tax Year 2013 (millions) deduction in state dollars) claimed (dollars) taxes paid [1] state AGI United States 44.2 100.0 30.2 507.7 100.0 11,483 100.0
Georgia s Ranking Among the States: Budget, Taxes, and Other Indicators
 THE CENTER FOR STATE AND LOCAL FINANCE JUNE 2015 Georgia s Ranking Among the States: Budget, Taxes, and Other Indicators IN COLLABORATION WITH ABOUT THE CENTER FOR STATE AND LOCAL FINANCE The (CSLF) mission
LPSC Renewable Energy Pilot y RFPs issued by Utility Companies by Order of Commission, November 2010
 Renewable Energy LPSC Renewable Energy Pilot y RFPs issued by Utility Companies by Order of Commission, November 2010 y Searching for various forms of renewable energy and their actual cost in Louisiana
University System of Georgia Enrollment Trends and Projections to 2018
 University System of Georgia Enrollment Trends and Projections to 2018 Introduction: Projections of USG Headcount Enrollment Enrollment projections use past trends and information on other variables to
APPENDIX 6-A. DETAILED DATA FOR EQUIPMENT PRICE MARKUPS TABLE OF CONTENTS
 APPENDIX 6-A. DETAILED DATA FOR EQUIPMENT PRICE MARKUPS TABLE OF CONTENTS 6-A.1 6-A.2 6-A.3 6-A.4 6-A.5 6-A.6 DETAILED WHOLESALER COST DATA... 6-A-1 DETAILED MECHANICAL CONTRACTOR DATA... 6-A-2 DETAILED
Census Data on Uninsured Women and Children September 2009
 March of Dimes Foundation Office of Government Affairs 1146 19 th Street, NW, 6 th Floor Washington, DC 20036 Telephone (202) 659-1800 Fax (202) 296-2964 marchofdimes.com nacersano.org Census Data on Uninsured
Attachment A. Program approval is aligned to NCATE and is outcomes/performance based
 Attachment A The following table provides information on student teaching requirements across several states. There are several models for these requirements; minimum number of weeks, number of required
STATE-SPECIFIC ANNUITY SUITABILITY REQUIREMENTS
 Alabama Alaska Arizona Arkansas California This jurisdiction has pending annuity training legislation/regulation Annuity Training Requirement Currently Effective Initial 8-Hour Annuity Training Requirement:
Economic Impact and Variation in Costs to Provide Community Pharmacy Services
 Economic Impact and Variation in Costs to Provide Community Pharmacy Services Todd Brown MHP, R.Ph. Associate Clinical Specialist and Vice Chair Department of Pharmacy Practice School of Pharmacy Northeastern
Employment and Earnings of Registered Nurses in 2010
 Employment and Earnings of Registered Nurses in 2010 Thursday, May 25, 2011 The Bureau of Labor Statistics (BLS) released 2010 occupational employment data on May 17, 2011. This document provides several
EMBARGOED UNTIL 6:00 AM ET WEDNESDAY, NOVEMBER 30, 2011
 A State-by-State Look at the President s Payroll Tax Cuts for Middle-Class Families An Analysis by the U.S. Department of the Treasury s Office of Tax Policy The President signed into law a 2 percentage
We do require the name and mailing address of each person forming the LLC.
 Topic: LLC Managers/Members Question by: Jeff Harvey : Idaho Date: March 7, 2012 Manitoba Corporations Canada Alabama Alaska Arizona Arkansas California Colorado Arizona requires that member-managed LLCs
Nurse Aide Training Requirements, 2011
 Nurse Aide Training Requirements, 2011 Background Federal legislation (Omnibus Budget Reconciliation Act of 1987) and associated regulations (42 CFR 483.152) require that Medicare- and Medicaid-certified
State Specific Annuity Suitability Requirements updated 10/10/11
 Alabama Alaska Ai Arizona Arkansas California This jurisdiction has pending annuity training legislation/regulation Initial 8 Hour Annuity Training Requirement: Prior to selling annuities in California,
GOVERNMENT-FINANCED EMPLOYMENT AND THE REAL PRIVATE SECTOR IN THE 50 STATES
 GOVERNMENT-FINANCED EMPLOYMENT AND THE REAL PRIVATE SECTOR IN THE 50 STATES BY KEITH HALL AND ROBERT GREENE November 25, 2013 www.mercatus.org 0.7 2.4 4.2 FEDERAL CONTRACT FUNDED PRIVATE-SECTOR JOBS AS
STATISTICAL BRIEF #435
 STATISTICAL BRIEF #435 April 2014 Premiums and Employee Contributions for Employer-Sponsored Health Insurance: Private versus Public Sector, 2012 Karen E. Davis, MA Introduction Employer-sponsored health
PUBLIC HOUSING AUTHORITY COMPENSATION
 PUBLIC HOUSING AUTHORITY COMPENSATION Background After concerns were raised about the level of compensation being paid to some public housing authority (PHA) leaders, in August 2011 HUD reached out to
List of State Residual Insurance Market Entities and State Workers Compensation Funds
 List of State Residual Insurance Market Entities and State Workers Compensation Funds On November 26, 2002, President Bush signed into law the Terrorism Risk Insurance Act of 2002 (Public Law 107-297,
(In effect as of January 1, 2004*) TABLE 5a. MEDICAL BENEFITS PROVIDED BY WORKERS' COMPENSATION STATUTES FECA LHWCA
 TABLE 5a. MEDICAL BENEFITS PROVIDED BY WORKERS' COMPENSATION STATUTES FECA LHWCA") (In effect as of January 1, 2004*) TABLE 5a. MEDICAL BENEFITS PROVIDED BY WORKERS' COMPENSATION STATUTES Full Medical Benefits** Alabama Indiana Nebraska South Carolina Alaska Iowa Nevada South Dakota
(In effect as of January 1, 2004*) TABLE 5a. MEDICAL BENEFITS PROVIDED BY WORKERS' COMPENSATION STATUTES Full Medical Benefits** Alabama Indiana Nebraska South Carolina Alaska Iowa Nevada South Dakota
LLC Member/Manager Disclosure Question by: Cathy Beaudoin. Jurisdiction. Date: 01 March 2011. LLC Member/Manager Disclosure 2011 March 01
 Topic: LLC Member/Manager Disclosure Question by: Cathy Beaudoin : Maine Date: 01 March 2011 Manitoba Corporations Canada Alabama Alaska Arizona Arkansas California Our statement of information (aka annual
States Ranked by Alcohol Tax Rates: Beer (as of March 2009) Ranking State Beer Tax (per gallon)
 Ranking State Beer Tax (per gallon)") States Ranked by Alcohol Tax Rates: Beer (as of March 2009) Ranking State Beer Tax (per gallon) Sales Tax Applied 1 Wyoming $0.02 4% 2 4 8 10 Missouri $0.06 4.225% Wisconsin $0.06 5% Colorado $0.08 2.9%
States Ranked by Alcohol Tax Rates: Beer (as of March 2009) Ranking State Beer Tax (per gallon) Sales Tax Applied 1 Wyoming $0.02 4% 2 4 8 10 Missouri $0.06 4.225% Wisconsin $0.06 5% Colorado $0.08 2.9%
california Health Care Almanac Health Care Costs 101: California Addendum
 california Health Care Almanac : California Addendum May 2012 Introduction Health spending represents a significant share of California s economy, but the amounts spent on health care rank among the lowest
REPORT SPECIAL. States Act to Help People Laid Off from Small Firms: More Needs to Be Done. Highlights as of April 14, 2009
 REPORT April 2009 States Act to Help People Laid Off from Small Firms: More Needs to Be Done In the past two months, several states have taken action to make sure state residents who lose their jobs in
State by State Summary of Nurses Allowed to Perform Conservative Sharp Debridement
 State by State Summary of Nurses Allowed to Perform Conservative Sharp Debridement THE FOLLOWING ARE ONLY GENERAL SUMMARIES OF THE PRACTICE ACTS EACH STATE HAS REGARDING CONSERVATIVE SHARP DEBRIDEMENT
Strengthening and Enhancing West Virginia s Medicaid Program:
 Strengthening and Enhancing West Virginia s Medicaid Program: Overview of the Managed Care Organization (MCO) Program Benefit Expansion August 2013 Prepared for: BMS Provider Training Workshops Presentation
Medicare Advantage Cuts in the Affordable Care Act: March 2013 Update Robert A. Book l March 2013
 Medicare Advantage Cuts in the Affordable Care Act: March 2013 Update Robert A. Book l March 2013 The Centers for Medicare and Medicaid Services (CMS) recently announced proposed rules that would cut payments
Compulsory Auto Insurance and Financial Responsibility Laws State Reporting Programs
 NATIONAL CONFERENCE OF STATE LEGISLATURES EMPLOYMENT AND INSURANCE PROGRAM Compulsory Auto Insurance and Laws State Reporting Programs 1 Alabama 32-7-6 32-7A-6 2000 32-7A-7 32-7A-7 Alaska 28.20 28.22.011
DAVISVILLE, WEST VIRGINIA
 AVAILABLE SPACE POLYMER TECHNOLOGY PARK SPEC BUILDING LOCATION Building Address - 245 Polymer Way Davisville, WV 26142 Located in City Limits - No Zoning - None County - Wood Located in Business/Industrial
Nurse Aide Training Requirements, October 2014
 Nurse Aide Training Requirements, October 2014 Background Federal legislation (Omnibus Budget Reconciliation Act of 1987) and associated regulations (42 CFR 483.152) require that Medicare- and Medicaid-certified
Connecticut s Insurance Industry: Economic Impacts & Contributions
 Connecticut s Insurance Industry: Economic Impacts & Contributions Prepared by: Connecticut Economic Resource Center, Inc. December 2006 2006 Insure Connecticut s Future, Connecticut Insurance and Financial
Workers Compensation Cost Data
 Workers Compensation Cost Data Edward M. Welch Workers Compensation Center School of Labor and Industrial Relations Michigan State University E-mail: [email protected] Web Page: http://www.lir.msu.edu/wcc/
Use of "Mail Box" service. Date: April 6, 2015. [Use of Mail Box Service] [April 6, 2015]
![Use of Mail Box service. Date: April 6, 2015. [Use of Mail Box Service] [April 6, 2015]](/thumbs/26/8624083.jpg "Use of Mail Box service. Date: April 6, 2015. [Use of Mail Box Service] [April 6, 2015]") Topic: Question by: : Use of "Mail Box" service Kathy M. Sachs Kansas Date: April 6, 2015 Manitoba Corporations Canada Alabama Alaska Arizona Arkansas California Colorado Connecticut Delaware District
Topic: Question by: : Use of "Mail Box" service Kathy M. Sachs Kansas Date: April 6, 2015 Manitoba Corporations Canada Alabama Alaska Arizona Arkansas California Colorado Connecticut Delaware District
Real Progress in Food Code Adoption
 Real Progress in Food Code Adoption August 27, 2013 The Association of Food and Drug Officials (AFDO), under contract to the Food and Drug Administration, is gathering data on the progress of FDA Food
JOINT ECONOMIC COMMITTEE DEMOCRATS
 JOINT ECONOMIC COMMITTEE DEMOCRATS SENATOR JACK REED (D-RI) RANKING DEMOCRAT ECONOMIC POLICY BRIEF SEPTEMBER 2005 THE NUMBER OFAMERICANS WITHOUT HEALTH INSURANCE GREW BY 860,000 IN 2004, INCREASING FOR
THE 2013 HPS SALARY SURVEY
 THE 2013 HPS SALARY SURVEY Stephen L. Bump Introduction The 2013 Health Physics Society (HPS) survey data was collected by having health physicists (HPs) submit their responses to survey questions on a
SECTION 109 HOST STATE LOAN-TO-DEPOSIT RATIOS. The Board of Governors of the Federal Reserve System (Board), the Federal Deposit
, the Federal Deposit") SECTION 109 HOST STATE LOAN-TO-DEPOSIT RATIOS The Board of Governors of the Federal Reserve System (Board), the Federal Deposit Insurance Corporation (FDIC), and the Office of the Comptroller of the Currency
SECTION 109 HOST STATE LOAN-TO-DEPOSIT RATIOS The Board of Governors of the Federal Reserve System (Board), the Federal Deposit Insurance Corporation (FDIC), and the Office of the Comptroller of the Currency
Supplier Business Continuity Survey - Update Page 1
 Supplier Business Continuity Survey - Update Page 1 Supplier Business Continuity Survey A response is required for every question General Information Supplier Name: JCI Supplier Number: Supplier Facility
REPORT OF FINDINGS NURSING FACILITY STAFFING SURVEY 2010
 REPORT OF FINDINGS NURSING FACILITY STAFFING SURVEY 2010 October, 2011 ABSTRACT Approximately 2 million workers were employed at nursing facilities across the United States in 2010. 1.3 million nursing
THE 2012 HPS SALARY SURVEY
 THE 2012 HPS SALARY SURVEY Gary Lauten Introduction The 2012 Health Physics Society (HPS) survey data was collected by having health physicists (HPs) submit their responses to survey questions on a webbased
********************
 THE SURETY & FIDELITY ASSOCIATION OF AMERICA 1101 Connecticut Avenue, N.W., Suite 800 Washington, D. C. 20036 Phone: (202) 463-0600 Fax: (202) 463-0606 Web page: www.surety.org APPLICATION Application
PPD Benefits by State
 PPD Benefits by State Michigan State University, 2008 A Caution about These Summaries We will list below summaries of how permanent partial benefits are paid in each state. We caution that these are intended
2015 National Utilization and Compensation Survey Report. Section 3 Billing Rates. Based on Data Collected: 4 th Quarter 2014
 2015 National Utilization and Compensation Survey Report Section 3 Billing s Based on Data Collected: 4 th Quarter Copyright 2015 Reproduction of this report or portions thereof without express written