Investigating the genetic basis for intelligence
|
|
|
- Hannah Hamilton
- 9 years ago
- Views:
Transcription
1 Investigating the genetic basis for intelligence Steve Hsu University of Oregon and BGI

2 Outline: a multidisciplinary subject 1. What is intelligence? Psychometrics 2. g and GWAS: a project with BGI (formerly Beijing Genomics Institute) 3. The future These slides: ggoogle.pdf
 3. The future www.cog-genomics.")
3 Outline: a multidisciplinary subject VARIABILITY AND CONSILIENT REDUCTIONISM evolution genes brain population genetics molecular biology genetic epidemiology cognitive neuroscience the real world e.g., cognitive epidemiology ABILITY VARIATION cognitive psychology cognitive architecture

4 What is Intelligence: IQ / SAT / GRE? Operational perspective: who cares, as long as they have predictive power! 1. Stability / Reliability (measured value doesn t change) 2. Validity (predictive power; measures something real?) 3. Heritability (genetic causes) We ll see that intelligence is comparable to height on each of these criteria.
 3.")
5 What are IQ / SAT / GRE? By construction: I. Choose a battery of n cognitive tests, e.g., (1) digit recall (short term memory) (2) vocabulary (3) math puzzles (4) spatial rotations (n-1) reaction time (n) pitch recognition (music) II. Test a lot of people. {individual} n vector scalar (single number) (LOSSY) COMPRESSION!
 digit recall (short term memory) (2) vocabulary (3) math puzzles (4)")
6 Results All cognitive observables seem to be positively correlated Use factor analysis or principal components to isolate direction of largest variation in the n-dimensional space

7 General factor of intelligence Largest principal component of variation Dimension identified by factor analysis = g factor = general factor of intelligence IQ SAT GRE overall goodness of cognitive functioning? Note these are population level correlations compression may not work for a particular individual: value of g may not predict individual components of n-vector very well. But works for typical individuals. SAT, GRE heavily g-loaded: high correlation with g or IQ; SAT is an IQ test IQ: mean 100, SD 15 SAT (M+V): mean 1000, SD 200 (normally distributed) (1995 recentering )

8 Progressive Matrices Highly g loaded but relatively culture neutral and abstract. Pattern recognition and algorithmic reasoning.

9 Results left fig. Vocabulary, SAT and RAPM intercorrelation. right fig. Reaction time differences for two groups.

10 What good is it? PRO: Among the most impressive quantitative results in all of psychology. 1. Results are stable after late adolescence (reliability). One year retest correlation.9 or higher. 2. Results are predictive (validity). 3. It s heritable (twin studies). Gulp! CON: Only explains small fraction of variance in life outcomes.
. 3.")
11 Life outcomes Can further control for SES (socio-economic status) by considering sibling pairs with different IQs.

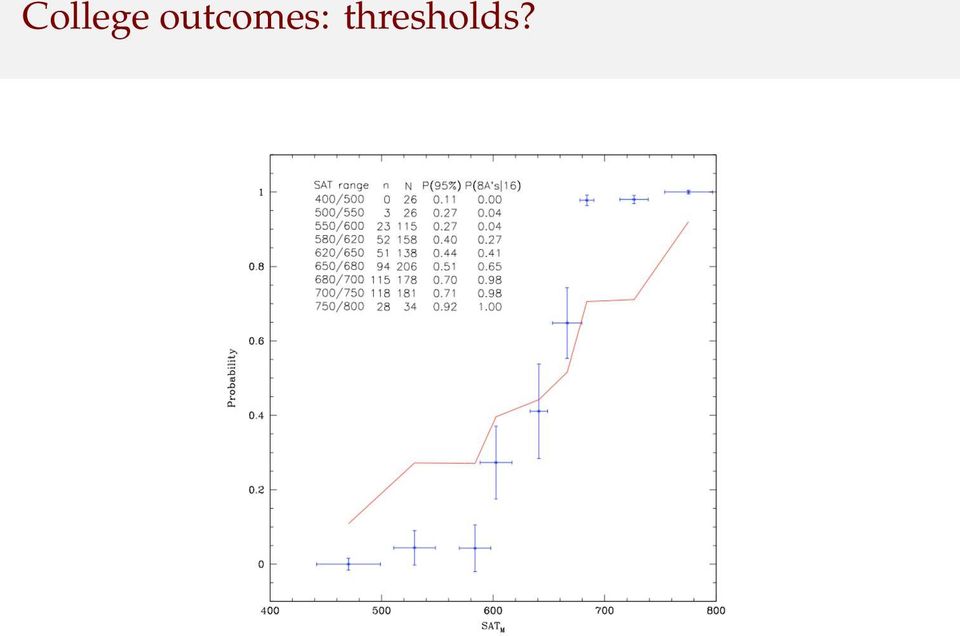
12 College outcomes: two factor working model Factor 1: SAT (cognitive ability) Factor 2: Conscientiousness, work ethic, motivation... These factors are only weakly correlated with each other. To what extent can Factor 2 compensate for Factor 1? For fixed values of SAT, what is the range of outcomes in college performance? Are there cognitive thresholds for certain subjects, such that mastery is very unlikely below a certain SAT threshold (i.e., no matter how dedicated or hard working the student)?
?")
13 College outcomes Data Mining the University, Hsu and Schombert, arxiv: Analysis of 5 years of student records at the University of Oregon.

14 College outcomes

15 College outcomes: thresholds? Nonlinear Psychometric Thresholds for Physics and Mathematics, Hsu and Schombert, arxiv:

16 College outcomes: thresholds?
17 The far tail What about the far tail? +2 SD 130 top few percent +3 SD in SD in 30,000 Diminishing returns above some threshold (e.g., 120)? OR It s good to have a big brain... BIGGER IS BETTER :-) Answer: IT DEPENDS...

18 The far tail Not much data. Roe study (1950 s): 64 randomly selected eminent scientists had IQs much higher than the general population of science PhDs. Almost all of the eminent scientists in the sample scored above +(3-4) SD in at least one of M / V categories. Mean score in both categories was roughly +4 SD. Average for science PhDs around +2 SD, so eminent group highly atypical among scientists. Positive returns to IQ > +2 SD in scientific research?
 SD in at least one of M / V categories.")
19 The far tail SMPY longitudinal study. Children tested at age 13 or younger. First quartile Q1 roughly top percentile, top quartile Q4 roughly 1 in 10,000.

20 Your kids and regression Assuming parental midpoint of n SD above the population average, the kids IQ will be normally distributed about a mean which is around +.6n with residual SD of about 13 points. (The.6 could actually be anywhere in the range (.5,.7), but the SD doesn t vary much from choice of empirical inputs.) So, e.g., for n = 4 (parental midpoint of 160 very smart parents!), the mean for the kids would be 136 with only a few percent chance of any kid to surpass 160 (requires 2 SD fluctuation). For n = 3 (parental midpoint of 145) the mean for the kids would be 127 and the probability of exceeding 145 less than 10 percent.
, the mean for the kids would be 136 with only a few percent chance of any kid to surpass 160 (requires 2 SD fluctuation).")
21 Heritability and Linearity g is highly heritable and effect of individual genes is mostly linear: many genes, each of small effect. (Additive heritability about.6; broad sense heritability about.8; similar to height!)
22 Heritability and Linearity
23 Linearity: many genes of small effect 1. g is normally distributed 2. genetic component is approximately linear in effect (additive heritability.6 out of.8 total) Can think in terms of + and effects from alleles. Characterize an individual in terms of which variants they inherit at each of n sites: ( ) Coin flips with probability p i at each site yields normal distribution as n.
24 g and GWAS GWAS = Genome Wide Association Study. Thus far, little success in finding genes linked to intelligence (Plomin 2010). Candidate hits have not been successfully replicated. Compare to the situation with height: about 200 genes found so far correlated to height. Only 5 or 10 percent of total variance associated with specific loci ( missing heritability ), but over 50 percent or more of total variance from global fit. There is a historic opportunity to conduct the first study that finds a significant number of IQ-associated genes.
25 BGI: formerly Beijing Genomics Institute Headquarters in Shenzhen, China. Raised funding of US $ 1.6 billion. Nearly 5000 employees (1000 in software development alone). More sequencing power than any academic lab in US or Europe. Aims to become leading platform for sequencing and bioinformatics. Eventually, 1000 genomes sequenced per day at less than $ 1000 per genome. Previous successes: participant in original Human Genome Project (1 percent), rice genome, Panda genome, Tibetan altitude adaptation, early hominid sequence, over 1000 Han genomes sequenced.
26 BGI
27 Han study: high-normal design Seek 10 3 or more subjects with IQ +3 SD or higher (roughly 1 in 1000). Conveniently pre-filtered population: students invited to training camps for physics, math and informatics Olympiads. Each student ranked roughly top 5 in his or her province, roughly 100 per subject per year in China. Math ability, possibly as high as +4 SD, general intelligence probably roughly +3 SD. Randomized testing to check these estimates. Search for volunteers among this population already under way.
28 Rough estimates Simple model: N genes of equal small effect. (i.e., N 10 3 ). Let + allele have slightly positive effect on IQ, and allele have slightly negative effect. Assume high group average is +k SD, so k (3 4). Then difference in frequencies between high and normal groups is f H + f N + k 2 N How well can we measure f + in the two populations? Statistical 1 fluctuations: 2, where M is population size. M Once M > N, have good power to detect + alleles. (False positives: 10 3 variants of interest, 10 6 SNPs on chip; need signal to noise ratio of > 10 3 or so.)
29 Power calculations Expected hits assuming IQ allele frequencies and effect sizes similar to height. GWAS POWER: 2000 CASES, 4000 CONTROLS case lower threshold = 3.5 SD total expected hits: 3.51 average effect MAF
30 The Future Expect full sequencing (not just SNP genotyping) of 10 5 to 10 6 individuals within next 5 years, paid for by science agencies of national governments. Total cost roughly US $1 billion or so... comparable to first genome sequenced by Human Genome Project! IF sufficient phenotype data is collected about these individuals, will have very well-powered GWAS studies within next few years enough statistical power to capture a good fraction of total additive variance (about.6 for intelligence). What can we do with this information?
31 Please help! Free genotyping! If you are cognitively gifted, please participate in our study. Free genotyping: initially SNPs, later possibly exome or whole genome sequencing. Learn about your ancestry and health.
32 Please help! Free genotyping! Some automatic qualifying criteria: SAT (post 1995) M800 V760 SAT (pre 1995) M780 V700 GRE Q800 V700 ACT 35 PhD from top 5 ranked US program in physics, math, EE, theoretical computer science. Honorable mention or better (top 50 or so in US) in Putnam competition.
33 Consider making a donation! VARIABILITY AND CONSILIENT REDUCTIONISM evolution genes brain population genetics molecular biology genetic epidemiology cognitive neuroscience the real world e.g., cognitive epidemiology ABILITY VARIATION cognitive psychology cognitive architecture
Estimate a WAIS Full Scale IQ with a score on the International Contest 2009
 Estimate a WAIS Full Scale IQ with a score on the International Contest 2009 Xavier Jouve The Cerebrals Society CognIQBlog Although the 2009 Edition of the Cerebrals Society Contest was not intended to
The Human Genome. Genetics and Personality. The Human Genome. The Human Genome 2/19/2009. Chapter 6. Controversy About Genes and Personality
 The Human Genome Chapter 6 Genetics and Personality Genome refers to the complete set of genes that an organism possesses Human genome contains 30,000 80,000 genes on 23 pairs of chromosomes The Human
. 58 58 60 62 64 66 68 70 72 74 76 78 Father s height (inches)
") PEARSON S FATHER-SON DATA The following scatter diagram shows the heights of 1,0 fathers and their full-grown sons, in England, circa 1900 There is one dot for each father-son pair Heights of fathers and
PEARSON S FATHER-SON DATA The following scatter diagram shows the heights of 1,0 fathers and their full-grown sons, in England, circa 1900 There is one dot for each father-son pair Heights of fathers and
Evolution, Natural Selection, and Adaptation
 Evolution, Natural Selection, and Adaptation Nothing in biology makes sense except in the light of evolution. (Theodosius Dobzhansky) Charles Darwin (1809-1882) Voyage of HMS Beagle (1831-1836) Thinking
Measurement: Reliability and Validity
 Measurement: Reliability and Validity Y520 Strategies for Educational Inquiry Robert S Michael Reliability & Validity-1 Introduction: Reliability & Validity All measurements, especially measurements of
Correlational Research. Correlational Research. Stephen E. Brock, Ph.D., NCSP EDS 250. Descriptive Research 1. Correlational Research: Scatter Plots
 Correlational Research Stephen E. Brock, Ph.D., NCSP California State University, Sacramento 1 Correlational Research A quantitative methodology used to determine whether, and to what degree, a relationship
GOBII. Genomic & Open-source Breeding Informatics Initiative
 GOBII Genomic & Open-source Breeding Informatics Initiative My Background BS Animal Science, University of Tennessee MS Animal Breeding, University of Georgia Random regression models for longitudinal
Testosterone levels as modi ers of psychometric g
 Personality and Individual Di erences 28 (2000) 601±607 www.elsevier.com/locate/paid Testosterone levels as modi ers of psychometric g Helmuth Nyborg a, *, Arthur R. Jensen b a Institute of Psychology,
Course Requirements for the Ph.D., M.S. and Certificate Programs
 Health Informatics Course Requirements for the Ph.D., M.S. and Certificate Programs Health Informatics Core (6 s.h.) All students must take the following two courses. 173:120 Principles of Public Health
Statistics. Measurement. Scales of Measurement 7/18/2012
 Statistics Measurement Measurement is defined as a set of rules for assigning numbers to represent objects, traits, attributes, or behaviors A variableis something that varies (eye color), a constant does
Chapter 4. Quantitative genetics: measuring heritability
 Chapter 4 Quantitative genetics: measuring heritability Quantitative genetics: measuring heritability Introduction 4.1 The field of quantitative genetics originated around 1920, following statistical
Biology 1406 - Notes for exam 5 - Population genetics Ch 13, 14, 15
 Biology 1406 - Notes for exam 5 - Population genetics Ch 13, 14, 15 Species - group of individuals that are capable of interbreeding and producing fertile offspring; genetically similar 13.7, 14.2 Population
Statistics Graduate Courses
 Statistics Graduate Courses STAT 7002--Topics in Statistics-Biological/Physical/Mathematics (cr.arr.).organized study of selected topics. Subjects and earnable credit may vary from semester to semester.
standardized tests used to assess mental ability & development, in an educational setting.
 Psychological Testing & Intelligence the most important aspect of knowledge about genetic variability is that it gives us respect for people s individual differences. We are not all balls of clay that
AP Statistics Solutions to Packet 2
 AP Statistics Solutions to Packet 2 The Normal Distributions Density Curves and the Normal Distribution Standard Normal Calculations HW #9 1, 2, 4, 6-8 2.1 DENSITY CURVES (a) Sketch a density curve that
6.4 Normal Distribution
 Contents 6.4 Normal Distribution....................... 381 6.4.1 Characteristics of the Normal Distribution....... 381 6.4.2 The Standardized Normal Distribution......... 385 6.4.3 Meaning of Areas under
There are basically three options available for overcoming barriers to learning:
 COGNITIVE SKILLS DEVELOPMENT Teacher Introduction Determining Your Students Weaknesses (Excerpts from article by Dr. Ken Gibson, Founder and CEO of LearningRx) Do you have students who struggle to understand
Experimental methods. Elisabeth Ahlsén Linguistic Methods Course
 Experimental methods Elisabeth Ahlsén Linguistic Methods Course Experiment Method for empirical investigation of question or hypothesis 2 types a) Lab experiment b) Naturalistic experiment Question ->
Observing and describing the behavior of a subject without influencing it in any way.
 HOW TO CHOOSE FROM THE DIFFERENT RESEARCH METHODS* The design is the structure of any scientific work. It gives direction and systematizes the research. The method you choose will affect your results and
Mendelian and Non-Mendelian Heredity Grade Ten
 Ohio Standards Connection: Life Sciences Benchmark C Explain the genetic mechanisms and molecular basis of inheritance. Indicator 6 Explain that a unit of hereditary information is called a gene, and genes
Basics of Marker Assisted Selection
 asics of Marker ssisted Selection Chapter 15 asics of Marker ssisted Selection Julius van der Werf, Department of nimal Science rian Kinghorn, Twynam Chair of nimal reeding Technologies University of New
Ph.D. in Bioinformatics and Computational Biology Degree Requirements
 Ph.D. in Bioinformatics and Computational Biology Degree Requirements Credits Students pursuing the doctoral degree in BCB must complete a minimum of 90 credits of relevant work beyond the bachelor s degree;
PhD in Computer Science at North Carolina A&T State University
 PhD in Computer Science at North Carolina A&T State University December 5, 2013 Contents Admission...1 Program Requirements...2 Course Work...2 Advisory Committee...2 Residency and Other Requirements...2
DESCRIPTIVE STATISTICS. The purpose of statistics is to condense raw data to make it easier to answer specific questions; test hypotheses.
 DESCRIPTIVE STATISTICS The purpose of statistics is to condense raw data to make it easier to answer specific questions; test hypotheses. DESCRIPTIVE VS. INFERENTIAL STATISTICS Descriptive To organize,
MATH 140 Lab 4: Probability and the Standard Normal Distribution
 MATH 140 Lab 4: Probability and the Standard Normal Distribution Problem 1. Flipping a Coin Problem In this problem, we want to simualte the process of flipping a fair coin 1000 times. Note that the outcomes
Part 2: Analysis of Relationship Between Two Variables
 Part 2: Analysis of Relationship Between Two Variables Linear Regression Linear correlation Significance Tests Multiple regression Linear Regression Y = a X + b Dependent Variable Independent Variable
Empirical Methods in Applied Economics
 Empirical Methods in Applied Economics Jörn-Ste en Pischke LSE October 2005 1 Observational Studies and Regression 1.1 Conditional Randomization Again When we discussed experiments, we discussed already
AP Biology Essential Knowledge Student Diagnostic
 AP Biology Essential Knowledge Student Diagnostic Background The Essential Knowledge statements provided in the AP Biology Curriculum Framework are scientific claims describing phenomenon occurring in
People have thought about, and defined, probability in different ways. important to note the consequences of the definition:
 PROBABILITY AND LIKELIHOOD, A BRIEF INTRODUCTION IN SUPPORT OF A COURSE ON MOLECULAR EVOLUTION (BIOL 3046) Probability The subject of PROBABILITY is a branch of mathematics dedicated to building models
Testing Research and Statistical Hypotheses
 Testing Research and Statistical Hypotheses Introduction In the last lab we analyzed metric artifact attributes such as thickness or width/thickness ratio. Those were continuous variables, which as you
Descriptive Statistics
 Descriptive Statistics Primer Descriptive statistics Central tendency Variation Relative position Relationships Calculating descriptive statistics Descriptive Statistics Purpose to describe or summarize
Lecture 6: Single nucleotide polymorphisms (SNPs) and Restriction Fragment Length Polymorphisms (RFLPs)
 and Restriction Fragment Length Polymorphisms (RFLPs)") Lecture 6: Single nucleotide polymorphisms (SNPs) and Restriction Fragment Length Polymorphisms (RFLPs) Single nucleotide polymorphisms or SNPs (pronounced "snips") are DNA sequence variations that occur
Lecture 6: Single nucleotide polymorphisms (SNPs) and Restriction Fragment Length Polymorphisms (RFLPs) Single nucleotide polymorphisms or SNPs (pronounced "snips") are DNA sequence variations that occur
Summary. 16 1 Genes and Variation. 16 2 Evolution as Genetic Change. Name Class Date
 Chapter 16 Summary Evolution of Populations 16 1 Genes and Variation Darwin s original ideas can now be understood in genetic terms. Beginning with variation, we now know that traits are controlled by
Grade 12 Psychology (40S) Outcomes Unedited Draft 1
 Outcomes Unedited Draft 1") Grade 12 Psychology (40S) Outcomes Unedited Draft 1 Theme 1: Introduction and Research Methods Topic 1: Introduction 1.1.1 Define psychology, and list and explain its goals. 1.1.2 Describe and compare
Grade 12 Psychology (40S) Outcomes Unedited Draft 1 Theme 1: Introduction and Research Methods Topic 1: Introduction 1.1.1 Define psychology, and list and explain its goals. 1.1.2 Describe and compare
DesCartes (Combined) Subject: Mathematics Goal: Statistics and Probability
 Subject: Mathematics Goal: Statistics and Probability") DesCartes (Combined) Subject: Mathematics Goal: Statistics and Probability RIT Score Range: Below 171 Below 171 Data Analysis and Statistics Solves simple problems based on data from tables* Compares
DesCartes (Combined) Subject: Mathematics Goal: Statistics and Probability RIT Score Range: Below 171 Below 171 Data Analysis and Statistics Solves simple problems based on data from tables* Compares
Evolution (18%) 11 Items Sample Test Prep Questions
 11 Items Sample Test Prep Questions") Evolution (18%) 11 Items Sample Test Prep Questions Grade 7 (Evolution) 3.a Students know both genetic variation and environmental factors are causes of evolution and diversity of organisms. (pg. 109 Science
Evolution (18%) 11 Items Sample Test Prep Questions Grade 7 (Evolution) 3.a Students know both genetic variation and environmental factors are causes of evolution and diversity of organisms. (pg. 109 Science
Chapter Seven. Multiple regression An introduction to multiple regression Performing a multiple regression on SPSS
 Chapter Seven Multiple regression An introduction to multiple regression Performing a multiple regression on SPSS Section : An introduction to multiple regression WHAT IS MULTIPLE REGRESSION? Multiple
Leading Genomics. Diagnostic. Discove. Collab. harma. Shanghai Cambridge, MA Reykjavik
 Leading Genomics Diagnostic harma Discove Collab Shanghai Cambridge, MA Reykjavik Global leadership for using the genome to create better medicine WuXi NextCODE provides a uniquely proven and integrated
Health Informatics Student Handbook
 Health Informatics Student Handbook Interdisciplinary Graduate Program in Informatics (IGPI) Please see the Interdisciplinary Graduate Program in Informatics Handbook for more information regarding our
Outline. Definitions Descriptive vs. Inferential Statistics The t-test - One-sample t-test
 The t-test Outline Definitions Descriptive vs. Inferential Statistics The t-test - One-sample t-test - Dependent (related) groups t-test - Independent (unrelated) groups t-test Comparing means Correlation
Heritability: Twin Studies. Twin studies are often used to assess genetic effects on variation in a trait
 TWINS AND GENETICS TWINS Heritability: Twin Studies Twin studies are often used to assess genetic effects on variation in a trait Comparing MZ/DZ twins can give evidence for genetic and/or environmental
Feifei Ye, PhD Assistant Professor School of Education University of Pittsburgh [email protected]
 Feifei Ye, PhD Assistant Professor School of Education University of Pittsburgh [email protected] Validity, reliability, and concordance of the Duolingo English Test Ye (2014), p. 1 Duolingo has developed
Delivering the power of the world s most successful genomics platform
 Delivering the power of the world s most successful genomics platform NextCODE Health is bringing the full power of the world s largest and most successful genomics platform to everyday clinical care NextCODE
GENOMIC SELECTION: THE FUTURE OF MARKER ASSISTED SELECTION AND ANIMAL BREEDING
 GENOMIC SELECTION: THE FUTURE OF MARKER ASSISTED SELECTION AND ANIMAL BREEDING Theo Meuwissen Institute for Animal Science and Aquaculture, Box 5025, 1432 Ås, Norway, [email protected] Summary
LAB : THE CHI-SQUARE TEST. Probability, Random Chance, and Genetics
 Period Date LAB : THE CHI-SQUARE TEST Probability, Random Chance, and Genetics Why do we study random chance and probability at the beginning of a unit on genetics? Genetics is the study of inheritance,
Logistic Regression (1/24/13)
") STA63/CBB540: Statistical methods in computational biology Logistic Regression (/24/3) Lecturer: Barbara Engelhardt Scribe: Dinesh Manandhar Introduction Logistic regression is model for regression used
STA63/CBB540: Statistical methods in computational biology Logistic Regression (/24/3) Lecturer: Barbara Engelhardt Scribe: Dinesh Manandhar Introduction Logistic regression is model for regression used
6.2 Normal distribution. Standard Normal Distribution:
 6.2 Normal distribution Slide Heights of Adult Men and Women Slide 2 Area= Mean = µ Standard Deviation = σ Donation: X ~ N(µ,σ 2 ) Standard Normal Distribution: Slide 3 Slide 4 a normal probability distribution
AP: LAB 8: THE CHI-SQUARE TEST. Probability, Random Chance, and Genetics
 Ms. Foglia Date AP: LAB 8: THE CHI-SQUARE TEST Probability, Random Chance, and Genetics Why do we study random chance and probability at the beginning of a unit on genetics? Genetics is the study of inheritance,
SAP HANA Enabling Genome Analysis
 SAP HANA Enabling Genome Analysis Joanna L. Kelley, PhD Postdoctoral Scholar, Stanford University Enakshi Singh, MSc HANA Product Management, SAP Labs LLC Outline Use cases Genomics review Challenges in
LAB : PAPER PET GENETICS. male (hat) female (hair bow) Skin color green or orange Eyes round or square Nose triangle or oval Teeth pointed or square
 female (hair bow) Skin color green or orange Eyes round or square Nose triangle or oval Teeth pointed or square") Period Date LAB : PAPER PET GENETICS 1. Given the list of characteristics below, you will create an imaginary pet and then breed it to review the concepts of genetics. Your pet will have the following
Period Date LAB : PAPER PET GENETICS 1. Given the list of characteristics below, you will create an imaginary pet and then breed it to review the concepts of genetics. Your pet will have the following
THREE DIMENSIONAL REPRESENTATION OF AMINO ACID CHARAC- TERISTICS
 THREE DIMENSIONAL REPRESENTATION OF AMINO ACID CHARAC- TERISTICS O.U. Sezerman 1, R. Islamaj 2, E. Alpaydin 2 1 Laborotory of Computational Biology, Sabancı University, Istanbul, Turkey. 2 Computer Engineering
Comparative genomic hybridization Because arrays are more than just a tool for expression analysis
 Microarray Data Analysis Workshop MedVetNet Workshop, DTU 2008 Comparative genomic hybridization Because arrays are more than just a tool for expression analysis Carsten Friis ( with several slides from
Online Supplement to Polygenic Influence on Educational Attainment. Genotyping was conducted with the Illumina HumanOmni1-Quad v1 platform using
 Online Supplement to Polygenic Influence on Educational Attainment Construction of Polygenic Score for Educational Attainment Genotyping was conducted with the Illumina HumanOmni1-Quad v1 platform using
COMPUTER SCIENCE. Learning Outcomes (Graduate) Graduate Programs in Computer Science. Mission of the Undergraduate Program in Computer Science
 Graduate Programs in Computer Science. Mission of the Undergraduate Program in Computer Science") Stanford University 1 COMPUTER SCIENCE Courses offered by the Department of Computer Science are listed under the subject code CS on the Stanford Bulletin's ExploreCourses web site. The Department of Computer
Stanford University 1 COMPUTER SCIENCE Courses offered by the Department of Computer Science are listed under the subject code CS on the Stanford Bulletin's ExploreCourses web site. The Department of Computer
Current Standard: Mathematical Concepts and Applications Shape, Space, and Measurement- Primary
 Shape, Space, and Measurement- Primary A student shall apply concepts of shape, space, and measurement to solve problems involving two- and three-dimensional shapes by demonstrating an understanding of:
Marker-Assisted Backcrossing. Marker-Assisted Selection. 1. Select donor alleles at markers flanking target gene. Losing the target allele
 Marker-Assisted Backcrossing Marker-Assisted Selection CS74 009 Jim Holland Target gene = Recurrent parent allele = Donor parent allele. Select donor allele at markers linked to target gene.. Select recurrent
STT 200 LECTURE 1, SECTION 2,4 RECITATION 7 (10/16/2012)
") STT 200 LECTURE 1, SECTION 2,4 RECITATION 7 (10/16/2012) TA: Zhen (Alan) Zhang [email protected] Office hour: (C500 WH) 1:45 2:45PM Tuesday (office tel.: 432-3342) Help-room: (A102 WH) 11:20AM-12:30PM,
STT 200 LECTURE 1, SECTION 2,4 RECITATION 7 (10/16/2012) TA: Zhen (Alan) Zhang [email protected] Office hour: (C500 WH) 1:45 2:45PM Tuesday (office tel.: 432-3342) Help-room: (A102 WH) 11:20AM-12:30PM,
Genetics Lecture Notes 7.03 2005. Lectures 1 2
 Genetics Lecture Notes 7.03 2005 Lectures 1 2 Lecture 1 We will begin this course with the question: What is a gene? This question will take us four lectures to answer because there are actually several
College of Public Health Course Bulletin. Credit Hours
 Course abbreviation and number ex. PUBHLTH 3550) Course description Credit Hours Prerequisites or Exclusions Public Health (PUBHLTH) PUBHLTH 1100 Survey of Public Health 1 none PUBHLTH 2010 Introduction
Important Steps to a Career in Higher Education (MA/MS or or PhD)
") Important Steps to a Career in Higher Education (MA/MS or or PhD) 1. Take the right courses Courses to take as an undergraduate, besides typical PSY courses (Intro, Research Methods, Stats): PSY courses
Important Steps to a Career in Higher Education (MA/MS or or PhD) 1. Take the right courses Courses to take as an undergraduate, besides typical PSY courses (Intro, Research Methods, Stats): PSY courses
Research on Adoption and Post-Adoption Services and Supports (PASS)
") Research on Adoption and Post-Adoption Services and Supports (PASS) Based on presentations and publications by Richard P. Barth, Ph.D. Frank A. Daniels Professor UNC School of Social Work Research to Teaching
Research on Adoption and Post-Adoption Services and Supports (PASS) Based on presentations and publications by Richard P. Barth, Ph.D. Frank A. Daniels Professor UNC School of Social Work Research to Teaching
In an experimental study there are two types of variables: Independent variable (I will abbreviate this as the IV)
") 1 Experimental Design Part I Richard S. Balkin, Ph. D, LPC-S, NCC 2 Overview Experimental design is the blueprint for quantitative research and serves as the foundation of what makes quantitative research
1 Experimental Design Part I Richard S. Balkin, Ph. D, LPC-S, NCC 2 Overview Experimental design is the blueprint for quantitative research and serves as the foundation of what makes quantitative research
Descriptive statistics Statistical inference statistical inference, statistical induction and inferential statistics
 Descriptive statistics is the discipline of quantitatively describing the main features of a collection of data. Descriptive statistics are distinguished from inferential statistics (or inductive statistics),
Test Bias. As we have seen, psychological tests can be well-conceived and well-constructed, but
 Test Bias As we have seen, psychological tests can be well-conceived and well-constructed, but none are perfect. The reliability of test scores can be compromised by random measurement error (unsystematic
Building risk prediction models - with a focus on Genome-Wide Association Studies. Charles Kooperberg
 Building risk prediction models - with a focus on Genome-Wide Association Studies Risk prediction models Based on data: (D i, X i1,..., X ip ) i = 1,..., n we like to fit a model P(D = 1 X 1,..., X p )
College Readiness LINKING STUDY
 College Readiness LINKING STUDY A Study of the Alignment of the RIT Scales of NWEA s MAP Assessments with the College Readiness Benchmarks of EXPLORE, PLAN, and ACT December 2011 (updated January 17, 2012)
Graduate Certificate in Systems Engineering
 Graduate Certificate in Systems Engineering Systems Engineering is a multi-disciplinary field that aims at integrating the engineering and management functions in the development and creation of a product,
Effects of Cage Stocking Density on Feeding Behaviors of Group-Housed Laying Hens
 Animal Industry Report AS 651 ASL R2018 2005 Effects of Cage Stocking Density on Feeding Behaviors of Group-Housed Laying Hens R. N. Cook Iowa State University Hongwei Xin Iowa State University, [email protected]
Intelligence. Cognition (Van Selst) Cognition Van Selst (Kellogg Chapter 10)
 Cognition Van Selst (Kellogg Chapter 10)") Intelligence Cognition (Van Selst) INTELLIGENCE What is intelligence? Mutli-component versus monolithic perspective little g (monolithic [Spearman]) [Guilford, Catell, Gardner, ] Two distinct historical
Intelligence Cognition (Van Selst) INTELLIGENCE What is intelligence? Mutli-component versus monolithic perspective little g (monolithic [Spearman]) [Guilford, Catell, Gardner, ] Two distinct historical
Data, Measurements, Features
 Data, Measurements, Features Middle East Technical University Dep. of Computer Engineering 2009 compiled by V. Atalay What do you think of when someone says Data? We might abstract the idea that data are
Example: Credit card default, we may be more interested in predicting the probabilty of a default than classifying individuals as default or not.
 Statistical Learning: Chapter 4 Classification 4.1 Introduction Supervised learning with a categorical (Qualitative) response Notation: - Feature vector X, - qualitative response Y, taking values in C
Why Taking This Course? Course Introduction, Descriptive Statistics and Data Visualization. Learning Goals. GENOME 560, Spring 2012
 Why Taking This Course? Course Introduction, Descriptive Statistics and Data Visualization GENOME 560, Spring 2012 Data are interesting because they help us understand the world Genomics: Massive Amounts
9.63 Laboratory in Visual Cognition. Single Factor design. Single design experiment. Experimental design. Textbook Chapters
 9.63 Laboratory in Visual Cognition Fall 2009 Single factor design Textbook Chapters Chapter 5: Types of variables Chapter 8: Controls Chapter 7: Validity Chapter 11: Single factor design Single design
RESEARCH METHODS IN I/O PSYCHOLOGY
 RESEARCH METHODS IN I/O PSYCHOLOGY Objectives Understand Empirical Research Cycle Knowledge of Research Methods Conceptual Understanding of Basic Statistics PSYC 353 11A rsch methods 01/17/11 [Arthur]
Genetics 1. Defective enzyme that does not make melanin. Very pale skin and hair color (albino)
") Genetics 1 We all know that children tend to resemble their parents. Parents and their children tend to have similar appearance because children inherit genes from their parents and these genes influence
Genetics 1 We all know that children tend to resemble their parents. Parents and their children tend to have similar appearance because children inherit genes from their parents and these genes influence
Foundation of Quantitative Data Analysis
 Foundation of Quantitative Data Analysis Part 1: Data manipulation and descriptive statistics with SPSS/Excel HSRS #10 - October 17, 2013 Reference : A. Aczel, Complete Business Statistics. Chapters 1
11: Intelligence CHAPTER PREVIEW
 11: Intelligence CHAPTER PREVIEW Today, intelligence is generally considered to be the ability to learn from experience, solve problems, and adapt to new situations. Psychologists debate whether intelligence
Russ College of Engineering and Technology. Revised 9/06. 2. Undergraduate GPA of 3.0/4.0 or equivalent.
 Requirements and Guidelines for the Master of Science Degree in Biomedical Engineering Revised 9/06 I. Minimum Entrance Requirements Admission is subject to final approval by the BME Graduate Committee.
Okami Study Guide: Chapter 3 1
 Okami Study Guide: Chapter 3 1 Chapter in Review 1. Heredity is the tendency of offspring to resemble their parents in various ways. Genes are units of heredity. They are functional strands of DNA grouped
WMS III to WMS IV: Rationale for Change
 Pearson Clinical Assessment 19500 Bulverde Rd San Antonio, TX, 28759 Telephone: 800 627 7271 www.pearsonassessments.com WMS III to WMS IV: Rationale for Change Since the publication of the Wechsler Memory
Predict the Popularity of YouTube Videos Using Early View Data
 000 001 002 003 004 005 006 007 008 009 010 011 012 013 014 015 016 017 018 019 020 021 022 023 024 025 026 027 028 029 030 031 032 033 034 035 036 037 038 039 040 041 042 043 044 045 046 047 048 049 050
Chapter 7 COGNITION PRACTICE 240-end Intelligence/heredity/creativity Name Period Date
 Chapter 7 COGNITION PRACTICE 240-end Intelligence/heredity/creativity Name Period Date MULTIPLE CHOICE. Choose the one alternative that best completes the statement or answers the question. 1) Creativity
Supervised Feature Selection & Unsupervised Dimensionality Reduction
 Supervised Feature Selection & Unsupervised Dimensionality Reduction Feature Subset Selection Supervised: class labels are given Select a subset of the problem features Why? Redundant features much or
Chapter 1 Introduction. 1.1 Introduction
 Chapter 1 Introduction 1.1 Introduction 1 1.2 What Is a Monte Carlo Study? 2 1.2.1 Simulating the Rolling of Two Dice 2 1.3 Why Is Monte Carlo Simulation Often Necessary? 4 1.4 What Are Some Typical Situations
A Multi-locus Genetic Risk Score for Abdominal Aortic Aneurysm
 A Multi-locus Genetic Risk Score for Abdominal Aortic Aneurysm Zi Ye, 1 MD, Erin Austin, 1,2 PhD, Daniel J Schaid, 2 PhD, Iftikhar J. Kullo, 1 MD Affiliations: 1 Division of Cardiovascular Diseases and
Section 14 Simple Linear Regression: Introduction to Least Squares Regression
 Slide 1 Section 14 Simple Linear Regression: Introduction to Least Squares Regression There are several different measures of statistical association used for understanding the quantitative relationship
Answer: C. The strength of a correlation does not change if units change by a linear transformation such as: Fahrenheit = 32 + (5/9) * Centigrade
 * Centigrade") Statistics Quiz Correlation and Regression -- ANSWERS 1. Temperature and air pollution are known to be correlated. We collect data from two laboratories, in Boston and Montreal. Boston makes their measurements
Statistics Quiz Correlation and Regression -- ANSWERS 1. Temperature and air pollution are known to be correlated. We collect data from two laboratories, in Boston and Montreal. Boston makes their measurements
research/scientific includes the following: statistical hypotheses: you have a null and alternative you accept one and reject the other
 1 Hypothesis Testing Richard S. Balkin, Ph.D., LPC-S, NCC 2 Overview When we have questions about the effect of a treatment or intervention or wish to compare groups, we use hypothesis testing Parametric
Q FACTOR ANALYSIS (Q-METHODOLOGY) AS DATA ANALYSIS TECHNIQUE
 AS DATA ANALYSIS TECHNIQUE") Q FACTOR ANALYSIS (Q-METHODOLOGY) AS DATA ANALYSIS TECHNIQUE Gabor Manuela Rozalia Petru Maior Univerity of Tg. Mure, Faculty of Economic, Legal and Administrative Sciences, [email protected], 0742
Q FACTOR ANALYSIS (Q-METHODOLOGY) AS DATA ANALYSIS TECHNIQUE Gabor Manuela Rozalia Petru Maior Univerity of Tg. Mure, Faculty of Economic, Legal and Administrative Sciences, [email protected], 0742
MATHEMATICS AS THE CRITICAL FILTER: CURRICULAR EFFECTS ON GENDERED CAREER CHOICES
 MATHEMATICS AS THE CRITICAL FILTER: CURRICULAR EFFECTS ON GENDERED CAREER CHOICES Xin Ma University of Kentucky, Lexington, USA Using longitudinal data from the Longitudinal Study of American Youth (LSAY),
The Mozart effect Methods of Scientific Research
 The Mozart effect Methods of Scientific Research Chapter 2 Experimental Research: p42 49 http://www.mozarteffect.com/ http://www.amazon.com/mozart-sonata-pianos-schubert-fantasia/dp/b0000cf330 http://www.youtube.com/watch?v=hhqn2qjhlcm
Test-Retest Reliability and The Birkman Method Frank R. Larkey & Jennifer L. Knight, 2002
 Test-Retest Reliability and The Birkman Method Frank R. Larkey & Jennifer L. Knight, 2002 Consultants, HR professionals, and decision makers often are asked an important question by the client concerning
Linear functions Increasing Linear Functions. Decreasing Linear Functions
 3.5 Increasing, Decreasing, Max, and Min So far we have been describing graphs using quantitative information. That s just a fancy way to say that we ve been using numbers. Specifically, we have described
GAW 15 Problem 3: Simulated Rheumatoid Arthritis Data Full Model and Simulation Parameters
 GAW 15 Problem 3: Simulated Rheumatoid Arthritis Data Full Model and Simulation Parameters Michael B Miller , Michael Li , Gregg Lind , Soon-Young
A Procedure for Classifying New Respondents into Existing Segments Using Maximum Difference Scaling
 A Procedure for Classifying New Respondents into Existing Segments Using Maximum Difference Scaling Background Bryan Orme and Rich Johnson, Sawtooth Software March, 2009 Market segmentation is pervasive
Which WJ-III Subtests Should I Administer?
 Which WJ-III Subtests Should I Administer? P R E S E N T E D B Y : J U D D F R E D S T R O M A R E A S P E C I A L E D U C A T I O N C O O P A S E C. N E T Woodcock-Johnson III tests of Achievement Eligibility