SAP Dashboard. Mohammed Wahaj
|
|
|
- Ada Nelson
- 8 years ago
- Views:
Transcription
1 SAP Dashboard Mohammed Wahaj

2 Interactive analytics is an analytic capability and Dashboard is an information delivery capability. Gatner SAP Dashboard is one of the products which is offered under the SAP Business Objects solutions for businesses SAP Dashboard was previously known as SAP Xcelsius SAP acquired ALG software, which helped launch SAP Xcelsius in the year 2006, which turns data in to interactive flash Excel data is used to convert it into interactive flash images for users.

3 The powerful data visualization software makes it easier for users to create interactive visual data. Dashboard gives the ability to point and click, making it easier for users to access the software. This software is user friendly, making it easier to navigate through buttons and different options available to users Monitoring performance of the business is easier with the KPI indicators to indicate to users how an organization is doing This tool also helps users access data and the predictions of what the organization would face.

4 What if analysis helps user input data to see what would happen in an organization if certain conditions are applied Makes it easier to input data from other data sources so its easier to access everything in one software. The dashboard results or visual data can be shared in other platforms such as Microsoft Office or PDF files This tools also helps indicate guided navigation for users that aren t tech-savvy and have little knowledge with computers Easy to understand the visualization that are creating by the SAP dashboard

5 Scalable for many users. With the visual interpretation of data its easier for all users to keep cost under control using SAP dashboard SAP dashboard is able to also provide other cost analysis and metrics for users. SAP dashboard would be able to help with process improvement providing balanced scorecards and time-to-value analysis SAP dashboard offers the quickest solutions to the business problems that may be occurring.

6 The managers that are using and implementing these tools are able to monitor metrics effortlessly Ability to drill down to root causes of the issues or problems that the company may be facing Flexible to the needs of the business and its changes High security, making it difficult for anyone without access to view the confidential data The data that is visible in SAP dashboards is real time, so every user accessing the tool is viewing the most current data

7 The scenario planning makes it easier to input future predictions The final dashboard can be used for presentations and portals or reports to display to managers or other users. The visualizations created can be simple or complex making the work more detailed if the user prefers that. Pre loaded templates make it easier for associates get a start on visualizing the data. Dashboard user can; view, refresh, prompt, logon, logout Dashboard designer can; create, delete, modify

8 Queries are used for data analytics SAP dashboard lets users drag and drop queries to visualize in the dashboard The queries can be previewed before the final results are created The data can be filtered edited and refreshed to get the most up to date information Multi column lets users bind into multiple result objects. The users are able to select values to view or hide

9 Different type of label options available to create the best final results The colors can be set using hex, rgb, vga, or decimal scorecard making it easier for users to have many options Some features include; bullet chart, spark lines, forecasting Different options for (date, time, numeric, currency) depending on the location of the users The U.S. metrics can be used or U.K. ones depending on the user preference and their location.

10 The data can be easily reverted back in to analyzer report from the visual data. Business process flow diagram can also be structured based on user needs Shipping, stock trades, call center complaints are some of the example of the business events that can be monitored in SAP dashboard

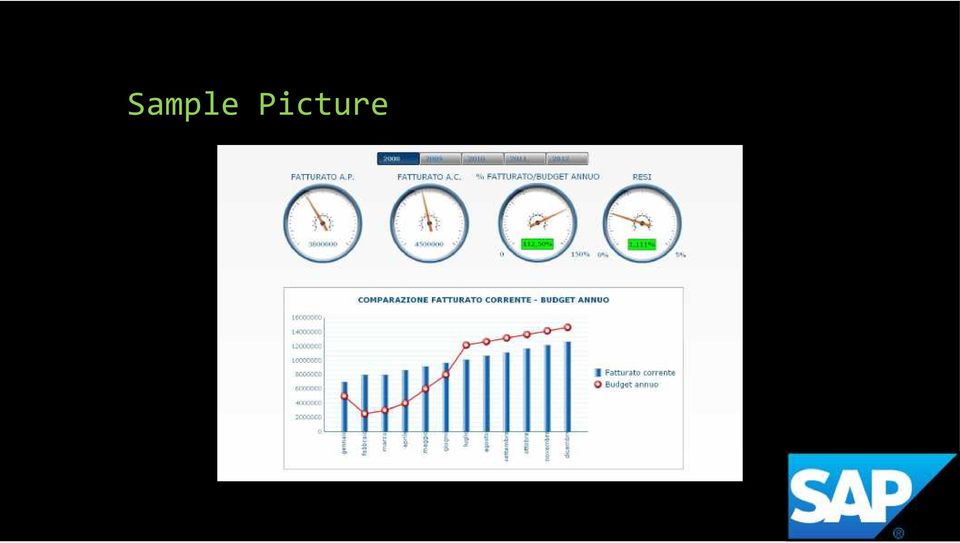
11 Sample Picture

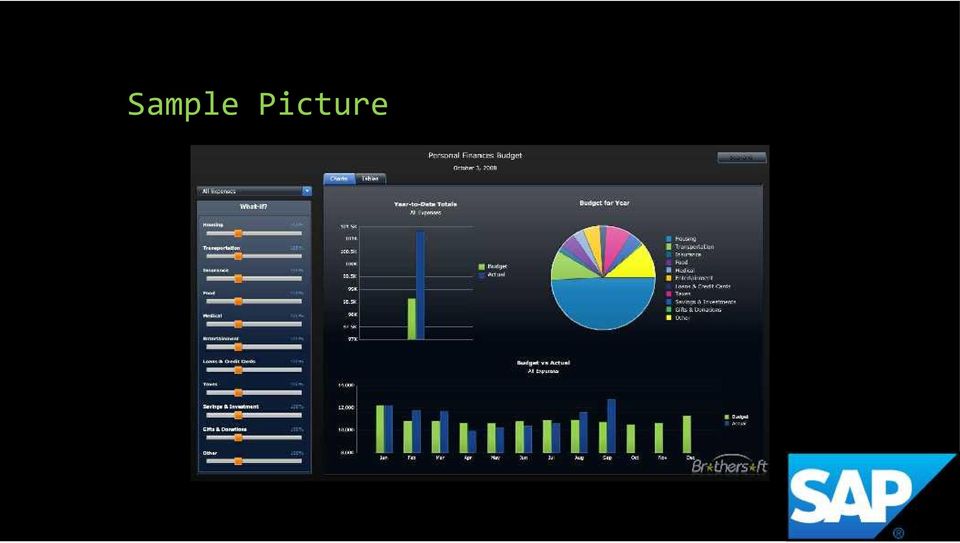
12 Sample Picture
13 Sample Picture

14 Sample Picture
15 References de5d-2e10-77a8-f dc6?overridelayout=true

SAP BusinessObjects Dashboards
 SAP BusinessObjects Dashboards Disclaimer This presentation outlines our general product direction and should not be relied on in making a purchase decision. This presentation is not subject to your license
SAP Crystal Solutions Product Update. Lee Grogan Sales Manager
 SAP Crystal Solutions Product Update Lee Grogan Sales Manager Play intro video Instead of presenting mind numbing spreadsheets or reports. Take Action to Reach Strategic Goals Benefits of Dashboards &
SAS BI Dashboard 4.4. User's Guide Second Edition. SAS Documentation
 SAS BI Dashboard 4.4 User's Guide Second Edition SAS Documentation The correct bibliographic citation for this manual is as follows: SAS Institute Inc. 2013. SAS BI Dashboard 4.4: User's Guide, Second
Welcome to the SAP Business One on HANA release 9.1 delta training on creating advanced dashboards. An advanced dashboard is a type of supplementary
 Welcome to the SAP Business One on HANA release 9.1 delta training on creating advanced dashboards. An advanced dashboard is a type of supplementary cockpit that is launched from the context menu of a
MicroStrategy Desktop
 MicroStrategy Desktop Quick Start Guide MicroStrategy Desktop is designed to enable business professionals like you to explore data, simply and without needing direct support from IT. 1 Import data from
Custom Reporting System User Guide
 Citibank Custom Reporting System User Guide April 2012 Version 8.1.1 Transaction Services Citibank Custom Reporting System User Guide Table of Contents Table of Contents User Guide Overview...2 Subscribe
Business Insight Report Authoring Getting Started Guide
 Business Insight Report Authoring Getting Started Guide Version: 6.6 Written by: Product Documentation, R&D Date: February 2011 ImageNow and CaptureNow are registered trademarks of Perceptive Software,
SMB Intelligence. Reporting
 SMB Intelligence Reporting Introduction Microsoft Excel is one of the most popular business tools for data analysis and light accounting functions. The SMB Intelligence Reporting powered by Solver is designed
Finance Reporting. Millennium FAST. User Guide Version 4.0. Memorial University of Newfoundland. September 2013
 Millennium FAST Finance Reporting Memorial University of Newfoundland September 2013 User Guide Version 4.0 FAST Finance User Guide Page i Contents Introducing FAST Finance Reporting 4.0... 2 What is FAST
Reporting and Analysis with SAP BusinessObjects
 Ingo Hilgefort Reporting and Analysis with SAP BusinessObjects Bonn Boston Contents at a Glance 1 Introduction to the SAP BusinessObjects Reporting and Analysis Tools... 19 2 Customer Requirements and
SAP Business Objects XIR3.0/3.1, BI 4.0 & 4.1 Course Content
 SAP Business Objects XIR3.0/3.1, BI 4.0 & 4.1 Course Content SAP Business Objects Web Intelligence and BI Launch Pad 4.0 Introducing Web Intelligence BI launch pad: What's new in 4.0 Customizing BI launch
for Sage 100 ERP Business Insights Overview Document
 for Sage 100 ERP Business Insights Document 2012 Sage Software, Inc. All rights reserved. Sage Software, Sage Software logos, and the Sage Software product and service names mentioned herein are registered
COGNOS Query Studio Ad Hoc Reporting
 COGNOS Query Studio Ad Hoc Reporting Copyright 2008, the California Institute of Technology. All rights reserved. This documentation contains proprietary information of the California Institute of Technology
QAD Business Intelligence Dashboards Demonstration Guide. May 2015 BI 3.11
 QAD Business Intelligence Dashboards Demonstration Guide May 2015 BI 3.11 Overview This demonstration focuses on one aspect of QAD Business Intelligence Business Intelligence Dashboards and shows how this
Business Intelligence Tools Information Session and Survey. December, 2012
 Business Intelligence Tools Information Session and Survey December, 2012 Agenda Introduction to Business Intelligence (BI) Common Business Intelligence Uses in Higher Education UMass: Mobile President
Market Pricing Override
 Market Pricing Override MARKET PRICING OVERRIDE Market Pricing: Copy Override Market price overrides can be copied from one match year to another Market Price Override can be accessed from the Job Matches
Keep managers better informed on their areas of responsibility and highlight the issues that require their attention with dashboards!
 Meet Your Targets! Effective Performance Management certainly requires more than just the technology to support it. Expertise in KPI development, target setting, framework modeling, dashboard development
Taleo Enterprise. Taleo Reporting Getting Started with Business Objects XI3.1 - User Guide
 Taleo Enterprise Taleo Reporting XI3.1 - User Guide Feature Pack 12A January 27, 2012 Confidential Information and Notices Confidential Information The recipient of this document (hereafter referred to
Which Reporting Tool Should I Use for EPM? Glenn Schwartzberg InterRel Consulting info@interrel.com
 Which Reporting Tool Should I Use for EPM? Glenn Schwartzberg InterRel Consulting info@interrel.com Disclaimer These slides represent the work and opinions of the presenter and do not constitute official
SAP Crystal Solutions. What s New in SAP Crystal Dashboard Design Create Superior Data Visualizations Faster with New Features
 SAP Crystal Solutions What s New in SAP Crystal Dashboard Design Create Superior Data Visualizations Faster with New Features CONTENT 4 Key Features of SAP Crystal Dashboard Design 4 New in SAP Crystal
Release Notes Assistance PSA 2015 Summer Release
 Release Notes Assistance PSA 2015 Summer Release (August 2015) Advanced Opportunity Management The Microsoft Dynamics CRM Opportunity functionality has been extended with Assistance PSA functionality.
TIBCO Spotfire Metrics Modeler User s Guide. Software Release 6.0 November 2013
 TIBCO Spotfire Metrics Modeler User s Guide Software Release 6.0 November 2013 Important Information SOME TIBCO SOFTWARE EMBEDS OR BUNDLES OTHER TIBCO SOFTWARE. USE OF SUCH EMBEDDED OR BUNDLED TIBCO SOFTWARE
Create an Excel BI report and share on SharePoint 2013
 2013 Create an Excel BI report and share on SharePoint 2013 Hands-On Lab Lab Manual This document is provided as-is. Information and views expressed in this document, including URL and other Internet Web
COGNOS 8 Business Intelligence
 COGNOS 8 Business Intelligence QUERY STUDIO USER GUIDE Query Studio is the reporting tool for creating simple queries and reports in Cognos 8, the Web-based reporting solution. In Query Studio, you can
BusinessObjects Enterprise InfoView User's Guide
 BusinessObjects Enterprise InfoView User's Guide BusinessObjects Enterprise XI 3.1 Copyright 2009 SAP BusinessObjects. All rights reserved. SAP BusinessObjects and its logos, BusinessObjects, Crystal Reports,
Creating a Patch Management Dashboard with IT Analytics Hands-On Lab
 Creating a Patch Management Dashboard with IT Analytics Hands-On Lab Description This lab provides a hands-on overview of the IT Analytics Solution. Students will learn how to browse cubes and configure
Excel 2010: Create your first spreadsheet
 Excel 2010: Create your first spreadsheet Goals: After completing this course you will be able to: Create a new spreadsheet. Add, subtract, multiply, and divide in a spreadsheet. Enter and format column
SAS BI Dashboard 3.1. User s Guide
 SAS BI Dashboard 3.1 User s Guide The correct bibliographic citation for this manual is as follows: SAS Institute Inc. 2007. SAS BI Dashboard 3.1: User s Guide. Cary, NC: SAS Institute Inc. SAS BI Dashboard
SAP Business Intelligence (BI) Reporting Training for MM. General Navigation. Rick Heckman PASSHE 1/31/2012
 Reporting Training for MM. General Navigation. Rick Heckman PASSHE 1/31/2012") 2012 SAP Business Intelligence (BI) Reporting Training for MM General Navigation Rick Heckman PASSHE 1/31/2012 Page 1 Contents Types of MM BI Reports... 4 Portal Access... 5 Variable Entry Screen... 5
2012 SAP Business Intelligence (BI) Reporting Training for MM General Navigation Rick Heckman PASSHE 1/31/2012 Page 1 Contents Types of MM BI Reports... 4 Portal Access... 5 Variable Entry Screen... 5
SAP BusinessObjects Business Intelligence Platform Document Version: 4.1 Support Package 5-2014-11-06. Business Intelligence Launch Pad User Guide
 SAP BusinessObjects Business Intelligence Platform Document Version: 4.1 Support Package 5-2014-11-06 Business Intelligence Launch Pad User Guide Table of Contents 1 Document history....7 2 Getting started
Reporting Manual. Prepared by. NUIT Support Center Northwestern University
 Reporting Manual Prepared by NUIT Support Center Northwestern University Updated: February 2013 CONTENTS 1. Introduction... 1 2. Reporting... 1 2.1 Reporting Functionality... 1 2.2 Creating Reports...
WebSphere Business Monitor V7.0 Business space dashboards
 Copyright IBM Corporation 2010 All rights reserved IBM WEBSPHERE BUSINESS MONITOR 7.0 LAB EXERCISE WebSphere Business Monitor V7.0 What this exercise is about... 2 Lab requirements... 2 What you should
WebSphere Business Monitor
 WebSphere Business Monitor Dashboards 2010 IBM Corporation This presentation should provide an overview of the dashboard widgets for use with WebSphere Business Monitor. WBPM_Monitor_Dashboards.ppt Page
How To Create A Powerpoint Intelligence Report In A Pivot Table In A Powerpoints.Com
 Sage 500 ERP Intelligence Reporting Getting Started Guide 27.11.2012 Table of Contents 1.0 Getting started 3 2.0 Managing your reports 10 3.0 Defining report properties 18 4.0 Creating a simple PivotTable
SAP Manufacturing Intelligence By John Kong 26 June 2015
 SAP Manufacturing Intelligence By John Kong 26 June 2015 Agenda Registration Next Generation of SAP Solution for Manufacturing Tea Break SAP Business Analytics Solutions for Manufacturing - Dashboard Design
QAD Business Intelligence Overview Demonstration Guide. May 2015 BI 3.11
 QAD Business Intelligence Overview Demonstration Guide May 2015 BI 3.11 Overview This demonstration shows how QAD Business Intelligence supports the vision of the Effective Enterprise; where every business
Dashboard Overview. Bernd Schneider. Technical Solution Professional BI Microsoft Switzerland bernd.schneider@microsoft.com
 Dashboard Overview Bernd Schneider Technical Solution Professional BI Microsoft Switzerland bernd.schneider@microsoft.com Techdays Bern (8./9. April) http://www.techdays.ch + * Including Microsoft Office
BusinessObjects XI. New for users of BusinessObjects 6.x New for users of Crystal v10
 BusinessObjects XI Delivering extreme Insight Bringing information to new users, in new ways, with unmatched simplicity and context. Broadest and deepest end user capabilities from reporting, to query
Create Beautiful Reports with AWR Cloud and Prove the Value of Your SEO Efforts
 Create Beautiful Reports with AWR Cloud and Prove the Value of Your SEO Efforts It can be difficult sometimes to show your clients the value that they get from your service. Your job, as an SEO, is to
Cloud UC Call Recording Interface in SAP dashboard
 FUSION CLOUD UC CALL RECORDING ADMIN GUIDE Contents: INTRODUCTION...3 LOGGING ON...4 HOME TAB (DASHBOARD)...6 First Look...6 Calls by Category...8 Frequent Callers...9 Calls by Location... 10 Call Handler
How To Learn To Write A Report In A Database On A Microsoft Powerbook
 Crystal Reports XI: Level 1 Course Specifications Course number: 085517 Software: Crystal Reports? Course length: 2.0 day(s) Course Description Crystal Reports XI: Level 1 is the primary recommended course
Business Analytics Enhancements June 2013
 Business Analytics Enhancements June 03 Enhancement Summary June 03 Item # Site Location Enhancement Welcome Page New style - Fonts and colors have changed as a result of the enhanced reporting engine
Rocket CorVu NG. Rocket. Independence from Engineering. Powerful Data Visualization for Critical Decision-Making. brochure
 Rocket CorVu NG Powerful Data Visualization for Critical Decision-Making With Rocket CorVu NG, Business Intelligence (BI) technical users create applications that unlock the power of data to arm users
Accelerate Business Intelligence Adoption with Interactive, Mobile Dashboards
 SAP Brief SAP BusinessObjects Business Intelligence s SAP BusinessObjects Dashboards Objectives Accelerate Business Intelligence Adoption with Interactive, Mobile Dashboards Create high-impact, interactive
Course Descriptions for Focused Learning Classes
 Course Descriptions for Focused Learning Classes Excel Word PowerPoint Access Outlook Adobe Visio Publisher FrontPage Dreamweaver EXCEL Classes Excel Pivot Tables 2 hours Understanding Pivot Tables Examining
ADP Workforce Now V3.0
 ADP Workforce Now V3.0 Manual What s New Checks in and Custom ADP Reporting Grids V12 Instructor Handout Manual Guide V10171180230WFN3 V09171280269ADPR12 2011 2012 ADP, Inc. ADP s Trademarks The ADP Logo
Unified Monitoring Portal Online Help Dashboards
 Unified Monitoring Portal Online Help Dashboards This PDF file contains content from the Unified Monitoring Portal (UMP) Online Help system. It is intended only to provide a printable version of the topics.
Pastel Evolution BIC. Getting Started Guide
 Pastel Evolution BIC Getting Started Guide Table of Contents System Requirements... 4 How it Works... 5 Getting Started Guide... 6 Standard Reports Available... 6 Accessing the Pastel Evolution (BIC) Reports...
Your 2009 Channel Sales Guide
 Your 2009 Channel : This guide is designed to help you identify and qualify Business Intelligence (BI) opportunities for your customers. Business Objects, an SAP company, is the maker of Crystal Reports.
Using Query Browser in Dashboards 4.0: What You Need to Know
 Using Query Browser in Dashboards 4.0: What You Need to Know The BusinessObjects 4.0 release gave birth to a few new interesting features to the BI toolkit. One key enhancement was the addition of the
SAP BO Course Details
 SAP BO Course Details By Besant Technologies Course Name Category Venue SAP BO SAP Besant Technologies No.24, Nagendra Nagar, Velachery Main Road, Address Velachery, Chennai 600 042 Landmark Opposite to
Connecting Users to Data with Xcelsius ]
![Connecting Users to Data with Xcelsius ]](/thumbs/27/11272327.jpg "Connecting Users to Data with Xcelsius ]") [ Connecting Users to Data with Xcelsius ] Kevin Fournier & Gary Bernstein Senior Consultants DataSense Solutions [ CHAVONE JACOBS ASUG INSTALLATION MEMBER MEMBER SINCE: 2003 ALLAN FISHER [ ASUG INSTALLATION
[ Connecting Users to Data with Xcelsius ] Kevin Fournier & Gary Bernstein Senior Consultants DataSense Solutions [ CHAVONE JACOBS ASUG INSTALLATION MEMBER MEMBER SINCE: 2003 ALLAN FISHER [ ASUG INSTALLATION
CUSTOMER SAP Cloud for Analytics User Guide User Guide
 SAP Cloud for Analytics CUSTOMER User Guide Content 1 Welcome to SAP Cloud for Analytics!.... 7 1.1 User Assistance.... 8 1.2 Additional Help Resources....9 2 Home....10 2.1 Creating a Note....10 2.2 Working
Welcome to the delta topic on adding actions to dashboards in SAP Business One, release 9.1 version for SAP HANA.
 Welcome to the delta topic on adding actions to dashboards in SAP Business One, release 9.1 version for SAP HANA. 1 In this topic, you will learn how to design a pervasive dashboard for the HTML5 (or role-based)
Lesson 07: MS ACCESS - Handout. Introduction to database (30 mins)
") Lesson 07: MS ACCESS - Handout Handout Introduction to database (30 mins) Microsoft Access is a database application. A database is a collection of related information put together in database objects.
Lesson 07: MS ACCESS - Handout Handout Introduction to database (30 mins) Microsoft Access is a database application. A database is a collection of related information put together in database objects.
Getting Started with SAP BusinessObjects TM Design Studio
 Xavier Hacking and Jeroen van der A Getting Started with SAP BusinessObjects TM Design Studio Bonn Boston Contents at a Glance 1 Introduction to SAP BusinessObjects Design Studio... 23 2 SAP BusinessObjects
How To Create A Report In Excel
 Table of Contents Overview... 1 Smartlists with Export Solutions... 2 Smartlist Builder/Excel Reporter... 3 Analysis Cubes... 4 MS Query... 7 SQL Reporting Services... 10 MS Dynamics GP Report Templates...
Business Explorer (BEx)
") SAP Business Warehouse/Business Intelligence Reporting Business Explorer (BEx) Washington State HRMS Business Warehouse/Business Intelligence (BW/BI) BW/BI Power User Workshop Materials General Topics
SAP Business Warehouse/Business Intelligence Reporting Business Explorer (BEx) Washington State HRMS Business Warehouse/Business Intelligence (BW/BI) BW/BI Power User Workshop Materials General Topics
Table of Contents. Table of Contents
 Table of Contents Table of Contents Table of Contents... 2 About This Guide... 3 Support and Contact Information... 4 Chapter 1 - Introducing the SolarEdge Monitoring Portal... 5 Chapter 2 - Using the
Excel Reports and Macros
 Excel Reports and Macros Within Microsoft Excel it is possible to create a macro. This is a set of commands that Excel follows to automatically make certain changes to data in a spreadsheet. By adding
QAD Usability Dashboards Demonstration Guide. May 2015 EE2015
 QAD Usability Dashboards Demonstration Guide May 2015 EE2015 Overview This demonstration focuses on one aspect of QAD Usability Dashboards and shows how this functionality supports the vision of the Effective
WebSphere Business Monitor V6.2 Business space dashboards
 Copyright IBM Corporation 2009 All rights reserved IBM WEBSPHERE BUSINESS MONITOR 6.2 LAB EXERCISE WebSphere Business Monitor V6.2 What this exercise is about... 2 Lab requirements... 2 What you should
ReceivablesVision SM Getting Started Guide
 ReceivablesVision SM Getting Started Guide March 2013 Transaction Services ReceivablesVision Quick Start Guide Table of Contents Table of Contents Accessing ReceivablesVision SM...2 The Login Screen...
Tyler Dashboard. User Guide Version 6.2. For more information, visit www.tylertech.com.
 Tyler Dashboard User Guide Version 6.2 For more information, visit www.tylertech.com. TABLE OF CONTENTS Tyler Dashboard... 3 Tyler Dashboard Features... 3 Site Search... 3 Browse... 4 Page... 5 Dashboard...
DB2 Web Query: Creating Dashboards with HTML Composer and InfoAssist. Jacqueline Jansen Jackie_Jansen@ibi.com Information Builders
 DB2 Web Query: Creating Dashboards with HTML Composer and InfoAssist Jacqueline Jansen Jackie_Jansen@ibi.com Information Builders Dashboard Creation Agenda HTML Composer Add push buttons, hyperlinks, images
Click to edit Master text styles. FA Web Ad Hoc Query. Second level. Third level. Fourth level Fifth level. Training Material. www.assetworks.
 Click to edit Master text styles Second level Third level Fourth level Fifth level FA Web Ad Hoc Query Training Material Contents Navigation 3-6 Security 7-9 Field Options 10-15 Calculated Fields 11-12
Executive Dashboard. User Guide
 Executive Dashboard User Guide 2 Contents Executive Dashboard Overview 3 Naming conventions 3 Getting started 4 Welcome to Socialbakers Executive Dashboard! 4 Comparison View 5 Setting up a comparison
PERFORMANCE MANAGEMENT Frequently Asked Questions
 PERFORMANCE MANAGEMENT Frequently Asked Questions General Q: Where is SuccessFactors? A: Option 1: Access SuccessFactors from The Exchange, the college s intranet site. STEP 1 OF 3: From the home page
Creating Dashboards for Microsoft Project Server 2010
 Creating Dashboards for Microsoft Project Server 2010 Authors: Blaise Novakovic, Jean-Francois LeSaux, Steven Haden, Microsoft Consulting Services Information in the document, including URL and other Internet
Course duration: 45 Hrs Class duration: 1-1.5hrs
 Course duration: 45 Hrs Class duration: 1-1.5hrs USA : +1 9099998808 India : +91-9986411022 mail : ithuntersolutions@gmail.com SAP BO 4.0 Introduction Data warehouse concepts Difference between Versions
ORACLE PROJECT MANAGEMENT
 ORACLE PROJECT MANAGEMENT KEY FEATURES Oracle Project Management provides project managers the WORK MANAGEMENT Define the workplan and associated resources; publish and maintain versions View your schedule,
How to Use Swiftpage for Microsoft Excel
 How to Use Swiftpage for Microsoft Excel 1 Table of Contents Basics of the Swiftpage for Microsoft Excel Integration....3 How to Install Swiftpage for Microsoft Excel and Set Up Your Account...4 Creating
SAS BI Dashboard 4.3. User's Guide. SAS Documentation
 SAS BI Dashboard 4.3 User's Guide SAS Documentation The correct bibliographic citation for this manual is as follows: SAS Institute Inc. 2010. SAS BI Dashboard 4.3: User s Guide. Cary, NC: SAS Institute
Document Manager 2.0. User Guide
 Document Manager 2.0 User Guide Document Manager 2.0 Introduction Document Manager 2.0 is the Web to Print ordering application for OfficeMax ImPress. Many features and functionality are available to you
5.7. Quick Guide to Fusion Pro Schedule
 5.7 Quick Guide to Fusion Pro Schedule Quick Guide to Fusion Pro Schedule Fusion 5.7 This publication may not be reproduced, in whole or in part, in any form or by any electronic, manual, or other method
Getting Started Guide SAGE ACCPAC INTELLIGENCE
 Getting Started Guide SAGE ACCPAC INTELLIGENCE Table of Contents Introduction... 1 What is Sage Accpac Intelligence?... 1 What are the benefits of using Sage Accpac Intelligence?... 1 System Requirements...
ProClarity Analytics Family
 ProClarity Analytics Platform 6 Product Data Sheet Accelerated understanding The ProClarity Analytics family enables organizations to centrally manage, store and deploy best practices and key performance
DataPA OpenAnalytics End User Training
 DataPA OpenAnalytics End User Training DataPA End User Training Lesson 1 Course Overview DataPA Chapter 1 Course Overview Introduction This course covers the skills required to use DataPA OpenAnalytics
Fast Track: Applications in Microsoft Dynamics CRM 2015 / CRM Online (Microsoft Training Course: F1082) - 2 days
 - 2 days") Fast Track: Applications in Microsoft Dynamics CRM 2015 / CRM Online (Microsoft Training Course: F1082) - 2 days TARGET AUDIENCE This course provides both an introduction to Microsoft Dynamics CRM 2015
Fast Track: Applications in Microsoft Dynamics CRM 2015 / CRM Online (Microsoft Training Course: F1082) - 2 days TARGET AUDIENCE This course provides both an introduction to Microsoft Dynamics CRM 2015
Mitigation Planning Portal (MPP) Tutorial Canned Reports Updated 5/18/2015
 Tutorial Canned Reports Updated 5/18/2015") Mitigation Planning Portal (MPP) Tutorial Canned Reports Updated 5/18/2015 MPP Reporting System Introduction Access the MPP Reporting System by clicking on the Reports tab and clicking the Launch button.
Mitigation Planning Portal (MPP) Tutorial Canned Reports Updated 5/18/2015 MPP Reporting System Introduction Access the MPP Reporting System by clicking on the Reports tab and clicking the Launch button.
Microsoft Office System Tip Sheet
 Experience the 2007 Microsoft Office System The 2007 Microsoft Office system includes programs, servers, services, and solutions designed to work together to help you succeed. New features in the 2007
Getting Started with Performance Management
 Getting Started with Performance Management Welcome to SuccessFactors, our new performance management system. This guide will orient you to the selections of the system and overview of the features and
How SAP Business Intelligence Solutions provide real-time insight into your organization
 How SAP Business Intelligence Solutions provide real-time insight into your organization 28 Oct 2015 Agenda 1) What is Business Intelligence (BI) 2) SAP BusinessObjects Features Overview 3) Demo & Report
Scheduling Software User s Guide
 Scheduling Software User s Guide Revision 1.12 Copyright notice VisualTime is a trademark of Visualtime Corporation. Microsoft Outlook, Active Directory, SQL Server and Exchange are trademarks of Microsoft
Microsoft Dynamics NAV
 Microsoft Dynamics NAV Maximising value through business insight Business Intelligence White Paper October 2015 CONTENTS Reports were tedious. Earlier it would take days for manual collation. Now all this
What s new in SAP Dashboards 4.0 and 4.1. Sandy Brotje Harris Corporation, Healthcare Solutions SESSION CODE: 0709
 What s new in SAP Dashboards 4.0 and 4.1 Sandy Brotje Harris Corporation, Healthcare Solutions SESSION CODE: 0709 Harris, Healthcare Solutions Business Intelligence & Analytics We are a team offering a
Rakesh Tej Kumar Kalahasthi and Benson Hilbert SAP BI Practice, Bangalore, India Email: rakeshtej@gmail.com, benhilbert.hilbert@gmail.com.
 394 Business Intelligence Journal July A SHORT COMMUNICATION ON - HOW A LEADING POWER DISTRIBUTION COMPANY EFFECTIVELY TRACKS BUSINESS AREAS LIKE SAFETY, FINANCE AND OPERATION FOR REGION AND BUSINESS WISE
2009 Braton Groupe sarl, All rights reserved.
 D A T A B A S E M A N A G E R U S E R M A N U A L The information in this manual is not binding and may be modified without prior notice. Supply of the software described in this manual is subject to a
Quality Companion 3 by Minitab
 Quality Companion 3 by Minitab Contents Part 1. Introduction to Quality Companion 3 Part 2. What's New Part 3. Known Problems and Workarounds Important: The Quality Companion Dashboard is no longer available.
Objectives. Understand databases Create a database Create a table in Datasheet view Create a table in Design view
 Creating a Database Objectives Understand databases Create a database Create a table in Datasheet view Create a table in Design view 2 Objectives Modify a table and set properties Enter data in a table
WebFOCUS BI Portal: S.I.M.P.L.E. as can be
 WebFOCUS BI Portal: S.I.M.P.L.E. as can be Author: Matthew Lerner Company: Information Builders Presentation Abstract: This hands-on session will introduce attendees to the new WebFOCUS BI Portal. We will
How SAP Business Objects Dashboards Are Improving Decision Making at Caterpillar Parts Distribution
 How SAP Business Objects Dashboards Are Improving Decision Making at Caterpillar Parts Distribution Greg Lauer & John Buckhold Caterpillar Inc. SESSION CODE: 0705 DASHBOARDS Dashboards at Cat Parts Distribution
Microsoft Access 2010 handout
 Microsoft Access 2010 handout Access 2010 is a relational database program you can use to create and manage large quantities of data. You can use Access to manage anything from a home inventory to a giant
How to Use Swiftpage for Microsoft Outlook
 How to Use Swiftpage for Microsoft Outlook 1 Table of Contents Basics of the Swiftpage for Microsoft Outlook Integration.. 3 How to Install Swiftpage for Microsoft Outlook and Set Up Your Account...4 The
MODULE 2: SMARTLIST, REPORTS AND INQUIRIES
 MODULE 2: SMARTLIST, REPORTS AND INQUIRIES Module Overview SmartLists are used to access accounting data. Information, such as customer and vendor records can be accessed from key tables. The SmartList
Learn About Analysis, Interactive Reports, and Dashboards
 Learn About Analysis, Interactive Reports, and Dashboards This document supports Pentaho Business Analytics Suite 5.0 GA and Pentaho Data Integration 5.0 GA, documentation revision February 3, 2014, copyright
Dashboard Builder TM for Access
 Dashboard Builder TM for Access Professional Edition Application Guide Version 5 8/8/15 This document is copyright 2007-2015 OpenGate Software. The information contained in this document is subject to
Sage ERP MAS. Everything you want to know about Sage ERP MAS Intelligence. What is Sage ERP MAS Intelligence? benefits
 Sage ERP MAS Everything you want to know about Sage ERP MAS Intelligence What is Sage ERP MAS Intelligence? Sage ERP MAS Intelligence (or Intelligence) empowers managers to quickly and easily obtain operations
I. Create the base view with the data you want to measure
 Developing Key Performance Indicators (KPIs) in Tableau The following tutorial will show you how to create KPIs in Tableau 9. To get started, you will need the following: Tableau version 9 Data: Sample
JHM Patient Safety & Quality Dashboard. Quick Start Guide
 JHM Patient Safety & Quality Dashboard Quick Start Guide JHM Patient Safety & Quality Dashboard Quick Start Guide This guide will walk users through how to access and navigate the JHM Patient Safety &