articipation in the Community Districts D Insurance I
|
|
|
- Justin Carroll
- 10 years ago
- Views:
Transcription
1 Public Health H Insurance I ParP articipation in the Community Districts D of New N York k CityC New York City Mayor s Office of Health Insurance Access Marjorie Cadogan, Executive Director 51 Chambers Street, Room 100 New York, NY September 2004

2 Acknowledgements The mission of the New York City Mayor s Office of Health Insurance Access (MOHIA) is to increase access to health insurance for New Yorkers. The Office has two key priorities, first, to ensure that uninsured New Yorkers who are eligible for public health insurance are enrolled and second, to expand access to health insurance options for small business employees, sole proprietors and working individuals. The Office coordinates HealthStat, a citywide project bringing together the work of city agencies, community-based organizations and managed care plans to identify and enroll eligible residents in public health insurance programs. This analysis of public health insurance participation by MOHIA was written by Andrea Bachrach. The research team also included Edward Kim and Hannah Yang, working under the direction of MOHIA s Deputy Director, Christel Brellochs. Audrey Henry, MOHIA s Program Development and Communications Manager, and interns Deirdre Downey and Greg Giusto also made important contributions. This analysis would not have been possible without the intensive engagement of key partners: Peter Lobo, Deputy Director, Population Division, and staff at the Department of City Planning, who estimated the number of eligibles; Swati Desai, Executive Deputy Commissioner, Program Reporting, Analysis and Accountability, New York City Human Resources Administration (HRA); and Lisa Garabedian, Research Associate at HRA who provided critical information on children and adults currently enrolled in public health insurance programs. Additional data were provided by the New York State Department of Health and the Administration for Children s Services. Other colleagues at the New York City Department of Health and Mental Hygiene, the Human Resources Administration, the United Hospital Fund, the Commonwealth Fund, HealthStat city agencies and facilitated enroller partners generously reviewed and provided comments at various stages of the project. ii

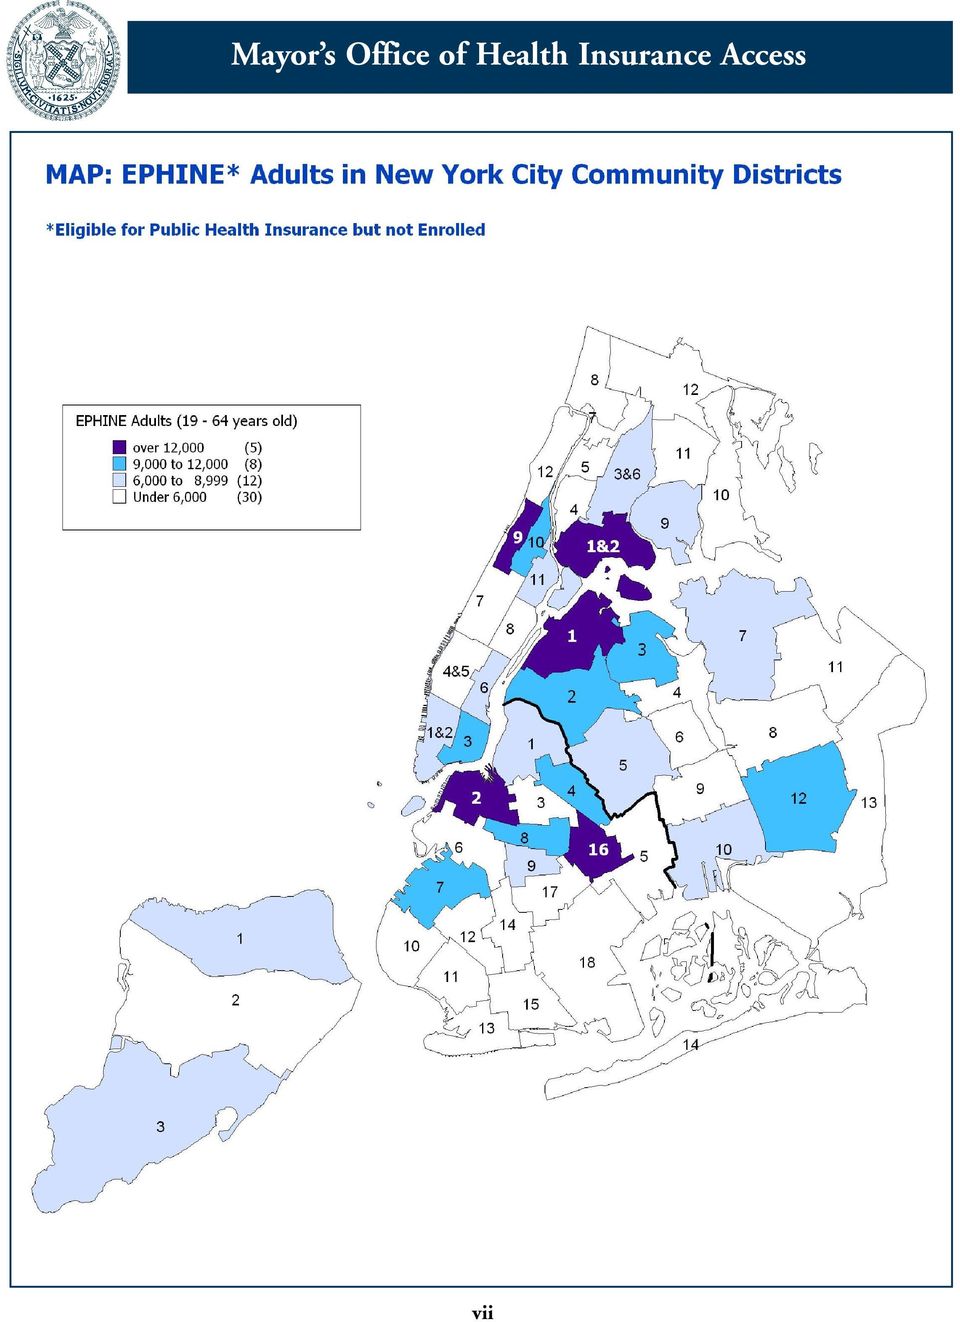
3 Table of Contents Acknowledgements......ii Summary... iv Maps EPHINE Children in New York City by Community District vi EPHINE Adults in New York City by Community District vii EPHINE Children and Adults in New York City by Community District.....viii The Community Districts of New York City (List)....ix Report Background... 1 Methodology Major Findings Table 1: EPHINEs in the Five Boroughs of New York City....2 Table 2: EPHINE Share of Population... 3 Table 3: Top 10 EPHINE Community Districts Borough Profiles Bronx... 4 Brooklyn Manhattan... 6 Queens Staten Island Implications for Outreach and Enrollment Appendices Appendix A: Methodology.....A-1 Appendix B: New York State 2003 Income and Resource Standards... A-5 Appendix C: Additional Tables Table C1: Public Health Insurance Eligibility and Enrollment....A-8 Table C2: EPHINEs in New York City Community Districts.....A-9 Table C3: EPHINE Ranges in New York City Community Districts...A-10 Table C4: NYC Community Districts, Basic Demographic Information...A-11

4 Summary In the Fall of 2003, the New York City Mayor s Office of Health Insurance Access (MOHIA) initiated an assessment of public health insurance participation in the community districts of New York City. Its purpose was to generate information that would help target outreach by city agencies and facilitated enrollers to community districts (CDs) with the greatest number of children and adults eligible for, but not enrolled in, public health insurance programs. With its collaborators the New York City Department of City Planning and the Human Resources Administration, MOHIA determined the number of residents eligible for public health insurance, based on 2000 Census data, and the number enrolled in public health insurance programs, based on October 2003 enrollment information from the City and State. For the City as a whole and for each community district, current enrollment was subtracted from the total number of eligibles to develop an estimate of the number of residents eligible for pubic health insurance but not enrolled (EPHINE). Separate estimates were developed for children (ages 18 and under) and adults (between the ages of 19 and 64). Approximately 2.7 million New York City residents under the age of 65 are eligible for Medicaid, Child Health Plus, or Family Health Plus. Of the estimated 2.7 million eligible, 80 percent, or roughly 2.2 million children and adults were enrolled in the public health insurance programs as of October This high enrollment rate is a remarkable achievement, and is a testament to the commitment on the part of City, State, and private sector partners to provide access to health insurance for the poorest city residents. In regard to the number of New Yorkers eligible for but not enrolled in public health insurance programs, the project s major findings are as follows: Major Findings 1. New York City has approximately 536,000 people nearly 8 percent of the City s total population under 65 eligible for, but not enrolled in, public health insurance programs. Though the exact number of uninsured New Yorkers eligible for public health insurance may be slightly smaller (due to a number who have access to employer-sponsored health insurance), a large number of city residents who are eligible for public health insurance lack coverage. 2. Three-fifths (60 percent) of all EPHINEs about 322,000 persons are adults. While efforts to enroll eligible children have been more successful, almost 214,000 eligible children are not yet enrolled. 3. Adults are less likely than children to be enrolled in public health insurance despite being eligible. Nearly a quarter (24 percent) of the 1.4 million adults eligible for public health insurance are not enrolled, compared to about 16 percent of the City s 1.3 million eligible children. iv

5 4. Though they can be found in every community district across the City, certain areas have particularly high numbers of EPHINEs. Across the five boroughs, Brooklyn, with the largest population, also has the greatest number of EPHINEs. Brooklyn is also home to the top three EPHINE CDs community districts with the largest numbers of child and adult EPHINE residents. 5. Most of the CDs with large numbers of EPHINE children are in Brooklyn and the Bronx. In contrast, the top ten adult EPHINE community districts are more evenly distributed across the boroughs, with four in Brooklyn, three in Queens, two in Manhattan, and one in the Bronx. 6. CDs with high numbers of EPHINE children do not necessarily have similarly high numbers of adult EPHINEs. More than half of EPHINE residents in the Bronx are children; in the other boroughs there are more adults eligible for, but not enrolled in, public health insurance programs. 7. Some CDs have a particularly high percentage of their population who are EPHINEs. EPHINEs account for more than ten percent of the total under-65 population in 14 of the 55 CDs. 1 Moreover, in 9 CDs more than a third of all residents eligible for public health insurance are not enrolled. 8. In terms of immigrant populations, high ranked EPHINE CDs run the gamut. Included in the top 10 are both a CD tied for the lowest percentage residents who are foreign born (Brooklyn CD 2: Brooklyn Heights and Fort Greene) and the CD with the second highest foreign-born percentage citywide (Queens CD 3: Jackson Heights, North Corona). 9. Areas with the largest numbers of residents eligible for, but not enrolled in, public health insurance tend to have relatively low median household incomes and relatively high rates of poverty and unemployment. There are, however, some exceptions to this trend (high EPHINE CDs with more moderate median incomes and poverty levels), and there are also several CDs with relatively low-income populations that do not have many EPHINEs. Borough and CD-level estimates suggest specific areas of the City that should be the focus of expanded outreach and enrollment efforts. The Mayor s Office of Health Insurance Access is currently working with its enrollment partners to design and implement outreach strategies to respond to the identified areas of need. These areas are identified in the maps, which follow this summary. 1 Although there are 59 community districts in New York City, some of the smaller CDs were combined by the Census to ensure confidentiality of survey respondents. v

6 vi

7 vii
8 Mayor s Office of Health Insurance Access viii

9 The Community Districts of New York City Community District Neighborhoods Community District Neighborhoods Bronx 1 Melrose, Mott Haven, Port Morris Manhattan 1 Battery Park City, Tribeca Bronx 2 Hunts Point, Longwood Manhattan 2 Greenwich Village, Soho Bronx 3 Morrisania, Crotona Park East Manhattan 3 Lower East Side, Chinatown Bronx 4 Highbridge, Concourse Village Manhattan 4 Chelsea, Clinton Bronx 5 University Hts., Fordham, Mt. Hope Manhattan 5 Midtown Business District Bronx 6 East Tremont, Belmont Manhattan 6 Stuyvesant Town, Turtle Bay Bronx 7 Bedford Park, Norwood, Fordham Manhattan 7 West Side, Upper West Side Bronx 8 Riverdale, Kingsbridge, Marble Hill Manhattan 8 Upper East Side Bronx 9 Soundview, Parkchester Manhattan 9 Manhattanville, Hamilton Heights Bronx 10 Throgs Nk., Co-op City, Pelham Bay Manhattan 10 Central Harlem Bronx 11 Pelham Pkwy, Morris Park, Laconia Manhattan 11 East Harlem Bronx 12 Wakefield, Williamsbridge Manhattan 12 Washington Heights, Inwood Brooklyn 1 Williamsburg, Greenpoint Queens 1 Astoria, Long Island City Brooklyn 2 Brooklyn Heights, Fort Greene Queens 2 Sunnyside, Woodside Brooklyn 3 Bedford Stuyvesant Queens 3 Jackson Heights, North Corona Brooklyn 4 Bushwick Queens 4 Elmhurst, South Corona Brooklyn 5 East New York, Starrett City Queens 5 Ridgewood, Glendale, Maspeth Brooklyn 6 Park Slope, Carroll Gardens Queens 6 Forest Hills, Rego Park Brooklyn 7 Sunset Park, Windsor Terrace Queens 7 Flushing, Bay Terrace Brooklyn 8 Crown Heights North Queens 8 Fresh Meadows, Briarwood Brooklyn 9 Crown Heights South, Wingate Queens 9 Woodhaven, Richmond Hill Brooklyn 10 Bay Ridge, Dyker Heights Queens 10 Ozone Park, Howard Beach Brooklyn 11 Bensonhurst, Bath Beach Queens 11 Bayside, Douglaston, Little Neck Brooklyn 12 Borough Park, Ocean Parkway Queens 12 Jamaica, St. Albans, Hollis Brooklyn 13 Coney Island, Brighton Beach Queens 13 Queens Village, Rosedale Brooklyn 14 Flatbush, Midwood Queens 14 The Rockaways, Broad Channel Brooklyn 15 Sheepshead Bay, Gerritsen Beach Staten Island 1 Stapleton, Port Richmond Brooklyn 16 Brownsville, Ocean Hill Staten Island 2 New Springville, South Beach Brooklyn 17 East Flatbush, Rugby, Farragut Staten Island 3 Tottenville, Woodrow, Great Kills Brooklyn 18 Canarsie, Flatlands ix

10 Public Health Insurance Participation in the Community Districts of New York City Background In the Fall of 2003, the New York City Mayor s Office of Health Insurance Access initiated a project to assess public health insurance participation in the community districts of New York City. Its purpose was to generate information that would help target outreach by city agencies and facilitated enrollers to community districts (CDs) with the greatest unmet need, as indicated by the number of children and adults eligible for, but not enrolled in, public health insurance programs. Given this outreach and enrollment focus, the project s aim was to identify overall trends, rather than to generate definitive numbers for each area of the City. Methodology The project calculated the number of individuals under-65 who are income-eligible using 2000 Census data and subtracted out the number enrolled in Child Health Plus A and B, Adult Medicaid, and Family Health Plus as of October EPHINE estimates were generated for the City as a whole and for 55 community districts. 2 This is the first analysis to generate these estimates at the community district level. Excluded from the EPHINE numbers were approximately 282,000 undocumented immigrant adults. These people were subtracted out of the number eligible for public health insurance because, though income eligible, their immigration status disqualifies them for the programs. This step of the analysis had significant implications, reshuffling some of the community districts that appear at the top of the rankings for the largest number of EPHINEs. Several important limitations and unknowns should be noted. One major limitation is the absence of information about the number of EPHINEs who have access to employer-sponsored or other private insurance. For this reason, this study is only able to estimate the number of EPHINEs, and cannot state the number of eligible City residents who are uninsured. The method of estimating income may overstate family income for a significant share of city residents, resulting in a lower number of EPHINEs. In addition, our estimate of the number of undocumented immigrant adults who are income eligible and were counted in the Census may overstate or understate the size of this population. One final unknown is the precise extent to which the incomes of low-income New Yorkers have risen since 1999, when household data were collected for the 2000 Census. Appendix A contains a more detailed description of the project s methodology. Major Findings Approximately 2.7 million New York City residents under the age of 65 are eligible for Medicaid, Child Health Plus, or Family Health Plus. This represents 38 percent of the nearly 7 million non-elderly city residents. 2 Four pairs of community districts were combined for the analysis. The combined districts are: Bronx 1 and 2, Bronx 3 and 6, 1

11 Of the 2.7 million people eligible, 80 percent, or 2,167,756, were enrolled in public health insurance programs as of October This high enrollment rate is a remarkable achievement, and is a testament to the commitment on the part of City, State, and private sector partners to provide access to health insurance for the poorest city residents. In recent years New York City has been at the forefront of creating public-private partnerships to identify and enroll the uninsured. This enrollment effort has been bolstered by a unique combination of state funding support, city agency partnerships, and the persistent dedication of facilitated enrollers. Nevertheless, approximately 536,000 people eligible for public health insurance programs are not enrolled. While there are signs that efforts to enroll eligible children have been successful, 213,960, or 16 percent of the 1,328,532 children eligible for public health insurance are not enrolled. New York City has a considerably higher number of EPHINE adults. Of the 1,364,714 adults eligible for public health insurance, 322,120, or 24 percent, are not enrolled. Table 1 details the distribution of EPHINEs across New York City s five boroughs. Table 1 EPHINEs in the Five Boroughs of New York City Number of EPHINEs (Borough Rank) Children - 0 to 18 Adults - 19 to 64 Total - 0 to 64 Bronx 51,843 (2) 47,652 (4) 99,495 (4) Brooklyn 73,234 (1) 105,121 (1) 178,355 (1) Manhattan 31,796 (4) 68,147 (3) 99,943 (3) Queens 43,285 (3) 83,164 (2) 126,449 (2) Staten Island 13,802 (5) 18,036 (5) 31,838 (5) NEW YORK CITY 213, , ,080 Citywide, about 20 percent of people eligible for public health insurance are not enrolled. EPHINEs also account for an estimated 7.7 percent of New York City s total population under 65. Table 2 summarizes the trends across the boroughs. Though they can be found in every community district across the City, certain areas have particularly high numbers of EPHINEs. Across the five boroughs, Brooklyn has the greatest number of EPHINEs, and is also home to the top three EPHINE CDs community districts with the largest numbers of child and adult EPHINE residents. 2

12 Table 2 EPHINE Share of Population Percentage of Eligibles Who Are Not Enrolled Percentage of Total Population Under 65 That Is EPHINE Bronx 16.30% 8.40% Brooklyn 18.90% 8.30% Manhattan 23.10% 7.40% Queens 20.70% 6.60% Staten Island 33.30% 8.10% NEW YORK CITY 19.90% 7.70% The top ten EPHINE CDs are distributed across the boroughs roughly in proportion to the City s population as a whole, with four in Brooklyn and two each in the Bronx, Manhattan, and Queens. Most of the CDs with large numbers of EPHINE children are in Brooklyn and the Bronx. In contrast, the top ten adult EPHINE community districts are more evenly distributed across the boroughs, with four in Brooklyn, three in Queens, two in Manhattan, and one in the Bronx. Table 3 Top 10 EPHINE Community Districts Rank Children - 0 to 18 Adults - 19 to 64 Total - 0 to 64 #1 Brooklyn CD 16 Brooklyn CD 16 Brooklyn CD 16 #2 Bronx CD 9 Queens CD 1 Brooklyn CD 2 #3 Manhattan CD 12 Manhattan CD 9 Brooklyn CD 8 #4 Brooklyn CD 8 Brooklyn CD 2 Queens CD 1 #5 Brooklyn CD 4 Bronx CD 1/2 Bronx CD 1/2 #6 Brooklyn CD 2 Queens CD 2 Manhattan CD 9 #7 Brooklyn CD 13 Queens CD 3 Bronx CD 9 #8 Bronx CD 8 Brooklyn CD 7 Brooklyn CD 4 #9 Bronx CD 5 Manhattan CD 3 Manhattan CD 10 #10 Bronx CD 1/2 Brooklyn CD 8 Queens CD 3 Community district-level EPHINE findings for each of the boroughs appear on the following pages. 3

13 Borough Profile: BRONX EPHINE Residents in Bronx Community Districts 35,000 30,000 25,000 Adults, Age Children, Age <19 20,000 Hunts Point Mott Haven Soundview Parkchester 15,000 10,000 5, &2 3& Community District Unlike the rest of the City s boroughs, in the Bronx more than half of EPHINEs are children. The Bronx has two of the City s ten community districts with the most people eligible for public health insurance but not enrolled. These two are Bronx CD 1/2 (Mott Haven, Hunts Point, Longwood), which has the most EPHINEs in the borough, and Bronx CD 9 (Soundview, Parkchester), which has the second highest number of EPHINE children citywide. Each of these CDs has an estimated 18,000 residents eligible for public health insurance but not enrolled. Interestingly, although the borough has the highest percentage of total population under 65 that are EPHINE, it also has the lowest percentage of eligible people who are not enrolled (Table 2). EPHINE Summary for the Bronx's 10 Community Districts 3 Number of EPHINEs: Highest ranked community district: 99,495 (52% children, 48% adults) CD 1/2 (Mott Haven, Hunts Point, Longwood) Number of CDs in the top ten citywide: 2 CDs with above average EPHINE numbers: The Bronx has 12 community districts, but two of them were merged for our analysis, leaving 10 CD groupings. 4 The average number of EPHINEs per community district citywide is 9,747. 4
, which has the most EPHINEs in the borough, and Bronx CD 9 (Soundview, Parkchester), which has the second highest number of EPHINE")
14 Borough Profile: BROOKLYN EPHINE Residents in Brooklyn Community Districts 35,000 30,000 25,000 Adults, Age Children, Age <19 Ocean Hill Brownsville 20,000 Fort Greene Brooklyn Heights Sunset Park Crown Heights North 15,000 10,000 Bushwick 5, Community District Brooklyn, with the largest population, has the highest number of EPHINE children and adults citywide. The borough is also home to CD 16 (Brownsville, Ocean Hill), which has an estimated 31,092 EPHINE residents, more than three times the average number across all community districts. With roughly 20,000 EPHINE residents, Brooklyn CD 2 (Fort Greene, Brooklyn Heights) has the second largest number of EPHINEs citywide, and it is the only community district with large EPHINE numbers where more than half of eligible residents are not enrolled in public health insurance programs. The borough s other three high EPHINE CDs are CD 8 (Crown Heights North), CD 4 (Bushwick) and CD 7 (Sunset Park, Windsor Terrace). EPHINE Summary for the Brooklyn's 18 Community Districts Number of EPHINEs: Highest ranked community district: 178,355 (41% children, 59% adults) CD 16 (Brownsville, Ocean Hill) Number of CDs in the top ten citywide: 4 CDs with above average EPHINE numbers: 7 5
, which has an estimated 31,092 EPHINE residents, more than three times the average number across all community districts.")
15 Borough Profile: MANHATTAN EPHINE Residents in Manhattan Community Districts 35,000 30,000 25,000 Adults, Age Children, Age <19 20,000 Manhattanville Hamilton Heights Central Harlem 15,000 10,000 5, &2 3 4& Community District Manhattan has significantly more adults than children eligible for public health insurance but not enrolled. The largest numbers of EPHINEs identified in Manhattan are in the neighboring areas of Manhattan CD 9 (Manhattanville, Hamilton Heights) and CD 10 (Central Harlem), each of which have over 15,000 EPHINE residents. The most EPHINE children in Manhattan reside in CD 12 (Washington Heights, Inwood), which has nearly 9,000 EPHINE children, the third largest number citywide. With an estimated 13,000 adult EPHINE residents, Manhattan CD 9 has the third largest number of EPHINE adults citywide. EPHINE Summary for Manhattan's 10 Community Districts 5 Number of EPHINEs: Highest ranked community district: 99,943 (32% children, 68% adults) CD 9 (Manhattanville, Hamilton Heights) Number of CDs in the top ten citywide: 2 CDs with above average EPHINE numbers: 5 5 Manhattan has 12 community districts, but two of them were merged for our analysis, leaving 10 CD groupings. 6
, which has nearly 9,000 EPHINE children, the third largest number citywide.")
16 Borough Profile: QUEENS EPHINE Residents in Queens Community Districts 35,000 30,000 25,000 20,000 15,000 Astoria Long Island City Sunnyside Woodside Jackson Heights North Corona Adults, Age Children, Age <19 Jamaica St. Albans Hollis 10,000 5, Community District As is case in Manhattan, Queens also has significantly more EPHINE adults than children. With nearly 14,000 adult residents eligible for public health insurance but not enrolled, Queens CD 1 (Astoria, Long Island City) has the second largest number of adult EPHINEs citywide. Queens CD 2 (Sunnyside, Woodside) and CD 3 (Jackson Heights, Corona) also rank in the top ten citywide for EPHINE adults. The largest number of EPHINE children is found in Queens CD 12 (Jamaica, St. Albans, Hollis). Although the borough as a whole has the lowest percentage of total population under 65 that are EPHINE citywide, it has three community districts (CDs 1, 2, and 3) in which EPHINEs are at least ten percent of the total under-65 population. EPHINE Summary for Queens' 14 Community Districts Number of EPHINEs: Highest ranked community district: 126,449 (34% children, 66% adults) CD 1 (Astoria, Long Island City) Number of CDs in the top ten citywide: 2 CDs with above average EPHINE numbers: 6 7
 and CD 3 (Jackson Heights, Corona) also rank in the top ten citywide for EPHINE adults. The largest number of EPHINE children is found in Queens CD 12 (Jamaica, St.")
17 Borough Profile: STATEN ISLAND EPHINE Residents in Staten Island Community Districts 35,000 30,000 25,000 Adults, Age Children, Age <19 20,000 15,000 10,000 5, Community District Given its small population relative to the other boroughs, Staten Island s total EPHINE numbers are not large, but the borough s three community districts all lie towards the middle of the citywide EPHINE rankings. The borough also has the City s highest percentage of eligible people who are not enrolled. An estimated one out of three Staten Island residents who are eligible for public health insurance is not enrolled. With an estimated 13,000 EPHINEs, Staten Island CD 1 (Stapleton, Port Richmond) has the largest number of EPHINE residents in the borough. EPHINE Summary for Staten Island's 3 Community Districts Number of EPHINEs: Highest ranked community district: 31,838 (43% children, 57% adults) CD 1 (Stapleton, Port Richmond) Number of CDs in the top ten citywide: 0 CDs with above average EPHINE numbers: 2 8

18 Implications for Outreach and Enrollment MOHIA was established to increase access to health insurance for New Yorkers. The Office s expanding focus involves collaborations with the Department of Small Business Services and other partners to improve health insurance access for small business employees, sole proprietors, and working individuals. But throughout its five year history, the Office s major initiative has been HealthStat, a citywide project bringing together the work of city agencies, community-based organizations and managed care plans to identify and enroll eligible residents in public health insurance programs. City agencies design and implement strategies that identify uninsured populations and facilitate enrollment for them. Health plans and community-based facilitated enrollers provide enrollment assistance for HealthStat activities. These borough and CD-level estimates suggest specific areas of the City that should be the focus of expanded outreach and enrollment efforts. With limited resources to devote to outreach and enrollment, MOHIA will target high volume and high concentration EPHINE communities. EPHINE estimates will be used to tailor outreach strategies to specific areas based on the composition of the community district s EPHINE population (the breakdown of children and adults). Given that adults are an estimated 60 percent of the City s total population eligible for public health insurance but not enrolled, MOHIA will also explore more effective ways to reach adults, both those who are parents and those who are not. MOHIA s Community Outreach Unit is now translating these findings into action. Briefings have been conducted for MOHIA s HealthStat enrollment partners, and the Office is working with city agencies to advance outreach strategies that make use of the information generated by the study. CD and zip code-based EPHINE analyses will also be used to drive the planning for special activities, including MOHIA s annual Back to School enrollment campaign. Finally, the project s findings will be a major consideration as future special projects are designed, such as a partnership initiative currently being developed with leaders from the City s faith communities. 9

19 Appendix A Methodology A1
20 Methodology This analysis builds upon the work of previous studies that have explored health insurance participation for the City as a whole and for sub-units. These include an annual report issued by the United Hospital Fund 6 based on data from the Current Population Survey, and research conducted by the New York City Department of Health and Mental Hygiene based on data from the New York City Community Health Survey. 7 This project s findings are derived from an analysis of the number of residents eligible for public health insurance, based on 2000 Census data, and the number enrolled in public health insurance programs, based on October 2003 enrollment information from the City and State. The New York City Human Resources Administration (HRA) provided data for three programs: Child Health Plus A, Adult Medicaid, and Family Health Plus. Child Health Plus B data were provided by the New York State Department of Health. For the City as a whole and for each community district, current enrollment was subtracted from the total number of eligibles to develop an estimate of the number of residents eligible for pubic health insurance but not enrolled (EPHINE). Separate estimates were developed for children (ages 18 and under) and adults (between the ages of 19 and 64). Calculation of Population Eligible for Public Health Insurance The estimate of the number of New York City residents eligible for public health insurance is based on analysis of 2000 Census Data, particularly the 5 Percent Public Use Microdata Sample (PUMS) File, which is the most detailed Census information available. The estimate is based on full-year income eligibility, and does not include people that have spells of eligibility for part of the year. The actual number of people eligible for public health insurance for any part of the year over the course of a 12-month period will vary because some people have volatile incomes and shorter periods of income eligibility. Eligibility for each individual child and adult was determined based on family size and income using the 2003 income thresholds established for the public health insurance programs from the New York State 2003 Income and Resource Standards for Health Insurance Programs (Appendix B). Eligibility for adults without children was assessed at a maximum of 100 percent of the federal poverty level (FPL). For adults with children the maximum income was 150 percent of FPL, and for children the income eligibility cutoff was 250 percent of FPL. 6 Health Insurance Coverage in New York, The United Hospital Fund, May Analysis conducted by Kenneth E. Thorpe, Curtis Florence and Peter Joski. 7 New Yorkers Without Health Care Coverage Are Not Getting the Care They Need (NYC Vital Signs Volume 3, No.1). New York City Department of Health and Mental Hygiene, March A-2

21 Inflating Income Because Census data reflect 1999 income, incomes were adjusted to account for inflation. Between the years 1999 and 2003, the local Consumer Price Index rose 11.7 percent. 8 Considering the economic conditions facing the City in recent years, there is no strong evidence that the incomes of low-income New York City residents increased at a similar rate. In the absence of a precise income inflation figure, this project assessed eligibility for each city resident based on two sets of incomes: uninflated 1999 income from the 2000 Census, and 1999 income inflated 11.7 percent. All analyses in this report are based on the midpoint or average of the two income eligibility estimates. See Table C3 in Appendix C for details on the number of EPHINEs estimated from the two income eligibility calculations. The approximation of household income used to estimate eligibility closely mirrors the true income test a potential enrollee would experience, but it is not able to account for other components of the eligibility determination process, such as the asset test applied to adults enrolling in the Medicaid program. It should also be noted that estimates of the number eligible for public health insurance may be low because the method of estimating income may overstate family income for a significant share of City residents. This occurs for family households with children that include extended family members beyond the nuclear family of parent(s) and child(ren). As a result, for children the family size and family income may be larger than that which would be counted in an actual determination of health insurance eligibility. Undocumented Immigrants The project s initial numbers overestimated the number of eligible adults by including undocumented immigrants who were counted in the Census but are not eligible for Medicaid or Family Health Plus. In order to account for this, an estimate of the number of undocumented adult immigrants was developed based on research conducted by the United States Immigration and Naturalization Services (INS) 9 and was subtracted from the original estimate of the number eligible for public health insurance. The INS research estimated that 489,000 undocumented immigrants resided in New York State. Of these 489,000, our project estimated that 90 percent, or 440,100, were counted in the Census. Estimating that 80 percent of them resided in New York City, and that 80 percent of those residing in New York City were adults, the project also conservatively assumed that all of the undocumented immigrant adults living in New York City and counted in the Census were income-eligible for public health insurance. A total of 281,664 persons were subtracted, and they were distributed across community districts according to each district s share of the total foreign-born or immigrant population of New York City. 8 Consumer Price Index for the New York MSA, United States Department of Labor, Bureau of Labor Statistics. 9 Estimates of the Unauthorized Immigrant Population Residing in the United States: 1990 to U.S. Immigration and Naturalization Service Office of Policy and Planning, A-3
22 Determination of Population Currently Enrolled To determine the number of individuals enrolled in the Child Health Plus A and B, Adult Medicaid, and Family Health Plus Programs data were compiled from the Human Resources Administration and the New York State Department of Health. Participation in these programs was examined as of October Due to the format of the available data, adjustments were made to develop an accurate estimate of number of children and adults under 65 enrolled in public health insurance programs. Seniors For the Adult Medicaid program, the enrollment information available at the community district level included seniors age 65 and over. Because the study only examines enrollment trends for New York City residents under the age of 65, estimates of how many seniors (aged 65 and older) enrolled in Medicaid were subtracted out of the number of adults enrolled. A total of 282,427 persons were subtracted from the total of adults enrolled, and they were distributed across community districts according to each district s share of the total population of seniors living at or below the poverty level in New York City. Children in Foster Care The enrollment information available for the Child Health Plus A program did not include children living in foster care, who are automatically enrolled in Medicaid. Because the study includes all children, the number of children in foster care (22,763) was added to the total number of New York City children enrolled in public health insurance programs. Children in foster care were distributed across community districts according to each district s share of the total citywide population 18 and under. Estimation of Number Eligible but Not Enrolled Once the number currently enrolled was subtracted from the estimate of those eligible the study had an estimate of the number of New York City residents eligible for public health insurance but not enrolled (EPHINE). One factor the study was not able to account for is how many of the people identified as EPHINE have employer-sponsored or other private health insurance. National data suggest that 17 to 27 percent of people with incomes below the poverty level have private health insurance coverage. 10 However, additional research indicates that low-income people in New York City have significantly lower rates of private health insurance coverage than their national counterparts. Unfortunately, there is currently no available estimate of the percentage of New York City residents eligible for public health insurance who have private health insurance. For this reason, this study is only able to estimate the number of people eligible for public health insurance who are not enrolled in public health insurance programs, and cannot state the number of eligible City residents who are uninsured. 10 The Uninsured: A Primer. Key Facts About Americans Without Health Insurance. Kaiser Commission on Medicaid and the Uninsured, December A-4
23 Appendix B New York State 2003 Income and Resource Standards for Health Insurance Programs A-5
24 A-6
25 Appendix C Additional Tables A-7
26 TABLE C1: Public Health Insurance* Eligibility and Enrollment in NYC Community Districts (October 2003) Eligible for Public Health Insurance Enrolled in Public Health Insurance BOROUGH CD Neighborhoods Total Population Under 65 Children Age <19 Adults Age Total Eligible Children Age <19 Adults Age Total Enrolled BRONX 1&2 Melrose, Mott Haven, Port Morris / Hunts Point, Longwood 132,507 42,119 44,691 86,810 36,273 32,157 68,430 BRONX 3&6 Morrisania, Crotona Park East / East Tremont, Belmont 129,110 45,450 42,078 87,527 40,432 34,382 74,814 BRONX 4 Highbridge, Concourse Village 118,747 40,400 33,175 73,574 37,683 33,594 71,277 BRONX 5 University Hts., Fordham, Mt. Hope 126,810 42,793 36,953 79,746 36,619 31,644 68,263 BRONX 7 Bedford Park, Norwood, Fordham 120,890 35,626 30,278 65,904 31,057 29,801 60,857 BRONX 8 Riverdale, Kingsbridge, Marble Hill 87,695 15,932 14,561 30,493 9,744 13,279 23,023 BRONX 9 Soundview, Parkchester 156,262 41,275 37,086 78,361 31,631 28,658 60,289 BRONX 10 Throgs Nk., Co-op City, Pelham Bay 91,032 10,254 12,428 22,681 7,480 8,374 15,855 BRONX 11 Pelham Pkwy, Morris Park, Laconia 102,230 17,978 19,384 37,362 13,109 15,225 28,334 BRONX 12 Wakefield, Williamsbridge 121,950 26,110 21,673 47,783 22,063 18,442 40,505 BROOKLYN 1 Williamsburg, Greenpoint 128,592 35,754 31,728 67,482 35,146 25,270 60,416 BROOKLYN 2 Brooklyn Heights, Fort Greene 101,672 15,263 24,216 39,479 8,464 11,010 19,474 BROOKLYN 3 Bedford Stuyvesant 110,962 33,939 32,468 66,407 29,344 26,558 55,901 BROOKLYN 4 Bushwick 106,830 34,078 31,654 65,732 26,388 22,437 48,825 BROOKLYN 5 East New York, Starrett City 130,829 38,356 32,636 70,992 39,001 32,828 71,829 BROOKLYN 6 Park Slope, Carroll Gardens 97,777 10,497 13,751 24,247 8,006 8,909 16,915 BROOKLYN 7 Sunset Park, Windsor Terrace 123,327 28,534 30,805 59,339 23,980 19,487 43,467 BROOKLYN 8 Crown Heights North 107,354 26,027 26,656 52,682 17,463 15,696 33,159 BROOKLYN 9 Crown Heights South, Wingate 101,782 22,639 21,678 44,317 17,972 15,243 33,215 BROOKLYN 10 Bay Ridge, Dyker Heights 99,690 11,948 14,437 26,385 12,076 11,565 23,641 BROOKLYN 11 Bensonhurst, Bath Beach 138,794 21,944 27,632 49,575 21,220 22,583 43,803 BROOKLYN 12 Borough Park, Ocean Parkway 138,909 40,076 27,415 67,491 40,583 27,721 68,303 BROOKLYN 13 Coney Island, Brighton Beach 92,194 21,166 21,992 43,158 14,388 19,986 34,373 BROOKLYN 14 Flatbush, Midwood 145,768 31,739 27,522 59,261 29,459 26,166 55,625 BROOKLYN 15 Sheepshead Bay, Gerritsen Beach 122,312 18,191 20,898 39,089 17,239 19,122 36,361 BROOKLYN 16 Brownsville, Ocean Hill 104,861 37,331 31,280 68,611 21,290 16,229 37,519 BROOKLYN 17 East Flatbush, Rugby, Farragut 133,120 28,378 24,604 52,982 27,603 21,822 49,425 BROOKLYN 18 Canarsie, Flatlands 169,640 24,634 21,935 46,569 20,450 16,853 37,303 MANHATTAN 1&2 Battery Park City, Tribeca / Greenwich Village, Soho 110,520 4,216 14,219 18,435 3,166 6,496 9,662 MANHATTAN 3 Lower East Side, Chinatown 140,855 24,114 39,240 63,354 22,154 28,138 50,292 MANHATTAN 4&5 Chelsea, Clinton / Midtown Business District 107,856 5,822 16,012 21,833 6,156 15,269 21,425 MANHATTAN 6 Stuyvesant Town, Turtle Bay 122,911 2,920 10,894 13,814 1,585 4,008 5,593 MANHATTAN 7 West Side, Upper West Side 167,499 9,400 15,672 25,072 7,667 14,037 21,704 MANHATTAN 8 Upper East Side 184,896 5,007 11,305 16,312 2,511 6,092 8,603 MANHATTAN 9 Manhattanville, Hamilton Heights 112,382 22,762 32,586 55,348 18,157 19,104 37,261 MANHATTAN 10 Central Harlem 96,773 25,261 30,382 55,643 19,777 19,691 39,468 MANHATTAN 11 East Harlem 101,266 28,039 32,848 60,886 23,718 26,482 50,199 MANHATTAN 12 Washington Heights, Inwood 197,663 49,090 51, ,074 40,275 47,680 87,955 QUEENS 1 Astoria, Long Island City 166,609 27,924 32,920 60,844 22,883 19,355 42,238 QUEENS 2 Sunnyside, Woodside 119,149 17,761 22,351 40,112 13,741 10,423 24,164 QUEENS 3 Jackson Heights, North Corona 157,895 32,876 31,847 64,723 28,684 20,000 48,685 QUEENS 4 Elmhurst, South Corona 127,811 24,832 23,096 47,928 29,250 21,820 51,069 QUEENS 5 Ridgewood, Glendale, Maspeth 143,526 22,144 20,822 42,966 17,179 12,809 29,988 QUEENS 6 Forest Hills, Rego Park 91,589 8,105 9,272 17,376 7,474 8,351 15,826 QUEENS 7 Flushing, Bay Terrace 204,722 26,770 30,251 57,021 23,095 21,879 44,974 QUEENS 8 Fresh Meadows, Briarwood 127,411 16,854 15,574 32,427 14,581 15,338 29,919 QUEENS 9 Woodhaven, Richmond Hill 127,641 23,101 20,511 43,611 21,458 16,943 38,401 QUEENS 10 Ozone Park, Howard Beach 111,278 16,718 17,520 34,238 15,355 11,492 26,848 QUEENS 11 Bayside, Douglaston, Little Neck 94,623 8,446 9,278 17,724 6,896 4,552 11,447 QUEENS 12 Jamaica, St. Albans, Hollis 191,563 39,244 36,411 75,655 33,728 26,772 60,500 QUEENS 13 Queens Village, Rosedale 167,248 20,225 18,103 38,328 17,114 16,011 33,125 QUEENS 14 The Rockaways, Broad Channel 88,139 20,146 18,710 38,855 14,836 18,584 33,421 Staten Island 1 Stapleton, Port Richmond 141,920 25,880 23,573 49,452 20,453 16,186 36,639 Staten Island 2 New Springville, South Beach 112,248 12,519 12,783 25,302 8,260 8,918 17,178 Staten Island 3 Tottenville, Woodrow, Great Kills 138,094 9,939 10,934 20,873 5,821 4,149 9,970 Bronx 1,187, , , , , , ,647 Brooklyn 2,154, , , , , , ,554 Manhattan 1,342, , , , , , ,162 Queens 1,919, , , , , , ,604 Staten Island 392,262 48,337 47,290 95,627 34,535 29,253 63,788 NEW YORK CITY 6,995,733 1,328,532 1,364,714 2,693,246 1,122,137 1,045,619 2,167,756 *For children, Child Health Plus A and B; For Adults, Adult Medicaid and Family Health Plus. A-8
27 TABLE C2: EPHINE* Residents in New York City Community Districts (October 2003) EPHINE* Rank Number of EPHINE* Residents EPHINE* Percentages BOROUGH CD Neighborhoods Children Adults Total Children Age <19 Adults Age Total EPHINE Percentage of Eligibles Who Are Not Enrolled Percent of Total Population Under 65 That Is EPHINE BRONX 1&2 Melrose, Mott Haven, Port Morris / Hunts Point, Longwood ,846 12,534 18,380 21% 14% BRONX 3&6 Morrisania, Crotona Park East / East Tremont, Belmont ,017 7,696 12,713 15% 10% BRONX 4 Highbridge, Concourse Village , ,984 4% 3% BRONX 5 University Hts., Fordham, Mt. Hope ,174 5,309 11,483 14% 9% BRONX 7 Bedford Park, Norwood, Fordham , ,261 8% 4% BRONX 8 Riverdale, Kingsbridge, Marble Hill ,188 1,282 7,470 24% 9% BRONX 9 Soundview, Parkchester ,643 8,428 18,071 23% 12% BRONX 10 Throgs Nk., Co-op City, Pelham Bay ,773 4,054 6,827 30% 7% BRONX 11 Pelham Pkwy, Morris Park, Laconia ,869 4,159 9,028 24% 9% BRONX 12 Wakefield, Williamsbridge ,047 3,231 7,278 15% 6% BROOKLYN 1 Williamsburg, Greenpoint ,458 7,175 11% 6% BROOKLYN 2 Brooklyn Heights, Fort Greene ,799 13,206 20,005 51% 20% BROOKLYN 3 Bedford Stuyvesant ,595 5,910 10,505 16% 9% BROOKLYN 4 Bushwick ,690 9,217 16,908 26% 16% BROOKLYN 5 East New York, Starrett City % 0% BROOKLYN 6 Park Slope, Carroll Gardens ,491 4,842 7,332 30% 7% BROOKLYN 7 Sunset Park, Windsor Terrace ,554 11,318 15,872 27% 13% BROOKLYN 8 Crown Heights North ,563 10,960 19,523 37% 18% BROOKLYN 9 Crown Heights South, Wingate ,667 6,435 11,102 25% 11% BROOKLYN 10 Bay Ridge, Dyker Heights ,872 3,203 12% 3% BROOKLYN 11 Bensonhurst, Bath Beach ,048 5,873 12% 4% BROOKLYN 12 Borough Park, Ocean Parkway % 1% BROOKLYN 13 Coney Island, Brighton Beach ,778 2,006 8,784 20% 10% BROOKLYN 14 Flatbush, Midwood ,279 1,357 3,636 6% 2% BROOKLYN 15 Sheepshead Bay, Gerritsen Beach ,777 2,729 7% 2% BROOKLYN 16 Brownsville, Ocean Hill ,041 15,051 31,092 45% 30% BROOKLYN 17 East Flatbush, Rugby, Farragut ,128 2,782 3,911 7% 3% BROOKLYN 18 Canarsie, Flatlands ,184 5,082 9,266 20% 5% MANHATTAN 1&2 Battery Park City, Tribeca / Greenwich Village, Soho ,050 7,723 8,773 48% 8% MANHATTAN 3 Lower East Side, Chinatown ,960 11,102 13,062 21% 9% MANHATTAN 4&5 Chelsea, Clinton / Midtown Business District % 1% MANHATTAN 6 Stuyvesant Town, Turtle Bay ,335 6,886 8,221 60% 7% MANHATTAN 7 West Side, Upper West Side ,733 1,635 3,368 13% 2% MANHATTAN 8 Upper East Side ,496 5,213 7,709 47% 4% MANHATTAN 9 Manhattanville, Hamilton Heights ,604 13,483 18,087 33% 16% MANHATTAN 10 Central Harlem ,484 10,691 16,174 29% 17% MANHATTAN 11 East Harlem ,321 6,366 10,687 18% 11% MANHATTAN 12 Washington Heights, Inwood ,814 4,305 13,119 13% 7% QUEENS 1 Astoria, Long Island City ,040 13,566 18,606 31% 11% QUEENS 2 Sunnyside, Woodside ,020 11,928 15,948 40% 13% QUEENS 3 Jackson Heights, North Corona ,192 11,846 16,038 25% 10% QUEENS 4 Elmhurst, South Corona ,433 1,433 3% 1% QUEENS 5 Ridgewood, Glendale, Maspeth ,965 8,013 12,978 30% 9% QUEENS 6 Forest Hills, Rego Park ,550 9% 2% QUEENS 7 Flushing, Bay Terrace ,675 8,373 12,047 21% 6% QUEENS 8 Fresh Meadows, Briarwood , ,929 9% 2% QUEENS 9 Woodhaven, Richmond Hill ,642 3,568 5,210 12% 4% QUEENS 10 Ozone Park, Howard Beach ,363 6,028 7,390 22% 7% QUEENS 11 Bayside, Douglaston, Little Neck ,550 4,726 6,276 35% 7% QUEENS 12 Jamaica, St. Albans, Hollis ,516 9,639 15,156 20% 8% QUEENS 13 Queens Village, Rosedale ,111 2,091 5,202 14% 3% QUEENS 14 The Rockaways, Broad Channel , ,683 15% 6% Staten Island 1 Stapleton, Port Richmond ,426 7,386 12,813 26% 9% Staten Island 2 New Springville, South Beach ,259 3,865 8,124 32% 7% Staten Island 3 Tottenville, Woodrow, Great Kills ,117 6,785 10,902 52% 8% Bronx ,843 47,652 99,495 16% 8% Brooklyn , , ,355 19% 8% Manhattan ,796 68,147 99,943 23% 7% Queens ,285 83, ,449 21% 7% Staten Island ,802 18,036 31,838 33% 8% NEW YORK CITY 213, , ,080 20% 8% *Eligible for Public Health Insurance but Not Enrolled A-9
28 TABLE C3: EPHINE* Ranges in New York City Community Districts (October 2003) EPHINE* Estimates BOROUGH CD Neighborhoods LOW RANGE 1999 Income Inflated 11.7% to $2003 MID RANGE Midpoint between Low and High HIGH RANGE 1999 Income Not Inflated MID RANGE PLUS Estimate of Undocumented Immigrant Adults Included BRONX 1&2 Melrose, Mott Haven, Port Morris / Hunts Point, Longwood 16,466 18,380 20,293 21,375 BRONX 3&6 Morrisania, Crotona Park East / East Tremont, Belmont 10,848 12,713 14,578 15,756 BRONX 4 Highbridge, Concourse Village 1,773 2,984 4,194 7,776 BRONX 5 University Hts., Fordham, Mt. Hope 9,837 11,483 13,130 15,846 BRONX 7 Bedford Park, Norwood, Fordham 3,875 5,261 6,647 10,310 BRONX 8 Riverdale, Kingsbridge, Marble Hill 6,489 7,470 8,451 10,491 BRONX 9 Soundview, Parkchester 15,885 18,071 20,257 22,045 BRONX 10 Throgs Nk., Co-op City, Pelham Bay 5,343 6,827 8,311 8,791 BRONX 11 Pelham Pkwy, Morris Park, Laconia 7,188 9,028 10,869 12,288 BRONX 12 Wakefield, Williamsbridge 5,473 7,278 9,083 12,687 BROOKLYN 1 Williamsburg, Greenpoint 5,409 7,175 8,941 12,258 BROOKLYN 2 Brooklyn Heights, Fort Greene 18,830 20,005 21,180 21,583 BROOKLYN 3 Bedford Stuyvesant 9,061 10,505 11,949 13,100 BROOKLYN 4 Bushwick 15,338 16,908 18,478 20,435 BROOKLYN 5 East New York, Starrett City ,074 6,103 BROOKLYN 6 Park Slope, Carroll Gardens 6,648 7,332 8,017 8,990 BROOKLYN 7 Sunset Park, Windsor Terrace 13,689 15,872 18,056 20,875 BROOKLYN 8 Crown Heights North 17,677 19,523 21,370 22,385 BROOKLYN 9 Crown Heights South, Wingate 9,578 11,102 12,625 15,779 BROOKLYN 10 Bay Ridge, Dyker Heights 2,456 3,203 3,950 7,630 BROOKLYN 11 Bensonhurst, Bath Beach 3,800 5,873 7,947 14,369 BROOKLYN 12 Borough Park, Ocean Parkway ,802 8,435 BROOKLYN 13 Coney Island, Brighton Beach 7,570 8,784 9,998 13,659 BROOKLYN 14 Flatbush, Midwood 1,238 3,636 6,033 11,825 BROOKLYN 15 Sheepshead Bay, Gerritsen Beach 908 2,729 4,549 9,818 BROOKLYN 16 Brownsville, Ocean Hill 29,157 31,092 33,028 32,864 BROOKLYN 17 East Flatbush, Rugby, Farragut 1,473 3,911 6,349 12,745 BROOKLYN 18 Canarsie, Flatlands 6,898 9,266 11,633 16,283 MANHATTAN 1&2 Battery Park City, Tribeca / Greenwich Village, Soho 8,071 8,773 9,474 11,731 MANHATTAN 3 Lower East Side, Chinatown 10,724 13,062 15,401 19,489 MANHATTAN 4&5 Chelsea, Clinton / Midtown Business District ,185 3,959 MANHATTAN 6 Stuyvesant Town, Turtle Bay 7,546 8,221 8,897 11,426 MANHATTAN 7 West Side, Upper West Side 2,141 3,368 4,596 7,830 MANHATTAN 8 Upper East Side 6,823 7,709 8,594 12,254 MANHATTAN 9 Manhattanville, Hamilton Heights 16,687 18,087 19,488 21,971 MANHATTAN 10 Central Harlem 14,994 16,174 17,354 18,034 MANHATTAN 11 East Harlem 9,413 10,687 11,961 13,098 MANHATTAN 12 Washington Heights, Inwood 9,841 13,119 16,397 23,940 QUEENS 1 Astoria, Long Island City 16,563 18,606 20,648 28,106 QUEENS 2 Sunnyside, Woodside 13,877 15,948 18,019 22,398 QUEENS 3 Jackson Heights, North Corona 13,553 16,038 18,523 26,176 QUEENS 4 Elmhurst, South Corona - 1,433 2,867 12,469 QUEENS 5 Ridgewood, Glendale, Maspeth 10,733 12,978 15,223 18,801 QUEENS 6 Forest Hills, Rego Park 661 1,550 2,440 7,393 QUEENS 7 Flushing, Bay Terrace 9,617 12,047 14,477 23,951 QUEENS 8 Fresh Meadows, Briarwood 1,410 2,929 4,449 9,278 QUEENS 9 Woodhaven, Richmond Hill 2,577 5,210 7,844 11,958 QUEENS 10 Ozone Park, Howard Beach 5,927 7,390 8,854 12,256 QUEENS 11 Bayside, Douglaston, Little Neck 5,552 6,276 7,001 10,344 QUEENS 12 Jamaica, St. Albans, Hollis 12,068 15,156 18,244 22,662 QUEENS 13 Queens Village, Rosedale 2,355 5,202 8,049 12,566 QUEENS 14 The Rockaways, Broad Channel 4,631 5,683 6,736 8,222 Staten Island 1 Stapleton, Port Richmond 10,565 12,813 15,060 15,844 Staten Island 2 New Springville, South Beach 6,444 8,124 9,803 11,155 Staten Island 3 Tottenville, Woodrow, Great Kills 9,257 10,902 12,547 13,934 Bronx 83,177 99, , ,365 Brooklyn 149, , , ,133 Manhattan 86,539 99, , ,732 Queens 99, , , ,581 Staten Island 26,266 31,838 37,410 40,933 NEW YORK CITY 445, , , ,744 *Eligible for Public Health Insurance but Not Enrolled A-10
29 BOROUGH CD Neighborhoods Table C4: New York City Community Districts, Basic Demographic Information (2000 Census) Percent of Total Population Foreign Born Income Below Poverty Level Median Household Income NYCHA Public Housing Number of Residents % of Total Population Asian Race or Hispanic Origin (Percent of Total Population) Black or African American Hispanic Origin White BRONX 1&2 Melrose, Mott Haven, Port Morris / Hunts Point, Longwood 24% 45% $ 16,565 30,933 24% 0% 24% 73% 1% BRONX 3&6 Morrisania, Crotona Park East / East Tremont, Belmont 22% 46% $ 16,565 21,843 15% 1% 35% 57% 5% BRONX 4 Highbridge, Concourse Village 35% 40% $ 21,275 5,455 4% 1% 36% 58% 1% BRONX 5 University Hts., Fordham, Mt. Hope 35% 41% $ 20,620 4,182 3% 2% 32% 62% 1% BRONX 7 Bedford Park, Norwood, Fordham 37% 33% $ 27, % 6% 20% 59% 11% BRONX 8 Riverdale, Kingsbridge, Marble Hill 31% 18% $ 42,370 4,277 4% 5% 12% 36% 44% BRONX 9 Soundview, Parkchester 24% 29% $ 28,295 20,794 12% 4% 33% 55% 4% BRONX 10 Throgs Nk., Co-op City, Pelham Bay 17% 11% $ 41,950 4,145 4% 3% 20% 27% 48% BRONX 11 Pelham Pkwy, Morris Park, Laconia 30% 17% $ 35,755 6,778 6% 6% 18% 34% 38% BRONX 12 Wakefield, Williamsbridge 37% 20% $ 36,870 9,309 6% 2% 66% 18% 10% BROOKLYN 1 Williamsburg, Greenpoint 33% 35% $ 26,325 16,703 10% 4% 5% 38% 48% BROOKLYN 2 Brooklyn Heights, Fort Greene 16% 23% $ 44,180 11,712 12% 5% 40% 17% 34% BROOKLYN 3 Bedford Stuyvesant 19% 35% $ 23,495 21,614 15% 1% 77% 18% 1% BROOKLYN 4 Bushwick 35% 38% $ 22,100 3,176 3% 3% 24% 67% 3% BROOKLYN 5 East New York, Starrett City 33% 33% $ 25,505 19,371 11% 3% 49% 38% 5% BROOKLYN 6 Park Slope, Carroll Gardens 16% 15% $ 53,090 10,993 11% 4% 13% 23% 55% BROOKLYN 7 Sunset Park, Windsor Terrace 43% 25% $ 33,760-0% 17% 4% 53% 23% BROOKLYN 8 Crown Heights North 31% 28% $ 28,780 7,326 8% 2% 78% 10% 7% BROOKLYN 9 Crown Heights South, Wingate 46% 24% $ 29, % 1% 76% 8% 11% BROOKLYN 10 Bay Ridge, Dyker Heights 37% 14% $ 43,090-0% 14% 1% 11% 69% BROOKLYN 11 Bensonhurst, Bath Beach 51% 20% $ 33,965-0% 23% 0% 9% 65% BROOKLYN 12 Borough Park, Ocean Parkway 42% 29% $ 29,780-0% 14% 3% 13% 65% BROOKLYN 13 Coney Island, Brighton Beach 47% 29% $ 22,670 13,709 13% 9% 16% 16% 55% BROOKLYN 14 Flatbush, Midwood 50% 23% $ 32,425-0% 8% 39% 13% 36% BROOKLYN 15 Sheepshead Bay, Gerritsen Beach 45% 17% $ 37,450 5,158 3% 13% 3% 6% 76% BROOKLYN 16 Brownsville, Ocean Hill 21% 43% $ 18,750 22,041 26% 1% 78% 18% 1% BROOKLYN 17 East Flatbush, Rugby, Farragut 55% 20% $ 34, % 1% 88% 6% 2% BROOKLYN 18 Canarsie, Flatlands 37% 12% $ 48,085 10,303 5% 4% 51% 8% 35% MANHATTAN 1&2 Battery Park City, Tribeca / Greenwich Village, Soho 24% 10% $ 72,468-0% 14% 4% 6% 73% MANHATTAN 3 Lower East Side, Chinatown 40% 28% $ 28,745 31,584 19% 35% 7% 27% 28% MANHATTAN 4&5 Chelsea, Clinton / Midtown Business District 25% 13% $ 59,828 5,495 4% 10% 6% 16% 64% MANHATTAN 6 Stuyvesant Town, Turtle Bay 24% 8% 68,940 $ 1,021 1% 11% 4% 7% 76% MANHATTAN 7 West Side, Upper West Side 22% 11% 64,125 $ 10,854 5% 6% 9% 17% 66% MANHATTAN 8 Upper East Side 21% 7% 74,130 $ 2,359 1% 6% 3% 6% 83% MANHATTAN 9 Manhattanville, Hamilton Heights 36% 32% $ 27,365 8,225 7% 5% 31% 43% 18% MANHATTAN 10 Central Harlem 18% 37% $ 19,920 19,792 18% 1% 77% 17% 2% MANHATTAN 11 East Harlem 21% 37% $ 21,295 35,212 30% 3% 36% 52% 7% MANHATTAN 12 Washington Heights, Inwood 53% 30% $ 28,865 4,151 2% 2% 8% 74% 14% QUEENS 1 Astoria, Long Island City 46% 20% $ 35,750 18,221 9% 13% 10% 27% 42% QUEENS 2 Sunnyside, Woodside 60% 16% $ 38,965-0% 27% 2% 36% 31% QUEENS 3 Jackson Heights, North Corona 62% 19% $ 39, % 13% 11% 57% 15% QUEENS 4 Elmhurst, South Corona 68% 19% $ 36,470-0% 30% 7% 50% 11% QUEENS 5 Ridgewood, Glendale, Maspeth 36% 14% $ 40,870-0% 6% 1% 28% 62% QUEENS 6 Forest Hills, Rego Park 52% 11% $ 47, % 21% 2% 11% 62% QUEENS 7 Flushing, Bay Terrace 50% 13% $ 43,480 1,827 1% 36% 3% 17% 41% QUEENS 8 Fresh Meadows, Briarwood 44% 11% $ 48,705 4,366 3% 24% 14% 16% 40% QUEENS 9 Woodhaven, Richmond Hill 49% 15% $ 42, % 16% 7% 36% 28% QUEENS 10 Ozone Park, Howard Beach 39% 11% $ 47, % 13% 17% 21% 34% QUEENS 11 Bayside, Douglaston, Little Neck 36% 7% 57,960 $ - 0% 26% 2% 9% 60% QUEENS 12 Jamaica, St. Albans, Hollis 34% 17% 40,435 $ 4,522 2% 5% 72% 14% 2% QUEENS 13 Queens Village, Rosedale 39% 7% 57,080 $ 166 0% 10% 55% 10% 18% QUEENS 14 The Rockaways, Broad Channel 24% 22% 33,815 $ 9,286 9% 2% 40% 18% 37% Staten Island 1 Stapleton, Port Richmond 19% 16% 46,515 $ 7,877 5% 5% 22% 20% 50% Staten Island 2 New Springville, South Beach 24% 9% $ 56,610 3,200 3% 9% 2% 10% 77% Staten Island 3 Tottenville, Woodrow, Great Kills 20% 5% $ 64,260-0% 3% 1% 6% 89% A-11
INTERNET INEQUALITY: BROADBAND ACCESS IN NYC
 Office of the Comptroller Scott M. Stringer Bureau of Policy and Research www.comptroller.nyc.gov December 2014 POLICY BRIEF INTERNET INEQUALITY: BROADBAND ACCESS IN NYC Office of the Comptroller City
STOP-AND-FRISK 2011 NYCLU BRIEFING
 STOP-AND-FRISK 2011 NYCLU BRIEFING The February 1999 shooting death of Amadou Diallo by police officers in the NYPD s Street Crimes Unit triggered a broad public controversy about racial profiling and
New York City Department of Health & Mental Hygiene Bureau of Maternal, Infant & Reproductive Health TEEN PREGNANCY IN NEW YORK CITY: 1997-2007
 New York City Department of Health & Mental Hygiene Bureau of Maternal, Infant & Reproductive Health TEEN PREGNANCY IN NEW YORK CITY: 1997-2007 Bureau of Maternal, Infant, & Reproductive Health 1 TEEN
A NETWORK OF YOUTH OPPORTUNITY CENTERS
 A NETWORK OF YOUTH OPPORTUNITY CENTERS (Across all five Boroughs) Background Approximately one-third of the young adults who live in New York City s predominantly low-income communities, like Mott Haven
Youth Disconnection in New York City
 Youth Disconnection in New York City A New York metro area closeup based on the report One in Seven: Ranking Youth Disconnection in the 25 Largest Metro Areas. To download this report, go to http://www.measureofamerica.org/one-in-seven.
NEW YORK CITY COMMUNITY HEALTH SURVEY ATLAS
 NEW YORK CITY COMMUNITY HEALTH SURVEY ATLAS 2008 Table of Contents Community Health Survey Atlas 2008 General Physical and Mental Health Fair or poor self-reported health History of depression Asthma ever
Where Are the Unbanked and Underbanked in New York City?
 OPPORTUNITY AND OWNERSHIP INITIATIVE Where Are the Unbanked and Underbanked in New York City? Caroline Ratcliffe, Signe-Mary McKernan, Emma Kalish, and Steven Martin September 2015 Nationwide, millions
Criminal Court Summonses in New York City
 Criminal Court in New York City 700,000 650,000 600,000 550,000 500,000 450,000 NYC Criminal Court 400,000 350,000 300,000 250,000 NYC Misdemeanor Arrests 200,000 150,000 100,000 50,000 NYC Felony Arrests
BED BUGS IN NEW YORK CITY A CITIZEN S GUIDE TO THE PROBLEM
 BED BUGS IN NEW YORK CITY A CITIZEN S GUIDE TO THE PROBLEM telephone/ f a x : ( 6 4 6 ) 4 1 7-8 1 6 8 n e w y o r k v s b e d b u g s. o r g i n f o @ n e w y o r k v s b e d b u g s. o r g Table of Contents
SUMMARY OF VITAL STATISTICS 2012 THE CITY OF NEW YORK
 SUMMARY OF VITAL STATISTICS 2 THE CITY OF NEW YORK PREGNANCY OUTCOMES 4 35 Birth Rate per 1, Population 3 25 2 1 14.8 5 1898* 1913* 192 194 1954 198 1982 199 2 *1898-1913 Birth counts are estimated as
Prequalified. Preapproved. Guide to Buying. Finances
 Guide to Buying Guide to Buying congratulations! This is the first step to walking into your very own home. citi habitats works to make the buying experience enjoyable. This guide will help you navigate
Working but Poor: Asian American Poverty in New York City
 Working but Poor: Asian American Poverty in New York City Working but Poor: Asian American Poverty in New York City October 2008 Funding for the Report by C.J. Huang Foundation Ong Family Foundation United
ECONOMIC SECURITY AND WELL-BEING INDEX FOR WOMEN IN NEW YORK CITY MARCH 2013
 1 ECONOMIC SECURITY AND WELL-BEING INDEX FOR WOMEN IN NEW YORK CITY MARCH 2013 2 Acknowledgements This report was written by C. Nicole Mason, PhD, Executive Director of the Center for Research and Policy
THE REAL ESTATE BOARD OF NEW YORK LANDMARKING, HOUSING PRODUCTION AND DEMOGRAPHICS IN NYC
 THE REAL ESTATE BOARD OF NEW YORK LANDMARKING, HOUSING PRODUCTION AND DEMOGRAPHICS IN NYC LANDMARKING, HOUSING PRODUCTION AND DEMOGRAPHICS IN NYC OVERVIEW New York City s Landmarks Law turns 50 this year,
GED/LITERACY PROGRAM FOR THE SOUTHERN AND EASTERN DISTRICT S OF NEW YORK
 GED/LITERACY PROGRAM FOR THE SOUTHERN AND EASTERN DISTRICT S OF NEW YORK TABLE OF CONTENTS BRONX ADULT LEARNING CENTER...Pages 1-4 MANHATTAN ADULT LEARNING CENTER...Pages 5-7 BROOKLYN ADULT LEARNING CENTER...Pages
Immigrant Settlement Patterns in New York City
 CHAPTER Immigrant Settlement Patterns in New York City This chapter examines the spatial distribution of the foreign-born in New York City in 2011. It focuses on borough level distributions, immigrant
The River Fund New York 89-11 Lefferts Boulevard Richmond Hill NY 11418
 The River Fund New York 89-11 Lefferts Boulevard Richmond Hill NY 11418 EIN # ~ 11-345063 Office ~ 718.441.1125 Fax ~ 718.441.1126 Website ~ www.riverfund-ny.org Email ~ [email protected] MISSION The
Sexual & Reproductive Health Services in New York City
 Sexual & Reproductive Health Services in New York City...for the underserved and uninsured HE NEW YORK CIY DEPRMEN of HELH and MENL HYGIENE Michael R. Bloomberg, Mayor homas R. Frieden, M.D., M.P.H., Commissioner
HIGH SCHOOL GRADUATION IN NEW YORK CITY
 MEASURE OF AMERICA of the Social Science Research Council HIGH SCHOOL GRADUATION IN NEW YORK CITY IS NEIGHBORHOOD STILL DESTINY? KRISTEN LEWIS SARAH BURD-SHARPS Andy Garon STATISTICIAN Rebecca Gluskin
B R O N X. 25 United Bronx Parents, Inc. 966 Prospect Avenue, 1st & 2nd Floor (718) 617-6060
 617-6060") 25 United Bronx Parents, Inc. 966 Prospect Avenue, 1st & 2nd Floor (718) 617-6060 26 Argus Community, Inc. 760 East 160th Street, (718) 401-5700 27 Osborne Treatment Services, Inc. 801-809 Westchester
25 United Bronx Parents, Inc. 966 Prospect Avenue, 1st & 2nd Floor (718) 617-6060 26 Argus Community, Inc. 760 East 160th Street, (718) 401-5700 27 Osborne Treatment Services, Inc. 801-809 Westchester
GED Plus Locations. Program Site name Address Borough. Bronx GED Plus Hub/Referral Center at Bronx Regional High 1010 Rev. James Polite Avenue Bronx
 Program Site name Address Borough Bronx GED Plus Hub/Referral Center at Bronx Regional High 1010 Rev. James Polite Avenue Bronx School GED Plus at Bronx Community College Future Now 2155 University Avenue
Capalino + Company NEW YORK CITY COUNCIL FACEBOOK
 NEW YORK CITY COUNCIL FACEBOOK New York City Council Chairmanships and Leadership Positions Manhattan Council Member 250 District Notes 1 Margaret Chin 8-7259 (212) 587-3159 Chair of: Lower Manhattan Development
GED PLUS PROGRAM DIRECTORY
 GED PLUS PROGRAM DIRECTORY BRONX BROOKLYN MANHATTAN QUEENS STATEN ISLAND GED Plus helps students earn their GED plus prepares them for college and career options. Students 18-21 years old can choose to
Financial Service Centers of New York Check Cashing Locations in New York (by zip code)
") CashZone Check Cashing Corp. 365 Seventh Avenue New York NY 10001 212-564-4705 N N Manhattan City Services, Inc. 245 West 29th Street New York NY 10001 212-239-8838 N N Manhattan UBNY, LLC (Money Centers)
CashZone Check Cashing Corp. 365 Seventh Avenue New York NY 10001 212-564-4705 N N Manhattan City Services, Inc. 245 West 29th Street New York NY 10001 212-239-8838 N N Manhattan UBNY, LLC (Money Centers)
BROOKLYN COMMUNITY HEALTH
 GREENPOINT DOWNTOWN / HEIGHTS / PARK SLOPE WILLIAMSBURG / BUSHWICK BEDFORD STUYVESANT / CROWN HEIGHTS EAST NEW YORK SUNSET PARK FLATBUSH / EAST FLATBUSH CARSIE / FLATLANDS BOROUGH PARK BENSONHURST / BAY
SCHEDULE FOR SEPTEMBER 2013
 SCHEDULE FOR SEPTEMBER 2013 Mon., Sept. 2 Wed., Sept. 4 LABOR DAY ROSH HASHANAH BEGINS AT SUNDOWN Tuesday KEEPERS---140 Woodbine St., Bergenfield, NJ Sept. 10 201-387-2900 Wednesday QUEENS FRESH MEADOWS
Below is a list of neighborhood sites where someone will prepare your taxes for FREE. Refer to the Key for important eligibility information.
 Below is a list of neighborhood sites where someone will prepare your taxes for FREE. Refer to the Key for important eligibility information. Key Sites with this icon are Volunteer Income Tax Assistance
Manhattan Free and Low Cost English Classes. Program Name/ website Address/Directions Contact Class Information
 Updated: 3/31/2015 *Informations are subject to change, please contact program for most updated information* If information needs to be update please contact [email protected] Manhattan Free and Low Cost
PREVENTIVE SERVICES DIRECTORY
 PREVENTIVE SERVICES DIRECTORY Michael R. Bloomberg Mayor John B. Mattingly Commissioner Revised 8/07 NYC Administration for Children s Services provides preventive services, directly or through contracted
Brooklyn Directory of Youth Services. A Resource Guide for Locating Youth Services in Your Community
 Brooklyn Directory of Youth Services A Resource Guide for Locating Youth Services in Your Community June 2009 How to Use this Directory What is this directory for? The purpose of this directory is to help
Mobility, Economic Opportunity and New York City Neighborhoods
 Mobility, Economic Opportunity and New York City Neighborhoods Sarah M. Kaufman, Mitchell L. Moss, Justin Tyndall and Jorge Hernandez December 2014 with support from Mobililty, Economic Opportunity and
Office of Adult and Continuing Education
 Office of Adult and Continuing Education About OACE The Office of Adult and Continuing Education s mission is to empower adults in their roles as parents, family members, workers and community members.
Closed School Records Parochial Schools (with year of closing)
") Closed School Records One of the chief tasks of the Diocesan Archives is to maintain the records of closed Catholic schools. The Diocesan Archives keeps the records for the following schools: Parochial
Closed School Records One of the chief tasks of the Diocesan Archives is to maintain the records of closed Catholic schools. The Diocesan Archives keeps the records for the following schools: Parochial
Preliminary Fiscal 2016 Budget Testimony ADDENDUM DoITT Free WiFi Locations, By Borough (As of February 2015)
") Preliminary Fiscal 2016 Budget Testimony ADDENDUM DoITT Free WiFi Locations, By Borough (As of February 2015) Summary: - NYCHA Community Computer s (7 s Total) - NYC Connected Community Sites (95 Sites
Preliminary Fiscal 2016 Budget Testimony ADDENDUM DoITT Free WiFi Locations, By Borough (As of February 2015) Summary: - NYCHA Community Computer s (7 s Total) - NYC Connected Community Sites (95 Sites
On the Brink: Homelessness a Reality in the South Bronx
 On the Brink: Homelessness a Reality in the South Bronx july 0 a National Survey policy report from ICPH In a time of budget cuts, it is critical to examine public opinions and demographics of some of
BASIC FACTS ABOUT THE FAMILY EVICTION PREVENTION SUPPLEMENT (FEPS) PROGRAM
 PROGRAM") Brooklyn Neighborhood Office 111 Livingston Street - 7th Fl. T (718) 722-3100 www.legal-aid.org Blaine (Fin) V. Fogg President BASIC FACTS ABOUT THE FAMILY EVICTION PREVENTION SUPPLEMENT (FEPS) PROGRAM
Brooklyn Neighborhood Office 111 Livingston Street - 7th Fl. T (718) 722-3100 www.legal-aid.org Blaine (Fin) V. Fogg President BASIC FACTS ABOUT THE FAMILY EVICTION PREVENTION SUPPLEMENT (FEPS) PROGRAM
FOR REAL ESTATE & URBAN POLICY
 FURMAN CENTER N E W Y O R K U N I V E R S I T Y FOR REAL ESTATE & URBAN POLICY S C H O O L O F L A W W A G N E R S C H O O L OF P U B L I C S E R V I C E 139 MacDougal Street, 2 nd Floor, New York, NY
The River Fund New York 89-11 Lefferts Boulevard Richmond Hill NY 11418
 The River Fund New York 89-11 Lefferts Boulevard Richmond Hill NY 11418 EIN # ~ 11-3450363 Office ~ 718.441.1125 Fax ~ 718.441.1126 Website ~ www.riverfund-ny.org Email ~ [email protected] MISSION
A New and Unique Way to Care for New Yorkers
 The Advantage of ADVANTAGECARE PHYSICIANS The right care... At EmblemHealth, we know care is at the heart of every successful community. That s why it is the cornerstone of our innovative community initiatives
The data reveal some distinct advantages to be harnessed and disadvantages to address.
 Exhi bi tcle000040 Submi t t ed12/ 22/ 11 Nearly half a million New Yorkers are registered occupants of public housing, and the actual number of people living there is likely much higher. The New York
THE ADVANTAGE OF ADVANTAGECARE PHYSICIANS
 THE ADVANTAGE OF ADVANTAGECARE PHYSICIANS THE RIGHT CARE... At EmblemHealth, we know care is at the heart of every successful community. That s why it is the cornerstone of our innovative community initiatives
City Council Committee on Aging Hearing
 City Council Committee on Aging Hearing New York City Department of Finance Testimony of Timothy Sheares, Deputy Commissioner- Property Division June 22, 2016 1 Good afternoon, Chairwoman Chin and members
THE NEW YORK INTERAGENCY ENGINEERING COUNCIL
 THE NEW YORK INTERAGENCY ENGINEERING COUNCIL Click here for a pdf version of the newsletter and other features 2nd Quarter, 2009 Contents Conference Wrap-up Quarterly Meeting Annual Luncheon Economic Stimulus
GNY Participating Institutions
 GNY Participating Institutions AFFINITY SKILLED LIVING ALBANY COUNTY AND ANN LEE NURSING HOMES (RNS') ATLANTIS REHAB. CTR. BAYVIEW NURSING AND REHAB. CTR. BEACH TERRACE CTR. BEZALEL NURSING HOME BRONX
DYCD after-school programs: Beacon Satellite At NYCHA Program
 PROGRAM TYPE PROGRAM SITE NAME After-School Programs,Beacon,NYCHA Centers Beacon Satellite NYCHA EDENWALD HOUSES After-School Programs,Beacon,NYCHA Centers Beacon Satellite NYCHA REDFERN HOUSES After-School
New York State Charter Schools 2014-15 School Year (Updated September 1, 2014) Total open and operating 2014-2015 = 248
 Total open and operating 2014-2015 = 248") New York State Charter Schools 2014-15 School Year (Updated September 1, 2014) Total open and operating 2014-2015 = 248 Count Institution ID BEDS Code Charter School Authorizer District 1 800000064236
New York State Charter Schools 2014-15 School Year (Updated September 1, 2014) Total open and operating 2014-2015 = 248 Count Institution ID BEDS Code Charter School Authorizer District 1 800000064236
THE COUNCIL OF THE CITY OF NEW YORK
 THE COUNCIL OF THE CITY OF NEW YORK Hon. Melissa Mark-Viverito Speaker of the Council Hon. Daniel Dromm Chair, Committee on Education Report on the Fiscal 2017 Preliminary Budget and the Fiscal 2016 Preliminary
Get Care. Get Covered.
 Get Care. Get Covered. Family Planning Benefit Program & More FPBP Contents What is the Family Planning Benefit Program?... What are the benefits?... Who is eligible?... How do I apply for FPBP?... Where
DOMINICANS IN THE UNITED STATES: A SOCIOECONOMIC PROFILE, 2000
 DOMINICANS IN THE UNITED STATES: A SOCIOECONOMIC PROFILE, 2000 by Ramona Hernández Associate Professor of Sociology City College, City University of New York & Director, CUNY Dominican Studies Institute
REFERRAL LIST OF CLASSES IN QUEENS FOR ADULTS IN ENGLISH FOR SPEAKERS OF OTHER LANGUAGES (ESOL) FALL 2015
 FALL 2015") REFERRAL LIST OF CLASSES IN QUEENS FOR ADULTS IN ENGLISH FOR SPEAKERS OF OTHER LANGUAGES (ESOL) FALL 2015 Prepared by The New Americans Program Queens Library 89-11 Merrick Blvd. Jamaica, NY 11432 August
REFERRAL LIST OF CLASSES IN QUEENS FOR ADULTS IN ENGLISH FOR SPEAKERS OF OTHER LANGUAGES (ESOL) FALL 2015 Prepared by The New Americans Program Queens Library 89-11 Merrick Blvd. Jamaica, NY 11432 August
New York State Profile
 New York State Profile Jennifer Guinn EDUC 547 FALL 2008 According to 2006 U.S. Census estimates, with a total population of over 19 million people, 20 percent of New York State s population were foreign-born
Launching Low-Income Entrepreneurs
 www.nycfuture.org April 2013 Launching Low-Income Entrepreneurs With middle-income jobs in decline, entrepreneurship offers an increasingly promising pathway out of poverty; but few low-income New Yorkers
File your taxes safely and for free at these tax preparation sites, including:
 File your taxes safely and for free at these tax preparation sites, including: Volunteer Income Tax Assistance (VITA) sites At these sites an IRS-trained and certified volunteer will help you file your
Enrollment Projections. New York City Public Schools. 2012-13 to 2021-22. Volume II
 Enrollment Projections for the New York City Public Schools 2012-13 to 2021-22 Volume II Prepared for the New York City School Construction Authority February 2013 2 TABLE OF CO TE TS Page Executive Summary...
ACTIVE PROPRIETARY SCHOOLS HAVING BPSS-APPROVED PCA OR HHA TRAINING PROGRAMS
 ACTIVE PROPRIETARY SCHOOLS HAVING BPSS-APPROVED PCA OR HHA TRAINING PROGRAMS (s. means since and indicates the date of approval for the particular curriculum). updated 10/15/2015 CHANGES FROM LAST LIST:
HOME VISITING PROGRAMS BY COUNTY
 HOME VISITING PROGRAMS BY COUNTY County Program and Addresses Target area Contact Area Albany Healthy Families Albany County Albany County Dept for Children, Youth, and Families with Parson s Child and
Personalized Directory July 8, 2013. Search Criteria. ZIP Code: 11205
 Search Criteria Personalized Directory July 8, 2013 Facility Type: Ancillary Facility Distance: Within 25 miles ZIP Code: 11205 Specialty: Our network is always evolving, so once you've chosen the doctor,
Changes in Health Insurance Coverage in the Great Recession, 2007-2010 John Holahan and Vicki Chen The Urban Institute Executive Summary
 I S S U E P A P E R kaiser commission on medicaid and the uninsured Changes in Health Insurance Coverage in the Great Recession, 2007-2010 John Holahan and Vicki Chen The Urban Institute Executive Summary
RACE, CLASS & MARIJUANA ARRESTS
 RACE, CLASS & MARIJUANA ARRESTS RR IN MAYOR DE BLASIO'S TWO NEW YORKS THE NYPD'S MARIJUANA ARREST CRUSADE CONTINUES IN 2014 The New York Police Department under Mayor de Blasio made slightly more total
HEALTH INSURANCE COVERAGE STATUS. 2009-2013 American Community Survey 5-Year Estimates
 S2701 HEALTH INSURANCE COVERAGE STATUS 2009-2013 American Community Survey 5-Year Estimates Supporting documentation on code lists, subject definitions, data accuracy, and statistical testing can be found
Epi Research Report New York City Department of Health and Mental Hygiene May 2010
 Epi Research Report New York City Department of Health and Mental Hygiene May 2010 Including New Yorkers Who Can Be Reached Only by Cell Phone in the Community Health Survey: Results from the 2008 Cell
PROPOSED FY 2015 2019 FIVE-YEAR CAPITAL PLAN
 PROPOSED FY 2019 FIVE-YEAR CAPITAL PLAN November 2013 2 Table of Contents EXECUTIVE SUMMARY 5 Introduction 7 FY2010 2014 Capital Plan Summary 9 Structure of the FY 2019 Capital Plan 11 Capacity 12 Capital
Health Insurance Coverage in Texas
 Health Insurance Coverage in Texas U.S. Census Current Population Survey 2012 Data March 2014 Fast Facts: Texans & Health Insurance (2012) 6.4 million uninsured Texans, 24.6% of all ages Highest rate in
Sandy s Effects on Housing in New York City
 MARCH 2013 FACT BRIEF Effects on Housing in New York City Four months after Superstorm Sandy, New Yorkers continue to pick up the pieces and rebuild. Sandy devastated many parts of the city, including
ELMHURST HOSPITAL CENTER
 2013 Community Health Needs Assessment and Implementation Strategy ELMHURST HOSPITAL CENTER 79-01 Broadway Elmhurst, NY 11373 (718) 334-4000 Please contact Vincent Henry at (718) 334-5827 for additional
APPENDIX D SUBSTANCE ABUSE TREATMENT FACILITIES
 APPENDIX D FACILITY Manhattan SUBSTANCE ABUSE TREATMENT FACILITIES ADDRESS/PHONE SERVICES Beth Israel Stuyvesant Square Chemical Dependency Bernstein Pavilion 1-9 Nathan D. Perlman Place New York, NY 10003
Health Care Reform in New York City Access to Primary Care Before Reform
 Epi Research Report New York City Department of Health and Mental Hygiene November 2011 Health Care Reform in New York City Access to Primary Care Before Reform The Affordable Care Act (ACA) the nation's
Racial and ethnic health disparities continue
 From Families USA Minority Health Initiatives May 2010 Moving toward Health Equity: Health Reform Creates a Foundation for Eliminating Disparities Racial and ethnic health disparities continue to persist
How To Care For The Elderly In A Nursing Home
 Eldercare Facilities (Nursing Homes): Most eldercare facilities welcome volunteers to provide activities for seniors such as reading aloud, music, games Manhattan Jewish Home Life Care www.jewishhome.org,
DIRECTORY OF PARTICIPATING OPTICAL PANELISTS. September 2015 WWW.UFTWF.ORG
 DIRECTORY OF PARTICIPATING OPTICAL PANELISTS September 2015 WWW.UFTWF.ORG Table of Contents GENERAL INFORMATION... 2 PARTICIPATING PANELISTS... 7 NEW YORK... 7 Manhattan... 7 Staten Island... 11 Bronx...
Medicare Buy-In Options for Uninsured Adults
 MEDICARE BUY-IN OPTIONS: ESTIMATING COVERAGE AND COSTS John Sheils and Ying-Jun Chen The Lewin Group, Inc. February 2001 Support for this research was provided by The Commonwealth Fund. The views presented
FREE TAX PREPARATION SITES Following is a partial list of free tax preparation sites for lower income New Yorkers.
 FREE TAX PREPARATION SITES Following is a partial list of free tax preparation sites for lower income New Yorkers. New York City To locate free tax preparation sites throughout New York City, call: 311
RESIDENCES STUDENT RESOURCES
 SVA.EDU 1 ACADEMIC DEPARTMENTS Advertising (BFA): [1], 2nd floor Animation (BFA): [4], 5th floor Art Education (MAT): [10], 4th floor Art History: [11], 4th floor Art Practice (MFA): [14], 5th floor Art
GAO HEALTH INSURANCE. Report to the Committee on Health, Education, Labor, and Pensions, U.S. Senate. United States Government Accountability Office
 GAO United States Government Accountability Office Report to the Committee on Health, Education, Labor, and Pensions, U.S. Senate March 2008 HEALTH INSURANCE Most College Students Are Covered through Employer-Sponsored
District Resource Statement
 District Resource Statement Department of Health and Mental Hygiene Fiscal and Service Reports For Fiscal Years 2013 and 2014 The City of New Michael R. Bloomberg, Mayor District Resource Statement Department
Queens Directory of Youth Services. A Resource Guide for Locating Youth Services in Your Community
 Queens Directory of Youth Services A Resource Guide for Locating Youth Services in Your Community June 2009 How to Use this Directory What is this directory for? The purpose of this directory is to help
kaiser medicaid uninsured commission on March 2013 Key Facts on Health Coverage for Low-Income Immigrants Today and Under the Affordable Care Act
 on on medicaid and and the the uninsured March 2013 Key Facts on Health Coverage for Low-Income Immigrants Today and Under the Affordable Care Act EXECUTIVE SUMMARY Beginning in 2014, the Affordable Care
STUCK AT THE TURNSTILE: FAILED SWIPES SLOW DOWN SUBWAY RIDERS
 STUCK AT THE TURNSTILE: FAILED SWIPES SLOW DOWN SUBWAY RIDERS A REPORT BY PUBLIC ADVOCATE BETSY GOTBAUM JUNE 2005 Visit us on the web at www.pubadvocate.nyc.gov or call us at 212-669-7200. Office of the
Which New York City schools serve the highest-need and lowest-need students?
 Which New York City schools serve the highest-need and lowest-need students? The charts below show how many of the city s highest-need students are enrolled in each district and charter school in each
The Impact of Historic Districts on Residential Property Values
 New York City Independent Budget Office Background Paper A September 2003 The Impact of Historic s on Residential Property Values For more reports on... Housing and Community Development Issues...visit