Wolfe Wave I was introduced to this setup back when Linda Raschke
|
|
|
- Scarlett Mills
- 10 years ago
- Views:
Transcription
1 Wolfe Wave I was introduced to this setup back when Linda Raschke mentioned the pattern in a market call. Being the ever curious one, I found some additional references and examples in her book StreetSmarts, saying that "this particular methodology is perhaps the most unique, effective trading technique I've (Linda) ever came across! It was developed and shared by a good friend, Bill Wolfe, who for the last 10 years has made a living trading the S&P." The next jump lead to an excellent source of information which was read, absorbed, and served as inspiration for use in the real world markets. Being very interested in reversal sequences, this approach appeals very much to my risk profile and trading style based on chart patterns (classic Edwards and Magee). The key to recognizing the setup is symmetry. Ideally, waves are established with very regular timing intervals between moves. The other key ingredient is that the wave 4 should revisit the price range established by waves 1-2 for the best results. Another way to describe the pattern is that it comes as a rising wedge / channel in an uptrend, or falling wedge / channel in a downtrend. Wave 5 is often a false breakout move beyond the bounds of the pattern. Unlike either bull or bear flags, the movement is in the same direction as the overall trend, with the overlapping waves giving signals that an impending reversal is taking shape. This pattern has different names, depending on the source - Larry Pesavento describes the pattern as "3 pushes to a top/bottom" and uses Fibonacci relationships to confirm the setup (waves 3 and 5 are 127% or 162% extensions of the previous pullback.) Jeff Cooper uses "Cooper swing" nomenclature, and Linda Raschke likes to call this setup "3 indians". The unique quality about wolfewaves, however, is the objective target projection from waves 1 -> 4. Despite the great explanation and examples provided on Bill Wolfe's site, I continue to get questions about how much I trust this setup. Very much so. The ١

2 following are setups encountered over the years - most were called as wolfewaves right as the pattern was found, trade taken, and real money put to work to measure the risk and reward in real world cash. Realize that what I have outlined here is my approach to recognizing and trading this effective pattern setup. Mr. Wolfe is certainly the expert in this field and has no doubtedly further refined his methodology. This article was written without the benefit of his course, but rather born from a desire to more effectively trade reversal sequences - in particular, rising and falling wedges. Although many charts (especially some early examples) are not perfect wolfewaves, they document much of my own learning process. I hope they serve as inspiration for further study and successful trading. For the most current setups and examples of daytrading Emini futures contract using wolfewave pattern setups, please see my voodooo trading blog. It provides realtime highlights of this pattern setup through the financial meldown starting in October Who needs bulls and bears when you can run with the wolfes? ES /Emini S&P Futures Contract Setup This gem was evolving into a rather frothy afternoon session in S&P trading. Note that is it very helpful to combine the setup evolution with other key support and resistance levels. In this case, a "measured move" completes around 902 and price action falls to test the lower bound of rising channel. The bounce sets up waves 1-4, and it is only a matter of patience to wait for the full pattern completion of wave #5 - a final stop/limit clearing move into close gives us the wolfewave setup. ٢

3 Target Market opens up next morning at target juncture, and immediately reverses to retest the previous day's highs. Setup This is now November 14, 2003 and the markets have experienced the most astonishing bull cycle run following a 3 year old structural bear correction. Many daily charts are exhibiting overlapping wave structures in a push to new highs on waning momentum. This setup is very similar to the wolfewave found one year earlier on the December emini contract. A slew of good news is released right at 9:40am into the run up. ٣

4 Target Within 30 minutes the target projection is met. A second retest of this impulse pushes.75 lower, and sets low mark for the morning session. ٤

5 Bonds Setup It all started with a hilarious, but amazingly accurate call by new market wizard Linda Raschke. The larger perspective reveals wolfewave pattern. ٥

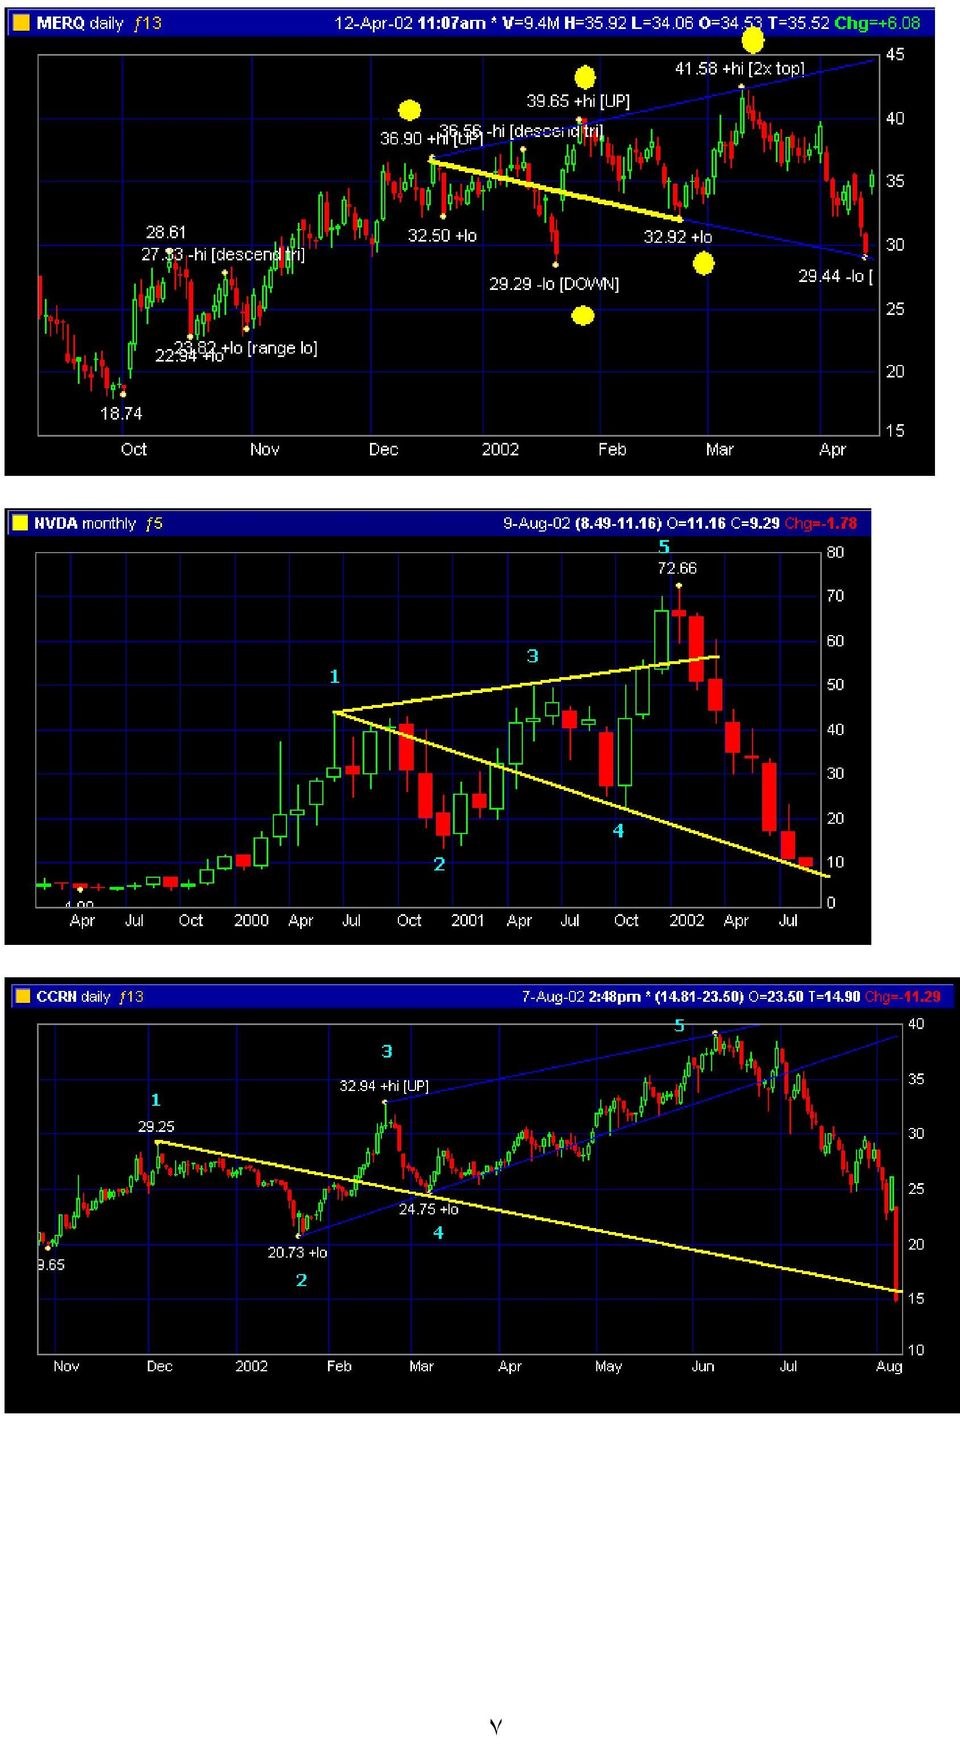
6 Various Stock Examples ٦

7 ٧
8 ٨

9 XAU /Gold and Silver Index Setup A longtime favorite sector of mine, gold exhibits wolfewave patterns at major junctures. Note the two lead-ins (cyan and magenta) are smaller wolfewave setups before this final move in November There was also a compelling similarity to the previous inflection lows established in June Take a good look at this chart - it is the first higher-low trendline test in a 14- year bear market. ٩

10 Confirm Within the scope of larger pattern setups, a 3x knock breakout of trendline is registered on a monthly basis. Target, Setup The results were outstanding. You should note that despite the first target measure around 59 in January 2002, the pullback was mild and did not setup a reversal sequence back down. Why? Because instead of retracing back and printing prices below the previous inflection high, the 20 day exponential moving average (gray) was used as support thru the entire uptrend ١٠

11 move. A conscious decision was made to wait until a 141.4% extension was achieved, reciprocal of 70.7% retracement experience in previous pullbacks. It is also interesting to note the symmetry in the first set of impulse November- January moves, compared to those that followed from January into May Positions were exited, and the pullback sequence monitored for a move very similar to waves 1-2. Reversal Shifting down to intraday action, a reversal top showed on smaller granularity. Another key element can also be seen here - wave #5 is often made on a divergent signal versus the MACD (moving average convergence divergence) technical indicator readings in the form of higher prices, lower high in oscillator. Once again, pattern is shown as the initial target objective is achieved. ١١
 technical indicator readings in the form of higher")
12 Target On larger timescale, the hourly reversal proved to be part of larger setup that was monitored on a daily basis. Once again, here is the objective target being met. Given the striking similarity to waves 1-2 in structure, shorts covered and longs were once again to be accumulated. Yet another wolfewave pattern count begins. ١٢

13 Follow Thru Fibonacci retraces were once again used to ensure a valid scalp entry point presented itself. Price action centered around XAU 60 as the churn continued to unfold around the 70.7% retrace of the huge move upward. A very nice bounce ensued, which was once again capped by negative divergence on hourly chart and a 141.2% extension of a bull flag lift. This proved a correct signal, and the saga continues below with the clearer illustration of how the pattern evolved in gold prices themselves (miners, XAU components followed a similar pullback). ١٣

14 GC /Gold Futures Setup Picking up where the story left off above, the actual price of gold was turned away at previous spike highs. Once again, the wolfewave presented itself, although numbering isn't present, the cyan target line shows a definitive retrace back to the levels of 200 day moving average would be in the cards, around 310. ١٤

15 Target The wave 1->4 projection is hit perfectly less than 2 weeks later. A similar basing action happens in the GOX and HUI (unhedged miner index), along with a basing action below 200 dma (200 day moving average) in the XAU index. Reversal Wolfewave target line proves to be a low print, and prices reverse off the lows once again. Who says you can't pick bottoms and tops? To this day I still watch this pattern evolution with amazement. It is also interesting to note ١٥

16 the similarity in the price structure following August-September 2002 sequence. This is the most current update after having experienced a huge one day surge in gold price and breakout above the key $325 Maginot Line. Stay tuned as the evolution continues - there are currently no patterns to watch except the strong similarity to A-B pullback wave here. Top The breakout proves to be the real stuff. Gold makes a solid run, yet is halted in its tracks on 2/5/03. New York Times is full of gold schemes, CNBC is featuring "Ship of Gold" ads, and greed is once again running rampant. "9 gold bulls for every bear." The technical underpinning is a target measurement using a tool called Andrew's pitchfork off the November 2001 lows and June-August 2002 as midpoint consolidation. GOX, HUI, and XAU index are failing to confirm the technical breakout in commodity. ١٦

17 Confirm Since gold moves inverse to the dollar, a technical channel breakout in February forces metal lower ١٧

18 Royal Gold More fun with Wolfewaves. The news is driven by a negative article in Barron's from some short seller calling for a target at 9. Don't get bitten by the wolfe trap - cover and move on. Setup The spike high resolves itself and gold pulls back over the next 3 months. As April approaches, another wolfewave sequence starts building, reinforced by a repeat of the "Gartley 222" pattern at 78% retrace level. The key signature is the overlapping structure and 3 pushes lower with a divergence signal showing on 5/35 MACD indicator. The $325 Maginot Line is now being tested as a support level in the delicate metamorphosis of past resistance into future support. It may be the most important price in this now confirmed bull market in gold. ١٨

19 Setup Linda Raschke also likes the trade. Confirms the great setup one day later. Of key note is now this is the first higher-low attempt following a rather severe downdraught. Swing distance up is greater than the retrace lower. Target Bingo. ١٩

20 Setup A pullback ensues which brings prices back to retest the 200 dma, the thick blue line. The wolfewave is setting up, with a key pivot on August 1, note the use of timing intervals on the MACD oscillator above volume. The interesting thing about this setup was that the labelling proved incorrect and could have actually be considered a completed pattern on the test of 200dma. ٢٠

21 Reversal Setup Once more the patterns are redrawn as a contract rollover needs to be accomodated. In this situation, the correct impulse spacing shows on the MACD oscillator and is corrected. August 1, 2003 proves to be a swift pullback to retest 200dma before marching higher. Given the success with using Andrew's pitchfork to time previous spike high from February, a similar set of projection lines are drawn, overlapping wave structure starts to show and next wolfewave is ready to unfold. Ok.. you get the idea. Indian wedding season has now ended also. You may want to review how gold generally reacts in the late September - October timeframe, where this essay on gold futures began. ٢١
22 Target Another clean, sharp pullback to relieve the negative divergence that was giving warning signals in the 5/35 macd oscillator. You may even notice the smaller three push structure on the daily chart as it hit wave 'b' lows. Following the pullback to target, gold is attempting a breakout similar to a year earlier, flirting with a move above $400. Pattern players would now consider this a cup and handle setup on a weekly basis. Setup The breakout above cup&handle rim proceeds nicely. In typical pattern evolution, prices often retrace to the breakout point before resuming their trend. ٢٢
23 In this case, we are about to retest the rim around 390+change, and the pullback starts to once again resemble an a-b-c sequence (see previous March sequences above.) On the hourly chart, a wolfewave sequence is taking shape - note how you can use the previous spike lows to time the final push in the series, the overlapping structure and oscillator divergence giving notice a reversal is preparing. The divergence is seen on both the intraday and daily charts. Target, Setup A nice rebound ensues from the previous setup into a retest of the January spike highs. Looking at the smaller timescale of hourly chart, you begin to notice the wave overlap. A "3 push higher" sequence is visible on the ٢٣
24 daily chart, combined with bearish divergence on 5/35 macd (equal prices, lowerhigh in oscillator.). This mirrors the previous setup above, but at a spike high juncture. Target A 5% selloff in 2 days yields the hourly target price. Notice how nicely the target corresponds with the head and shoudlers (h&s) pattern visible on the daily chart. Wolfewaves are often most powerful when used in conjuction with other technical setups - e.g. the previous spike lows from early March were present at the same level a Gartley (g222) pattern established itself. ٢٤
25 Elliott Context Another interesting aspect of wolfewaves is that they overlap nicely with elliott wave theory, which breaks wave counts into impulses (trend movement) and corrections. Since wolfewaves are considered reversal patterns, the elliott count should match the iii - iv - v sequence. This is the final count that is encountered before a trend changes. The expected elliott count is drawn on the hourly chart, while we ready ourselves for the equivalent wolfewave pattern on daily. This also corresponds nicely with a test of the 200dma as support, while the US dollar has experienced a similar bounce to test the 200dma as resistance. ٢٥
26 Setup Same bat channel, same bat time. ٢٦
27 Current gold futures, updated as of yesterday's close. Note the ring low in May, 2004 corresponds with the last reversal sequence show in the chart above. ٢٧
28 Setup This is the first cautionary signal and update in more than 3 years - lo and behold, another wolfewave has appeared in the daily charts. Most notable is the overlapping price structure, combined with "3 crows" candlestick patterns at three different junctures. This all combines to a stong signal = TAKE PROFITS HERE. This rising wedge will not be pretty if there is a breakdown - the lower trendline of this rising channel cannot be tested many more times. Ahh-wooo.. Who needs bulls or bears when you can run with the wolfes? ٢٨
29 7:00pm update - Wow. The Fed announcement that they would be buying up to $300 billion in long-term goverment bonds sends the dolllar into a hard tail spin, ending much lower than the projected wolfewave target. At this juncture, it has pulled back exactly 59% of the previous swing high on the daily chart. Interestingly enough, this is the same percentage at which the swing low was recorded on the weekly chart in mid-december retracement. A follow-up to the March 12 setup - markets have now retraced to the January spike lows around 800. The Advanced GET software is suggesting that a 5-wave advance has completed on the hourly charts. The Japanese yen has shown a lot of strength, however, at this juncture a pocket trade is asserting itself. At a smaller scale, a head & shoulders pattern is also visible, which should take it back to a retest of the 1.06 level. This is a short candidate in any cross trade for the next week or so. ٢٩
30 I also realized that the currencies futures are better served by using the continuous contract symbols, since they will illustrate overnight and intraday prices ranges more clearly. Below is an example of the yen continuous contract (J6H9 compared to above JYH9) and the improved detail. ٣٠
31
32
Simple & Consistent Fibonacci Method Prepared by: Simone Guy. {Free learning resource: NOT FOR RESALE}
 Simple & Consistent Fibonacci Method Prepared by: Simone Guy {Free learning resource: NOT FOR RESALE} 3/13/2010 Overview This is a mechanical trading method that is based on Support and Resistance. The
Using ADX to Trade Breakouts, Pullbacks, and Reversal Patterns. By Puneet Jain CFTe
 Using ADX to Trade Breakouts, Pullbacks, and Reversal Patterns By Puneet Jain CFTe (with DMI) ADX (Average Directional Index) is an indicator that measures trend strength shows trend direction. ADX tells
Chart Patterns Trader. Trader SUPPLEMENT. Understanding and Trading Classic Chart Patterns. By: Kevin Matras Zacks Investment Research, Inc
 Chart Patterns Trader Trader SUPPLEMENT Understanding and Trading Classic Chart Patterns By: Kevin Matras Zacks Investment Research, Inc Table of Contents Introduction.........................................................................
How to put momentum strategies in context to achieve high percentage winning trades. Suzanne Bodlovic [email protected]
 How to put momentum strategies in context to achieve high percentage winning trades Suzanne Bodlovic [email protected] Tonight I will show you how this workspace will change the way you approach the markets
BULLS ON WALL ST. 60 DAY TRADING BOOTCAMP
 BULLS ON WALL ST. 60 DAY TRADING BOOTCAMP Lead Instructor Kunal Desai Assistant Instructors Maribeth Willoughby Dr. Andrew Menaker Course Description This 60 day course teaches a setup based system to
CHART TRADING GUIDE 1
 CHART TRADING GUIDE 1 How to understand chart trading This guide is designed to teach you the basics of chart trading- the chart patterns that are covered in this booklet can be used for short and medium
TOMORROW'S TRADING TECHNOLOGY. 100% automated Fibonacci support and resistance levels that you can count on every single trading day in an instant.
 TOMORROW'S TRADING TECHNOLOGY 100% automated Fibonacci support and resistance levels that you can count on every single trading day in an instant. ProTrader Table of Contents 1. Areas A. Fibonacci Confluence
Sunil Mangwani www.fibforex123.com
 The 123 chart pattern. The 123 pattern is a reversal chart pattern which occurs very frequently and has a very high success ratio. 123 s occur at the end of trends and swings, and they are an indication
How I Trade Profitably Every Single Month without Fail
 How I Trade Profitably Every Single Month without Fail First of all, let me take some time to introduce myself to you. I am Kelvin and I am a full time currency trader. I have a passion for trading and
Day Trade System EZ Trade FOREX
 Day Trade System The EZ Trade FOREX Day Trading System is mainly used with four different currency pairs; the EUR/USD, USD/CHF, GBP/USD and AUD/USD, but some trades are also taken on the USD/JPY. It uses
Trading Lessons from the Intraday Frame (study)
") 1 Daily "Idealized Trades" Report Trading Lessons from the Intraday Frame (study) 1 2 SPY's 1-min Power Trend Chart (Additional Trades) 2 3 Lessons to Learn from Today's Trading Day Let's start as usual
1 Daily "Idealized Trades" Report Trading Lessons from the Intraday Frame (study) 1 2 SPY's 1-min Power Trend Chart (Additional Trades) 2 3 Lessons to Learn from Today's Trading Day Let's start as usual
How to see the market context using CCI Written by Buzz
 How to see the market context using CCI Written by Buzz Towards the end of September 2003, I decided to stop trading the S&P e-mini for a while and focus on the Russell 2000 e-mini. The swings seemed to
How to Make an Income from Gold
 ASIA PACIFIC S PREEMINENT TRADING MAGAZINE TM www.tradersjournal.com VOLUME 4 ISSUE 1 How to Make an Income from Gold SG$9.80 / A$9.95 / HK$68 / RM$19.80 TRADING TOOLS: Candle Charting Basics Trading Sea
TRADING GAPS TAIL STRATEGY SPECIAL REPORT #37
 TRADING GAPS TAIL STRATEGY SPECIAL REPORT #37 Welcome to Market Geeks special report. Today I m going to teach you a little bit about gaps, how to identify different gaps and most importantly how to put
THE CYCLE TRADING PATTERN MANUAL
 TIMING IS EVERYTHING And the use of time cycles can greatly improve the accuracy and success of your trading and/or system. THE CYCLE TRADING PATTERN MANUAL By Walter Bressert There is no magic oscillator
The Ultimate Fibonacci Guide By Fawad Razaqzada, technical analyst at FOREX.com
 The Ultimate Fibonacci Guide By Fawad Razaqzada, technical analyst at FOREX.com Who is Fibonacci? Leonardo Bonacci also known as Leonardo Fibonacci was an Italian mathematician in the 12 th century. He
LIVE@ W O R K B O O K
 LIVE @ W O R K B O O K SHORT SKIRT TRADING The Most Bang for the Buck in the Least Amount of Time. By Linda Raschke COVERING: INDICES, DAY TRADING AND MONEY MANAGEMENT Linda will teach the "Short Skirt"
Leon Wilson Trading Success
 Leon Wilson Trading Success A talk given by Mary de la Lande to the BullCharts User Group Meeting on 13 February 2008 1. Who is Leon Wilson? His Books and where to get them. 2. Book 1: The Business of
Trend Determination - a Quick, Accurate, & Effective Methodology
 Trend Determination - a Quick, Accurate, & Effective Methodology By; John Hayden Over the years, friends who are traders have often asked me how I can quickly determine a trend when looking at a chart.
NEXGEN DEMO TRADING & EDUCATIONAL PLAN SIMPLIFIED
 NEXGEN DEMO TRADING & EDUCATIONAL PLAN SIMPLIFIED Please watch the intro Video so you understand Nexgen's expectations for your demo time and what you should expect from us during your demo. CLICK TO WATCH
Intraday Report for Wednesday, July 08, 2015 S&P 500 ETF: SPY. Corey Rosenbloom, CMT Afraid to Trade
 1 Daily "Idealized Trades" Report S&P 500 ETF: SPY 1 2 SPY 1-min 2 3 Real-World Lessons from Today s Trading Day Hey traders! First, please pardon the look and urgency of getting this report out I m away
New York Traders Expo 2012
 New York Traders Expo 2012 with JAMES CHEN, CTA, CMT Director of Technical Research and Education All rights reserved, FXDD Inc. 2010 Today s Topic: High Probability Strategies for Trading Forex www.fxdd.com
Systematic Trading What Does It Mean and What Style Is Right For You?
 ASIA PACIFIC S PREEMINENT TRADING MAGAZINE TM www.tradersjournal.com VOLUME 3 ISSUE 12 Systematic Trading What Does It Mean and What Style Is Right For You? SG$9.80 / A$9.95 / HK$68 / RM$19.80 Gold ETF
FOREX analysing made easy
 FOREX analysing made easy UNDERSTANDING TECHNICAL ANALYSIS An educational tool by Blackwell Global Contents Technical Analysis 2 Line Chart 3 Bar Chart 4 Candlestick Chart 5 Support and Resistance 6 Fibonacci
FOREIGN EXCHANGE CYCLES:
 January 1999 FOREIGN EXCHANGE CYCLES: Get Ready to Sell the Upcoming Cycle Top in the Dollar versus the Deutschemark Trade Sell the Dollar-Mark on a break below last week's low of 1.6625 and look for 5
Chart Patterns Tutorial - Forex Trading, Currency Forecast, FX Trading Signal, Forex Training Course, E...
 Page 1 Chart Patterns Tutorial Technical Analysis Articles Written by TradingEducation.com Chart Patterns Tutorial Traders have debated the merits of "technical analysis" versus "fundamental analysis"
CHART PATTERNS. www.tff-onlinetrading.com
 CHART PATTERNS Technical analysis, as you have seen in our Trading Academy videos so far, is not just about charts. It does, however, rely heavily on them and often uses chart patterns to assist in making
Secrets for profiting in bull and bear markets Sam Weinstein
 Secrets for profiting in bull and bear markets Sam Weinstein 1. Check market indicators for overall direction 2. Scan the industry groups to know which one to zero in 3. Cull out the stocks with the most
Chapter 2.3. Technical Analysis: Technical Indicators
 Chapter 2.3 Technical Analysis: Technical Indicators 0 TECHNICAL ANALYSIS: TECHNICAL INDICATORS Charts always have a story to tell. However, from time to time those charts may be speaking a language you
Every trader has had the experience of selling a stock or commodity too soon during a rapid price
 Article Text Copyright (c) Technical Analysis Inc. 1 Stocks & Commodities V. 9:10 (403-408): Trading The Regression Channel by Gilbert Raff Trading The Regression Channel by Gilbert Raff Every trader has
The Magic Momentum Method of Trading the Forex Market
 The Magic Momentum Method of Trading the Forex Market WELCOME! Welcome to one of the easiest methods of trading the Forex market which you can use to trade most currencies, most time frames and which can
Trendline Tips And Tricks
 Tantalizing! Trendline Tips And Tricks How do you capture those medium- to longer-term moves when trying to enter and exit trades quickly? D by Sylvain Vervoort aydreaming about trading? Get in a trade
Day Trading the Dow Jones, DJI
 Day Trading the Dow Jones, DJI Enter a trade on a confirmation of a break of the 100EMA, which is when the price pulls back towards the 100MA and then continues in the direction of the breakout. Stay in
CONTROLLING. Your TRADES, MONEY& EMOTIONS. By Chris Vermeulen
 CONTROLLING Your TRADES, MONEY& EMOTIONS By Chris Vermeulen INTRODUCTION In this condensed guide I have put together some key points which I think should be read a few times in order for these critical
Trading Binary Options Strategies and Tactics
 Trading Binary Options Strategies and Tactics Binary options trading is not a gamble or a guessing game. By using both fundamental and technical market analysis, you are able to get a better understanding
Alerts & Filters in Power E*TRADE Pro Strategy Scanner
 Alerts & Filters in Power E*TRADE Pro Strategy Scanner Power E*TRADE Pro Strategy Scanner provides real-time technical screening and backtesting based on predefined and custom strategies. With custom strategies,
Technical Analysis SAmple InveSTIng plans 1
 Technical Analysis Sample Investing Plans 1 Important Information All investing plans and rules are provided for informational purposes only, and should not be considered a recommendation of any security,
CHAPTER 4. The AB=CD Pattern
 CHAPTER 4 The AB=CD Pattern It has been said many times in trading to study, learn, and trade methods that are simple in nature. The AB=CD pattern is one of the most basic and simple patterns in technical
Table of Contents. Preface. Chapter 1: TRADING BASICS. Chapter 2: BASIC TOOLS. Chapter 3: ADX. Chapter 4: ACCUMULATION LINE
 Table of Contents Preface Chapter 1: TRADING BASICS Chapter 2: BASIC TOOLS Chapter 3: ADX Chapter 4: ACCUMULATION LINE Chapter 5: AVERAGE TRUE RANGE Chapter 6: CANDLESTICKS Chapter 7: MACD Chapter 8: MOVING
Trading The Euro: Box It, Squeeze It, Love It, Leave It
 Trading The Euro: Box It, Squeeze It, Love It, Leave It by: John Carter Think inside the box when trading currency pairs, and identify boxes on currency charts to create better trading setups. [Editor
The 15 50 Trading System
 Main Premise: This is considered to be one of the most straight forward systems for a live trading style for day- and/or intraday trading. The 50 SMA is one of the most commonly used moving average numbers
Stock Breakout Profits Strategy
 Stock Breakout Profits Strategy Introduction Welcome and thank you for downloading the Stock Breakout Profits system. The Stock Breakout Profits is a complete trading strategy for trading not only the
Technical Analysis. Chart Formations. Brought to you by: FX-ebooks.com. Forex ebooks Library
 Technical Analysis Chart Formations Brought to you by: FX-ebooks.com Forex ebooks Library 1 Forex Mentor by Peter Bain The new Leading Professional Currency Trading System shows you how to trade currencies
Understanding Classic Chart Patterns Recognia Inc.
 Understanding Classic Chart Patterns Recognia Inc. www.recognia.com 2009 Copyright Recognia Inc. Table of Contents Introduction...3 Head and Shoulders Top...5 Head and Shoulders Bottom... 10 Symmetrical
DAY TRADING WITH THE INSTITUTIONS by Jay Wireman
 DAY TRADING WITH THE INSTITUTIONS by Jay Wireman Welcome everyone to my top day trading setups. Below you will find my powerful techniques using my proprietary symmetry software package that I have developed
8 Day Intensive Course Lesson 3
 8 Day Intensive Course Lesson 3 A) What are Fibonacci Retracements? Fibonacci Retracements What are Fibonacci retracements? Levels at which the market is expected to retrace to after a strong trend. Based
Retracement Or Reversal. Kennsei Trading, Inc. Chief Trader Dinger [email protected] www.hotstocksforincome.com
 Retracement Or Reversal Kennsei Trading, Inc. Chief Trader Dinger [email protected] www.hotstocksforincome.com Retracement Or Reversal Most of us have wondered, at some point, whether a decline
This tutorial was originally titled "Secrets to Successful Short-Term Trading" and was recorded at the Online Trading Expo
 This tutorial was originally titled "Secrets to Successful Short-Term Trading" and was recorded at the Online Trading Expo Day Trading Wizard Using High Probability Support and Resistance Levels with Tony
Guidelines to use with Fibonacciqueen trade setups!!!
 Guidelines to use with Fibonacciqueen trade setups!!! Updated January 2014 As far as the price analysis that I run every day in the markets, there are three different types of Fibonacci price relationships
ADX breakout scanning ADX breakouts can signal momentum setups as well as exit conditions for intraday and swing traders. FIGURE 1: AFTER ADX > 40
 TRADING STRATEGIES ADX breakout scanning ADX breakouts can signal momentum setups as well as exit conditions for intraday and swing traders. BY KEN CALHOUN FIGURE 1: AFTER ADX > 40 Spotting volatility
DAY TRADING WITH THE INSTITUTIONS by Jay Wireman
 DAY TRADING WITH THE INSTITUTIONS by Jay Wireman Welcome everyone to my top day trading setups. Below you will find my powerful techniques using my proprietary symmetry software package that I have developed
Chapter 2.3. Technical Indicators
 1 Chapter 2.3 Technical Indicators 0 TECHNICAL ANALYSIS: TECHNICAL INDICATORS Charts always have a story to tell. However, sometimes those charts may be speaking a language you do not understand and you
3 New Books: Trading Price Action TRENDS Trading Price Action TRADING RANGES Trading Price Action REVERSALS. Available on Amazon and Wiley
 3 New Books: Trading Price Action TRENDS Trading Price Action TRADING RANGES Trading Price Action REVERSALS Available on Amazon and Wiley Traders run it, I provide content Free articles Free detailed analysis
Forex Volatility Patterns
 Spotting Early Breakouts Forex Volatility Patterns BRUCE WALDMAN Want to catch 40 to 00 pips in each trade? Here s how you can find those entry and exit signals to make your forex trading a success. C
A Primer On Technical Analysis. Written by. Available at
 A Primer On Technical Analysis Written by Available at Page 1 of 23 Overview Technical Analysis (Versus Fundamental Analysis) Technical analysis is a method of forecasting price movements by looking at
Advanced Trading Systems Collection MACD DIVERGENCE TRADING SYSTEM
 MACD DIVERGENCE TRADING SYSTEM 1 This system will cover the MACD divergence. With this trading system you can trade any currency pair (I suggest EUR/USD and GBD/USD when you start), and you will always
Definitions to Basic Technical Analysis Terms. www.recognia.com
 Definitions to Basic Technical Analysis Terms www.recognia.com A Alert An alert is a notification sent when a significant event occurs in one or more investments of importance to a trader. Recognia sends
The information contained herein is derived from sources we believe to be reliable, but of which we have not independently verified. Forexyard.
 STRATEGIES FOR FOREX MARKET PREDICTIONS IN 2011 By: Russel Glaser, Chief Market Analyst: FOREXYARD Date: February 2011 In this Issue: 1. Incorporating Long Term Charts for Market Predictions 2. What is
MAGIC BREAKOUT Forex Trading Strategy
 Tim Trush & Julie Lavrin Introducing MAGIC BREAKOUT Forex Trading Strategy Your guide to financial freedom. Tim Trush, Julie Lavrin, T&J Profit Club, 2007 2015, All rights reserved www.magicbreakout.com
Binary Options Trading Strategy. Professional Binary Trading Manual Strategy
 Binary Options Trading Strategy Professional Binary Trading Manual Strategy U.S. Government Required Disclaimer - Commodity Futures Trading Commission Futures and Options trading has large potential rewards,
NIRVANA. OmniTrader 2015. Every Investor s & Trader s Dream! New in OmniTrader: The State Of
 The State Of NIRVANA Fall 2014 OmniTrader 2015 Every Investor s & Trader s Dream! New in OmniTrader: Intraday Analysis Predicts Explosive Moves in EOD Charts Profiles Now Support Intra-EOD Analysis Great
Methods to Trade Forex Successfully for Quick Profits
 Methods to Trade Forex Successfully for Quick Profits This article is devoted to the techniques that are used to trade Forex on an intraday basis for quick profits. The aim is to make the trading a successful
Understanding the market
 Understanding the market Technical Analysis Approach: part I Xiaoguang Wang President, Purdue Quantitative Finance Club PhD Candidate, Department of Statistics Purdue University [email protected] Outline
Trading Power Trends with ADX
 Trading Power Trends with ADX By Dr. Charles B. Schaap, Jr. International Trader s Expo New York City 18 February 2014 Disclaimer The information in this lecture is for educational purposes. No particular
Pattern Recognition Software Guide
 Pattern Recognition Software Guide 2010 Important Information This material is for general information only and is not intended to provide trading or investment advice. All analysis and resulting conclusions
THE SIMPLE PIPS GENERATING MACHINE
 THE SIMPLE PIPS GENERATING MACHINE THIRD EDITION The Brain By EKONYE G. KINGX d_analyst www.loooopfx.blogspot.com F o l l o w t h e r u l e s a n d b e s u c c e s s f u l Page 1 SPGM-3 THE BRAIN My initial
Ed Heath s Guerilla Swing Trading Plan (as of 1/22/13)
") Ed Heath s Guerilla Swing Trading Plan (as of 1/22/13) Synopsis: I call my trading style Guerilla Swing Trading. I trade upward momentum stocks that have pulled back for a buying opportunity and my goal
Ed Heath s Guerilla Swing Trading Plan (as of 1/22/13) Synopsis: I call my trading style Guerilla Swing Trading. I trade upward momentum stocks that have pulled back for a buying opportunity and my goal
The Shark Attack System
 The Shark Attack System by Ashwani Gujral Reviewed and recommended by Rita Lasker & Green Forex Group Disclaimer Please be aware of the loss, risk, personal or otherwise consequences of the use and application
Copyright 2010 by Kelvin Lee
 All rights reserved. No part of this publication may be reproduced, stored in a retrieval system, or transmitted, in any form or by any means, electronic, mechanical, photocopying, recording or otherwise,
IS SWING TRADING THE PERFECT TIMEFRAME?
 IS SWING TRADING THE PERFECT TIMEFRAME? Brian Shannon www.alphatrends.net Do you categorize yourself as a long term investor, a day trader or maybe something in between? If you are like many people, you
RSI PRO Forex Trading System
 RSI PRO Forex Trading System Trading Examples Vol. 1 Paul Dean 2010 [Type text] Page 1 WWW. Y O U L E A R N F O R E X. C O M RSI PRO FOREX TRADING SYSTEM Trading Examples The purpose this book is simply
Trading the Gartley 222
 Trading the Gartley 222 By Aaron Behle and Mark Conway 2003, Reprinted with permission of Active Trader magazine (www.activetradermag.com) Sometimes old trading ideas are the best ideas if you can quantify
How To Draw A Chart
 Trading View Tutorial Chart Functions Add The add function allows users to overlay additional symbols or data series over top of the existing chart. This is different than the compare function in that
Entering Late In Trends
 Highlights from Videos 40A & 40B of the Brooks Trading Course Entering Late In Trends BrooksTradingCourse.com Al Brooks Tuesday 3 rd November, 2015 BrooksTradingCourse.com BrooksPriceAction.com Main Points
WELCOME TO Trading Boot Camp Day 2
 Icoachtrader Consulting Service www.icoachtrader.weebly.com WELCOME TO Trading Boot Camp Day 2 David Ha Ngo Trading Coach Phone: 1.650.899.1088 Email: [email protected] The information presented is
The 5 Exit Heroes. Exiting Your Forex Trades For Maximum Profits
 The 5 Exit Heroes Exiting Your Forex Trades For Maximum Profits IMPORTANT : As an added bonus for downloading this report, you also received additional free training videos. To access your bonuses, go
TECHNICAL ANALYSIS GLOSSARY
 TECHNICAL ANALYSIS GLOSSARY A ABC: Elliott Wave terminology for a three-wave countertrend price movement. Wave A is the first price wave against the trend of the market. Wave B is a corrective wave to
Class 2: Buying Stock & Intro to Charting. Buying Stock
 Class 2: Buying Stock & Intro to Charting Today s Class Buying Stock Intro to Charting Real World Analysis Buying Stock What Is a Stock? Share of ownership in a company Publicly traded Holds monetary value
A Day Trader Search for Profits Written By: John L. Person, CTA www.nationalfutures.com
 Buy low sell high, buy high and sell higher or sell low and buy lower. Whatever your method is, the results need to be profitable or a trader s career will be cut short. Most investors, whether that is
How To Know When A Market Is In A Strong Trending Phase
 The 3 Rules of Successful Swing Trading Trade with the Wind at Your Back The Rule That Hits Home Runs & Be In the Right Place at the Right Time by Michele Mish Schneider, Director of Trading Research &
Mark Minervini. Interview with Tim Bourquin
 Mark Minervini Interview with Tim Bourquin Mark Minervini is one of America s most successful stock traders; a veteran on Wall Street with nearly 30 years of experience. He won the 1997 U.S. Investing
2:... 12 14 NYSE 2 15 NYSE
 1 Contents Introduction:... 4 Philosophy:... 5 Trading strategies an overview:... 6 Introduction to direct access trading:... 8 The US stock markets:... 9 Bids and offers:... 10 NASDAQ and level 2:...
Understanding the market with PVSRA
 Understanding the market with PVSRA PVSRA PVSRA stands for Price, Volume, Support, Resistance Analysis. Price includes consideration of individual candlestick configurations as well as the pattern, or
Active Trend Trading System
 Active Trend Trading System Candle Light Trader: Dennis W. Wilborn A Trend Should Be Assumed to Continue in Effect Until Such Time as Its Reversal Has Been Definitely Signaled Edwards & Magee Disclaimer
I Day. article. In. you but. I just. Entry. Trend. I risk. 2.5% per. equity. a "runner" trading
 Emini Day Trading How I Day Trade for a Living I wish I had a simple answer for you but I don't. Trading is hard, very hard probably the hardest thing you' 'll ever try to do in your life and that's why
Action Forex Company Limited 2012
 1 TABLE OF CONTENTS TABLE OF CONTENTS... 2 INTRODUCTION... 3 CHAPTER 1 - USE OF CANDLESTICK CHARTS... 4 1.1 MORE BULLISH PATTERNS... 5 Piercing Line... 5 Three White Soldiers... 6 Rising Three Methods...
Retracements With TMV
 A Series Of Indicators Used As One Trade Breakouts And Retracements With TMV Making good trading decisions involves finding indicators that cut through the market noise. But how do you do it without collapsing
Trading the Daniel Code Numbers
 Trading the Daniel Code Numbers INTRODUCTION... 2 ABOUT THE DC NUMBERS... 2 BEFORE YOU START... 2 GETTING STARTED... 2 Set-Up Bars... 3 DC Number Sequences... 4 Reversal Signals... 4 DC TRADING METHODOLOGY...
W.D. Gann's Techniques of Analysis and Trading
 A Summary of W.D. Gann's Techniques of Analysis and Trading Psychological Framework Master yourself Do not overtrade See if your trade is based on hope or logic and systems developed by you Trading strategies
Reading Price Charts Bar by Bar
 Reading Price Charts Bar by Bar The Technical Analysis of Price Action forthe Serious Trader AL BROOKS WILEY John Wiley & Sons, Inc. Contents Preface xlii CHAPTER 1 Price Action 1 Trend Bars and Doji Bars
THE LAW OF CHARTS WITH INFORMATION NOT SHOWN IN OUR PREVIOUS COURSE MANUALS
 THE LAW OF CHARTS WITH INFORMATION NOT SHOWN IN OUR PREVIOUS COURSE MANUALS 1-2-3 HIGHS AND LOWS A typical 1-2-3 high is formed at the end of an uptrending market. Typically, prices will make a final high
Daytrading Cup Breakouts
 A Strategic Approach Daytrading Cup Breakouts inga poslitur Here s how you can daytrade momentum trades. ntering and exiting intraday trades using E precision technical trading signals has been popular
Technical Analysis of the Futures Markets:
 Technical Analysis of the Futures Markets: A Comprehensive Quide to Trading Methods and Applications John J. Murphy New York Institute of Finance A Prentice-Hall Company Introduction, xiii Acknowledgments,
How To Use Multiple Time Frames For Setups. by Chris Vermeulen
 by Chris Vermeulen A couple months ago I started providing more of my intraday charts in hopes to educate traders on current market conditions so they feel like they are "in the zone" for trading. It's
Educational ETF's, Futures and CFD's Low Risk Trading Setups Explained. by Chris Vermeulen
 Educational ETF's, Futures and CFD's Low Risk Trading Setups Explained by Chris Vermeulen I thought I would put this more detailed report on finding and trading low risk setups for gold, silver, oil indexes
FXQUICK TOOLS. FQ Master Fractals. degrees of time the right way. chart without it. For inquiries, you can reach us at: info@fxquickroute.
 FQ Master Fractals Simple but powerful tool that helps you analyze the market in different degrees of time the right way. As soon as you discover the potential of this tool, you will never open a chart
Everything is a series of facts surrounded by other circumstances.
 Following are several trade ideas based upon the concepts we employ to observe the twoway auction process. This serves as a list of various market situations and criteria to help Intensive traders distill
Welcome to the Forex-e-Learn PDF Course
 Welcome to the Forex-e-Learn PDF Course Contents: Page 1: Contents Page 2: Price ars Page 3: The Daily Chart Page 4: The Daily Chart (Support and Resistance) Page 5: The Daily Chart (Support and Resistance