An analysis of collisions & casualties: 18 months pre and post launch Dorset County Council
|
|
|
- Dorothy Chapman
- 10 years ago
- Views:
Transcription
1 An analysis of collisions & casualties: 18 months pre and post launch Dorset County Council Completed by Michael Potter October

2 Figures detailed in this report have been derived from the STATS 19 forms completed by Dorset Police. STATS 19 forms collect detailed data on individual road collisions, covering the circumstances of the accident and the casualties and vehicles involved. It is acknowledged that there are limitations with Stats 19 data; however, it is considered the best dataset available at this very early stage in the continuing evaluation of the no excuse campaign. SUMMARY The no excuse campaign launched in January 2010 Latest 3 years Stats 19 data has been used for the purpose of this report July 2008 to December 2009 is the 18 months pre no excuse January 2010 to June 2011 is the 18 months post no excuse This report will look at both the DCC area as a whole and each of the 9 sectors that fall within DCC. Casualty data for The Borough of Poole and Bournemouth Borough Council are not included in this report. The no excuse campaign has coincided with the lowest casualty figures on record for the Dorset County Council (DCC) area. Due to the nature of road traffic collisions and casualties, there is an appreciation that no single factor in isolation is likely to influence driver behaviour and attitude and result in a reduction in road traffic casualties. The economic climate is a factor and it is important to note that the lowest casualty figures on record for the DCC area also coincided with the current economic downturn. The following chart, put together by the Department for Transport, shows the level of GDP against the number of road traffic fatalities. Year on year change in road deaths, traffic and GDP: GB : 10% 16% Year on year change in traffic/gdp 8% 5% 3% 0% -3% -5% -8% Road deaths GDP Vehicle traffic % 8% 4% 0% -4% -8% Year on year change in road deaths -12% -10% -16% 2


3 Nationally, fatal road traffic casualties fell by 17% in 2010 against 2009(Reported Road Casualties Great Britain Main Results: 2010). Fatal casualties in DCC fell by 57% in 2010 against 2009; from 23 to 10. Nationally, the number of people killed or seriously injured (KSI) fell by 9% in 2010 against 2009 (Reported Road Casualties Great Britain Main Results: 2010). KSI casualties fell by 17% in 2010 against 2009 for DCC; from 260 to 215. Nationally the total number of casualties (all severities) fell by 6% in 2010 against 2009 (Reported Road Casualties Great Britain: 2010). The total number of casualties fell by 11% in 2010 against 2009 for DCC; from 1596 to Below is a chart showing the latest rolling annual KSI casualty figure for DCC: The above chart shows a notable downward trend in the number of KSI casualties since the launch of no excuse. Please note all data for 2011 remains subject to change until final sign off in April

4 Enforcement Sectors For the purposes of no excuse, Dorset has been split into 11 enforcement Sectors. The sectors represent the areas covered by each enforcement team: 4

5 COLLISIONS AND CASUALTIES PRE & POST NO EXCUSE Collisions: Overall, collisions resulting in personal injury fell by 17%, from 1814 in the 18 months pre no excuse, to 1505 in the 18 months post no excuse. KSI collisions fell by 23%, from 369 to 283. The table below shows the number of collisions by severity for the DCC area pre and post no excuse by sector: Casualties: Overall, road traffic casualties fell by 19%, from 2581 in the 18 months pre no excuse, to 2080 in the 18 months post no excuse. KSI casualties fell by 25%, from 425 to 317. The number of people killed on DCC roads have fallen from 38 for the 18 months pre no excuse to 19 in the 18 months post no excuse, a 50% reduction. The table below shows the number of casualties by severity for the DCC area pre and post no excuse by sector: 5

6 There have been reductions in the total number of casualties across each sector. Perhaps the most notable reductions occurred in Sectors 6 and 7; 38% (from 214 to 132) and 33% (245 to 165). Sectors 6 and 7 also experienced the largest reductions in KSI casualties; 45% (43 to 22) and 49% (35 to 21). Reductions in the number of KSI casualties were experienced across all but 2 of the 9 sectors in DCC; Sector 5 and Christchurch had the same number of KSI casualties during the 18 months post no excuse as the 18 months pre no excuse. Sector 5 and Christchurch are predominantly urban in nature with a great proportion of traffic flow occurring on their urban road network. Generally speaking the greatest reductions in both KSI and Slight casualties have been experienced in rural areas. No excuse was based on a similar project undertaken by Essex County Council where notable reductions in KSI and Slight casualties occurred predominantly in rural areas. It is important to note that Sector 2, a predominantly urban area experienced a 40% reduction in the number of KSI casualties, from 58 to 35. This would seem to go against the claims that only notable reductions occurred in rural areas. However, Sector 2 includes the Weymouth & Portland Borough Council area where a number of extensive road improvement works took place during the 18 months post the launch of no excuse in Weymouth Town which resulted in disruption to traffic. Investigations are ongoing in an attempt to understand whether the improvement works had a significant impact upon casualty reduction. Casualty Road User Group Breakdown: The table below shows the breakdown of casualties by road user group and severity for the DCC area pre and post no excuse : Pedal cyclists were the only road user group to experience an increase in casualties. The most notable increase in pedal cycle casualties is in KSI casualties. Each Sector experienced increases in pedal cycle KSI casualties in the 18 months post no excuse. This could be a reflection of the economic climate; with more people choosing to cycle. Pedal cyclists are considered to be one of the more vulnerable road user groups. If there is an increase in people using a more vulnerable form of travel then a rise in casualties could perhaps be expected. Pedal cycle casualties have also increased nationally. 6

7 Pedal cyclist KSI casualties accounted for 5% of all KSI casualties pre no excuse ; post no excuse they accounted for 14%. For the almost exclusively urban areas of Sector 2 and Christchurch, pedal cyclist KSI casualties accounted for 7% and 5% respectively of the Sector s KSI total pre no excuse, post no excuse they accounted for 20% and 24% respectively of the Sector s KSI total. This is perhaps to be expected as cycling is generally higher in urban areas, but nevertheless if efforts are to made to reduce/prevent pedal cycle casualties, this data may suggest that resources would be best utilised within Sector 2 and Christchurch. However, it is important to note that it cannot yet be determined whether the recent upward trend in pedal cyclist casualties is set to continue long term. Powered two wheeler (PTW) user KSI casualties accounted for 22% of all KSI casualties post no excuse. For Sector 4 PTW user KSI casualties accounted for 34% of the Sector s KSI total, this would perhaps suggest that PTW user KSI casualties should be a higher priority within Sector 4 as a target group for no excuse operations. See Appendix A for Casualty Road User Group Breakdown tables for each Sector. Vehicle Type Involvement in Collisions: The table below shows the breakdown of the types of vehicles that were in involved in personal injury collisions by severity within the DCC area pre and post no excuse. Please note, not all occupants of a vehicle involved in a collision necessarily sustained a personal injury: PTWs accounted for 18% of all vehicles involved in a KSI collision pre no excuse, post no excuse that accounted for 13%, an encouraging reduction. However, PTWs in Sector 4 which accounted for 20% of all vehicles involved in a KSI collision post no excuse. This information could be used as further evidence for PTWs to be high priority target group within Sector 4 for no excuse operations. See Appendix B for Vehicle Type Involvement in Collisions for each Sector. 7

8 Contributory Factors The table below is a breakdown of contributory factors for DCC by group showing the proportion each group accounted for both pre and post no excuse : The proportion of collisions occurring with human error recorded as a contributory factor accounted for the majority all reported contributory factors, both pre and post no excuse. This is also the case for each enforcement sector across Dorset. Driver/Rider human error contributory factors are included within the following groups: Injudicious action Driver/Rider error or reaction Impairment or distraction Behaviour or inexperience The majority of all reported contributory factors can be attributed to driver/rider human error for both Slight and KSI collisions. The proportion of reported contributory factors attributed to driver/rider human error for Slight collisions pre and post no excuse was 72% and 75% respectively. The proportion of reported contributory factors attributed to driver/rider human error for KSI collisions was 75% both pre and post no excuse. In each collision where a Road Environment contributory factor was recorded a contributory factor attributable to human error was also recorded. Although human error is not the only reported contributory factor in collisions, it is widely acknowledged that human error is a contributory factor in at least 95% of all road traffic collisions. See Appendix C for a breakdown of contributory factors for each Sector by group. 8

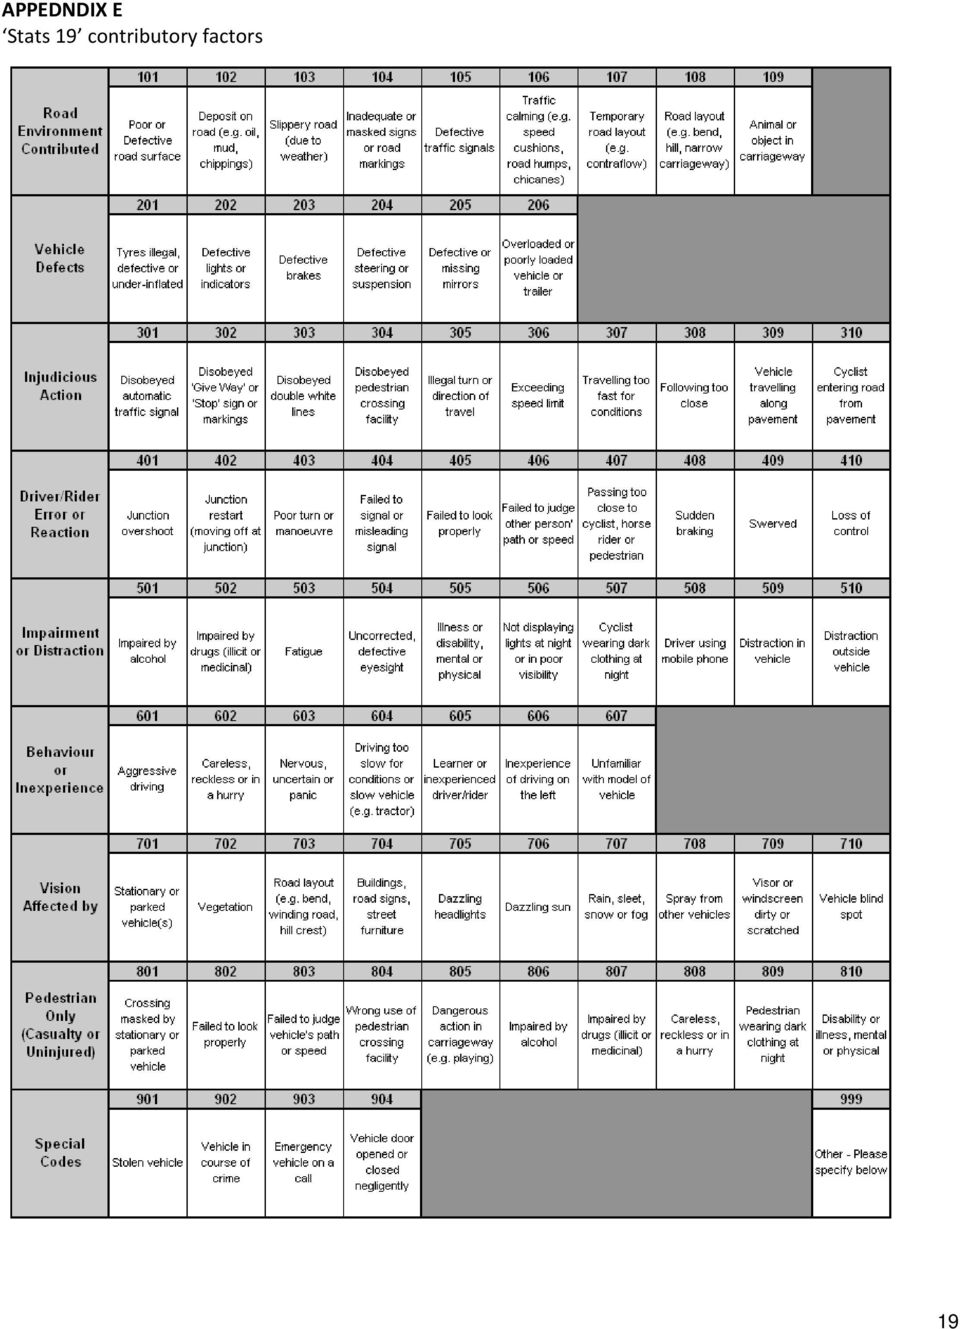
9 Top 5 contributory factors The table below shows the 5 most commonly reported individual contributory factors recorded for collisions within DCC both pre and post no excuse : With the exception of Slippery road (due to weather), the 5 most commonly reported contributory factors to collisions within the DCC area are attributable to human error for both Slight and KSI collisions. There wouldn t appear to be a significant difference between the Top 5 pre and post no excuse which would suggest that there remains a need to focus on road user behaviour. Top 5 contributory factor tables are available for each Sector. Human error accounts for the majority of the most commonly reported contributory factors within each Sector. See Appendix D for the Top 5 contributory factors for each Sector. See Appendix E for the list of all available Stats 19 contributory factors. 9

10 APPENDIX A Casualties Road User Group Breakdown by Sector 10

11 11

12 APPENDIX B Vehicle Type Involvement in Collisions by Sector 12

13 13

14 APPENDIX C Breakdown of contributory for each Sector by group 14

15 15

16 APPENDIX D Top 5 contributory factors by Sector 16

17 17

18 18

19 APPEDNDIX E Stats 19 contributory factors 19
20 End of Document 20

Reported road accidents involving young car drivers: Great Britain 2011
 Reported road accidents involving young car drivers: Great Britain 211 Road Accident Statistics Factsheet No. 1 August 212 Introduction This factsheet presents summary information relating to the casualties
Reported Road Casualties Great Britain: 2013 Annual Report
 Reported Road Casualties Great Britain: 2013 Annual Report Focus on pedal cyclists Key findings The key findings from this article include: Pedal cyclist deaths have seen a long-term fall, but have fluctuated
MOTORBIKE RIDERS AND CYCLISTS
 HSRC MOTORBIKE RIDERS AND CYCLISTS 113 8 MOTORBIKE RIDERS AND CYCLISTS 8.1 INTRODUCTION Motorbike and bicycle riders constitute only a small portion of road accident victims. In the RAF system only 1%
1. The consultation seeks views on the vision, targets and measures for improving road safety in Great Britain for the period beyond 2010.
 Executive Summary 1. The consultation seeks views on the vision, targets and measures for improving road safety in Great Britain for the period beyond 2010. 2. We have made good progress in reducing road
Reported Road Casualties Great Britain: 2012. Annual Report
 Reported Road Casualties Great Britain: 2012 Annual Report DEPARTMENT FOR TRANSPORT SCOTTISH GOVERNMENT WELSH ASSEMBLY GOVERNMENT REPORTED ROAD CASUALTIES GREAT BRITAIN 2012 Published : September 2013
Contributory factors to road accidents
 Contributory factors to road accidents Jonathan Mosedale, Andrew Purdy and Eddie Clarkson, Transport Statistics: Road Safety, Department for Transport Introduction The STATS19 national system of collection
Reported Road Casualties Great Britain: 2013. Annual Report. File: 69282_Junctions_6_Sheet Client: TFL. Size: 450x300 Date: 15/10/13
 Reported Road Casualties Great Britain: 2013 Annual Report File: 69282_Junctions_6_Sheet Client: TFL Op: Steve AMV Job No: Publication: 6 Sheet Size: 450x300 Date: 15/10/13 Page:1 DEPARTMENT FOR TRANSPORT
Casualties in Greater London during 2013 June 2014
 Transport for London Surface Transport z Fact sheet Surface Planning Casualties in Greater London during 2013 June 2014 This fact sheet provides a summary and initial analysis of personal injury road traffic
Oxfordshire Local Transport Plan 2011-2030 Revised April 2012. Objective 3 Reduce casualties and the dangers associated with travel
 6. Road Safety Objective 3 Reduce casualties and the dangers associated with travel Road safety continues to be a core priority both nationally and locally reflecting the very high human and other costs
Welsh Fire and Rescue Services Road Safety Strategy 2015-2020
 All Wales Call Challenge Welsh Fire and Rescue Services Road Safety Strategy 2015-2020 GWASANAETH TÂN AC ACHUB Canolbarth a Gorllewin Cymru Mid and West Wales FIRE AND RESCUE SERVICE 2 Contents Executive
Review of 20 mph zones in London Boroughs. by D C Webster and R E Layfield. Published Project Report PPR243
 Review of 20 mph zones in London Boroughs by D C Webster and R E Layfield Published Project Report PPR243 Review of 20 mph zones in London Boroughs by D C Webster and R E Layfield PUBLISHED PROJECT REPORT
East Ayrshire Council Road Safety Plan
 East Ayrshire Council Road Safety Plan Foreword Road crashes are not inevitable - the deaths and injuries which occur each year need not happen. However, in order to reduce these incidents a major effort
NORTH EAST Regional Road Safety Resource
 NORTH EAST Regional Road Safety Resource Project Report: 1. Regional Overview of Pedal Cycle Accidents 2005 2007. Produced May 2008. Natalie Goodman Project is supported by the Department of Transport.
Community Motor Vehicle Collision Priority Setting Toolkit Part One
 Community Motor Vehicle Collision Priority Setting Toolkit Part One Table of Contents Introduction! 3 How to use this resource! 3 The Issue of Injury! 4 General information! 4 Motor Vehicle Collisions!
STAFFORDSHIRE COUNTY COUNCIL ROAD CASUALTY REVIEW
 223/9/213 STAFFORDSHIRE COUNTY COUNCIL ROAD CASUALTY REVIEW 212 STAFFORDSHIRE COUNTY COUNCIL ROAD CASUALTY REVIEW 212 Contents 1. Accident and Casualty Statistics 2. Introduction 3. Long Term Progress/Casualty
Road Safety Authority Provisional Review of Road Crashes 2013
 A review of 2013 fatal collision statistics December 31 st 2013 The following report summarises the main trends that have emerged in 2013. This has been prepared by the Road Safety Authority following
Child Road Safety Audit for South Gloucestershire 2009-2011
 Child Road Safety Audit for South Gloucestershire 9 - August 9 Contents Page Foreword Executive Summary. Introduction. Review of the Action Plan. Summary of Casualty Statistics 9. Child Casualty Trends.
Title. Pedal cyclist casualties, 2013
 Title SB 57/2014 2 July 2014 Pedal cyclist casualties, 2013 This Statistical Bulletin looks at pedal cyclist road traffic casualties in Wales. It looks both at all pedal cyclist casualties and at child
CAMPAIGN ASSETS THINK CYCLIST STAKEHOLDER TOOLKIT
 STAKEHOLDER TOOLKIT INTRODUCTION The Department for Transport s campaign provides road safety information for road users. Our aim is to encourage safer behaviour to reduce the number of people killed and
Killed 2013 upper estimate Killed 2013 lower estimate Killed 2013 central estimate 700
 Statistical Release 12 February 2015 Estimates for reported road traffic accidents involving illegal alcohol levels: 2013 (second provisional) Self-reported drink and drug driving for 2013/14 Main findings
Young drivers where and when are they unsafe: analysis of road accidents in Great Britain 2000 2006
 Young drivers where and when are they unsafe: analysis of road accidents in Great Britain 2000 2006 Original research by Email: [email protected] August 2008 Copyright the IAM Motoring Trust Extracts
Traffic Accident Trends in Hong Kong
 Traffic Accident Trends in Hong Kong Traffic Accident Trends in Hong Kong INTRODUCTION 4.1 With a total area of 1 102 km 2, Hong Kong has a population of 6.8 million and 522 912 licensed vehicles as at
Pedal cyclist collisions and casualties in Greater London
 Transport for London Surface Transport Factsheet Better Routes and Places Directorate Topic Factsheet 211-1 September 211 Pedal cyclist collisions and casualties in Greater London This factsheet looks
ALCOHOL AND DRUGS IN ROAD CRASHES IN SOUTH AUSTRALIA
 Relative Risk FACT SHEET ALCOHOL AND DRUGS IN ROAD CRASHES IN SOUTH AUSTRALIA August 2014 Alcohol remains the most important drug in terms of its contribution to crash involvement. Alcohol impairs skill
Reported Road Accident Statistics
 Reported Road Accident Statistics Standard Note: SN/SG/2198 Last updated: 24 October 2013 Author: Matthew Keep & Tom Rutherford Social and General Statistics Section This Note provides a range of data
The total number of traffic collisions in Saskatchewan is up 5% from 51,733 in 2008 to 54,229 in 2009.
 2009 Summary The total number of traffic collisions in Saskatchewan is up 5% from 51,733 in 2008 to 54,229 in 2009. The number of fatal collisions decreased 2% over the past year from 132 in 2008 to 129
The characteristics of fatal road accidents during the end of year festive period
 The characteristics of fatal road accidents during the end of year festive period 1994-2003 March 2004 Traffic Management and Road Safety Unit Ministry of Public Infrastructure, Land Transport and Shipping
The Relationship between Speed and Car Driver Injury Severity
 Road Safety Web Publication 9 The Relationship between Speed and Car Driver Injury Severity D. Richards and R. Cuerden Transport Research Laboratory April 2009 Department for Transport: London Although
Strategic targets board as a management tool for Spanish road safety
 Road safety data: collection and analysis for target setting and monitoring performances and progress Strategic targets board as a management tool for Spanish road safety Pilar Zori Bertolin Spain Spanish
Traffic Collision Statistics Report
 Traffic Collision Statistics Report 2012 EXECUTIVE SUMMARY Executive Summary 2012 Traffic Collision Statistics Report Executive Summary Motor vehicle collisions resulting in a fatality, injury or property
Road fatalities in 2012
 Cambodia Source: IRTAD, National Road Safety Committee Inhabitants Vehicles/1 000 inhabitants Road fatalities in 2012 Fatalities /100 000 inhabitants in 2012 14.7 million 148 1 966 13.4 Cambodia joined
RISER. Roadside Infrastructure for Safer European Roads
 Roadside Infrastructure for Safer European Roads PROJECT START DATE: 01/01/2003 DURATION: 36 months CONTRACT NUMBER: GRD2/2001/50088//S07.15369 Co-Sponsored by DG-TREN TU-Graz Institute for Mechanics Heinz
The facts about mobile phones and driving
 The facts about mobile phones and driving The facts about mobile phones and driving 1 Use of mobile phones while driving policy Employee safety, health and wellbeing is of the highest importance to us.
Road fatalities in 2012. Road fatality: person killed in a traffic crash or deceased because of an injury within 30 days after the crash.
 Norway Source: IRTAD, Public Roads Administration Inhabitants Vehicles/1 000 inhabitants Road fatalities in 2012 Fatalities /100 000 inhabitants in 2012 5.0 million 703 145 2.9 1. Road safety data collection
Legislative Council Panel on Transport. Cycling Safety and Use of Safety Equipment for Cyclists
 LC Paper No. CB(1)1130/10-11(05) For Discussion 28 January 2011 Legislative Council Panel on Transport Cycling Safety and Use of Safety Equipment for Cyclists Purpose This paper briefs members on Government
THE ACCIDENT REDUCTION EFFECTIVENESS OF ESC EQUIPPED CARS IN GREAT BRITAIN.
 THE ACCIDENT REDUCTION EFFECTIVENESS OF ESC EQUIPPED CARS IN GREAT BRITAIN. ABSTRACT Pete Thomas, Vehicle Safety Research Centre, Loughborough University, UK Ph: +44 509 22693, [email protected] This
136 deaths in 2007 (Latest figures available) UK (129 in England) 2,458 serious injuries in 2007 in the UK source- National Office of Statistics
 UK (129 in England) 2,458 serious injuries in 2007 in the UK source- National Office of Statistics") Cycle facts to arm and protect DEATHS AND INJURIES Time: 136 deaths in 2007 (Latest figures available) UK (129 in England) 2,458 serious injuries in 2007 in the UK source- National Office of Statistics
Cycle facts to arm and protect DEATHS AND INJURIES Time: 136 deaths in 2007 (Latest figures available) UK (129 in England) 2,458 serious injuries in 2007 in the UK source- National Office of Statistics
Speed Limit Policy Isle of Wight Council
 APPENDIX C - 59 Speed Limit Policy Isle of Wight Council June 2009 Contents Section 1 Introduction 1.1 Links with the Local Transport Plan Section 2 Speed Limits on Urban Roads and Residential Areas 2.1
CAMPAIGN ASSETS THINK CYCLIST STAKEHOLDER TOOLKIT
 STAKEHOLDER TOOLKIT INTRODUCTION The Department for Transport s campaign provides road safety information for road users. Our aim is to encourage safer behaviour to reduce the number of people killed and
Transport Research Laboratory Creating the future of transport
 Transport Research Laboratory Creating the future of transport PUBLISHED PROJECT REPORT PPR663 Investigating the reduction in fatal accidents in Great Britain from 2007-2010 Louise Lloyd, Caroline Reeves,
Basic facts Cycling accidents in Poland Conclusions. Bicycle safety. Aleksander Buczyński [email protected]. Zielone Mazowsze www.zm.org.
 Bicycle safety Aleksander Buczyński [email protected] Zielone Mazowsze www.zm.org.pl September 2011 Why analyse cycling accidents? Difference between perceived and real danger Safety campaigns Understanding
Road fatalities in 2012. Road fatality: any person killed immediately or dying within 30 days as a result of a road crash.
 Korea, KoRoad Inhabitants Vehicles/1 000 inhabitants Road fatalities in 2012 Fatalities /100 000 inhabitants in 2012 48.9 million 438 5 392 10.8 1. Road safety data collection Definitions: Road fatality:
Cycling Demonstration Towns Development of Benefit-Cost Ratios
 Cycling Demonstration Towns Development of Benefit-Cost Ratios Executive summary 1. In 2005, Cycling England launched a Cycling Demonstration Town programme to invest in measures to stimulate increased
Brake the road safety charity
 Brake the road safety charity Aviva Risk Management Solutions Fleet Safety for SME s A practical approach By Steve Palmer ARMS Risk Services Manager Motor Steve Palmer F.I.C.F.M. (Dip.), NEBOSH Cert, CIIM.
Fleet and Driver Risk Management Policy
 Fleet and Driver Risk Management Policy Document Control Document Ref: Date Created: Version: 1 Date Modified: 6 th August 2010 Revision due Author: M Billinge-Jones Owning Service Equality Impact Assessment:
Road Safety Plan 2010
 Road Safety Plan 2 Road Safety Plan C. A. Hudson, CBE Chief Executive St.Helens Council Town Hall Victoria Square St.Helens Merseyside WA HP December 2 St.Helens Council This document has been produced
Bicycle Crash Data 2012
 Bicycle Crash Data 2012 Local Law 13 of 2011 requires the NYC Department of Transportation (NYCDOT) to report on the total number of bicycle crashes, injuries, and fatalities that are reported to city
Children and road safety: a guide for parents
 Child Safety Week Report Children and road safety: a guide for parents What are the facts? The number of children aged up to 19 years who are killed or seriously injured each year on Britain's roads has
Deaths/injuries in motor vehicle crashes per million hours spent travelling, July 2008 June 2012 (All ages) Mode of travel
 Mode of travel") Cyclists CRASH STATISTICS FOR THE YEAR ENDED 31 DECEMBER 212 Prepared by the Ministry of Transport CRASH FACTSHEET November 213 Cyclists have a number of risk factors that do not affect car drivers. The
Cyclists CRASH STATISTICS FOR THE YEAR ENDED 31 DECEMBER 212 Prepared by the Ministry of Transport CRASH FACTSHEET November 213 Cyclists have a number of risk factors that do not affect car drivers. The
Injury indicators: A validation tool. Road safety indicator specifications
 Injury indicators: A validation tool. Road safety indicator specifications Colin Cryer CHSS, University of Kent March 2002. The following gives the specifications of the indicators used in the project:
Put the Brakes on Speeding
 Put the Brakes on Speeding The risks of driving too fast The costs and consequences Tips to maintain a safe speed Speed kills There s no doubt about it driving over the speed limit is dangerous. It puts
CYCLISTS INVOLVED IN ROAD CRASHES IN SOUTH AUSTRALIA
 FACT SHEET CYCLISTS INVOLVED IN ROAD CRASHES IN SOUTH AUSTRALIA August 2014 The following data represents police reported incidents of fatal, and minor casualties. Police data does not show the location
THE MOBILITY AND SAFETY OF OLDER DRIVERS IN BRITAIN. Mitchell, Christopher (Kit)
") THE MOBILITY AND SAFETY OF OLDER DRIVERS IN BRITAIN Mitchell, Christopher (Kit) Retired: 17 Tavistock Road, Fleet, Hampshire GU51 4EH, UK Email: [email protected] Abstract Most journeys by older
THE MOBILITY AND SAFETY OF OLDER DRIVERS IN BRITAIN Mitchell, Christopher (Kit) Retired: 17 Tavistock Road, Fleet, Hampshire GU51 4EH, UK Email: [email protected] Abstract Most journeys by older
The number of fatalities fell even further last year to below 6,000 for the first time in 54 years since 1953.
 1 Long-term trends The number of fatalities fell even further last year to below 6,000 for the first time in 54 years since 1953. Number of road traffic accidents, fatalities, and injuries Notes: 1. Source:
road safety issues 2001 road toll for the WBOP/Tauranga Police area JULY 2002 Regional crash causes 1997 2001 Major road safety issues:
 WESTERN BAY OF PLENTY/TAURANGA POLICE AREA road safety issues JULY 22 The Land Transport Safety Authority (LTSA) has prepared this Road Safety Issues Report. It is based on reported crash data and trends
Great Britain Road Safety - Plans, Targets and Measures
 A Safer Way: Consultation on making Britain s roads the safest in the world Response from: British Vehicle Rental and Leasing Association River Lodge Badminton Court Amersham BUCKS HP7 0DD Tel: +44 1494
Road safety Performance Indicators in Hungary
 Acta Technica Jaurinensis Vol. 3. No. 1. 2010 Road safety Performance Indicators in Hungary P. Holló KTI Institute for Transport Sciences Non-profit Ltd. H-1518 Budapest, PO Box 107, Hungary Phone : +36(1)3715823,
Driving as a Public Health Problem.
 Driving as a Public Health Problem. Dr Nicola Christie (UCL),Dr Philip Edwards (LSHTM), Professor Judith Green (LSHTM), Dr Sarah Jones (Cardiff University), and Professor Lindsay Prior (QUB). 1. The Issues:
Maryland s Motorcycle Crash Picture
 Maryland s Motorcycle Crash Picture Cindy Burch University of Maryland, Baltimore National Study Center for Trauma and EMS Maryland Center for Traffic Safety Analysis Challenges Motorcycle safety is not
Combining technology and coaching to reduce risk on the roads
 Combining technology and coaching to reduce risk on the roads Improving the behaviour and attitudes of commercial vehicle drivers A special report for fleet insurers and commercial fleet owners looking
Year Fatalities Injuries
 MOTORCYCLES, 2013 MAY 2014 ISSUE 14-C02 HIGHLIGHTS In 2013, the 113 Indiana fatal collisions involving motorcycles resulted in 118 fatalities. The 118 fatalities involved 81 motorcycle operators, 23 moped
How To Be Safe On The Road In Finnish Road Traffic
 ROAD SAFETY WORK OF THE FINNISH INSURERS 7th May 2013 UNECE Road Safety Week Kalle Parkkari Road Safety Vision in Finland Nobody should be killed or seriously injured in road traffic The goal in many countries,
Regional Road Safety Strategy September 2004
 Regional Road Safety Strategy September 2004 Regional Road Safety Strategy September 2004 Cover photo courtesy of St Mark s Church School Executive Summary The vision of the Regional Road Safety Strategy
CYCLING. RoSPA POLICY PAPER. May 2015
 CYCLING RoSPA POLICY PAPER May 2015 CONTENTS AND STRUCTURE Executive Summary Introduction Purpose of the Policy paper Levels of Cycling Benefits and Risks of Cycling Cyclist Casualty Numbers and Rates
Speed Cameras: The Case in Favour
 Speed Cameras: The Case in Favour Speed cameras have become a topic of considerable controversy in recent months. This contribution to the debate takes as axiomatic the following premises. First, there
Fatal motorcycle crashes in north Queensland: characteristics and potential interventions
 Fatal motorcycle crashes in north Queensland: characteristics and potential interventions Ross Blackman¹, Dale Steinhardt¹, Craig Veitch² ¹Centre for Accident Research and Road Safety Queensland, Queensland
CANADIAN ROAD SAFETY YOUTH CONFERENCE ENFORCEMENT. Police Constable Mike Taylor # 8855 Toronto Police Service
 CANADIAN ROAD SAFETY YOUTH CONFERENCE ENFORCEMENT Police Constable Mike Taylor # 8855 Toronto Police Service Traffic Services Mission Statement To deliver effective and efficient traffic policing services
Managing Risks Beyond Driver Training
 Managing Risks Beyond Driver Training Presented by: Kevin Clinton Head of Road Safety DRIVING FOR WORK CASUALTIES 2006 2007 2008 2009 2010 2011 2012 2013 Killed 858 890 748 592 540 559 539 515 Seriously
Cycling Promotion and Cycling Safety: Is there a conflict? C.Woolsgrove *
 Proceedings, International Cycling Safety Conference 2012 7-8 November 2012, Helmond, The Netherlands Cycling Promotion and Cycling Safety: Is there a conflict? C.Woolsgrove * * European Cyclists Federation
Pedestrian and Bicycle Crash Data Analysis: 2005-2010
 MICHIGAN DEPARTMENT OF TRANSPORTATION Pedestrian and Bicycle Crash Data Analysis: 2005-2010 FINAL REPORT Prepared by: T.Y. Lin International and Western Michigan University 4/3/2012 TABLE OF CONTENTS List
Q. How can we get (and keep) Britain cycling? A. Reducing risk of non-collision incidents will help make cycling more enjoyable.
 Britain cycling? A. Reducing risk of non-collision incidents will help make cycling more enjoyable.") Evidence presented to All Party Parliamentary Cycling Group: 5th December 2012 Q. How can we get (and keep) Britain cycling? A. Reducing risk of non-collision incidents will help make cycling more enjoyable.
Evidence presented to All Party Parliamentary Cycling Group: 5th December 2012 Q. How can we get (and keep) Britain cycling? A. Reducing risk of non-collision incidents will help make cycling more enjoyable.
THE ROAD SAFETY MONITOR 2013 DRINKING AND DRIVING IN CANADA
 T R A F F I C I N J U R Y R E S E A R C H F O U N D A T I O N THE ROAD SAFETY MONITOR 2013 DRINKING AND DRIVING IN CANADA The knowledge source for safe driving THE TRAFFIC INJURY RESEARCH FOUNDATION The
20XX. Car safety rating 2015 by Folksam
 20XX Car safety rating 2015 by Folksam Preface Folksam has a long tradition in the area of traffic safety research. We have been collecting and analyzing information about road traffic crashes and injuries
are the leading cause of teen fatalities, accounting for
 An exclusive offer for a teen driving presentation which is dynamic, interactive, and a must for teens or college students commuting to and from universities. Driving Safety Solutions Inc. P R ES E N TS
Measuring road crash injury severity in Western Australia using ICISS methodology
 Measuring road crash injury severity in Western Australia using ICISS methodology A Chapman Data Analyst, Data Linkage Branch, Public Health Intelligence, Public Health Division, Department of Health,
Position Paper: Effectiveness of Speed Cameras and Use in Western Australia, Victoria and New South Wales
 Position Paper: Effectiveness of Speed Cameras and Use in Western Australia, Victoria and New South Wales The Government has committed to the implementation of Toward Zero, including the recommended implementation
New Zealand all-age mandatory bicycle helmet law
 New Zealand all-age mandatory bicycle helmet law A public health and safety disaster New Zealand is one of only three countries in the world with national all-age mandatory bicycle helmet laws, the others
How to reduce road injuries through best-practice speed management : Learnings from Australia s experience
 How to reduce road injuries through best-practice speed management : Learnings from Australia s experience Associate Professor Jennie Oxley Monash University Accident Research Centre WRI Sao Paulo, 15
Characteristics of High Injury Severity Crashes on 80 110 km/h Rural Roads in South Australia
 Characteristics of High Injury Crashes on 80 110 km/h Rural Roads in South Australia, J. R. R. Centre for Automotive Safety Research, University of Adelaide, SOUTH AUSTRALIA, 5005 email: [email protected]
REPORT EXTRACTS RELATING TO THE RECOMMENDATION FOR INSURANCE PREMIUM TAX RELIEF ON TELEMATICS MOTOR INSURANCE FOR YOUNG DRIVERS
 REPORT EXTRACTS RELATING TO THE RECOMMENDATION FOR INSURANCE PREMIUM TAX RELIEF ON TELEMATICS MOTOR INSURANCE FOR YOUNG DRIVERS In order to meet Treasury s consultation timetable for budget proposals,
road safety issues 2001 road toll for the Bay of Plenty Police district JULY 2002 Regional crash causes 1997 2001 Major road safety issues:
 BAY OF PLENTY POLICE DISTRICT road safety issues JULY 22 The Land Transport Safety Authority (LTSA) has prepared this Road Safety Issues Report. It is based on reported crash data and trends for the 1997