7HUUD6XUYH\8VHUV*XLGH
|
|
|
- Dennis Lucas
- 10 years ago
- Views:
Transcription
1 7HUUD6XUYH\8VHUV*XLGH 7HUUDVROLG/WG
2 7UDGHPDUNV MicroStation, MDL and MicroStation stylized "M" are registered trademarks, and MicroStation PowerDraft is a trademark of Bentley Systems, Incorporated. TerraBore, TerraLink, TerraModeler, TerraPark, TerraPhoto, TerraPipe, TerraScan, TerraStreet and TerraSurvey are trademarks of Terrasolid Limited. Windows is a trademark of Microsoft Corporation. Acrobat Reader is a trademark of Adobe Systems Incorporated. &RS\ULJKW Arttu Soininen, Terrasolid Limited. All rights reserved.

3 7DEOHRI&RQWHQWV Part I: Getting Started,QWURGXFWLRQ... 8 Terra application family... 9,QVWDOODWLRQ Hardware and software requirements Installation media Installation from floppy Installation from CD WDUWLQJ7HUUD6XUYH\ Unloading TerraSurvey Part II: Tutorial 7XWRULDO TerraSurvey interface Creating an empty design file Starting TerraSurvey Opening a feature list Loading a survey file for verification Viewing survey data Viewing problem points Fixing reported problems Fixing unreported problems Connecting building corners Writing the verified survey drawing Loading borehole locations Assigning codes to borehole points Modifying borehole drawing rules Outputting points to a text file Part III: Tool Reference *HQHUDO7RROV General tool box Settings Define Features Manage Reference Points Manage Survey Files View Data Sources About TerraSurvey Help On TerraSurvey XUYH\7RROV Survey tool box... 55

4 Process Angle Observations Load Survey Verify Load Survey Automatic Draw Point Table List Survey List Elements Export to GIS Generate Contours DQLSXODWH7RROV Manipulate tool box Show Survey Info Set Scale Hide Overlapping Texts Format Leveling Texts Soften Element Build Roof Shape Draw As Feature Find Intersecting Breaklines WLOLW\7RROV Utilities tool box Magnify Measure Length Levels Set Active Angle Part IV: Settings Reference 'UDZLQJ5XOH6HWWLQJV Point count requirements Placement offset Cell drawing rules Text drawing rules Circle drawing rules Linear drawing rules Multipoint cell drawing rules Surface element drawing rules Structure drawing rules VHU'HILQHG)LOH)RUPDWV Delimeted format definition Fixed length format definition %XLOWLQ$QJOH)LOH)RUPDWV Wild angle GSI-8 format %XLOWLQ;\])LOH)RUPDWV Geodimeter Moss genio SDRmap Sokkia Wild xyz GSI-8 format Wild xyz GSI-16 format

5 6WULQJ+DQGOLQJLQ6XUYH\ Default logic Break codes Point indexes String numbers Sectional master codes EVHUYDWLRQ&RUUHFWLRQV Prism constant correction Pressure and temperature correction Curvature and refraction correction Sea level correction Projection correction ,QVWDOODWLRQ'LUHFWRULHV &RQILJXUDWLRQ9DULDEOHV

6 $ERXWWKHGRFXPHQWDWLRQ This document serves as a user s guide for two versions of TerraSurvey. The entry-level version, TerraSurvey Field, is functionally a subset of the full version which is called TerraSurvey for MicroStation. All of the tools in TerraSurvey Field are available in the full version as well and work identically in the two versions. The full MicroStation version provides some additional tools which are not available in the entry-level version. In this documentation, those features are marked as Not Field. This User s Guide is divided into four parts: Getting Started - contains general information about TerraSurvey and instructions on how to install and run the application. Tutorial - contains lessons introducing the basic concepts and the most common tools in the application. Tool Reference - contains detailed descriptions of all the tools in TerraSurvey. Settings Reference - contains detailed descriptions of settings concerning survey file formats and feature codes. $FFHVVLQJGRFXPHQWDWLRQRQOLQH The documentation is accessible as an Acrobat Reader document which serves the role of on-line help. Accessing the electronic format of the documentation has the following unique advantages: You can conduct automated searches for keywords in topic names or body text. You can click hypertext to "jump" to related topics. 'RFXPHQWFRQYHQWLRQV The following conventions and symbols appear in this guide: Keyboard keys are enclosed in angle brackets - for example, <Return>. Alternate procedures are separated by "OR". Alternate steps in a procedure are separated by "or". "Key in" means to type a character string and then press <Return> (or <Tab> in dialog boxes). The following icons are used to specify special information:,frq $SSHDUVQH[WWR? Notes á Hints and shortcuts Procedures When no distinction between MicroStation 95, MicroStation SE, MicroStation J, MicroStation GeoOutlook and MicroStation PowerDraft is necessary, this document refers to the CAD environment simply as "MicroStation". Features which are available only in TerraSurvey for MicroStation and can not be used with TerraSurvey Field are labeled as 1RW)LHOG. When no distinction between TerraSurvey for MicroStation and TerraSurvey Field is necessary, this document refers to the application as "TerraSurvey" or as "the application". 0LFUR6WDWLRQGRFXPHQWDWLRQ This document has been written assuming that the reader knows how to use basic MicroStation features. You should refer to MicroStation printed documentation or on-line help whenever you need information on using the CAD environment.

7 3DUW,*HWWLQJ6WDUWHG

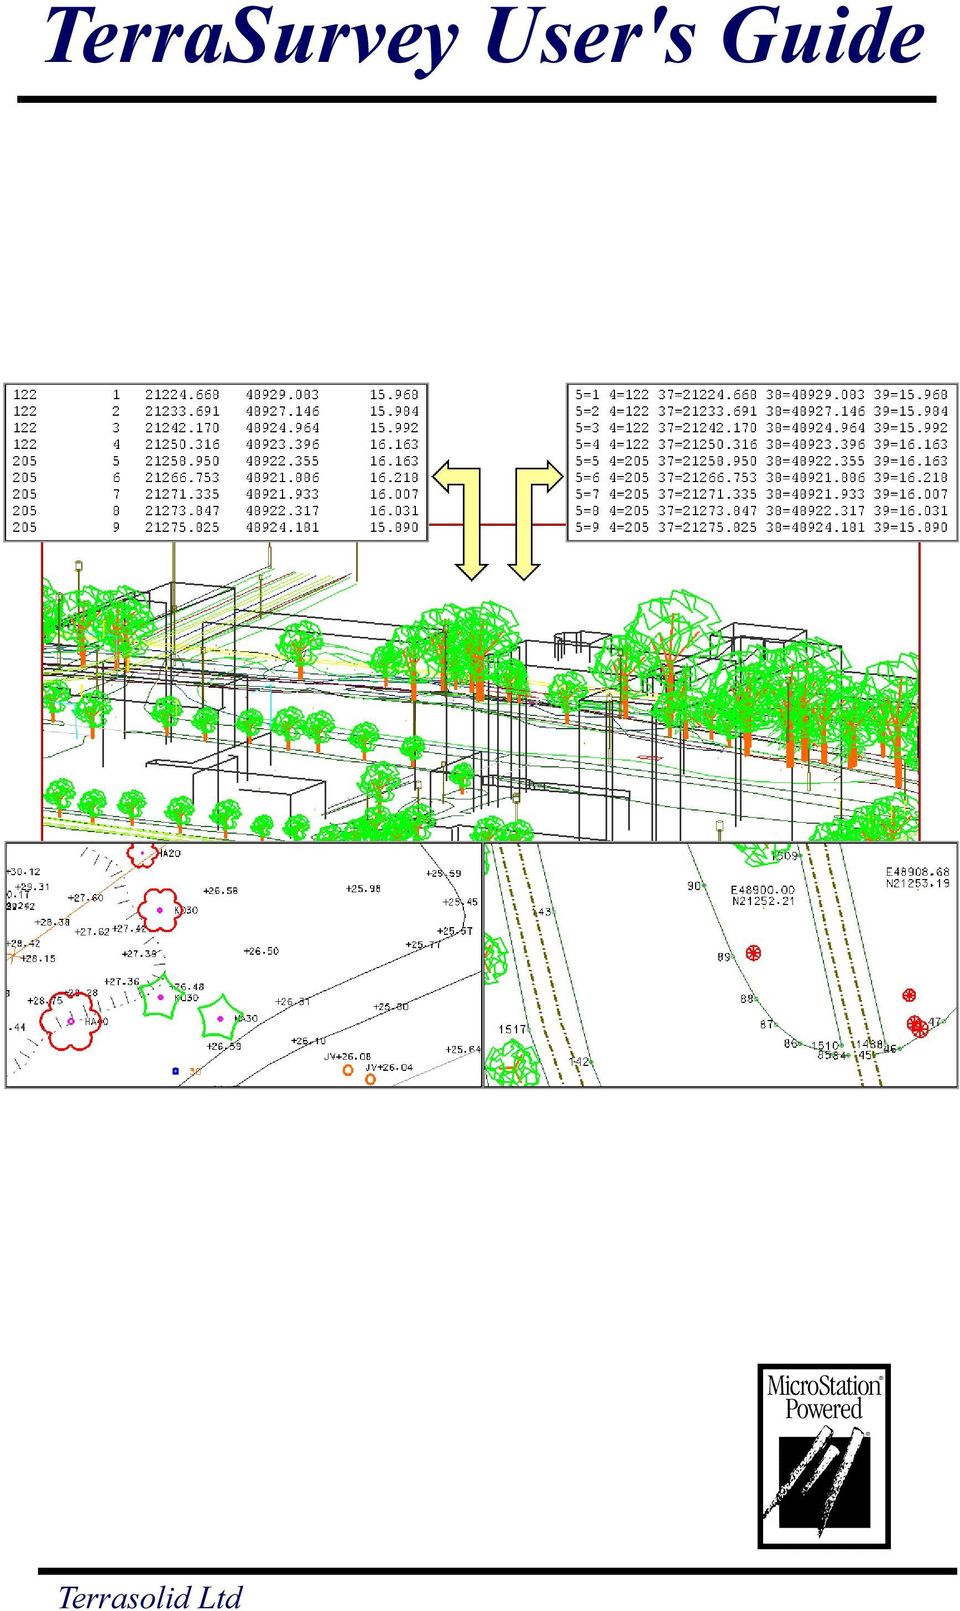
8 ,QWURGXFWLRQ,QWURGXFWLRQ TerraSurvey is a survey drawing application built on top of MicroStation. It reads in survey data from a text file and creates a survey drawing as a design file. TerraSurvey is able to read in survey data from various formats: Geodimeter, Wild, Sokkisha, SdrMap or Tekla. The ability to create user defined file formats lets you read in practically any text files containing point data organised into readable fields. The survey data can be based on coordinates or on surveyed angles. When you read in a file, the application recognizes the data format automatically so there is no need for conversion between file formats. You control the survey drawing generation with a feature list. This list determines how each of the surveyed features will be drawn in the map. Each feature code can be assigned one or more drawing rules, which produce lines, line strings, curves, text elements, cells, patterned lines and so on. TerraSurvey is especially well suited to loading in and validating data from various sources. It does not make any difference whether the input file was created by a survey data collector, a spreadsheet application or a database reporting tool. You just load in the data, assign drawing rules, check for errors, make necessary corrections - all this interactively while viewing the resulting survey drawing. TerraSurvey comes with a number useful utilities when working with survey drawings. For example, 6HW6FDOH tool will rescale an existing drawing for a new plotting scale. It resizes all appropriate text elements and cells in the drawing. 'UDZ3RLQW7DEOH tool lets you attach a columnar table of selected points to the drawing. This table will display the feature codes, point indexes and coordinates of selected points.

9 ,QWURGXFWLRQ 7HUUDDSSOLFDWLRQIDPLO\ TerraSurvey is just one in a full family of civil engineering applications. All of Terra applications are tightly integrated with MicroStation presenting an easy-to-use graphical interface to the user. 7HUUD%RUH is a solution for reading in, editing, storing and displaying bore hole data. You can triangulate soil layers with the help of TerraModeler. 7HUUD0RGHOHU creates terrain surface models by triangulation. You can create models of ground, soil layers or design surfaces. Models can be created based on survey data, graphical elements or XYZ text files. The application is able to handle up to 12 different surfaces in the same design file. 7HUUD3DUN is an easy-to-use package for park design and landscaping. It has all the necessary tools for designing roads, regions, plants and utilities inside the park. 7HUUD3KRWR rectifies digital photographs taken during laser scanning survey flights and produces orthorectified images. 7HUUD3LSH is used for designing underground pipes. It gives you powerful tools for designing networks of drainage, sewer, potable water or irrigation pipes. 7HUUD6FDQ processes laser scanning data. It reads in laser points from text files and lets you view the points three dimensionally, classify the points and create vectores based on the points. 7HUUD6WUHHW is an application for street design. It includes all the terrain modeling capabilities of TerraModeler. Street design process starts with the creation of horizontal and vertical geometries for street alignments. All of these applications are available for MicroStation 95, SE or J under Windows 95 / 98 / NT for Intel or Windows NT for Alpha environments. Some of the applications are available for MicroStation PowerDraft.

10 ,QVWDOODWLRQ,QVWDOODWLRQ +DUGZDUHDQGVRIWZDUHUHTXLUHPHQWV TerraSurvey is built on top of MicroStation. You must have a computer system capable of running this CAD environment. The requirements below apply to Intel based Windows configurations. To run TerraSurvey, you should have the following: Pentium or higher processor Windows 95 or Windows 98 or Windows NT mouse 1024*768 resolution display or better 64 MB RAM MicroStation 95, MicroStation SE, MicroStation J, MicroStation GeoOutlook or MicroStation PowerDraft installed Installation of TerraSurvey requires about 3 MB of free hard disk space.,qvwdoodwlrqphgld TerraSurvey may be delivered on a single floppy or on a CD. The floppy is big enough only to contain the actual software and the example data sets it does not include the on-line Acrobat manual. 7HUUD,QVWDOODWLRQ&' includes the software, example data and the on-line documentation. When you install from the CD, the software and the documentation will be copied to you hard disk. Installation CD includes versions for multiple environments. You should locate the directory which corresponds to your operating system and version of MicroStation. 7HUUD6XUYH\IRU0LFUR6WDWLRQGLUHFWRULHVRQ&' 'LUHFWRU\RQ&' )RURSHUDWLQJV\VWHP )RU0LFUR6WDWLRQ \alphant\eng\msse\ Windows NT for Alpha SE or J \windows\eng\ms95 Windows 95, 98 or NT for Intel 95 or GeoOutlook \windows\eng\msse Windows 95, 98 or NT for Intel SE or J 7HUUD6XUYH\)LHOGGLUHFWRULHVRQ&' 'LUHFWRU\RQ&' )RURSHUDWLQJV\VWHP )RU0LFUR6WDWLRQ \windows\eng\field Windows 95, 98 or NT for Intel 95, SE, J, GeoOutlook or PowerDraft

11 ,QVWDOODWLRQ,QVWDOODWLRQIURPIORSS\ 7RLQVWDOO7HUUD6XUYH\IURPIORSS\ 1. Insert TerraSurvey floppy in your local drive (usually drive A:). 2. Select 5XQ command 6WDUWmenu. 3. Type a:\setup (if floppy is in A: drive) 4. Click OK. The installation program will need to know where MicroStation has been installed. It will automatically search all local hard disks to find the MicroStation directory. The installation dialog box opens: 5. The installation program prompts you to enter the directory where to install TerraSurvey. The default path is C:\TERRA. You can set this to another location if you prefer. The specified directory will be automatically created, if it does not exist. 6. At this stage you should check the directory where MicroStation was found. Replace the path if the correct location was not found. 7. Press <Return> to continue. When the installation is finished, a message is displayed and you are prompted to press any key to continue. See chapters,qvwdoodwlrq'luhfwrulhv on page 113 and &RQILJXUDWLRQ9DULDEOHV on page 114 for more information.

12 ,QVWDOODWLRQ,QVWDOODWLRQIURP&' 7RLQVWDOO7HUUD6XUYH\IURP&' 1. Insert TerraSurvey CD into your CD-ROM drive. 2. Locate the correct directory which corresponds to your computer configuration. 3. Start SETUP.EXE from that directory. The installation program will first want to know what applications you want to install. The setup dialog box opens: 4. Check 7HUUD6XUYH\IRU0LFUR6WDWLRQ item in the dialog. You may select other applications as well for which you have a valid license. 5. Click OK. The installation program will need to know where MicroStation has been installed. It will automatically search all local hard disks to find the MicroStation directory. The installation dialog box opens: 6. The installation program prompts you to enter the directory where to install the applications. The default path is C:\TERRA. You can set this to another location if you prefer. The specified directory will be automatically created, if it does not exist. 7. At this stage you should check the directory where MicroStation was found. Replace the path if the correct location was not found. 8. Press <Return> to continue. When the installation is finished, a message is displayed and you are prompted to press any key to continue. See chapters,qvwdoodwlrq'luhfwrulhv on page 113 and &RQILJXUDWLRQ9DULDEOHV on page 114 for more information.

13 6WDUWLQJ7HUUD6XUYH\ 6WDUWLQJ7HUUD6XUYH\ TerraSurvey is an MDL application that runs within MicroStation. 7RVWDUW7HUUD6XUYH\ 1. From the 8WLOLWLHV menu, choose 0'/$SSOLFDWLRQV. The 0'/ dialog box opens: 2. In the $YDLODEOH$SSOLFDWLRQV list box, select TSURVEY. 3. Click the /RDG button. OR 1. Key in MDL LOAD TSURVEY. User settings determine what menus and tool boxes the application will open during startup. In addition to its 0DLQ tool box, TerraSurvey may create an $SSOLFDWLRQV menu in the command window.? $YDLODEOH$SSOLFDWLRQV list box shows all the MDL applications that MicroStation is able to locate. MicroStation searches for MDL applications in the directories listed in MS_MDLAPPS configuration variable. If MicroStation can not find TSURVEY.MA, you should check the value assigned to this configuration variable. Make sure the directory path of TSURVEY.MA file is included in this variable. To view configuration variables, choose &RQILJXUDWLRQ command from the :RUNVSDFH menu. See,QVWDOODWLRQ'LUHFWRULHV on page 113 and &RQILJXUDWLRQ9DULDEOHV on page 114 for more information.

14 6WDUWLQJ7HUUD6XUYH\ 8QORDGLQJ7HUUD6XUYH\ TerraSurvey will unload automatically when you exit MicroStation. Sometimes you may want to unload TerraSurvey while continuing to work with MicroStation. This will free up memory reserved by TerraSurvey. 7RXQORDG7HUUD6XUYH\ 1. Close TerraSurvey s 0DLQ tool box. The application will be unloaded. OR 1. From the 8WLOLWLHV menu, choose 0'/$SSOLFDWLRQV. The 0'/ window box opens: 2. In the /RDGHG$SSOLFDWLRQV list box, select TSURVEY. 3. Click the 8QORDG button. OR 1. Key in MDL UNLOAD TSURVEY.

15 3DUW,,7XWRULDO

16 7XWRULDO 7XWRULDO This tutorial will help you learn some of the basic tools in TerraSurvey. It will introduce some concepts and terminology used by the application. With the help of an example data set, you will be guided through a number of exercises using some of the most important features in TerraSurvey. This tutorial assumes that you are already familiar with MicroStation and know how to manipulate view windows, how to use drawing tools and how to open design files. The example data set has been supplied as a courtesy of Pekka Björklund from the Geotechnical Department in the City of Helsinki. 7HUUD6XUYH\LQWHUIDFH The user interface of TerraSurvey is very similar to that of MicroStation. When you load TerraSurvey, it will open its 0DLQ tool box. All of TerraSurvey's tools are located in this tool box, which is actually a parent of four child tool boxes. These child tool boxes contain icons representing individual tools. To activate a tool, click the tool icon. You can control the operation of a tool with tool settings. These are control fields affecting the operation of that specific tool. Most of the tools will display their settings in a 7RROVHWWLQJV window which is shared by MicroStation and MDL applications. The 7RROVHWWLQJV window will display the controls for the active tool. Some of the tools will open a separate window or a dialog box where you can enter the appropriate settings.

17 7XWRULDO &UHDWLQJDQHPSW\GHVLJQILOH You should start working on this tutorial with an empty design file loaded. It is recommended that you will create the empty design file from a seed file that was installed with TerraSurvey. &UHDWLQJDVXLWDEOHHPSW\GHVLJQILOH 1. From MicroStation s )LOH menu, choose 1HZ. The &UHDWH'HVLJQ)LOH dialog box opens: 2. Assign a name for the file to be created by typing TUTORIAL.DGN in the )LOHV text control. 3. Click 6HOHFW to select the seed file to be used. The 6HOHFW6HHG)LOH dialog box opens. 4. Locate SURVSEED.DGN seed file by browsing your computer s directory structure. If you installed TerraSurvey in the default directory C:\TERRA, you can find this file in path C:\TERRA\SEED\SURVSEED.DGN. When you have located this file, select in the )LOHV list box. Alternatively, you can type in the full path of the example file in the )LOHV text control. 5. Click OK to accept the seed file. 6. Click OK to accept the creation of a new design file. 6WDUWLQJ7HUUD6XUYH\ To start TerraSurvey, go through the steps described in chapter 6WDUWLQJ7HUUD6XUYH\ on page 13.
LOH dialog box opens. 4. Locate SURVSEED.DGN seed file by browsing your computer s directory structure.")
18 7XWRULDO 2SHQLQJDIHDWXUHOLVW Feature list defines the various objects that may be drawn in a survey drawing. Feature list is basically a table of features including drawing rules assigned to each feature. In this way, the active feature list defines the graphical presentation of surveyed objects. Each survey point is assigned a feature code which defines what was surveyed - a tree, a road center line, an elevation point or may be a manhole cover. When processing survey points, TerraSurvey tries to find a matching feature code for each of the survey points and will apply all of the associated drawing rules. You can have several feature list for different purposes but only one feature list can be active at a time. 7RRSHQWKHWXWRULDOIHDWXUHOLVW 1. Select the 'HILQH)HDWXUHV tool. The )HDWXUHOLVW window opens. 2. From )LOH menu, choose 2SHQ. This opens a dialog box which allows you to select a feature list to open. 3. Locate TUTORIAL.FEA file by browsing your computer s directory structure. If you installed TerraSurvey in the default directory C:\TERRA, you can find this file in path C:\TERRA\TSURVEY\TUTORIAL.DGN. When you have located this file, select in the )LOHV list box and click OK. TerraSurvey reads in the selected file and it becomes the active feature list. The upper list box contains all the features in the active feature list. The lower list box displays all drawing rules assigned to the currently selected feature. When you select another row in the feature list box, the contents of the lower list will change. At this stage you may want to scroll through the upper list to get an overview of the various features. When you are done, you can close the )HDWXUHOLVW window.

19 7XWRULDO /RDGLQJDVXUYH\ILOHIRUYHULILFDWLRQ Having activated the appropriate feature list, you are now ready to start processing survey data. You will first load a survey file which was created using a Geodimeter total station. When loading in a survey file for the first time, you should always use the /RDG6XUYH\9HULI\ tool. It reads in the file and creates the survey drawing first in temporary mode. It allows you to verify the data, fix errors and modify drawing rules before writing the survey drawing permanently to the design file. 7RORDGWKHH[DPSOHVXUYH\ILOHIRUYHULILFDWLRQ 1. Select the /RDG6XUYH\9HULI\ tool. This opens a dialog box which allows you to select a single file to process. 2. Locate TUTORIAL.DAT file by browsing your computer s directory structure. If you installed TerraSurvey in the default directory C:\TERRA, you can find this file in path C:\TERRA\DATA\TUTORIAL.DAT. When you have located this file, select in the )LOHV list box and click OK. The 6XUYH\ILOHLQIRUPDWLRQ dialog opens. 3. You can leave this information empty and just click OK. 4. The /RDG6XUYH\9HULI\ dialog opens. The coordinate axes show the coordinate values of the first point found in the survey file. 5. Enter 200 in the 6FDOH field. 6. Click OK. TerraSurvey reads the selected file, creates a survey drawing in temporary mode and opens the /RDGHGVXUYH\SRLQWV window.

20 7XWRULDO 9LHZLQJVXUYH\GDWD You should now see both a temporary survey drawing and a window displaying all of the points found. The upper list in the/rdghgvxuyh\srlqwv window contains all of the survey points and the lower list displays problems encountered when creating the survey drawing. While this window is open, the survey drawing is visible as temporary elements which you can redraw whenever you have made modifications to the survey data. In order to properly view the survey drawing, you should now zoom in a smaller area of the surveyed. You can freely use MicroStation s view manipulation tools to move around in the drawing. 6KRZORFDWLRQ and )LQGE\ORFDWLRQ buttons help in seeing the relationship between survey points and the resulting graphical elements. 6KRZORFDWLRQ button should be used when you are looking at a point in the list box and want to find its the graphical location. 7RORFDWHVHOHFWHGVXUYH\SRLQWV 1. Select one or several survey points in upper list box by clicking on them. 2. Click on 6KRZORFDWLRQ. 3. Move the mouse inside a view. TerraSurvey shows the location(s) of the selected points by drawing a large cross or by drawing small rectangles. 4. You may enter a data click to center the view at the location of the first selected point. )LQGE\ORFDWLRQ button should be used when you are looking at a graphical element in the survey drawing and would like to find the corresponding survey point in the list box. 7RVHOHFWDSRLQWIURPWKHGUDZLQJ 1. Find a location of interest in the survey drawing. 2. Click on )LQGE\ORFDWLRQ. 3. Move the mouse inside a view. As you move the mouse, TerraSurvey will find the closest survey point and draw a circle around it. 4. Enter a data click. This highlights the closest survey point in the list box. Experiment freely with these tools to get an overview of the survey data and the resulting survey drawing.

21 7XWRULDO 9LHZLQJSUREOHPSRLQWV Survey data coming directly from the field requires careful inspection as it often contains small problems and errors. When TerraSurvey tries to create a survey drawing, it may encounter a number of problems which it will display in the lower list box of the /RDGHGVXUYH\SRLQWV window. Our example data generates two problem messages: Undefined feature code Drawing rule requires 2 points 1 The first one indicates that the survey team has used a feature code 12 which has not been defined in the active feature list. This problem was generated by 22 points. The second problem was generated by only one point. A drawing rule associated with the survey code requires that the object be surveyed by two points but only one point was found. If you click on a problem message in the lower list box, the application will select corresponding points in the upper list. In this way, you can immediately see the survey data which caused the problem. Furthermore, if you want to view the graphical location of the points, click on 6KRZ ORFDWLRQ and identify a view! The survey drawing itself only displays points which can be drawn using the feature list based drawing rules. However, many survey problems may cause the feature list based drawing generation to fail for certain points. For example, the points with an undefined feature code 12 cannot be solved from the feature list. Fortunately, the application provides a method to display the locations of error points. 7RVZLWFKRQGLVSOD\RISUREOHPSRLQWV 1. From 9LHZ menu, choose 'LVSOD\VHWWLQJV. This opens the /RDGHGSRLQWGLVSOD\ settings dialog: 2. Enter settings as shown above and click OK. This will draw a red circle and an error message at the location of each error point.
22 7XWRULDO )L[LQJUHSRUWHGSUREOHPV When verifying the incoming data, you may often need to fix problems caused by insufficient input data, survey errors or problems related to the feature list. The most common methods for fixing problems include: Fill in missing information. For example, you can assign feature codes to uncoded survey points. Delete erroneous points. Modify survey point information such as coordinate values or dimension. Create a new feature in the active feature list if you encounter a new feature code. Our example data produces to error messages which we need to look into. 7RIL[WKHVLQJOHSRLQWSUREOHP 1. Click on the second error message (Drawing rule requires 2 points). This highlights the point causing the problem in the upper list box. 2. Click on 6KRZORFDWLRQ to view the graphical location of the point. 3. Identify a view window. This centers the view window at the problem location. This point was surveyed accidentally using feature code 4 which is meant for surveying drainage manholes by two points. The correct feature code should be 2 which is used to survey any manholes using just one point. 4. From 3RLQW menu, choose (GLWVHOHFWHG. This opens the 6XUYH\SRLQW dialog where you can modify any of the data fields associated with a survey point.
23 7XWRULDO 5. Modify the &RGH text field to contain feature code Click OK. The modified information is stored in the list of survey points. 7. (Optional) You may want to redraw the survey drawing to see the result. If you click on 5HGUDZ, the survey drawing will now display a circular symbol and an elevation label at the location of the problem point. 7RIL[WKHRWKHUSUREOHP 1. Click on the first error message (Undefined feature code 12). This highlights the points causing the problem in the upper list box. 2. Click on 6KRZORFDWLRQ to view the graphical location of the points. 3. Identify a view window. This centers the view window at the location of the first problem point. The correct feature code for these points is 21 which stands for a pathway. The surveyor accidentally typed in From 3RLQW menu, choose (GLWVHOHFWHG. This opens the (GLWVHYHUDOSRLQWV dialog which is used when you are modifying several selected points at the same time. 5. Set &RGH toggle on and modify the feature code to be Click OK. 7. Click 5HGUDZ to regenerate the survey drawing.
24 7XWRULDO The survey drawing should appear as shown below: The list of error messages should now be empty as you have fixed both of the problems.
25 7XWRULDO )L[LQJXQUHSRUWHGSUREOHPV The incoming survey data may contain problems which will not produce an error message. Typical examples of such problems include mistyped feature codes, incorrect dimensions or unterminated strings. You may already have noticed a very large tree in the lower left (Southwest) corner of the surveyed area. This is probably caused by an incorrect dimension. The incoming survey file provides trunk dimensions for all surveyed trees. Drawing rules has been set to display a tree cell scaled by the surveyed dimension. 7RIL[WKHWUHHGLPHQVLRQ 1. Zoom in to view the lower left corner of the surveyed area. 2. Make sure you can see the large tree symbol. 3. Click on )LQGE\ORFDWLRQ. 4. Enter a data click close to trunk center point. This should select point with index 114, survey code 82 and elevation in the list box. 5. From 3RLQW menu, choose (GLWVHOHFWHG. Alternatively, you can double click on the selected row in the list box. This opens the 6XUYH\SRLQW dialog: 6. Modify 'LPHQVLRQ field to be Click OK. 8. Click 5HGUDZ.
26 7XWRULDO This regenerates the survey drawing. The tree cell should now appear in a more sensible size. Another obvious problem is visible a little north from the tree. There seems to be an orange road edge line intersecting another road line. This should naturally never happen. A crazy line going across the survey drawing is often a result of a missing break point. When finished surveying one edge of a road, the surveyor has moved to another road edge without taking any other points in between. This causes TerraSurvey to assume that all the consecutive points with the same feature code belong to the same string. The picture below show the extra line segment marked by a cross. 7RLQVHUWDEUHDNSRLQW 1. Zoom in to view the left edge of the surveyed area. 2. Make sure you can see the extra line segment as shown in the picture above. 3. From 7RROV menu, choose %UHDNVWULQJ. As you move the mouse inside a view, TerraSurvey highlights the closest string segment. 4. Enter a data click close to the middle point on the extra line segment. This changes the color of the line segment and marks it with a red cross. A break point has been inserted between segment start and end point. 5. Click on 5HGUDZ to regenerate the survey drawing. The extra line segment has been removed from the survey drawing.
27 7XWRULDO &RQQHFWLQJEXLOGLQJFRUQHUV When surveying buildings using a total station, you can only see some of the corners from each station location. Therefore, it is impossible to survey all of the building corners as consecutive points. This results in buildings being displayed as a collection of unconnected line segments in the survey drawing. If you would like the buildings to appear as closed shapes, the are two ways to accomplish this: Use a string number out in the field. Assign the same string number to all the points in the same building and let the application join disjoint strings by string number. Survey without a string number. Build closed shapes by connecting building corners to each other using &RQQHFWVWULQJ command in the /RDGHGVXUYH\SRLQWV window. We will use the latter approach to construct a closed shape of the building in the upper part of the surveyed area. The picture below shows the building line segments in a very thick line weight. 7RFRQQHFWEXLOGLQJFRUQHUV 1. Zoom in to view the upper part (north) of the surveyed area. 2. Make sure you can see the building line segments as shown in the pictures above and below. 3. From 7RROV menu, choose &RQQHFWVWULQJ. 4. As you move the mouse inside a view, the application will find the closest string end point and display a circle around it. 5. Enter a data click close to the upper right (Northeast) corner of the building.
28 7XWRULDO This highlights the upper building line segment. As you move the mouse inside a view, a line is displayed extending from the identified corner point. 6. Enter a data click close to the lower right (Southeast) corner of the building. 7. Enter a reset to complete this string. The building corner points have been moved to the end of the point list. They are now four consecutive points. 8. Enter a second reset to abort the &RQQHFWVWULQJ tool. 9. Click 5HGUDZ. The survey drawing is regenerated and the building should now appear as a closed shape. The was no need to connect the points on left side of the building as the shape drawing rule can construct the closing line segment.
29 7XWRULDO :ULWLQJWKHYHULILHGVXUYH\GUDZLQJ The verification of the survey data is now complete and you are ready to write the survey drawing to the design file. 7RZULWHWKHVXUYH\GUDZLQJWRWKHGHVLJQILOH 1. Close the /RDGHGVXUYH\SRLQWV window by double clicking in the upper left corner. The application asks you if you want to write the survey drawing to the design file. 2. Click <HV. The /RDGHGVXUYH\SRLQWV window is closed and the survey drawing now appears as normal MicroStation design file elements. This completes the processing of the first example file.
30 7XWRULDO /RDGLQJERUHKROHORFDWLRQV TerraSurvey has builtin logic to support input and output of several total station related file formats. In addition to builtin formats, you can also define your own file formats. This ability makes TerraSurvey especially well suited for processing data coming from various sources. The next step in this tutorial demonstrates these capabilities by loading in a text file created by a spreadsheet application. The file contains the coordinates of planned borehole locations. 7RORDGERUHKROHORFDWLRQV 1. Select the /RDG6XUYH\9HULI\ tool. This opens a dialog box which allows you to select a single file to process. 2. Locate BOREHOLE.DAT file by browsing your computer s directory structure. If you installed TerraSurvey in the default directory C:\TERRA, you can find this file in path C:\TERRA\DATA\BOREHOLE.DAT. When you have located this file, select in the )LOHV list box and click OK. TerraSurvey tries to recognize the file format. If this fails, it will automatically open the )LOH IRUPDW window where you can define the format. This file is a text file with six rows in it. Each row represents a borehole location with point number, northing and easting fields separated by white space. 3. Select,QGH[ as the data in the first field. 4. Select 1RUWKLQJ as the data in the second field. 5. Select (DVWLQJ as the data in the third field. 6. Make sure other settings appear as in the picture above. 7. Click OK. The 6XUYH\ILOHLQIRUPDWLRQ dialog opens. 8. You can leave this information empty and just click OK. The /RDG6XUYH\9HULI\ dialog opens. 9. Click OK. TerraSurvey reads the selected file and opens the /RDGHGVXUYH\SRLQWV window.
31 7XWRULDO $VVLJQLQJFRGHVWRERUHKROHSRLQWV The loaded file did not contain any feature code information so TerraSurvey can not really create at this stage. The error list box in the Loaded survey points window displays one problem: Undefined feature code 6 Note also that all of the points are set to zero elevation as the incoming file did not include elevation data. In order to create a survey drawing, the points need to have feature code. 7RDVVLJQDIHDWXUHFRGH 1. Click on the error message in the lower list box. This selects all of the points in the upper list box. 2. From 3RLQW menu, choose (GLWVHOHFWHG. This opens the (GLWVHYHUDOSRLQWV dialog which is used when you are modifying several selected points at the same time. 3. Set &RGH toggle on and modify the feature code to be CPT. Feature codes in TerraSurvey can include any combination of letters and numbers upto fifteen characters in length. 4. Click OK. 5. Click 5HGUDZ to regenerate the survey drawing. The planned borehole locations are now marked with a red triangle shaped symbol.
32 7XWRULDO 0RGLI\LQJERUHKROHGUDZLQJUXOHV Zoom in to the lower left corner of the surveyed area where the boreholes are located. You can use 6KRZORFDWLRQ button to help you locate the boreholes. The borehole locations are marked by a red triangle shaped cell. In addition to the symbol, you may want to see the point numbers as well. To accomplish this, we will simply modify the drawing rules assigned to the CPT feature. 7RPRGLI\&37GUDZLQJUXOHV 1. Select the 'HILQH)HDWXUHV tool. This opens the )HDWXUHOLVW window. 2. Locate CPT feature in the upper list box by scrolling down the list. It should be the very last feature in the list. 3. Click on CPT feature in the feature list box. The lower list box now displays the drawing rules assigned to CPT feature. At the moment, it only has one drawing rule which places a cell at the point location. The cell is scaled so that it would be 4 mm in size when plotted on paper. 4. Click on $GG button next to the lower list box. The 'UDZLQJUXOH dialog box opens. 5. Select 7H[W drawing rule type in the 'UDZ field. 6. Select,QGH[ in the :ULWH field. 7. Type # character in the 3UHIL[ field. 8. Choose 3DSHUGLVWDQFH in the 2IIVHW field. 9. Type as the horizontal offset in the '[ field. 10. Choose red color in the &RORU field.
33 7XWRULDO 11. Make sure the settings appear as shown in the picture above. 12. Click OK to close the 'UDZLQJUXOH dialog. The text drawing rule is added to the list of drawing rules assigned to the CPT feature. 13. Close the )HDWXUHOLVW window. 14. Click 5HGUDZ in the /RDGHGVXUYH\SRLQWV window to regenerate the survey drawing. The planned borehole locations are now labeled with the point index. You can close the /RDGHGVXUYH\SRLQWV windows and write the survey drawing permanently to the design file.
34 7XWRULDO 2XWSXWWLQJSRLQWVWRDWH[WILOH In addition to reading in points from a text file TerraSurvey can output data to any coordinate based format it knows about. The borehole locations in our example design file can be listed to a total station file so that the total station can be used to measure out and to mark the planned locations. 7RRXWSXWERUHKROHORFDWLRQV 1. Select the /LVW6XUYH\ tool. This opens the /LVW6XUYH\ dialog: 2. Scroll down the list of features and click on the CPT feature at the end of the list. This deselects all other rows and selects the CPT feature. 3. Choose *HRGLPHWHU option in the )RUPDW field. 4. Choose 8VHRULJLQDO option in the 3RLQWLQGH[HV field. 5. Make sure settings appear as shown in the picture above. 6. Click OK. A standard dialog box for choosing an output file name opens. 7. Enter a name such as OUT.DAT for the output file. A file with the given name is created with the borehole locations in it. The file is in a format that can loaded into a Geodimeter total station. You can use Notepad or another editor to view the contents of the output file.
35 3DUW,,,7RRO5HIHUHQFH
36 *HQHUDO7RROV *HQHUDO7RROV *HQHUDOWRROER[ The tools in the *HQHUDO tool box are used to define user settings, to manage survey files, to define features, to control data sources and to access on-line help. 7R 8VH Change user settings 6HWWLQJV Define survey feature codes and drawing rules 'HILQH)HDWXUHV Define and display reference points 0DQDJH5HIHUHQFH3RLQWV Manage survey files 0DQDJH6XUYH\)LOHV View data sources of the survey drawing 9LHZ'DWD6RXUFHV View information about TerraSurvey $ERXW7HUUD6XUYH\ View on-line help +HOS2Q7HUUD6XUYH\
37 *HQHUDO7RROV 6HWWLQJV 6HWWLQJV tool lets you change a number of settings controling the way TerraSurvey works. Selecting this tool opens the 7HUUD6XUYH\VHWWLQJV window. Settings are grouped into logical categories. Selecting a category in the list causes the appropriate controls to be displayed to the right of the category list. $QJOHREVHUYDWLRQV$QJOHV\VWHPVFDWHJRU\ $QJOHV\VWHPV category in $QJOHREVHUYDWLRQV folder contains a list of angle systems which may be used in angle based survey files. A definition of an angle system consist of the orientation and the number of angle units in both vertical and horizontal directions. 6HWWLQJ Horizontal - Full circle Horizontal - Zero direction Horizontal - Increases Vertical - Full circle Vertical - Zero direction Vertical - Increases (IIHFW Number of units in a full horizontal circle. Default zero direction (north, east, south or west). Direction in which angles increase. Number of units in a full vertical circle. Default zero direction (up, horizontal, down). Direction in which angles increase.
38 *HQHUDO7RROV $QJOHREVHUYDWLRQV2EVHUYDWLRQFRUUHFWLRQVFDWHJRU\ 2EVHUYDWLRQFRUUHFWLRQV category in $QJOHREVHUYDWLRQV folder contains a list of user defined correction settings for processing angle based observations. The correction settings determine what corrections will be applied to observed distances and angles. $QJOHREVHUYDWLRQV3URFHVVLQJREVHUYDWLRQVFDWHJRU\ 3URFHVVLQJREVHUYDWLRQV category in $QJOHREVHUYDWLRQV folder determine how reference points and reference stations will be used when reading in a raw observation file. These settings essentially determine how automatically the application can recognize observations as reference observations and retrieve target coordinates. 6HWWLQJ (IIHFW Set - From a matching reference point If on, the application will try to find coordinates for a station from the active reference point list. It will compare the station number with reference point numbers to find a match. Interpret as reference point If on, observations with a given code will be interpreted as observations to a reference point. Interpret as reference station If on, observations with a given code will be interpreted as observations to a reference station. Search - From a matching station Some raw file formats contain information which indicates that an observation is a foresight or a backsight observation. If on, the application will try to match foresight/backsight observations with other loaded station locations. Search - From a matching reference If on, the application will try to match foresight/backsight point observations with reference point numbers.
39 *HQHUDO7RROV $QJOHREVHUYDWLRQV6FDOHIDFWRUIRUPXODVFDWHJRU\ 6FDOHIDFWRUIRUPXODV category in $QJOHREVHUYDWLRQV folder contains a list of mathematical formulas for computing scale factors. These scale factors can be used to scale observed distances when processing angle based observations. The mathematical formula may contain: P atmospheric pressure during observations (mmhg). T temperature during observations (Celsius). E project easting. N project mean northing coordinate. Z project mean elevation. Mathematical functions such as sin(a), cos(a), tan(a), exp(a), log(a), log10(a), pow(a,b), sqrt(a), ceil(a), fabs(a) and floor(a) where a and b are floating point values. You can input the actual pressure, temperature and project coordinate values when reading in observations with the 3URFHVV$QJOH2EVHUYDWLRQV tool. )LOHIRUPDWV%XLOWLQDQJOHFDWHJRU\ %XLOWLQDQJOH category in )LOHIRUPDWV folder contains a list of angle based file formats supported by builtin application logic. All of these formats are raw total station formats. TerraSurvey supports Geodimeter angle, Nikon angle, Sokkia angle, Wild angle GSI-8, Wild angle GSI-16 and Wild binary formats. You can only modify some settings relating to the survey information in these files. See chapter %XLOWLQ$QJOH)LOH)RUPDWV on page 100 for more information about these formats. )LOHIRUPDWV%XLOWLQ[\]FDWHJRU\ %XLOWLQ[\] category in )LOHIRUPDWV folder contains a list of file formats supported by builtin application logic. Some of the file formats are total station related, some are general survey data transfer formats. TerraSurvey supports Geodimeter, Moss genio, SDRmap, Sokkia, Wild xyz GSI-8, Wild xyz GSI-16, MTM, Binary database, KF85 and David file formats. You can not delete the builtin file formats. You can only modify some settings relating to the survey information in these files. See chapter %XLOWLQ;\])LOH)RUPDWV on page 102 for more information about these formats. )LOHIRUPDWV8VHUDQJOHFDWHJRU\ 8VHUDQJOH category in )LOHIRUPDWV folder contains a list of angle file formats which have been defined by the user. You can extend this list by adding definitions for new file types. A file format definition can be created for practically any file format which is organized so that one row in the file contains the fields of one angle based observation. See chapter 8VHU'HILQHG)LOH)RUPDWV on page 98 for more information. )LOHIRUPDWV8VHU[\]FDWHJRU\ 8VHU[\] category in )LOHIRUPDWV folder contains a list of xyz file formats which have been defined by the user. You can extend this list by adding definitions for new file types. A file format definition can be created for practically any file format which is organized so that one row in the file contains the fields of one survey point. See chapter 8VHU'HILQHG)LOH)RUPDWV on page 98 for more information.
40 *HQHUDO7RROV &RQWRXUVFDWHJRU\ &RQWRXUV category defines the font and size of contour labels. 6HWWLQJ Font Size (IIHFW Font for contour elevation labels. Size of labels as millimeters on paper. 'UDZ3RLQW7DEOHFDWHJRU\ 'UDZ3RLQW7DEOH category defines title texts and symbology for point tables. 6HWWLQJ Column titles Row count NE order (IIHFW Title labels for columns in the point table. Maximum row count in one point table. If the number of valid points exceeds this count, the application will split the points in more than one table. Defines if northing or easting coordinate should appear first. (OHPHQWFUHDWLRQFDWHJRU\ (OHPHQWFUHDWLRQ category defines element attributes and settings used when writing survey drawing elements to the design file. 6HWWLQJ Add attribute for TerraInspector Create as view independent Nonsnappable (if origin moved) (IIHFW If on, TerraSurvey will add an extra attribute in survey elements. From this attribute TerraInspector will find a description for that feature. If on, text elements will be created as view independent. This type of text elements will always face the viewer regardless of view rotation. If on, text elements will be created as nonsnappable in case the text element s origin point is not the same as the survey point. (OHPHQWXVDJHFDWHJRU\ (OHPHQWXVDJH category defines how design file elements are converted into points. 6HWWLQJ Radius (IIHFW Circles smaller than 5DGLXV are interpreted as a single point (circle center). Larger circles are stroked into several points along the circumference.
41 *HQHUDO7RROV *HRPHWU\FRGLQJFDWHJRU\ *HRPHWU\FRGLQJ category lets you define how geometry is coded in each file format that you read in. One geometry coding definition determines how line, arc and curve geometry types are coded in a specific file format. 6HWWLQJ Format type File format Geometry appended to survey code Line Arc Curve Start End (IIHFW Whether the definition applies to a xyz or an angle based file format. File format to which this definition applies. If on, geometry codes are appended to feature codes. When reading in the survey file, the application will try to split survey codes into feature code and geometry code parts. Line geometry code. Arc geometry code. Curve geometry code. Code for starting a new string. Code for ending a string. /HYHOLQJ3RLQWVFDWHJRU\ /HYHOLQJSRLQWV category defines the format of elevation labels the application will create. 6HWWLQJ Accuracy Display plus Display minus (IIHFW Number of decimals to display in elevation values. If on, positive elevation values will display a plus sign. If on, negative elevation values will display a plus sign. /LVW6XUYH\FDWHJRU\ /LVW6XUYH\ category defines what kind of element feature attributes /LVW6XUYH\ tool will search for when scanning the design file for elements to output. 6HWWLQJ Created by old TerraSurvey Created by PRO600 Created by Geogrpahics Created by MGE (IIHFW If on, search for elements created by an older version of TerraSurvey which used a different attribute structure. If on, search for elements created by Leica s PRO600 application and use feature codes stored in the elements. If on, search for elements created by Geographics and use the feature codes stored in the elements. If on, search for elements created by MGE and use the feature codes stored in the elements.
42 *HQHUDO7RROV /RDG6XUYH\$XWRPDWLFFDWHJRU\ /RDG6XUYH\$XWRPDWLF category defines how /RDG6XUYH\$XWRPDWLF tool reports problems and errors when reading in files and generating a survey drawing. 6HWWLQJ (IIHFW Write error log to file If on, error messages will be written to a text file. File name How to derive a file name for the error log: Variable TSURVEY_LOGFILE - environment variable defines the full path and name of the log file Derive from design file - add extension err to the design file name (d:\dgn\pasila\pasila.err) Derive from data file - add extension err to the data file name (c:\terra\data\surv4039.err) Drawing errors How to report errors related to feature coding and drawing rules: Log only once - do not report the same error twice Log each occurrence - generate an error message with a row number for each occurrence Data error How to report errors originating from survey data. See above. No drawing rule for feature xxx If on, the tool will not generate an error message from a feature code which has no graphical presentation. /RDG6XUYH\9HULI\FDWHJRU\ /RDG6XUYH\9HULI\ category defines whether the application should suggest saving modified points to a text file when closing the /RDGHGVXUYH\SRLQWV window. 6HWWLQJ Prompt for output when closing (IIHFW If on and loaded points have been modified but not saved, the application suggest saving the points to a text file. /RDGHGSRLQWVFDWHJRU\ /RDGHGSRLQWV category defines the symbology for highlighting points and for marking changes when working with loaded points. 6HWWLQJVJURXS Point selection group Modified point group Modified segment group Broken segment group (IIHFW Color and line weight for a circle marking a selected point. These settings will be used when you use either 6KRZORFDWLRQ or,ghqwli\ features. Size, color and line weight for a circle marking a point which has been modified using $VVLJQSRLQWV feature. Color, style and weight for lines indicating modified segments. These will be drawn between consecutive points in a string constructed by &RQQHFWVWULQJ feature. Size, color and weight for a cross indicating a broken string segment. This setting is used by %UHDNVWULQJ feature.
43 *HQHUDO7RROV 0HDVXUH/HQJWKFDWHJRU\ 0HDVXUH/HQJWK category defines the format in which 0HDVXUH/HQJWK will create labels. 6HWWLQJ Font Size Length prefix Angle prefix Radius prefix (IIHFW Font for measurement labels. Text size. Given in millimeters on paper. Text that will be placed as a prefix for a line length label. Text that will be placed as a prefix for a direction angle label. Text that will be placed as a prefix for an arc radius label. 2SHUDWLRQFDWHJRU\ 2SHUDWLRQ category defines what menus will be opened during application startup and how the application can be unloaded. 6HWWLQJ Create Applications Menu Open Main tool box Main tool box is closed (IIHFW If on, TerraSurvey will create an $SSOLFDWLRQV menu in MicroStation s command window at startup. This menu will contain items for opening TerraSurvey toolboxes. If on, the application will open its 0DLQ tool box at startup. If on, the application will be unloaded when 0DLQ tool box is closed. 5HIHUHQFHSRLQWFODVVHVFDWHJRU\ 5HIHUHQFHSRLQWFODVVHV category contains a list of class definitions for known points. Each class can have its default symbology.
44 *HQHUDO7RROV 7UDQVIRUPDWLRQVFDWHJRU\ 7UDQVIRUPDWLRQV category contains a list of coordinate transformations which are used to convert survey file coordinates into design file coordinates. Transformations can be used with /RDG 6XUYH\9HULI\, /RDG6XUYH\$XWRPDWLF, /LVW6XUYH\ and /LVW(OHPHQWV tools. TerraSurvey supports three types of coordinate transformations: Linear - you can assign a coefficient and a constant offset for each coordinate axis. Computes a design file coordinate by multiplying the survey file coordinate with the given coefficient and by adding a given constant value. Equation - you can enter mathematical equations for calculating the coordinates. Known points - you can specify the coordinates of two known points in the survey coordinate system and their respective coordinates in the design file. /LQHDUWUDQVIRUPDWLRQ 6HWWLQJ Multiply by - X Multiply by - Y Multiply by - Z Add constant - X Add constant - Y Add constant - Z (TXDWLRQWUDQVIRUPDWLRQ 6HWWLQJ X Y Z (IIHFW Coefficient for multiplying easting. Coefficient for multiplying northing. Coefficient for multiplying elevation. Value to add to easting. Value to add to northing. Value to add to elevation. (IIHFW Equation for calculating X coordinate. The mathematical equation may contain: Sx - survey file X coordinate. Sy - survey file Y coordinate. Sz - survey file Z coordinate. Mathematical functions such as sin(a), cos(a), tan(a), exp(a), log(a), log10(a), pow(a,b), sqrt(a), ceil(a), fabs(a) and floor(a) where a and b are floating point values. Equation for calculating Y coordinate. Equation for calculating Z coordinate..qrzqsrlqwvwudqvirupdwlrq 6HWWLQJ (IIHFW Survey X, Y, Z First known point in the survey coordinate system. X, Y, Z Second known point in the survey coordinate system. Design X, Y, Z First known point in the design file coordinate system. X, Y, Z Second known point in the design file coordinate system.
45 *HQHUDO7RROV 'HILQH)HDWXUHV 'HILQH)HDWXUHV tool opens a window for managing feature codes and their drawing rules. Feature coding is a method for identifying surveyed objects. Each survey point is assigned a feature code which defines what was surveyed - a tree, a road center line, an elevation point or may be a manhole cover. The graphical appearance of a feature is defined by drawing rules. Normally each feature code is assigned one or more drawing rules. There is no limitation on how many drawing rules you can assign to a feature. When processing survey information, TerraSurvey tries to find a matching feature code for each of the survey points. If a match is found, the application goes through all drawing rules assigned for that feature. The actual graphical presentation is created by combining the survey point information with the settings in drawing rules. You should create at least one feature list of your own. This feature list should include all feature codes used by the survey team in your organization. In the long run, you will probably want to create several feature lists for different purposes. You may need to create a separate feature list for processing surveys done by an outside surveying company because they will probably use a different set of feature codes. You may also want to have different feature lists for creating different types of survey drawing for specific tasks. Feature lists are stored as text files. Only one feature list can be active at a time. 7RYLHZWKHDFWLYHIHDWXUHOLVW 1. Select the 'HILQH)HDWXUHV tool. The )HDWXUHOLVW window opens: The upper list box contains a list of all features in the active feature list. The lower list box displays all drawing rules assigned to the currently selected feature. When you select another row in the feature list box, the contents of the lower list will change.
46 *HQHUDO7RROV 7RDGGDQHZIHDWXUH 1. Click the $GG button. The )HDWXUHFRGH dialog box opens: 2. Enter settings values and click OK. The feature is added to the active feature list. You will now probably want to assign drawing rules to the new feature. 6HWWLQJ (IIHFW Survey code Unique feature code. An alphanumeric text string upto 15 characters in length. Description An optional description. Point type If on, the feature code applies only to single points or to points in a chain. This setting should be used only if your survey files contain chain information and you want to use the same feature code for two types of features: single and chain. Survey surface If on, the feature code applies only to survey points belonging to selected surface. This setting should be used only if your survey files contain surface information and you want to use the same feature code for features on different surfaces. Create How to combine elements from multiple drawing rules: Single elements - individual elements are not linked. Graphical group - link elements to each other as a graphical group. Use points How to use points when creating surface models. For surfaces Surface types for which to accept the points. For example: 0 - use for surface type 0. 0,2-4 - use for surface types 0, 2, 3 and 4.
47 *HQHUDO7RROV *HQHUDOSURFHGXUHIRUDGGLQJGUDZLQJUXOHVWRDIHDWXUH 1. Select the desired feature in upper list box. 2. Click the $GG button on the side of the lower list box. The 'UDZLQJUXOH dialog box opens. 3. Choose the drawing rule type and fill in settings values. 4. Click OK. The new drawing rule is added to the lower list box which displays all rules assigned for the selected feature. See chapter 'UDZLQJ5XOH6HWWLQJV on page 88 for more information about drawing rules. )HDWXUHOLVWILOHV Feature lists are stored as text files which have a default extension ".fea". The )LOH menu in the )HDWXUHOLVW window has commands for opening existing feature list files and for saving the active feature list into a file. á When you start TerraSurvey, it automatically loads the feature list which was used during the last working session. You can use a text editor to edit feature list files. This may prove useful if need to copy features and drawing rules from one feature list to another. 3ULQWLQJDOLVWRIIHDWXUHV When you modify your feature list, you will naturally have to keep your surveying team informed about the changes. The easiest way is to print out the current feature list and hand it to the surveyors. 7RSULQWDOLVWRIIHDWXUHV 1. From the &UHDWH menu, choose /LVWLQJ. &UHDWHIHDWXUHOLVWLQJ dialog box opens. 2. Enter a name for the output file 3. Click OK. The feature codes and descriptions are written to a file with the given name. You should use a text editor or the operating system to output the text file to a printer.
48 *HQHUDO7RROV *HQHUDWLQJOHYHOQDPHVIURPIHDWXUHV Each element in a design file is on one of 63 drawing levels which provide a basic method for organizing your work. By switching levels on or off, you can control which levels are visible in a view window and what elements you will manipulate. In order to make your work easier, you should carefully plan how to organize your level usage and assign consistent levels for the drawing rules in your feature list. Instead of refering to levels by number only, you can assign more a descriptive name for each level. A level name should indicate what type of graphical information is stored on that level. For a survey drawing, the level names can be created automatically from the )HDWXUHOLVW window. 7RJHQHUDWHOHYHOQDPHVIURPIHDWXUHV 1. From the &UHDWH menu, choose /HYHOQDPHV. The /HYHOQDPHVIURPIHDWXUHV dialog box opens: 2. Enter settings values and click OK. Level names are created from the feature descriptions in the current feature list. 6HWWLQJ Group Delete existing names (IIHFW Level group in which to create the level names. If on, delete existing level names first. If off, add new names to existing level names.
49 *HQHUDO7RROV 0DQDJH5HIHUHQFH3RLQWV 0DQDJH5HIHUHQFH3RLQWV tool opens a window for managing reference points. These are known points which can be used when setting up a station location in the field. 7RYLHZWKHDFWLYHUHIHUHQFHSRLQWV 1. Select the 0DQDJH5HIHUHQFH3RLQWV tool. The 5HIHUHQFHSRLQWV window opens: The list box contains a list of all the known points in the active reference point file. 7RDGGDQHZUHIHUHQFHSRLQW 1. Click the $GG button. The 5HIHUHQFHSRLQW dialog box opens: 2. Enter a unique identifier for the point in the 1XPEHU field. 3. Enter coordinates for the point. 4. Click OK. The point is added to the active reference point list. 5HIHUHQFHSRLQWILOHV Reference points are stored in binary files which have a default extension ".rpo". If you want to, you can divide your known points to several files based on geographical location or usage. There is no practical limit on how many reference points one file can contain. The file menu in the 5HIHUHQFHSRLQWV window has commands for opening existing reference point list files and for saving the active list into a file. When you start TerraSurvey, it automatically loads the reference points which were used during the last working session.
50 *HQHUDO7RROV,PSRUWLQJUHIHUHQFHSRLQWVIURPWH[WILOHV You can read in reference points from any xyz file format that TerraSurvey can understand. In addition to builtin formats, this also includes user defined file formats. 7RLPSRUWUHIHUHQFHSRLQWV 1. Select,PSRUW command from )LOH menu. This opens a dialog which allows you to select one file to read in. 2. Select the desired file and click OK. 3. (Optional) If TerraSurvey does not recognize the file format, it opens a dialog for defining the file format. The application reads the file and adds extracted points into the active list of reference points. 'UDZLQJUHIHUHQFHSRLQWV Reference points can be drawn into the design file. The drawing method can be: Active feature list You have defined drawing rules in the feature list. Each reference point class should have a feature definition where the survey code of the feature matches the,' or the $EEUHYLDWLRQ of the reference point class. This method allows you to define exactly what kind of elements will be created. Builtin drawing rules Application draws each reference point class using its unique symbology. All reference points will be drawn with a zero length line, a circle and a number label. 7RGUDZUHIHUHQFHSRLQWVLQWRWKHGHVLJQILOH 1. Select 'UDZSRLQWV command from )LOH menu. This opens the 'UDZUHIHUHQFHSRLQWV dialog: 2. Choose drawing method and click OK. This draws all active reference points into the design file.
51 *HQHUDO7RROV 0DQDJH6XUYH\)LOHV 1RWÃ)LHOG 0DQDJH6XUYH\)LOHV tool opens a window displaying a list of all the survey files which have once been loaded by TerraSurvey. The list displays file names together with descriptions and site names you have entered for each survey file. You can use this window to locate a survey file you have once processed, to modify survey file information or to create a survey drawing from a particular survey file.
52 *HQHUDO7RROV 9LHZ'DWD6RXUFHV 1RWÃ)LHOG 9LHZ'DWD6RXUFHV tool lets you view survey elements by the data sources from which they have originated from. For TerraSurvey, a data source is analogous to a survey file drawn into the design file. A survey drawing is often a combination of data from various sources which may differ by their accuracy, reliability or creation date. For example, you may combine an aerial photograph survey together with a recent and an older total station survey. 9LHZ'DWD6RXUFHV tool lets you assign override symbology for a data source and thus make it easy to see which elements originate from a specific data source. For example, you could assign a red override color to the older total station survey to see where it overlaps the recent, more reliable surveys. 7RDVVLJQRYHUULGHV\PERORJ\IRUDGDWDVRXUFH 1. Select the 9LHZ'DWD6RXUFHV tool. The 9LHZ'DWD6RXUFHV window opens display a list of data sources drawn into the active design file. The other fields in the dialog box display the current settings for the data source which is selected in the list box. 2. Select a data source in the list. 3. Set &RORU, :HLJKW or 6W\OH override locks on and adjust the desired symbology controls. 4. Click $SSO\. All open view windows are updated. The selected data source is now drawn using the assigned override symbology settings. 6HWWLQJ Locked Color Style Weight (IIHFW If on, modification of data source elements is disabled. If on, display data source elements using a specific color. If on, display data source elements using a specific style. If on, display data source elements using a specific weight.
53 *HQHUDO7RROV /RFNLQJDGDWDVRXUFH Normally you can make modifications to any of the elements in the active design file. However, it is possible to mark elements as locked which means that modification tools will not affect those elements. 9LHZ'DWD6RXUFHV tool makes it possible to lock all elements originating from selected data sources. 7RPRGLI\HOHPHQWVIURPVHOHFWHGGDWDVRXUFHV 1. Select the 9LHZ'DWD6RXUFHV tool. The 9LHZ'DWD6RXUFHV window opens. 2. Select a data source which you want to leave unchanged. 3. Lock the data source by setting /RFNHG on. Repeat steps 2 and 3 for each data source you want to keep unchanged. 4. Click $SSO\. TerraSurvey scans the design file and locks all elements originating from the locked data sources. You can now use tools such as 'HOHWH)HQFH&RQWHQWV or +LGH2YHUODSSLQJ7H[WV to manipulate elements from the unlocked sources only. 'HOHWLQJDGDWDVRXUFH 9LHZ'DWD6RXUFHV tool lets you delete a data source and destroy all elements originating from that data source. 7RGHOHWHDE\GDWDVRXUFH 1. Select the 9LHZ'DWD6RXUFHV tool. The 9LHZ'DWD6RXUFHV window opens. 2. Select a data source. 3. From the 6RXUFH menu, choose 'HOHWH.
54 *HQHUDO7RROV $ERXW7HUUD6XUYH\ $ERXW7HUUD6XUYH\ tool opens a window which shows information on TerraSurvey and on user license. +HOS2Q7HUUD6XUYH\ +HOS2Q7HUUD6XUYH\ tool launches Acrobat Reader for accessing on-line help. The on-line help is identical in structure to the printed documentation. The on-line version has hypertext links built in, so you can jump between topics by clicking on the underlined topic names.? Floppy based installation does not include on-line documentation. You can access on-line help only if you have installed from CD. Accessing on-line help also requires that you have Acrobat Reader installed on your computer.
55 6XUYH\7RROV 6XUYH\7RROV 6XUYH\WRROER[ The tools in the 6XUYH\ tool box are used to load survey files, to draw a point table from survey points and to create text file listings from the design file. 7R 8VH Process angle observations into coordinates 3URFHVV$QJOH2EVHUYDWLRQV Load single survey file in verify mode /RDG6XUYH\9HULI\ Load survey files in automatic mode /RDG6XUYH\$XWRPDWLF Draw survey point as a table 'UDZ3RLQW7DEOH List survey elements into a survey file /LVW6XUYH\ List graphical elements into a survey file /LVW(OHPHQWV Export survey elements to Geographics or MGE ([SRUWWR*,6 Generate contours from survey points *HQHUDWH&RQWRXUV
56 6XUYH\7RROV 3URFHVV$QJOH2EVHUYDWLRQV 3URFHVV$QJOH2EVHUYDWLRQV tool computes coordinates from angle based observation data. You can load in one or several raw angle based survey files in order to solve station locations and compute coordinates for surveyed points. *HQHUDOSURFHGXUHIRUSURFHVVLQJDQJOHREVHUYDWLRQV 1. Select the 3URFHVV$QJOH2EVHUYDWLRQV tool. The 3URFHVV$QJOH2EVHUYDWLRQV window opes. 2. (Optional) Select 6HWWLQJV command from )LOH pulldown menu and verify that the active angle system and observation corrections are correct. 3. Select /RDG command from )LOH pulldown menu to load a raw angle based survey file. This opens a dialog box which allows you to select a single file to process. 4. Select the desired file and click OK. Application reads the file and displays stations in the upper list and observations in the lower list. A typical survey file contains a number of stations and a number of observations from each station location. In order to compute coordinates for the stations, the application needs to know which observations were made to known reference points or to other station locations. Depending on user settings and the incoming file format, TerraSurvey may be able to automatically interpret some of the reference observations. 5. Fill in information about stations and reference observations until the application can compute station locations. 6. (Optional) Select 2XWSXWFRRUGLQDWHV command from )LOH pulldown menu to output computed coordinates for survey points into a file. 7. (Optional) Select 3URFHVVFRRUGLQDWHV command from )LOH pulldown menu to create a survey drawing from survey points.
57 6XUYH\7RROV 6WDWLRQV The upper list in the 3URFHVV$QJOH2EVHUYDWLRQV window displays a list of stations. Each station has a station number which serves as a unique alphanumeric identifier for that location. If two station setups share the same number, the application assumes they have the exact same xyz location. During processing the locational status of a station can be any of: Location undefined - the location is unknown. Location known - user has assigned coordinates for the station or it has been automatically matched as being at a known point (from reference point list). Location computed - application has computed the location from reference observation(s). Oriented - location and orientation has been solved. In addition to knowing the coordinates, the application also knows the true direction of observed angles. Adjusted - location and orientation has been solved. Furthermore, the station position has been adjusted using a traverse adjustment routine. When the status is 2ULHQWHG or $GMXVWHG, TerraSurvey can compute coordinates for the survey observations. 2EVHUYDWLRQV The lower list in the 3URFHVV$QJOH2EVHUYDWLRQV window displays a list of observations made from the station selected in the upper list. Observations fall into five classes: Survey point - a point which will be drawn in the survey drawing. Reference point - an observation to a known reference point. This observation will be used when to solve station location. Reference station - an observation to another station location. This observation will be used to solve either one of the station locations. Control point - an observation to a reference point. This type observation is effectively ignored. Control station - an observation to another station. This type of observation is effectively ignored.
58 6XUYH\7RROV /RDG6XUYH\9HULI\ /RDG6XUYH\9HULI\ tool loads a single survey file for verification and survey drawing creation. It reads in the file and displays the loaded points in a window together with a list of errors encountered. You can verify the data, fix errors or modify drawing rules all while viewing the survey drawing in a temporary mode. When you are completely satisfied with the resulting survey drawing, you can draw it permanently by closing the verification window. 7RORDGDVXUYH\ILOHIRUYHULILFDWLRQ 1. Select the /RDG6XUYH\9HULI\ tool. This opens a dialog box which allows you to select a single file to process. 2. Select the desired file and click OK. 3. (Optional) If TerraSurvey does not recognize the file format, it opens a dialog for defining the file format. The 6XUYH\ILOHLQIRUPDWLRQ dialog opens. 4. Fill in the survey file information and click OK. The /RDG6XUYH\9HULI\ dialog opens. The coordinate axes show the coordinate values of the first point found in the survey file. 5. Enter settings values for drawing creation and click OK. TerraSurvey processes the file for a while loading survey points into memory. When done, it creates a survey drawing in temporary mode and opens the /RDGHG6XUYH\3RLQWV window which lets you verify the loaded survey data. 6HWWLQJ Scale Rotation angle Max distance Format Display file rows Transform (IIHFW Intended plotting scale affects the size of text elements and cells. Rotation angle of the survey drawing. Affects the orientation of text elements. If a survey point is more than 0D[GLVWDQFH away from all the previous points, it will be rejected as an error. How to interpret the file. You can choose from all formats that match file to load. If on, display rows in the status bar while reading in the file. The process will be faster when this setting is off. Coordinate transformation for converting survey coordinates into design file coordinates.
59 6XUYH\7RROV 9LHZLQJORDGHGSRLQWV Whenever you load a survey file using the /RDG6XUYH\9HULI\ tool, it first displays the loaded points in the /RDGHGVXUYH\SRLQWV window. While this window is open, the survey drawing is visible as temporary elements which you can redraw whenever you have made modifications to the survey data. When you close the window, the applications asks you if youy want to draw the survey drawing permanently into the design file. The upper list box displays all the survey points extracted from the survey file. The lower list box shows all errors encountered when drawing the survey points. The /RDGHGVXUYH\SRLQWV window offers several tools for reviewing survey points and related error messages: 7R $FWLRQ Choose what fields are visible in the list Choose )LHOGV form the 9LHZ menu View the location of selected survey points Click 6KRZORFDWLRQ and move the mouse in a view Select a survey point by entering a location Click,GHQWLI\ and enter location data point Redraw survey drawing after modifications Click 5HGUDZ Check what points caused an error Select the error row. This will select all points which caused the selected error.
60 6XUYH\7RROV )L[LQJHUURUVLQVXUYH\GDWD The /RDGHGVXUYH\SRLQWV window offers several methods for verifying and fixing survey data before generating a permanent survey drawing. You can fix problems by doing any of the following: Fill in missing information. For example, you can assign feature codes to uncoded survey points. Delete erroneous points. Modify survey point information such as coordinate values or dimension. Create a new feature in the active feature list if you encounter a new feature code. Change the graphical presentation of a feature by modifying the drawing rules in the feature list. Attach another cell library if correct cells are not found. Find and fix intersecting breaklines using the )LQG,QWHUVHFWLQJ%UHDNOLQHV tool. Whenever you make modifications which affect the survey drawing, you should click 5HGUDZ to recreate the survey drawing and the error list in the lower list box. 7RPRGLI\DVLQJOHVXUYH\SRLQW 1. Select the point you want to modify in the upper list box. 2. From the 3RLQW menu, choose (GLW. The 6XUYH\SRLQW dialog opens: 3. Modify the desired field values and click OK. The new values are stored. 7RPRGLI\VHYHUDOVXUYH\SRLQWVDVRQHRSHUDWLRQ 1. Select all those points in the upper list box which you want to modify. 2. From the 3RLQW menu, choose (GLW. The (GLWVHYHUDOSRLQWV dialog opens. The toggle buttons let you select what information fields will be modified.
61 6XUYH\7RROV 3. Set on the toggle for the fields you want to modify. 4. Key in the new values for the fields and click OK. This modifies the given fields in all selected survey points. 'LVSOD\LQJVXUYH\SRLQWV TerraSurvey generates a survey drawing which displays the survey points using feature list based drawing rules. While the /RDGHGVXUYH\SRLQWV window is open, you can display additional information about the survey points without the need to define drawing rules for each feature. 7RGLVSOD\VXUYH\SRLQWLQIRUPDWLRQ 1. From the 9LHZ menu, choose 'LVSOD\VHWWLQJV. The /RDGHGSRLQWGLVSOD\ settings dialog opens: 2. Select desired display options and click OK. Selected information is displayed for the loaded survey points. 6HWWLQJ Error free points Error points Diameter Index Elevation Error message (IIHFW If on, a circle will be drawn at each error free point. If on, all the points causing an error will be indicated a circle. Diameter of display circle. If on, each point will display its index above the point. If on, each point will display its elevation next to the point. If on, each point will display the error message generated from it below the point location.
62 6XUYH\7RROV 6WRULQJYHULILHGVXUYH\SRLQWV After fixing errors in the survey data, you may want to save the verified list of survey points into a separate file. 7RVWRUHYHULILHGVXUYH\SRLQWV 1. From the )LOH menu, choose /LVWSRLQWV. The /LVW/RDGHG3RLQWV dialog opens: 2. (Optional) Select the features you want to output. All features are selected by default. 3. Choose an output format and a subtype in the )RUPDW and 7\SH fields. 4. (Optional) Choose a coordinate transformation if you want the output file to use a coordinate system different from the active design file. 5. Click OK. This opens a dialog box which allows you to enter a name for the file to create. 6. Key in a name for the output file and click OK. The verified points are written to the output file.
63 6XUYH\7RROV /RDG6XUYH\$XWRPDWLF /RDG6XUYH\$XWRPDWLF tool processes one or several survey files in batch mode. It loads the survey files and creates a survey drawing automatically. This tool will recognize the file format of the selected files automatically and apply appropriate logic when interpreting the information. The files have to match one of the builtin of user defined file formats. 7RORDGVXUYH\ILOHVDXWRPDWLFDOO\ 1. Select the /RDG6XUYH\$XWRPDWLF tool. This opens a dialog box which allows you to select one or several files to process. 2. Add the desired file(s) to the list of files to process and click 'RQH. 3. (Optional) If the first selected file has never been processed by TerraSurvey, it will open the 6XUYH\ILOHLQIRUPDWLRQ dialog. Fill in the survey file information and click OK. The /RDG6XUYH\$XWRPDWLF dialog opens. The coordinate axes show the coordinate values of the first point found in the survey file. 4. Enter settings values for drawing creation and click OK. TerraSurvey will process each selected survey and create a survey drawing. If any errors are encountered, an error log window will open displaying all error and warning messages. 6HWWLQJ Scale Rotation angle Max distance Display file rows Transform (IIHFW Intended plotting scale affects the size of text elements and cells. Rotation angle of the survey drawing. Affects the orientation of text elements. If a survey point is more than 0D[GLVWDQFH away from all the previous points, it will be rejected as an error. If on, display rows in the status bar while reading in the file. The process will be faster when this setting is off. Coordinate transformation for converting survey coordinates into design file coordinates. (UURUORJ /RDG6XUYH\$XWRPDWLF tool creates an error log if it encounters any problems in the survey data. This log will always display in an on screen window. Optionally may be written into a text file as well. You can control the error log creation with user settings. See /RDG6XUYH\$XWRPDWLF FDWHJRU\ on page 42 for more information.
64 6XUYH\7RROV :KLFK/RDG6XUYH\WRROWRXVH /RDG6XUYH\9HULI\ and /RDG6XUYH\$XWRPDWLF tools accomplish essentially the same task. Both tools read in survey files and create a drawing based on the loaded survey points. However, there are a lot of differences in the way these two tools work. /RDG6XUYH\9HULI\ tool lets you: Select only one file at a time. Define the file format, if the format is not recognized. Select the correct file format, if there are several formats that match the file. Verify and fix errors. Fill in missing information in the survey data. Modify survey file information even if the file has been loaded before. It is a good idea to use the /RDG6XUYH\9HULI\ tool whenever you load a survey file for the first time. /RDG6XUYH\$XWRPDWLF tool can be used later on when you have already verified the survey data. This automatic tool: Lets you select several files to process. Interprets the file(s) using the first matching format. Creates an error log but offers no tools for fixing errors.
65 6XUYH\7RROV 'UDZ3RLQW7DEOH 'UDZ3RLQW7DEOH tool draws a tabular listing of survey points in the design file. It extracts survey point information from the survey elements and creates a table of points with selected feature codes. The point table will be drawn as a cell or as a group of cells. This tool works with both permanent survey drawing elements and temporary elements created by /RDG6XUYH\9HULI\. 7RGUDZDSRLQWWDEOH 1. Select the 'UDZ3RLQW7DEOH tool. TerraSurvey scans the design file to create a list of feature codes used in the survey drawing and opens the 3RLQWWDEOH dialog box: 2. Select the feature codes you want to include in the table. 3. Fill in settings values and click OK. 4. Enter a data point to position the cell or the group of cells. 6HWWLQJ Sort by Decimals (IIHFW Sort order of points: File - keep the same order as in which the survey points were drawn. Index - sort by survey index. Code - sort by feature code. Number of decimals for coordinates and elevation values.
66 6XUYH\7RROV /LVW6XUYH\ /LVW6XUYH\ tool produces a text file listing from the survey drawing. The output file format can be any of the builtin or the user-defined survey file formats which contain coordinates of the survey points. You can choose to output all the survey points or filter the points by the feature code. This tool creates the listing from the vertices of survey elements which are elements created by the /RDG6XUYH\9HULI\, /RDG6XUYH\$XWRPDWLF or 'UDZ$V)HDWXUH tools. In a sense, the /LVW6XUYH\ does the opposite for the process carried out by the /RDG6XUYH\9HULI\ and the /RDG6XUYH\$XWRPDWLF tools. You can combine these tools into a workflow such as: 1. Load survey data using the /RDG6XUYH\9HULI\ tool. 2. Validate the data and make initial corrections in the /RDGHGSRLQWV window before writing the survey drawing permanently to the design file. 3. Use MicroStation s tools to make further corrections in the survey drawing. For example, you may want to delete unnecessary elements, move vertices or join elements into complex chains. 4. Output the corrected survey data into a text file using the /LVW6XUYH\ tool. You may choose the output file format to be different from the original input format. 7ROLVWVXUYH\SRLQWVLQWRDWH[WILOH 1. Select the/lvw6xuyh\ tool. TerraSurvey scans the design file to create a list of feature codes used in the survey drawing and opens the /LVW6XUYH\ dialog box: 2. If you want to include all features in the list, click 6HOHFWDOO to select all features in the list. If you want to output only some of the features, select those features in the list. The easiest way to select individual features is to click on the row of each feature while holding down the <Ctrl> key. 3. Click OK to close the dialog. A standard dialog box for choosing an output file name opens. 4. Enter a name for the output file.
67 6XUYH\7RROV A file with the given name is created and the selected features are written to that file. 6HWWLQJ Format Point indexes First Transformation Fence contents Filter by data source (IIHFW Output file format. You can select from any of the coordinate based builtin or user defined file formats. How to output point indexes. You can choose to use the original survey point indexes or to generate new incrementing point indexes. Index for the first output point when regenerating point indexes. Coordinate transformation to apply to survey points. If on, output only points within fence contents. If on, you can use 6HOHFW to select which data sources to include in the output.
68 6XUYH\7RROV /LVW(OHPHQWV 1RWÃ)LHOG /LVW(OHPHQWV tool produces a text file listing from graphical design file elements. The output file format can be any of the builtin or the user-defined survey file formats which contain coordinates of the survey points. This tool creates the listing from the vertices of graphical elements filtered by level and element type. The elements may have been created by another application or by manual drawing. *HQHUDOSURFHGXUHIRUOLVWLQJHOHPHQWVLQWRDWH[WILOH 1. Select the /LVW(OHPHQWV tool. The /LVWHOHPHQWV window opens. 2. Select )LOHIRUPDW for the output file. 3. Create a rule list for elements to include in the listing. Alternatively, you can load a previously saved set of rules from a disk file. 4. Click 2XWSXW and choose a name for the output text file. Each listing rule defines one element type residing on a specific level and assigns a output feature code for that element.
69 6XUYH\7RROV 6HWWLQJ Level Type Color Weight Style Code Surface Description (IIHFW Level this rule applies to. Type of element this rule applies to. If on, filter elements by color. If on, filter elements by line weight. If on, filter elements by line style. Feature code to output points with. Survey surface to output the points with. This setting is relevant only with survey file formats which have a surface field. An explanatory text string describing the feature. á You can use the 6HOHFWLRQ tool as an aid in creating new rules. Select an example element before clicking the $GG button.
70 6XUYH\7RROV ([SRUWWR*,6 1RWÃ)LHOG ([SRUWWR*,6 tool passes survey elements to Geographics or MGE. It does this by attaching a Geographics or MGE feature attribute to survey elements so that those systems will be aware of the feature that the graphical elements represent.
71 6XUYH\7RROV *HQHUDWH&RQWRXUV *HQHUDWH&RQWRXUV tool draws contours based on survey points. It searches for input points from two sources: Points in the /RDGHGVXUYH\SRLQWV window (loaded using using /RDG6XUYH\9HULI\). The active feature list determines what points can be used for the surfacce. Survey elements drawn permanently into the design file. Settings which were active at creation time will determine which elements can be used for the surface. Contours will be drawn in the design file as permanent elements. 7RJHQHUDWHFRQWRXUV 1. Select the *HQHUDWH&RQWRXUV tool. The *HQHUDWH&RQWRXUV dialog box opens: 2. Fill in settings values in the dialog and click OK. The applications gathers input points, creates a triangulated surface model internally and displays contours in the design file. TerraSurvey supports three different types of contours. Minor contours, basic contours and major contours can be distinguished from each other by line color, weight or style. You can select which of the contour types will be displayed and at what intervals. 2SWLRQV pulldown menu has commands for defining options for contours and labels.
72 0DQLSXODWH7RROV 0DQLSXODWH7RROV 0DQLSXODWHWRROER[ The tools in the 0DQLSXODWH tool box are used to manipulate survey drawing elements. You can view survey information of elements, rescale the survey drawing, hide overlapping texts, reformat leveling texts, soften elements, find intersecting breaklines or draw elements as survey features. 7R 8VH View survey information of an element 6KRZ6XUYH\,QIR Set plotting scale and rescale drawing 6HW6FDOH Hide overlapping texts +LGH2YHUODSSLQJ7H[WV Format leveling texts )RUPDW/HYHOLQJ7H[WV Soften element by adding vertices 6RIWHQ(OHPHQW Build roof shape between line segments %XLOG5RRI6KDSH Find intersecting breaklines )LQG,QWHUVHFWLQJ%UHDNOLQHV Draw element using survey drawing rule 'UDZ$V)HDWXUH
73 0DQLSXODWH7RROV 6KRZ6XUYH\,QIR 6KRZ6XUYH\,QIR tool lets you view the survey information of an element. It opens a window showing all the survey data which was stored into a survey drawing element. 7RYLHZWKHVXUYH\LQIRUPDWLRQRIDQHOHPHQW 1. Select the 6KRZ6XUYH\,QIR tool. 2. Identify the element to view. The 6XUYH\LQIRUPDWLRQ window opens: You can continue to step 2.
74 0DQLSXODWH7RROV 6HW6FDOH 6HW6FDOH tool sets the intended plotting scale of the survey drawing and rescales elements. Plotting scale affects all survey text elements and those cells for which the size has been defined as millimeters on paper. 7RVHWWKHLQWHQGHGSORWWLQJVFDOHDQGUHVFDOHHOHPHQWV 1. Select the 6HW6FDOH tool. The 6HWVFDOH window opens: 2. Enter value for the new scale. The new scale will affect all subsequent elements which TerraSurvey will create. If 5HGUDZ VXUYH\HOHPHQWV is on, this tool will redraw all the survey points which have been assigned scale dependent drawing rules.
75 0DQLSXODWH7RROV +LGH2YHUODSSLQJ7H[WV +LGH2YHUODSSLQJ7H[WV tool finds overlapping text elements and hides the extra elements by moving them to a specific level. When you rescale a survey drawing for a higher scale, text elements will get bigger and may overlap each other. This tool will hide some of the extra elements to a specific level which can be switched off before plotting. 7RKLGHRYHUODSSLQJWH[WHOHPHQWV 1. Select the +LGH2YHUODSSLQJ7H[WV tool. The +LGHRYHUODSSLQJWH[WV window opens: 2. Enter settings values and click OK. Overlapping text elements are moved to the given level. 6HWWLQJ Move to level Text margin Fence contents Compare with reference files (IIHFW Level on which to move text elements. Margin of free space required around text elements. If on, process only fence contents. If on, scan reference files.
76 0DQLSXODWH7RROV )RUPDW/HYHOLQJ7H[WV )RUPDW/HYHOLQJ7H[WV tool reformats the elevation text elements in a survey drawing. It lets you decide the number of decimals in the text elements and decide if the preceding sign should be drawn. 7RUHIRUPDWHOHYDWLRQWH[WHOHPHQWV 1. Select the )RUPDW/HYHOLQJ7H[WV tool. The )RUPDWOHYHOLQJWH[WV dialog box opens: 2. Choose settings values in the dialog. 3. Click OK. The existing leveling texts elements are redrawn and the new settings will be used when loading and drawing any new survey files. 6HWWLQJ Accuracy Display plus Display minus (IIHFW Number of decimals to display in elevation values. If on, positive elevation values will display a plus sign. If on, negative elevation values will display a plus sign.
77 0DQLSXODWH7RROV 6RIWHQ(OHPHQW 1RWÃ)LHOG 6RIWHQ(OHPHQW tool softens elements by adding new vertices around sharp corners. This feature can be used to make the survey elements appear smoother and more natural when creating visualization images. This tool lets you control how far the new points may be placed from the original line segments connecting surveyed points. The new vertices will be used when you create a surface model from the survey elements. If the actual feature in the field is smooth, a softened element will produce a better looking surface model and more natural rendered images. You can use this tool with most types of linear elements. Valid element types include line strings, curves, arcs, ellipses, shapes, complex chains and complex strings. 7RVRIWHQOLQHDUHOHPHQWV 1. Select the 6RIWHQ(OHPHQW tool. 2. Identify the element to soften. 3. Accept the element. The element will be softened. You can continue to step 2. OR 1. Select element(s) to soften. 2. Select the 6RIWHQ(OHPHQW tool. 3. Accept element(s). The element will be softened. 6HWWLQJ Max deviation Create copy (IIHFW Maximum distance between the new vertices and their projection to the original line segment. If on, the original element will not be affected. Instead, a copy of the element will be created.
78 0DQLSXODWH7RROV %XLOG5RRI6KDSH 1RWÃ)LHOG %XLOG5RRI6KDSH tool draws a rectangular shape between two parallel line segments. This tool can be used to create roof surfaces when the ridge and the edges have been collected as lines or line strings. 7REXLOGDURRIVKDSH 1. Select the %XLOG5RRI6KDSH tool. 2. Identify the first line segment defining the roof shape. 3. Identify the second line segment. This draws a rectangular shape between the two line segments. You can continue to step 2.
79 0DQLSXODWH7RROV 'UDZ$V)HDWXUH 1RWÃ)LHOG 'UDZ$V)HDWXUH tool redraws a graphical element using the drawing rules of a selected survey feature. This tool extracts vertices from an existing element and creates survey drawing elements using those vertices. The original elements may have been created by another application or another organization. You can use this tool to convert those elements into the correct survey drawing symbology. 7RUHGUDZHOHPHQWVDVVXUYH\IHDWXUHV 1. Select the 'UDZ$V)HDWXUH tool. The 6HOHFWIHDWXUH window opens: 2. Select the desired feature code in the list. 3. Identify the element to redraw. 4. Accept the element. The element is redrawn using feature based drawing rules. You can continue to step 2 or 3. OR 1. Select element(s) to redraw. 2. Select the 'UDZ$V)HDWXUH tool. The 6HOHFWIHDWXUH window opens. 3. Select the desired feature code from the list. 4. Accept element(s). The element is redrawn using feature based drawing rules. 6HWWLQJ Index Dimension Information Create copy (IIHFW Survey index for the first vertex. Dimension for all vertices. Information text for all vertices. If off, delete the original element. If on, keep the original element.
80 0DQLSXODWH7RROV )LQG,QWHUVHFWLQJ%UHDNOLQHV )LQG,QWHUVHFWLQJ%UHDNOLQHV tool finds locations where survey drawing elements would result in intersecting breaklines in a surface model. It lets you view the intersection locations and fix the problems by moving a survey point to a new location if necessary. This tool works with both permanent survey drawing elements and temporary elements created by /RDG6XUYH\9HULI\. 7RILQGLQWHUVHFWLQJEUHDNOLQHV 1. Select the )LQG,QWHUVHFWLQJ%UHDNOLQHV tool. The )LQGLQWHUVHFWLQJEUHDNOLQHV dialog opens: 2. Enter settings values in dialog and click OK. TerraSurvey creates a list of breakline segments and processes the list to find intersections. If any are found, the %UHDNOLQHLQWHUVHFWLRQV window opens. 6HWWLQJ Surface Fence contents Diameter (IIHFW Surface type to process. Compare only breakline elements which would be used to create a surface of this type. If on, process only fence contents. Diameter for circles which will be drawn to indicate intersecion locations. The %UHDNOLQHLQWHUVHFWLRQV window displays a list of all intersections found. It lets you view the intersection locations and to correct the problem by moving one of the survey points.
81 0DQLSXODWH7RROV 7RYLHZWKHORFDWLRQRIDQLQWHUVHFWLRQ 1. Select the desired row in the list of intersection. 2. Click the 6KRZORFDWLRQ button. 3. Move the mouse inside a view. This tool shows to location by drawing a large cross. 4. You may enter a data click to center the view by the intersection location. 7RFRUUHFWDQLQWHUVHFWLRQSUREOHP 1. Select the desired row in the list of intersection. 2. Click the 0RYHSRLQW button. 3. Select the segment point to move. This can be any one of the end points in the two line segments causing the intersection. 4. Select the correction method in the 0RYHWR field. 5. Enter or accept the new location. 6HWWLQJ Move to (IIHFW Correction method: New xy location - enter a new xy location with a data click. Intersection - move to the xyz intersection. End point - move to an xyz end point of the other line segment. Along segment - move along the three dimensional line segment.
82 8WLOLW\7RROV 8WLOLW\7RROV 8WLOLWLHVWRROER[ The tools in the 8WLOLWLHV tool box are general purpose tools which are useful in every day work with MicroStation. These tools let you set a dynamic magnification view, measure element length, control visible levels or set the active angle. 7R 8VH Set dynamic magnification view 0DJQLI\ Measure and label length of an element 0HDVXUH/HQJWK Control visible levels /HYHOV Set active angle 6HW$FWLYH$QJOH
83 8WLOLW\7RROV 0DJQLI\ 0DJQLI\ tool works like a magnification class. It is useful in viewing small details scattered around a large design file. It lets you choose a dynamic magnification view which will display a magnified image from the location of your mouse movement. 7RPDJQLI\VPDOOGHWDLOV 1. Make sure you have at least two view windows open. 2. Select the 0DJQLI\ tool. 3. Set 9LHZ as the view which will be dynamically updated. 4. Set 6FDOH to the desired magnification ratio. 5. Move the mouse inside other view. As you move the mouse, the magnification view will be dynamically updated to show a magnified view from the mouse location. 6HWWLQJ View Scale (IIHFW Magnified view. Magnification ratio from the source view to the magnified view. If set to 1RFKDQJH, the existing scale of the magnification view will not be changed.
84 8WLOLW\7RROV 0HDVXUH/HQJWK 0HDVXUH/HQJWK tool measures a line or an arc. When used to measure a line, this tool displays the length and the direction angle of the line. When used to measure an arc, this tool will display the length and the radius of the arc. 7RPHDVXUHDQHOHPHQW 1. Select the 0HDVXUH/HQJWK tool. 2. Identify the element. If the element is a line, the length and the direction angle will be displayed. If the element is an arc, the length and the radius will be displayed. 3. Enter a data click to accept the labeling or a reset to reject the labeling. You can continue to step 2.
85 8WLOLW\7RROV /HYHOV /HYHOV tool makes it fast and easy to control visible levels by level names. This tool opens a window with two list boxes showing all level names. The 2Q list displays all level names which are switched on in a selected view. The 2II list displays all level names which are switched off in a selected view. To toggle the state of a level, just click on its row in a list. This will toggle the state of the level in the selected view and move the level name into the other list. 7RFRQWUROYLVLEOHOHYHOV 1. Select the /HYHOV tool. The /HYHOV dialog box opens. 2. To set a level on, click on its row in the 2II list. 3. To set a level off, click on its row in the 2Q list. 6HWWLQJ Group Sort by View All views (IIHFW Selects the level name group to display. Sets the sort order of list names. View to operate on. If on, all views will be affected.
86 8WLOLW\7RROV 6HW$FWLYH$QJOH 6HW$FWLYH$QJOH tool lets you set the active angle using any of the angle systems defined in user settings. This tool affects the same active angle setting which you can set using MicroStation s builtin features. The additional benefit from this tool is being able to use the angle systems used in surveying. 7RVHWWKHDFWLYHDQJOH 1. Select the 6HW$FWLYH$QJOH tool. 2. Enter the desired angle in the key-in field. 6HWWLQJ Angle Mode Angle lock Tolerance (IIHFW Sets the active angle. Angle system to use. If on, the active angle is rounded to the nearest multiple of the specified 7ROHUDQFH. If $QJOHORFN is on, the active angle is constrained to multiples of this value.
87 3DUW,96HWWLQJV5HIHUHQFH
88 'UDZLQJ5XOH6HWWLQJV 'UDZLQJ5XOH6HWWLQJV The graphical presentation of a feature is built by assigning one or several drawing rules to it. When drawing a feature into the design file, TerraSurvey processes each of the drawing rules assigned to the feature and creates elements using information from both the survey points and the drawing rule settings. 3RLQWFRXQWUHTXLUHPHQWV For some drawing rules, a single survey point is sufficient. Cell, text and circle drawing rules are all based on a single survey point. Some drawing rules require more than one survey point. Because all linear drawing rules require at least two points, an error message will be generated if attempting to draw a linear feature using a single point. Linear drawing rules can handle up to 2000 points in a chain which will be drawn without gaps between the elements. For example, the line drawing rule would create three line elements from a chain of four points. Some drawing rules always process two points at a time - no matter how many points a chain contains. For example, a multipoint cell drawing rule would create two cells from a chain of four points. The table below lists the number of points various drawing rules require. 0D[FKDLQ column indicates the maximum number of points the drawing rule can process as chain. Chains exceeding the maximum will be broken down. 5XOH 5HTXLUHV 0D[FKDLQ Cell 1 1 Text 1 1 Circle 1 1 Linear - line Linear - line string 3 (2 creates a line) 2000 Linear - shape Linear - curve 3 (2 creates a line) 2000 Linear - arc Multipoint cell 2 2 Surface element - cell 1 1 Surface element - row of cells Surface element - pile 1 2 Surface element - wall Structure - window 2 2 Structure - pillar 2 2 Structure - beam Structure - culvert 2 2
89 'UDZLQJ5XOH6HWWLQJV 3ODFHPHQWRIIVHW Many drawing rules allow the use of an offset distance. This means that the graphical element is placed at a given distance from the survey point location. The offset can be given as a true distance in meters or as a paper distance in millimeters. 6HWWLQJ Offset Dx Dy (IIHFW Offset type: True distance - given in meters. Paper distance - given in millimeters on paper. A negative value indicates an offset to the left. A positive value indicates an offset to the right. A negative value indicates an offset downwards. A positive value indicates an offset upwards. &HOOGUDZLQJUXOHV Cell drawing rules place a cell element defined in a cell library. Cells are identified by a name which is a text string up to six characters in length. TerraSurvey uses the name to search for the definition of the cell from: 1. The design file as a shared cell definition. 2. The active cell library. 3. Cell libraries specified in the cell library list (MS_CELLLIST). A cell can be scaled to a true size, to a paper size or by a survey diameter. When scaling a cell, TerraSurvey automatically first inspects the size of the cell in the library. 6HWWLQJ Cell Size as (IIHFW Cell name How to scale the cell: Library size - use the library cell as such. No scaling. True size - scale to a natural size given in meters. Paper size - scale to a fixed size when plotted on paper. The size is given in millimeters. The true size of the cell depends on the intended plotting scale. Scale by diameter - scale to the surveyed diameter. Requires that a dimension is included in the survey file.
90 'UDZLQJ5XOH6HWWLQJV 7H[WGUDZLQJUXOHV Text drawing rules create a text element which contains information about a survey point. This can be point index, x coordinate, y coordinate, elevation, dimension, information, elevation distance to a surface or a free text string. 6HWWLQJ Write Prefix Suffix Place Rotation Justify (IIHFW Selects the survey point field to write. Available options include,qgh[, ;, <, =, 'LPHQVLRQ,,QIR, )UHHWH[W and ']WRVXUIDFH. An optional text to add before the actual survey information. An optional text to add after the actual survey information. Type of element to generate: As normal text - generate a simple text element. With note line - include a line extending from the surveyed point to the location defined by the offset. Text rotation: Normal - placed horizontally. Along string - run as parallel to the string at the point location. Perpendicular to string - perpendicular to the string. Surveyed angle - measured angle associated with survey point determines direction. Fixed angle - direction angle is fixed in the drawing rule. How text is aligned with respect to the placement point. In addition to standard justification methods, an elevation text can be placed by 'HFLPDOSRLQW. This produces an elevation text with the decimal point indicating the survey point location. A free text string allows you to type a format string such as Location #x,#y where the application will replace the following fields: )LHOG 5HSODFHE\VXUYH\SRLQW #x X coordinate (easting) #y Y coordinate (northing) #z Elevation #d Dimension #i Information text &LUFOHGUDZLQJUXOHV Circle drawing rules create a circle element. The diameter can be specified as true size or as a paper size dimension. 6HWWLQJ Diameter (IIHFW Circle diameter: True size - given in meters. Paper size - given in millimeters on paper. The true size depends on the intended plotting scale.
91 'UDZLQJ5XOH6HWWLQJV /LQHDUGUDZLQJUXOHV Linear drawing rules create linear elements - lines, line strings, shapes, curves or arcs. 6HWWLQJ Build complex chains Draw at zero elevation Construction element Style (IIHFW If on, build a complex chain from simple elements. If on, create elements at zero elevation. This setting can be used to make that linear patterning appears uniform regardless of changes in elevation. If on, create construction class elements. Type of line style: Standard - one of eight standard line types. Custom - custom line style from a line style library. Patterned - linear pattern from a cell library.
92 'UDZLQJ5XOH6HWWLQJV 0XOWLSRLQWFHOOGUDZLQJUXOHV Multipoint cell drawing rules create cell elements to represent features surveyed as two points. The second point is used to determine the size and possibly the rotation of the cell. 5RWDWHG'FHOO This rule places a cell with the origin at the first survey point location. The second point is used to scale and to rotate the cell. The library cell should be drawn with the second point directly to the right from the origin. Library cell, X = origin Placed, top view 'FHOO This rule places a cell with the origin at the lower of the two points. The elevation difference of the two points is used to scale the cell. This rule will typically be used with three dimensional tree cells. Front view
93 'UDZLQJ5XOH6HWWLQJV 5RWDWHG'FHOO This rule places a cell with the origin at the lower of the two points. The other point determines the horizontal size, the vertical size and the rotation of the cell. This rule can be used for three dimensional objects such as lamp posts. The library cell should be drawn with the second point directly to the right from the origin. Top view Front view 6XUIDFHHOHPHQWGUDZLQJUXOHV &HOO This rule places a three dimensional cell surveyed with just one point. The surveyed point represent the top of the cell. The cell origin is located at the elevation of a surface model at the survey point xy location. This rule is typically used to survey trees with just one point. Front view
94 'UDZLQJ5XOH6HWWLQJV 5RZRIFHOOV This rule creates a row of three dimensional cells between two survey points which represent the top line of the cells. The origins of the cells are placed according to the elevation of a surface model. This rule will typically be used to draw a row of trees or shrubs. Top view Front view 6HWWLQJ Spacing (IIHFW Spacing between cells as a percentage of cell size. 3LOH This rule creates a vertical pile onto the elevation of a surface model. The top of the pile can be defined by a single point or by two points. If a single point is used, that point defines the top center of the pile. Width setting from the drawing rule defines the pile size. If two points are used, they define two opposite corners from the top of the pile. Top view Isometric view 6HWWLQJ Width (IIHFW Pile size in millimeters when the pile location is defined by a single point. If there are two points, the distance between the points is used as a diagonal size.
95 'UDZLQJ5XOH6HWWLQJV :DOO This rule creates a shape element between two survey points which represent the top line of a wall. The bottom of the wall extends to run along a surface model. This rule will typically be used to draw a fence or the walls of a building. Top view Front view 6WUXFWXUHGUDZLQJUXOHV Window, pillar and beam drawing rules are used when surveying buildings. These drawing rules create symbols for the surveyed structures of a building. Although the symbols themselves are two dimensional, they will be drawn at the correct elevation of the survey points. :LQGRZ This rule creates a two dimensional window symbol based on two survey points. The first point is the left corner and the second point is the right corner of the window opening. A survey dimension defines the depth of the window. Top view 6HWWLQJ Default size (IIHFW Default depth if neither of the points has a survey dimension.
96 'UDZLQJ5XOH6HWWLQJV 'RRU This rule creates a two dimensional door symbol based on two survey points. The first point is the left corner and the second point is the right corner of the door opening. A survey dimension defines the depth of the door. Top view 6HWWLQJ Default size Handle (IIHFW Default depth if neither of the points has a survey dimension. Defines if the door handle is on the left or on the right side. It is a good idea to define two separate survey codes for these two cases. 3LOODU This rule creates a two dimensional pillar symbol based on two survey points. The first point is the left corner and the second point is the right corner of the pillar. A survey dimension defines the second edge length of the rectangular pillar. If no survey dimension is given, a rectangular pillar is created. Top view
97 'UDZLQJ5XOH6HWWLQJV %HDP This rule creates a two dimensional beam symbol based on two or more survey points. The survey points represent the center line of the beam. Survey dimensions define the width of the beam at the corresponding survey point. Top view 6HWWLQJ Default size (IIHFW Default width if no survey dimension given. &XOYHUW This rule creates a three dimensional cone element based on two survey points which can represent the top, the center or the bottom of the culvert. A survey dimension defines the diameter of the cone element. Isometric view 6HWWLQJ Default size Survey at (IIHFW Default diameter if neither point has a survey dimension. Surveyed position: top, center or bottom of culvert.
98 8VHU'HILQHG)LOH)RUPDWV 8VHU'HILQHG)LOH)RUPDWV With the ability to define your own file formats, you can read in and write to a wide variety of text based file formats. The only basic requirement is that the file must be organized so that one row contains the fields of one survey point. A file can be interpreted using either delimer based logic or fixed length fields. In a delimeter based file, fields are separated from each other by a reserved character. This delimeter is normally comma, space or tabulator character. A file with fixed length fields is defined by the column position of various fields. The same data always occupies the same columns on a row. 7RGHILQHDQHZILOHIRUPDW 1. Select the 6HWWLQJV tool. The 6HWWLQJV window opens. 2. Click on )LOHIRUPDWV folder to open it. 3. Select 8VHU[\] category. 4. Click on $GG button. The )LOHIRUPDW dialog opens. 5. Choose the definition type in )LHOGW\SH (either 'HOLPHWHG or )L[HGOHQJWK). 6. (Optional) Select /RDGH[DPSOH command from )LOH pulldown menu to load an example file. 7. Enter settings. 8. (Optional) Verify that file format definition is correct by clicking 7HVWUHFRJQLWLRQ button. 9. Click OK. 'HOLPHWHGIRUPDWGHILQLWLRQ Delimited format files consist of fields which are separated by a specific delimiter character.
99 8VHU'HILQHG)LOH)RUPDWV 6HWWLQJ For output only Format name Comment character Delimeter Break code Dimension unit Strings have continuous point indexes Join disjoint strings by number String number appended to code (IIHFW If on, TerraSurvey will not try to use this file format when reading in files. Name for the file format. Rows starting with this character will be ignored. Delimeter character: space, tabulator, comma or semicolon. Feature code used to break strings. Dimension unit. If on, a non-continuous point index will be interpreted to start a new string. For consecutive points to be in the same string, the point index must remain the same or increase by one. If on, points will be sorted by string number so you don t have to survey each string as consecutive points. TerraSurvey will reorder points so that points with the same string number will form a string. If on, string number is stored in the same field as a feature code, for example CL10. This setting requires that the feature code is built from letters A-Z. The first digit starts the string number. )L[HGOHQJWKIRUPDWGHILQLWLRQ A file with fixed length fields always contains the same data in the same column positions on a row. To define such a file format, you enter a number of field definitions with a gived length.
100 %XLOWLQ$QJOH)LOH)RUPDWV %XLOWLQ$QJOH)LOH)RUPDWV TerraSurvey recognizes a number of builtin angle based file formats automatically. All of these formats are specific to certain total stations and data collectors. You can control certain aspects of these raw survey file formats. 7RPRGLI\VHWWLQJVIRUDEXLOWLQDQJOHILOHIRUPDW 1. Select the 6HWWLQJV tool. The 6HWWLQJV dialog box opens. 2. Click on )LOHIRUPDWV folder to open it. 3. Click on %XLOWLQDQJOH row in the category list. A list of supported builtin file formats appears: 4. Select the desired file format in the list. 5. Click (GLW to open a settings dialog for the selected format.
101 %XLOWLQ$QJOH)LOH)RUPDWV :LOGDQJOH*6,IRUPDW Wild total station file formats are organized so that each row contains the information for one survey point. The data is built from blocks of sixteen characters (8+8). The first two characters in a block are used to identify the data content of that block. Several pieces of data may appear in the same block. TerraSurvey s user settings allow you to specify the field identifier (first two characters) of the block where a data item is located in. You can also specify the starting column and the ending column of the actual data within the block. The columns usually range from three to fifteen as the first two characters contain the field identifier and the last one is unused. 6HWWLQJ Index - Field Index - Characters Feature code - Field Feature code - Characters Dimension - Field Dimension - Characters Dimension - Unit Horizontal angle - Field Horizontal angle - Characters Vertical angle - Field Vertical angle - Characters Distance - Field Distance - Characters Distance - Distance Break (IIHFW Field identifier for block containing point index. Point index columns. Field identifier for block containing feature code. Feature code columns. Field identifier for block containing dimension. Dimension columns. Dimension unit. Default is centimeters. Field identifier for block containing easting. Horizontal angle columns. Field identifier for block containing northing. Vertical angle columns. Field identifier for block containing observed distance. Distance columns. Type of distance - 3D or 2D distance. Feature code used to break strings.
102 %XLOWLQ;\])LOH)RUPDWV %XLOWLQ;\])LOH)RUPDWV TerraSurvey recognizes a number of builtin file formats automatically. Some of these formats are specific to certain total stations and data collectors. The rest of the formats exist as general data transfer formats. You can control certain aspects of these file formats. 7RPRGLI\VHWWLQJVIRUDEXLOWLQ[\]ILOHIRUPDW 1. Select the 6HWWLQJV tool. The 6HWWLQJV dialog box opens. 2. Click on )LOHIRUPDWV folder to open it. 3. Click on %XLOWLQ[\] row in the category list. A list of supported builtin file formats appears: 4. Select the desired file format in the list. 5. Click (GLW to open a settings dialog for the selected format.
103 %XLOWLQ;\])LOH)RUPDWV *HRGLPHWHU TerraSurvey can read in coordinate based survey files which have been produced by Geodimeter/ Geoditech total stations. The files can be in,qwhuqdoirupdw or 5RZIRUPDW. These two variations differ only in the way line breaks appear in the file. Internal format is the native format which the Geodimeter total stations use. In this format each data item followed by a line break. 6HWWLQJ (IIHFW Feature Label for feature code field. Default is 4. Index Label for running point index field. Default is 5. Easting Label for easting field. Default is 38. Northing Label for northing field. Default is 37. Elevation Label for elevation field. Default is 39. Dimension Label for optional dimension field. Default is 63. Info Label for optional information field. Default is 0. Information field may specify a free text string associated with a point. A-distance Label for optional offset distance. Default is 72. B-distance Label for optional offset distance. Default is 73. Position Label for equipment position identifier field. Default is 2. Connection Label for identifying the connection for an equipment position. Default is 62. Ignore A list of labels which should be ignored. The application produces a warning message if it encounters a label which has not been specified as a field label or as a label to ignore. Use string to sort points If on, input files may contain a string number for each point. The string number will be used to join disjoint strings. Label Label for string field. Default is 89. Break Feature code for break points. Default is 100. First prism Feature code for first prism point. Default is 99. The second prism point has the feature code of the surveyed feature. Dimension Dimension unit. Default is centimeters.
104 %XLOWLQ;\])LOH)RUPDWV *HRGLPHWHUH[DPSOHILOHIUDJPHQW5RZIRUPDW 50=4317 2=2 37= = =137= = = =1 4=20 63=0 37= = = =2 4=20 63=0 37= = = =3 4=20 63=0 37= = = =4 4=20 63=0 37= = = =5 4=20 63=0 37= = = *HRGLPHWHUH[DPSOHILOHIUDJPHQW,QWHUQDOIRUPDW 5=1 4=20 63=0 37= = = =2 4=20 63=0 37=
105 %XLOWLQ;\])LOH)RUPDWV 0RVVJHQLR TerraSurvey supports input and output of survey points in Moss genio format. There are no user settings for this file format. 0RVVJHQLRH[DPSOHILOHIUDJPHQW GENIO,MODELNAME 080,UK,7= '5PDS SDRmap is a general data exchange format for survey point information. In this format every data item appears on a row of its own. The only user setting for this format defines the feature code being used as a break code. 6'5PDSH[DPSOHILOHIUDJPHQW "" "DRAIN" "" "CL"
106 %XLOWLQ;\])LOH)RUPDWV 6RNNLD TerraSurvey s support for Sokkia files includes SDR2, SDR20 and SDR33 versions. 6RNNLDVHWWLQJ Sort by Start command Allow two features for one point Break Station Dimension (IIHFW If set to Feature and string, points belonging to the same string do not have to follow each other. TerraSurvey will reorder points so that points with the same feature code and the same string number will form a string. Command for identifying the start of a new string. If on, you can enter two feature codes for one point. TerraSurvey will treat this as if two points had been surveyed. Feature code used as a break code. Command for identifying the station location. Dimension unit. Default is centimeters. 6RNNLDH[DPSOHILOHIUDJPHQW 08TP TOLPPA 08TP VA 15 08TP PAITA ST 08TP KO 20 08TP LAR 08TP LYRO 08TP LYRO
107 %XLOWLQ;\])LOH)RUPDWV :LOG[\]*6,IRUPDW Wild total station file formats are organized so that each row contains the information for one survey point. The data is built from blocks of sixteen characters (8+8). The first two characters in a block are used to identify the data content of that block. Several pieces of data may appear in the same block. TerraSurvey s user settings allow you to specify the field identifier (first two characters) of the block where a data item is located in. You can also specify the starting column and the ending column of the actual data within the block. The columns usually range from three to fifteen as the first two characters contain the field identifier and the last one is unused. :LOG[\]VHWWLQJ Index - Field Index - Characters Feature code - Field Feature code - Characters Dimension - Field Dimension - Characters Dimension - Unit Easting - Field Easting - Characters Northing - Field Northing - Characters Elevation - Field Elevation - Characters Break (IIHFW Field identifier for block containing point index. Point index columns. Field identifier for block containing feature code. Feature code columns. Field identifier for block containing dimension. Dimension columns. Dimension unit. Default is centimeters. Field identifier for block containing easting. Easting columns. Field identifier for block containing northing. Northing columns. Field identifier for block containing elevation. Elevation columns. Feature code used to break strings.
108 %XLOWLQ;\])LOH)RUPDWV :LOG[\]*6,H[DPSOHILOHIUDJPHQW :LOG[\]*6,IRUPDW :LOG[\]*6, format is similar to :LOG[\]*6, format. The only difference is block length which is 24 characters in this format (8+16).
109 6WULQJ+DQGOLQJLQ6XUYH\ 6WULQJ+DQGOLQJLQ6XUYH\ This chapter describes how TerraSurvey handles construction of strings from the incoming survey points. A string often represents a linear feature such as a center line of a road, the edge of pavement or a river bank. These are often displayed as linear elements in the survey drawing. When surveying such features, one needs to control which points belong to the same linear feature and where another linear feature starts. The application is capable of using several different methods to break strings or to construct strings. Some of these methods require that the incoming survey file contains string numbers. Some of the builtin file formats include specific logic for starting and terminating strings. This chapter only describes methods which can be used with a number of file formats. 'HIDXOWORJLF A string consists of a number of consecutive points that have the same feature code. The actual drawing rules assigned to that feature determine whether those points will generate linear elements or single point elements in the survey drawing. A string is terminated whenever a point has a different feature code than the previous point. If feature code remains the same, the point belongs to the same string as the previous point. This means that a problem arises when the surveyor moves from one linear feature to another similar linear feature using the same feature code. For example, measuring points along the left river bank and then moving over to measure points along the right river bank. If nothing special is done, the application will incorrectly connect the last point of the left river bank with the first point of right river bank. The simplest way of solving this problem is to survey something else in between - a leveling point for instance. %UHDNFRGHV A break code is a special survey code that will not generate anything visible in the survey drawing. It is reserved just for terminating or breaking strings. The coordinates of a break point are ignored. The surveyor can record one point as a break point before moving from one linear feature to another similar one. You can define what survey code will be interpreted as a break code with each file format. 3RLQWLQGH[HV User defined file formats include a setting called 6WULQJVKDYHFRQWLQXRXVSRLQWLQGH[HV. If this toggle is on, point indexes can act as terminators. Consecutive points will belong to the same string only when the point index remains the same or increases by one.
110 6WULQJ+DQGOLQJLQ6XUYH\ 6WULQJQXPEHUV Some file formats can contain string numbers. If so, those will be used in determining where one string ends and another one starts. Consecutive points will belong to the same string only if their string numbers are equal. Furthermore, it is possible to use string numbers to construct strings from non-sequential points. For user defined file formats, this will be determined by the -RLQGLVMRLQWVWULQJVE\QXPEHU setting. If sorting is used, the surveyor can freely choose the order in which he measures points as long as he assigns a string number for each point in a linear feature. This is most often used to enable cross sectional order when surveying longitudinal objects. For example, a road could be surveyed as three linear features: left edge (EL), center line (CL) and right edge (EL). The surveyor can choose the order of points freely. The picture above shows the original point order as point index labels. 6HFWLRQDOPDVWHUFRGHV Keying in string numbers for each point can be a tedious task for the surveyor. As an alternative, TerraSurvey also supports sectional master codes. These are survey codes which are actually linked to a user defined list of feature codes. A feature code can be defined as a sectional master code using the 2SWLRQV button in the )HDWXUHFRGH dialog. For the case in the picture above, you could define a feature code (RS) as a sectional master code and link it to a list of feature codes EL, CL and EL. Furthermore, you could set the 5HSHDWLQ UHYHUVHRUGHUtoggle on so that the sequence will automatically be repeated in reverse order. The surveyor can then use a single survey code (RS) for all of the points. First point in a sequence will become an EL1 point, second a CL2 point, third an EL3 point, fourth an EL3 point, fifth a CL2 point, sixth an EL1 point, seventh an EL1 point and so on. The advantage of this method is saving time out in the field. The surveyor does not have to change the survey code and does not have to type in string numbers. The obvious disadvantage is that the surveyor must carefully follow a certain order in measuring points.
111 2EVHUYDWLRQ&RUUHFWLRQV 2EVHUYDWLRQ&RUUHFWLRQV This chapter presents the formulas used in observation corrections. As many of these corrections can be handled by a modern total station, the user will select which ones are used when processing angle based observations. The correction formulas appear in the same order in which they are applied. 3ULVPFRQVWDQWFRUUHFWLRQ This correction applies to the 3D distance: V V& where s is the measured / corrected 3D distance C is the prism constant 3UHVVXUHDQGWHPSHUDWXUHFRUUHFWLRQ This correction applies to the 3D distance: V VV-137 where s is the measured / corrected 3D distance J is the refractive index N is the carrier constant P is atmospheric pressure in mmhg T is the dry air temperature in Celsius &XUYDWXUHDQGUHIUDFWLRQFRUUHFWLRQ This correction applies to both the 3D distance and the vertical angle: D D.V G G..VVV where a is the measured / corrected vertical angle (in radians) s is the measured / corrected 3D distance K is the coefficient of terrestrial refraction
112 2EVHUYDWLRQ&RUUHFWLRQV 6HDOHYHOFRUUHFWLRQ This correction applies to 2D distance. If 6HDOHYHO correction is not active, 2D distance is computed as: G FRVDV If 6HDOHYHO correction is active, 2D distance is computed as: '] VLQDV 'K +'] 6P V']']V 6R 6P+'K G 6R6R6R where s is the observed / corrected 3D distance a is the observed / corrected vertical angle (radians) d is the computed 2D distance H is the source height (station elevation + instrument height) 3URMHFWLRQFRUUHFWLRQ This correction applies to 2D distance: G G6 where d is the computed / corrected 2D distance S is the projection scale factor
113 ,QVWDOODWLRQ'LUHFWRULHV,QVWDOODWLRQ'LUHFWRULHV TerraSurvey shares the same directory structure with all Terra Applications. It is recommended that you install all Terra Applications in the same directory. The list below shows a typical directory structure when TerraSurvey has been installed in path C:\TERRA. c:\terra directory where TerraSurvey was installed 0 cell for cell libraries 3 karttali.cdx cell library index file 3 karttali.cel cell library 0 config for configuration files 3 tsurvey.cfg defines environment variables 0 data for survey data files 3 borehole.dat example data file for tutorial 3 tutorial.dat survey file for tutorial 3 soilwatr.dat example survey data 0 docs for documents and on-line help 3 tsurvey.pdf on-line help 0 license for user license files 3 tsurvey.lic user license 0 ma for application files (draftma in Field) 3 tsurvey.ma application 3 tsurvey.dll library 0 seed for seed files 3 survseed.dgnexample seed file 0 tsurvey for feature lists and settings 3 tsurvey.fea default feature list 3 tutorial.fea feature list for tutorial
114 &RQILJXUDWLRQ9DULDEOHV &RQILJXUDWLRQ9DULDEOHV MicroStation is able to locate TerraSurvey with the help of configuration variables. When you install TerraSurvey, the installation program will create a configuration file TERRA.CFG which defines the required environment variables. This file is placed in MicroStation s CONFIG\APPL subdirectory. For example, C:\USTATION\CONFIG\APPL\TERRA.CFG may contain: # # # TERRA.CFG - Configuration for Terra Applications # # TERRADIR=c:/terra/ TERRACFG=$(TERRADIR)config/ TERRADOCS=$(TERRADIR)docs/ MS_MDLAPPS < $(TERRADIR)ma/ MS_MDLAPPS < $(TERRADIR)draftma/ %if exists ($(TERRACFG)*.cfg) % include $(TERRACFG)*.cfg %endif This configuration file will include all the configuration files in C:\TERRA\CONFIG directory. TerraSurvey s configuration file TSURVEY.CFG contains: # # # TSURVEY.CFG - TerraSurvey Configuration File # # TSURVEY_DATA=$(TERRADIR)data/ TSURVEY_LICENSE=$(TERRADIR)license/ TSURVEY_LOGFILE=$(TERRADIR)data/survey.err TSURVEY_REFPOINTS=$(TERRADIR)data/ # Directory for user preferences (user has write access) TSURVEY_PREF=$(TERRADIR)tsurvey/ # Directory for settings (may point to read-only directory) TSURVEY_SET=$(TERRADIR)tsurvey/ # Files for settings (may be shared by organization) TSURVEY_REFCLASS = $(TSURVEY_SET)refclass.inf TSURVEY_CORSETS = $(TSURVEY_SET)corsets.inf TSURVEY_GEOMCOD = $(TSURVEY_SET)geomcod.inf TSURVEY_SCALEFRM = $(TSURVEY_SET)scalefrm.inf TSURVEY_TRANSFORM = $(TSURVEY_SET)trans.inf TSURVEY_XYZFMT = $(TSURVEY_SET)xyzfmt.inf
115 &RQILJXUDWLRQ9DULDEOHV TSURVEY_ANGLEFMT = $(TSURVEY_SET)anglefmt.inf TSURVEY_ANGLESYS = $(TSURVEY_SET)anglesys.inf # Cell library required for tutorial MS_CELL < $(TERRADIR)cell/ MS_CELLLIST > karttali.cel In a default configuration, MicroStation will automatically include these settings as configuration variables. You can use MicroStation s &RQILJXUDWLRQ command from :RUNVSDFH menu to check the values for these variables. In case these variables have not been defined correctly, you should define them manually. MS_MDLAPPS should include the directory where TSURVEY.MA is located. TSURVEY_DATA should point to the default directory for survey data files are located. TSURVEY_LICENSE should point to the directory where user license TSURVEY.LIC is located. TSURVEY_LOGFILE defines the name of the error log file which the /RDG6XUYH\ $XWRPDWLF tool generates. TSURVEY_REFPOINTS should point to the default directory for reference point files. TSURVEY_PREF defines the directory where user settings TSURVEY.INF and TSURVEY.UPF will be stored. The user must have write access to this directory. TSURVEY_SET defines a directory which contains sharable settings files. This directory may be a server directory to which the user has read access only. The following configuration variables define the paths and names of sharable settings files. These may be located in a private directory or in a shared directory. TSURVEY_REFCLASS defines the file for reference point classes. TSURVEY_CORSETS defines the file for observation correction settings. TSURVEY_GEOMCOD defines the file for geometry coding definitions. TSURVEY_SCALEFRM defines the file for scale factor formulas. TSURVEY_TRANSFORM defines the file for coordinate transformations. TSURVEY_XYZFMT defines the file for user xyz file formats. TSURVEY_ANGLEFMT defines the file for user angle file formats. TSURVEY_ANGLESYS defines the file for angle systems.
Applying a circular load. Immediate and consolidation settlement. Deformed contours. Query points and query lines. Graph query.
 Quick Start Tutorial 1-1 Quick Start Tutorial This quick start tutorial will cover some of the basic features of Settle3D. A circular load is applied to a single soil layer and settlements are examined.
New Features in TerraScan. Arttu Soininen Software developer Terrasolid Ltd
 New Features in TerraScan Arttu Soininen Software developer Terrasolid Ltd Version 013.xxx Computer ID changes in licenses Send new computer ID to Terrasolid if using: Server pool licenses (server ID and
SA-9600 Surface Area Software Manual
 SA-9600 Surface Area Software Manual Version 4.0 Introduction The operation and data Presentation of the SA-9600 Surface Area analyzer is performed using a Microsoft Windows based software package. The
TABLE OF CONTENTS. INTRODUCTION... 5 Advance Concrete... 5 Where to find information?... 6 INSTALLATION... 7 STARTING ADVANCE CONCRETE...
 Starting Guide TABLE OF CONTENTS INTRODUCTION... 5 Advance Concrete... 5 Where to find information?... 6 INSTALLATION... 7 STARTING ADVANCE CONCRETE... 7 ADVANCE CONCRETE USER INTERFACE... 7 Other important
Understand the Sketcher workbench of CATIA V5.
 Chapter 1 Drawing Sketches in Learning Objectives the Sketcher Workbench-I After completing this chapter you will be able to: Understand the Sketcher workbench of CATIA V5. Start a new file in the Part
Quickstart for Desktop Version
 Quickstart for Desktop Version What is GeoGebra? Dynamic Mathematics Software in one easy-to-use package For learning and teaching at all levels of education Joins interactive 2D and 3D geometry, algebra,
Creating Drawings in Pro/ENGINEER
 6 Creating Drawings in Pro/ENGINEER This chapter shows you how to bring the cell phone models and the assembly you ve created into the Pro/ENGINEER Drawing mode to create a drawing. A mechanical drawing
Intro to Excel spreadsheets
 Intro to Excel spreadsheets What are the objectives of this document? The objectives of document are: 1. Familiarize you with what a spreadsheet is, how it works, and what its capabilities are; 2. Using
CDOT Monumentation Sheets
 CDOT Monumentation Sheets This document describes the process used to assemble a Right of Way Monumentation Sheet. An InRoads XML report is used to display the required data from the geometry project.
KaleidaGraph Quick Start Guide
 KaleidaGraph Quick Start Guide This document is a hands-on guide that walks you through the use of KaleidaGraph. You will probably want to print this guide and then start your exploration of the product.
NDA-30141 ISSUE 1 STOCK # 200893. CallCenterWorX-Enterprise IMX MAT Quick Reference Guide MAY, 2000. NEC America, Inc.
 NDA-30141 ISSUE 1 STOCK # 200893 CallCenterWorX-Enterprise IMX MAT Quick Reference Guide MAY, 2000 NEC America, Inc. LIABILITY DISCLAIMER NEC America, Inc. reserves the right to change the specifications,
Plotting: Customizing the Graph
 Plotting: Customizing the Graph Data Plots: General Tips Making a Data Plot Active Within a graph layer, only one data plot can be active. A data plot must be set active before you can use the Data Selector
DataPA OpenAnalytics End User Training
 DataPA OpenAnalytics End User Training DataPA End User Training Lesson 1 Course Overview DataPA Chapter 1 Course Overview Introduction This course covers the skills required to use DataPA OpenAnalytics
Project Setup and Data Management Tutorial
 Project Setup and Heavy Construction Edition Version 1.20 Corporate Office Trimble Navigation Limited Engineering and Construction Division 5475 Kellenburger Road Dayton, Ohio 45424-1099 U.S.A. Phone:
Chapter 1. Creating Sketches in. the Sketch Mode-I. Evaluation chapter. Logon to www.cadcim.com for more details. Learning Objectives
 Chapter 1 Creating Sketches in Learning Objectives the Sketch Mode-I After completing this chapter you will be able to: Use various tools to create a geometry. Dimension a sketch. Apply constraints to
CHAPTER 7 PROCESSING SURVEY DATA
 CHAPTER 7 PROCESSING SURVEY DATA Downloading the Trimble Survey Controller TSC2/TSC3 7-2 Introduction to InRoads Survey 7-3 Creating a Design File 7-3 Preferences 7-8 Viewing the Data 7-10 Correcting Errors
File Management Utility. T u t o r i a l
 File Management Utility T u t o r i a l Contents System Requirements... 2 Preparing Files for Transfer to GlobalMark... 2 Application Launch... 2 Printer Setup... 2 Communication Status... 4 Communication
Files Used in this Tutorial
 Generate Point Clouds Tutorial This tutorial shows how to generate point clouds from IKONOS satellite stereo imagery. You will view the point clouds in the ENVI LiDAR Viewer. The estimated time to complete
Ohio University Computer Services Center August, 2002 Crystal Reports Introduction Quick Reference Guide
 Open Crystal Reports From the Windows Start menu choose Programs and then Crystal Reports. Creating a Blank Report Ohio University Computer Services Center August, 2002 Crystal Reports Introduction Quick
Introduction to the TI-Nspire CX
 Introduction to the TI-Nspire CX Activity Overview: In this activity, you will become familiar with the layout of the TI-Nspire CX. Step 1: Locate the Touchpad. The Touchpad is used to navigate the cursor
Embroidery Fonts Plus ( EFP ) Tutorial Guide Version 1.0505
 Tutorial Guide Version 1.0505") Embroidery Fonts Plus ( EFP ) Tutorial Guide Version 1.0505 1 Contents Chapter 1 System Requirements.................. 3 Chapter 2 Quick Start Installation.................. 4 System Requirements................
Embroidery Fonts Plus ( EFP ) Tutorial Guide Version 1.0505 1 Contents Chapter 1 System Requirements.................. 3 Chapter 2 Quick Start Installation.................. 4 System Requirements................
SpaceClaim Introduction Training Session. A SpaceClaim Support Document
 SpaceClaim Introduction Training Session A SpaceClaim Support Document In this class we will walk through the basic tools used to create and modify models in SpaceClaim. Introduction We will focus on:
Basic 2D Design Be sure you have the latest information!
 Basic 2D Design mastercam x getting started tutorials Basic 2D Design December 2011 Be sure you have the latest information! Information might have been changed or added since this document was published.
Introduction to Autodesk Inventor for F1 in Schools
 Introduction to Autodesk Inventor for F1 in Schools F1 in Schools Race Car In this course you will be introduced to Autodesk Inventor, which is the centerpiece of Autodesk s digital prototyping strategy
Layout Tutorial. Getting Started
 Getting Started Layout Tutorial This tutorial will explain how create a layout template, send views to a layout page, then save the document in PDF format. In this tutorial you will learn about: Creating
Quickstart Tutorial. Bradford Technologies, Inc. 302 Piercy Road, San Jose, California 95138 800-622-8727 fax 408-360-8529 www.bradfordsoftware.
 Quickstart Tutorial A ClickFORMS Tutorial Page 2 Bradford Technologies. All Rights Reserved. No part of this document may be reproduced in any form or by any means without the written permission of Bradford
The following is an overview of lessons included in the tutorial.
 Chapter 2 Tutorial Tutorial Introduction This tutorial is designed to introduce you to some of Surfer's basic features. After you have completed the tutorial, you should be able to begin creating your
Ansur Test Executive. Users Manual
 Ansur Test Executive Users Manual April 2008 2008 Fluke Corporation, All rights reserved. All product names are trademarks of their respective companies Table of Contents 1 Introducing Ansur... 4 1.1 About
Practice Workbook. QuickStart for Roadway Modeling Using OpenRoads
 Practice Workbook This workbook is designed for use in Live instructor-led training and for OnDemand selfstudy. The explanations and demonstrations are provided by the instructor in the classroom, or in
Pro/ENGINEER Wildfire 4.0 Basic Design
 Introduction Datum features are non-solid features used during the construction of other features. The most common datum features include planes, axes, coordinate systems, and curves. Datum features do
11 Printing Designs. When you have completed this chapter, you will be able to:
 11 Printing Designs Creating printed documents is the end we have worked towards from the beginning of this course. We have already been introduced to it very briefly with Printing - A First Look on page
StrikeRisk v6.0 IEC/EN 62305-2 Risk Management Software Getting Started
 StrikeRisk v6.0 IEC/EN 62305-2 Risk Management Software Getting Started Contents StrikeRisk v6.0 Introduction 1/1 1 Installing StrikeRisk System requirements Installing StrikeRisk Installation troubleshooting
Creating Interactive PDF Forms
 Creating Interactive PDF Forms Using Adobe Acrobat X Pro Information Technology Services Outreach and Distance Learning Technologies Copyright 2012 KSU Department of Information Technology Services This
AccXES Account Management Tool Administrator s Guide Version 10.0
 AccXES Account Management Tool Administrator s Guide Version 10.0 701P41531 May 2004 Trademark Acknowledgments XEROX, AccXES, The Document Company, and the identifying product names and numbers herein
How To Use Gss Software In Trimble Business Center
 Trimble Business Center software technical notes Trimble Business Center Software Makes Processing GNSS Survey Data Effortless Trimble Business Center is powerful surveying office software designed to
Fireworks CS4 Tutorial Part 1: Intro
 Fireworks CS4 Tutorial Part 1: Intro This Adobe Fireworks CS4 Tutorial will help you familiarize yourself with this image editing software and help you create a layout for a website. Fireworks CS4 is the
CE 490 Transportation Engineering Network Analysis
 CE 490 Transportation Engineering Network Analysis The purpose of this assignment is to conduct a network analysis and gain some experience in emerging microcomputer analysis techniques. 1) Select a network
Data Visualization. Brief Overview of ArcMap
 Data Visualization Prepared by Francisco Olivera, Ph.D., P.E., Srikanth Koka and Lauren Walker Department of Civil Engineering September 13, 2006 Contents: Brief Overview of ArcMap Goals of the Exercise
Creating Electronic Portfolios using Microsoft Word and Excel
 Step-by-Step Creating Electronic Portfolios using Microsoft Word and Excel The Reflective Portfolio document will include the following: A Cover Page for the portfolio - Include a Picture or graphic A
Business Objects Version 5 : Introduction
 Business Objects Version 5 : Introduction Page 1 TABLE OF CONTENTS Introduction About Business Objects Changing Your Password Retrieving Pre-Defined Reports Formatting Your Report Using the Slice and Dice
Generative Drafting. Page 1 1997 2001 DASSAULT SYSTEMES. IBM Product Lifecycle Management Solutions / Dassault Systemes
 Generative Drafting Page 1 Tutorial Objectives Description This Tutorial is an introduction to Generative Drafting. Message To show how CATIA V5 allows the user to automatically generate associative drafting
User s Manual CAREpoint EMS Workstation D-Scribe Reporting System
 1838021B User s Manual CAREpoint EMS Workstation D-Scribe Reporting System EDITORS NOTE FORM BUILDER IS A PART OF D-SCRIBE S REPORTING SYSTEM (D-SCRIBE S FORM BUILDER). FORMS WHICH ARE CREATED AND/OR USED
http://school-maths.com Gerrit Stols
 For more info and downloads go to: http://school-maths.com Gerrit Stols Acknowledgements GeoGebra is dynamic mathematics open source (free) software for learning and teaching mathematics in schools. It
Introduction to Autodesk Inventor for F1 in Schools
 F1 in Schools race car Introduction to Autodesk Inventor for F1 in Schools In this course you will be introduced to Autodesk Inventor, which is the centerpiece of Autodesk s Digital Prototyping strategy
FDOT Plans Production Tools
 FDOT State Kit for AutoCAD Civil 3D Mike Racca CADD APPLICATIONS SUPPORT Florida Department of Transportation (ECSO) Email: [email protected] Phone: 850-245-1631 GENERAL Civil 3D Plan Production
Adobe Illustrator CS5 Part 1: Introduction to Illustrator
 CALIFORNIA STATE UNIVERSITY, LOS ANGELES INFORMATION TECHNOLOGY SERVICES Adobe Illustrator CS5 Part 1: Introduction to Illustrator Summer 2011, Version 1.0 Table of Contents Introduction...2 Downloading
Topography of an Origin Project and Workspace
 Origin Basics Topography of an Origin Project and Workspace When you start Origin, a new project opens displaying a worksheet window in the workspace. The worksheet is one type of window available in Origin.
Linkage 3.2. User s Guide
 Linkage 3.2 User s Guide David Rector Wednesday, April 06, 2016 Table of Contents Table of Contents... 2 Installation... 3 Running the Linkage Program... 3 Simple Mechanism Tutorial... 5 Mouse Operations...
How To Create A View Frame In 3D
 12/4/2008-10:00 am - 11:30 am Room:Palazzo O-P (5th) The Secrets of Cutting Plan and Profile Sheets in AutoCAD Civil 3D Michelle Rasmussen - Application Engineer, IMAGINiT Technologies CV304-1P In this
4 Manipulating Elements
 4 Manipulating Elements In the context of this course, Manipulation of elements means moving, copying, rotating, scaling and some other similar operations. We will find that manipulations are always a
Welcome to CorelDRAW, a comprehensive vector-based drawing and graphic-design program for the graphics professional.
 Workspace tour Welcome to CorelDRAW, a comprehensive vector-based drawing and graphic-design program for the graphics professional. In this tutorial, you will become familiar with the terminology and workspace
OPTAC Fleet Viewer. Instruction Manual
 OPTAC Fleet Viewer Instruction Manual Stoneridge Limited Claverhouse Industrial Park Dundee DD4 9UB Help-line Telephone Number: 0870 887 9256 E-Mail: [email protected] Document version 4.0 Part Number:
EMC Documentum Webtop
 EMC Documentum Webtop Version 6.5 User Guide P/N 300 007 239 A01 EMC Corporation Corporate Headquarters: Hopkinton, MA 01748 9103 1 508 435 1000 www.emc.com Copyright 1994 2008 EMC Corporation. All rights
Chapter 9. Editing Features. Learning Objectives
 Chapter 9 Editing Features Learning Objectives After completing this chapter, you will be able to: Edit features. Edit sketches of the sketch based features. Edit the sketch plane of the sketch based features.
NiceLabel Designer Standard User Guide
 NiceLabel Designer Standard User Guide English Edition Rev-1112 2012 Euro Plus d.o.o. All rights reserved. Euro Plus d.o.o. Poslovna cona A 2 SI-4208 Šenčur, Slovenia tel.: +386 4 280 50 00 fax: +386 4
3D Modeling in Vectorworks 2009 by Jonathan Pickup. mple
 3D Modeling in Vectorworks 2009 by Jonathan Pickup mple 3D Modeling in Vectorworks 2009 by Jonathan Pickup 3D Modeling Vectorworks 2009 Published by Nemetschek North America 2008 Jonathan Pickup Vectorworks
SketchUp Instructions
 SketchUp Instructions Every architect needs to know how to use SketchUp! SketchUp is free from Google just Google it and download to your computer. You can do just about anything with it, but it is especially
Getting Started with Excel 2008. Table of Contents
 Table of Contents Elements of An Excel Document... 2 Resizing and Hiding Columns and Rows... 3 Using Panes to Create Spreadsheet Headers... 3 Using the AutoFill Command... 4 Using AutoFill for Sequences...
Excel 2003 Tutorial I
 This tutorial was adapted from a tutorial by see its complete version at http://www.fgcu.edu/support/office2000/excel/index.html Excel 2003 Tutorial I Spreadsheet Basics Screen Layout Title bar Menu bar
Legal Notes. Regarding Trademarks. Model supported by the KX printer driver. 2010 KYOCERA MITA Corporation
 Legal Notes Unauthorized reproduction of all or part of this guide is prohibited. The information in this guide is subject to change for improvement without notice. We cannot be held liable for any problems
MICROSOFT OFFICE ACCESS 2007 - NEW FEATURES
 MICROSOFT OFFICE 2007 MICROSOFT OFFICE ACCESS 2007 - NEW FEATURES Exploring Access Creating and Working with Tables Finding and Filtering Data Working with Queries and Recordsets Working with Forms Working
Appendix D - Workflows / Tips and Tricks
 Appendix D - Workflows / Tips and Tricks It is a well known fact that most users of software applications use only a small amount of the commands and tools available to them. CDOT has created a Tips and
GeoEditor User Manual
 GeoEditor User Manual A tool for geological modelling and editing in GIS DHI Water & Environment October 2000 GeoEditor is a product made by the DHI in co-operation with the Geological Survey of Denmark
Teradata SQL Assistant Version 13.0 (.Net) Enhancements and Differences. Mike Dempsey
 Enhancements and Differences. Mike Dempsey") Teradata SQL Assistant Version 13.0 (.Net) Enhancements and Differences by Mike Dempsey Overview SQL Assistant 13.0 is an entirely new application that has been re-designed from the ground up. It has been
Teradata SQL Assistant Version 13.0 (.Net) Enhancements and Differences by Mike Dempsey Overview SQL Assistant 13.0 is an entirely new application that has been re-designed from the ground up. It has been
Fixplot Instruction Manual. (data plotting program)
") Fixplot Instruction Manual (data plotting program) MANUAL VERSION2 2004 1 1. Introduction The Fixplot program is a component program of Eyenal that allows the user to plot eye position data collected with
Fixplot Instruction Manual (data plotting program) MANUAL VERSION2 2004 1 1. Introduction The Fixplot program is a component program of Eyenal that allows the user to plot eye position data collected with
MET 306 Activity 6. Using Pro/MFG Milling Operations Creo 2.0. Machining a Mast Step
 Using Pro/MFG Milling Operations Creo 2.0 Machining a Mast Step If the Trim option is grayed out when trimming the mill volume, Save (making sure the.asm file is going to the correct subdirectory), Exit
ArcGIS Tutorial: Adding Attribute Data
 ArcGIS Tutorial: Adding Attribute Data Introduction A common need in GIS is to map characteristics, or attributes, of different geographic areas. These maps are called thematic maps. Examples of thematic
Table of Contents. INTRODUCTION...v. How to Use This Manual...v Terms Used in this Manual...v Fonts Used in this Manual...v
 Table of Contents INTRODUCTION...v How to Use This Manual...v Terms Used in this Manual...v Fonts Used in this Manual...v PC Hardware Requirements...vi Software Installation...vii Installing DataWorker
Excel 2007 Basic knowledge
 Ribbon menu The Ribbon menu system with tabs for various Excel commands. This Ribbon system replaces the traditional menus used with Excel 2003. Above the Ribbon in the upper-left corner is the Microsoft
BD CellQuest Pro Software Analysis Tutorial
 BD CellQuest Pro Analysis Tutorial This tutorial guides you through an analysis example using BD CellQuest Pro software. If you are already familiar with BD CellQuest Pro software on Mac OS 9, refer to
Navios Quick Reference
 Navios Quick Reference Purpose: The purpose of this Quick Reference is to provide a simple step by step outline of the information needed to perform various tasks on the system. We begin with basic tasks
2013 Getting Started Guide
 2013 Getting Started Guide The contents of this guide and accompanying exercises were originally created by Nemetschek Vectorworks, Inc. Vectorworks Fundamentals Getting Started Guide Created using: Vectorworks
User s Guide to ArcView 3.3 for Land Use Planners in Puttalam District
 User s Guide to ArcView 3.3 for Land Use Planners in Puttalam District Dilhari Weragodatenna IUCN Sri Lanka, Country Office Table of Content Page No Introduction...... 1 1. Getting started..... 2 2. Geo-referencing...
CATIA Drafting TABLE OF CONTENTS
 TABLE OF CONTENTS Introduction...1 Drafting...2 Drawing Screen...3 Pull-down Menus...4 File...4 Edit...5 View...6 Insert...7 Tools...8 Drafting Workbench...9 Views and Sheets...9 Dimensions and Annotations...10
Module One: Getting Started... 6. Opening Outlook... 6. Setting Up Outlook for the First Time... 7. Understanding the Interface...
 2 CONTENTS Module One: Getting Started... 6 Opening Outlook... 6 Setting Up Outlook for the First Time... 7 Understanding the Interface...12 Using Backstage View...14 Viewing Your Inbox...15 Closing Outlook...17
W13. Storm Drainage Layout with InRoads Storm & Sanitary. XM Edition TRN010130-1/0001
 W13 Storm Drainage Layout with InRoads Storm & Sanitary XM Edition TRN010130-1/0001 Copyright Information Trademarks AccuDraw, Bentley, the B Bentley logo, MDL, MicroStation and SmartLine are registered
NETWORK PRINT MONITOR User Guide
 NETWORK PRINT MONITOR User Guide Legal Notes Unauthorized reproduction of all or part of this guide is prohibited. The information in this guide is subject to change without notice. We cannot be held liable
7 Enclosed Areas. When you have completed this chapter, you will be able to:
 7 Enclosed Areas Our designs so far have consisted entirely of open linework, except for a brief introduction to Fill Attributes on page 3-15. Closed linework may delineate an Area, such as a section of
 FaxTalk FaxCenter Pro Because your faxes are important! Version 8 Send. Receive. Manage. FaxTalk FaxCenter Pro Version 8 Because your faxes are important! Copyright 1992-2010 Thought Communications, Inc.
Guide to Using AMS 4.0 Marking Software
 Guide to Using AMS 4.0 Marking Software Guide to Using AMS 4.0 Marking Software Contents System Requirements...2 Software Installation...2 Selecting the Output Device and Changing Settings...2 Definitions...
Welcome to FileMaker Pro
 Welcome to FileMaker Pro About this guide Welcome to the FileMaker Pro application from Claris Corporation. FileMaker Pro is designed to help you manage information easily and effectively. This installation
ZebraDesigner Pro. User Guide. 13857L-003 Rev. A
 ZebraDesigner Pro User Guide 13857L-003 Rev. A 2 2011 ZIH Corp. The copyrights in this manual and the software and/or firmware in the printer described therein are owned by ZIH Corp. and Zebra s licensors.
6. If you want to enter specific formats, click the Format Tab to auto format the information that is entered into the field.
 Adobe Acrobat Professional X Part 3 - Creating Fillable Forms Preparing the Form Create the form in Word, including underlines, images and any other text you would like showing on the form. Convert the
Introduction to MS WINDOWS XP
 Introduction to MS WINDOWS XP Mouse Desktop Windows Applications File handling Introduction to MS Windows XP 2 Table of Contents What is Windows XP?... 3 Windows within Windows... 3 The Desktop... 3 The
How To Draw On An Ipad With A Touch Tablet (For Free) On A Blackberry Or Ipad 2 (For A Sims) On An Easter Egg (For An Sims 2) On Blackberry 2 (Blackberry)
 On A Blackberry Or Ipad 2 (For A Sims) On An Easter Egg (For An Sims 2) On Blackberry 2 (Blackberry)") Apex v5 Pro (Assessor) Touch Tablet Module Tutorial This Tutorial: The drawing lesson in this tutorial guides you through the same sketch as our regular v5 Pro tutorial but highlights the Touch Tablet
Apex v5 Pro (Assessor) Touch Tablet Module Tutorial This Tutorial: The drawing lesson in this tutorial guides you through the same sketch as our regular v5 Pro tutorial but highlights the Touch Tablet
Ortelia Space Builder User Manual
 Ortelia Space Builder User Manual http://ortelia.com 1 Table of Contents Introducing Ortelia Space Builder... 2 System Requirements... 3 1. Operating system:... 3 2. Hardware:... 3 Minimum Graphics card
Working with Excel in Origin
 Working with Excel in Origin Limitations When Working with Excel in Origin To plot your workbook data in Origin, you must have Excel version 7 (Microsoft Office 95) or later installed on your computer
3D MultiVision SOFTWARE OPERATING INSTRUCTIONS
 MVL 3D MultiVision SOFTWARE OPERATING INSTRUCTIONS Changing the market from level to volume Accurate, reliable volume data from silos, open bins and warehouses where the diameters or areas are exceptionally
PLAY VIDEO. Close- Closes the file you are working on and takes you back to MicroStation V8i Open File dialog.
 Chapter Five Menus PLAY VIDEO INTRODUCTION To be able to utilize the many different menus and tools MicroStation V8i offers throughout the program and this guide, you must first be able to locate and understand
Lab 3. GIS Data Entry and Editing.
 Lab 3. GIS Data Entry and Editing. The goal: To learn about the vector (arc/node) and raster data types entry and editing. Objective: Create vector and raster datasets and visualize them. Software for
Korosi Monitoring System (KMS) Software Manual
 Software Manual") PT. KOROSI SPECINDO Corrosion Monitoring System Eng. Doc. No.: KS-MNL-KMS Korosi Monitoring System (KMS) Software Manual Revision Date Prepared Approved Description 0 23/05/2008 ES JH Issued for approval
PT. KOROSI SPECINDO Corrosion Monitoring System Eng. Doc. No.: KS-MNL-KMS Korosi Monitoring System (KMS) Software Manual Revision Date Prepared Approved Description 0 23/05/2008 ES JH Issued for approval
Cabcharge Australia Limited, 2005. Cabcharge TMS Help Manual
 Cabcharge TMS Help Manual Cabcharge Australia Limited, 2005 p1 p2 Table of Contents Welcome to TMS 5 A Brief Overview 6 Getting Started 8 System Requirements 8 Downloading Statement Data 9 Set up your
APPENDIX B: FEMA 452: Risk Assessment Database V5.0. User Guide
 APPENDIX B: FEMA 452: Risk Assessment Database V5.0 User Guide INTRODUCTION... 5 DATABASE ADMINISTRATOR INFORMATION... 6 INSTALLATION PROCESS... 8 USE OF THE DATABASE... 10 OPENING THE DATABASE... 12 FACILITY
Maple Quick Start. Introduction. Talking to Maple. Using [ENTER] 3 (2.1)
![Maple Quick Start. Introduction. Talking to Maple. Using [ENTER] 3 (2.1)](/thumbs/19/376447.jpg "Maple Quick Start. Introduction. Talking to Maple. Using [ENTER] 3 (2.1)") Introduction Maple Quick Start In this introductory course, you will become familiar with and comfortable in the Maple environment. You will learn how to use context menus, task assistants, and palettes
Introduction Maple Quick Start In this introductory course, you will become familiar with and comfortable in the Maple environment. You will learn how to use context menus, task assistants, and palettes
LANDWorksCAD for AutoCAD and Bricscad. Professional Landscape Design Software. Reference and User Manual. CAD International
 LANDWorksCAD for AutoCAD and Bricscad Professional Landscape Design Software Reference and User Manual CAD International www.cad.com.au www.cadinternational.com 2006-2012 - All rights reserved This page
F9 Integration Manager
 F9 Integration Manager User Guide for use with QuickBooks This guide outlines the integration steps and processes supported for the purposes of financial reporting with F9 Professional and F9 Integration
Table of Contents. Part I Welcome. Part II Introduction. Part III Getting Started. Part IV The User Interface. Part V Quick Start Tutorials
 Contents I Table of Contents Part I Welcome 5 Part II Introduction 5 1 Overview... 5 2 Product... Levels 5 3 Technical... Support 6 4 Copyright... 7 Part III Getting Started 7 1 Installation... 7 2 Register...