Systat: Statistical Visualization Software
|
|
|
- Alban Garrett
- 10 years ago
- Views:
Transcription

1 Systat: Statistical Visualization Software Hilary R. Hafner Jennifer L. DeWinter Steven G. Brown Theresa E. O Brien Sonoma Technology, Inc. Petaluma, CA Presented in Toledo, OH October 28, 2011 STI

2 Topics to Cover Systat basics What is Systat? Why use Systat? Overview of the user interface Resources Command language vs. menus Importing data Accepted file types Formatting Limitations Tips and tricks Analysis tools Graphs and analyses Statistics Data manipulation Command language vs. menus Creating variables, appends/merges, transformations, selections, and grouping Saving output Graph customizations Advanced graphs and analyses Regression, significance tests, nonparametric tests, factor analysis, cluster analysis, and analysis of variance (ANOVA) TOPICS 2

3 What Is Systat? Systat is statistical and graphical analysis software that allows you to explore your data using both menus and a batch command language (similar to macros) TNMOC BENZW 10 5 YEAR HOUR Count Count INTRODUCTION 3
 1500 15 TNMOC 1000 500 BENZW 10 5 YEAR 0 0 8 16 24 HOUR 0 3000")
4 Why Use Systat? In data analysis, we nearly always need to investigate central tendencies, correlations, trends, and other statistical descriptions of data Systat s graphical interface allows the analyst to immediately see the data and rapidly generate and regenerate graphs for review Systat contains statistical functions not found in Excel or Access INTRODUCTION 4


5 Systat Basics Graphical User Interface Viewspace Workspace Commandspace INTRODUCTION 5

 Output (filename.syo) Command (filename.")
6 Systat Basics File Types Data (filename.syd,.syz) Output (filename.syo) Command (filename.syc) INTRODUCTION 6
 Command (filename.")

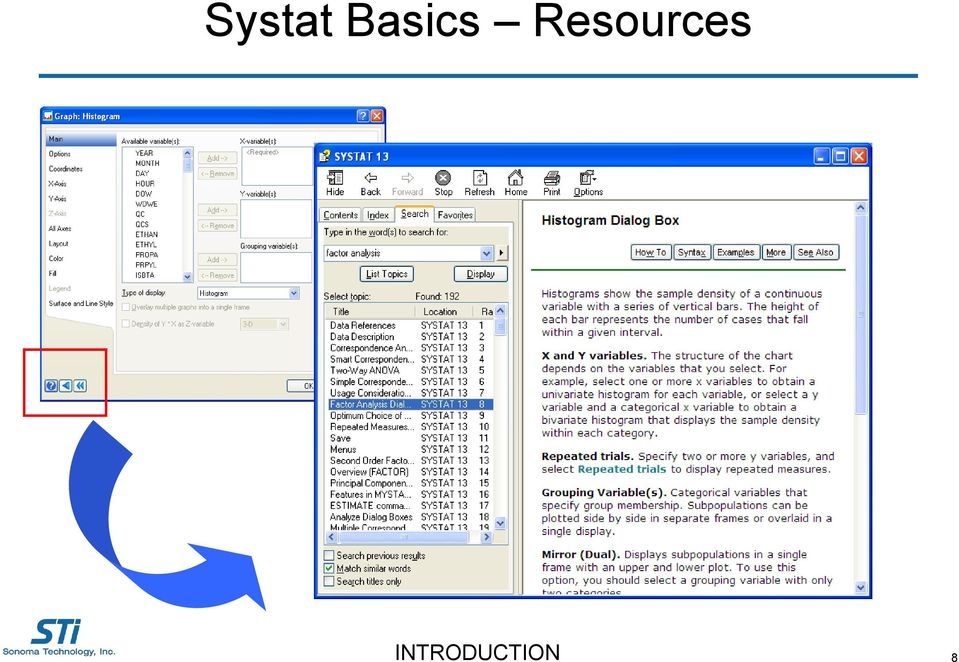
7 Systat Basics Resources Help a click away Index Search Mouse-overs, F1 key? button Command line Manuals Examples Training videos at Useful: Interface, data, graph, help INTRODUCTION 7


8 Systat Basics Resources INTRODUCTION 8
9 Command Language vs. Menus Systat is a Windows menu driven package, but full coverage of the menu is provided in the command language Commands are useful for repetitive analyses (and we almost never do anything just once!) Commands help the analyst document analyses that have been performed and where the output is stored Commands can be used in future analyses Log window in Systat records most actions Commands = faster! INTRODUCTION 10
 Commands help the analyst document analyses that have been performed and where the output is stored")
10 Importing Data into Systat Accepted file formats Limitations Data formatting Tips and tricks IMPORTING DATA 12


11 $ signifies text field. signifies missing data Names > 1 word require underline char. Text field is left-justified. IMPORTING DATA 16

12 Tricks and Tips with Excel Data sets can be processed in Excel prior to bringing them into Systat Make date/time conversions and calculations in Excel (convert date/time into separate fields for day of week, month, day, year, etc.) Prepare sums and other calculations easily performed in Excel Copy/paste values to remove all formulae Check that records are continuous Replace missing values (e.g., -999) with. (Systat s missing value code) Save as Excel (designate by NAME_sys.xls) Note that only one page of a workbook can be selected per import Hot tip: Systat doesn t like the variable name temp IMPORTING DATA 17
 with. (Systat s missing value code) Save as Excel (designate by NAME_sys.")

13 Exploring Your Variables Ozone data: right click on variable statistics 19

14 O3 O3 Common Graphs and Analyses Systat can create numerous types of graphs and plots and perform many statistical functions The analyst must determine the appropriate plot(s) to answer different types of questions ,993 1,994 1,995 1,996 1,997 1,998 YEAR 1,999 2,000 2,001 2,002 WDWE DATA ANALYSIS TEMP

15 Commonly Used Plots and Statistical Functions Summary statistics quantify data characteristics Histograms understand data distribution Bar charts compare quantities (counts, or means) Scatter plots understand relationships Box plots compare distribution and central tendencies Scatter plot matrices compare many relationships Correlation analysis quantify relationships Linear regression identify predictive variables Open (WY_Site0123_data_ct.syz) DATA ANALYSIS 23

16 Conc. (ppb) Summary Statistics Used for Trends Plots Average Ozone Hour Diurnal trends in median ozone concentrations for a Wyoming site from 2005 to 2008 Overall increase in average ozone concentrations observed less titration? Plot was created in Excel from Systat summary statistics by year and hour DATA ANALYSIS 26

17 NO2 Scatter Plots Scatter plots are useful for determining relationships between variables S25LC_ SO425LC_7 Sulfur vs. Sulfate These plots are useful for both data validation and analysis Are there outliers, and if so, how do they affect comparisons? What are the similarities/differences between parameters? O3 NO 2 vs. Ozone DATA ANALYSIS 27

18 NO2 Example of Scatter Plot Do we see the expected relationships? REM The following command (PLOT) REM creates a scatter plot of NO2 REM concentrations by wind direction REM and year. PLOT NO2*RD / OVERLAY GROUP = {YEAR} RD YEAR 2,005 2,006 2,007 2,008 This graphic explores NO 2 concentrations and resultant wind direction as a function of year. Is there a change in the direction of high concentrations in this time period? DATA ANALYSIS 28

19 Box-Whisker Plots Sample box-whisker plot and a notched box whisker plot as defined by Systat Always define this plot because different packages have different definitions DATA ANALYSIS Confidence Interval (CI) for a population parameter is an interval with an associated probability p that is generated from a random sample of an underlying population such that if the sampling was repeated numerous times and the confidence interval recalculated from each sample according to the same method, a proportion p of the confidence intervals would contain the population parameter in question. 29

20 Example of a Notched Box-Whisker Plot Notched box-whisker plots are useful for showing the central trends of the data (i.e., the median) while also showing variability (i.e., the box and whiskers) REM The following command (DENSITY) REM creates a notched box plot of ozone REM concentrations by year. DENSITY O3 * YEAR / BOX NOTCH COLOR=BLACK O3 = ozone (ppb) DATA ANALYSIS 30

21 Linear and Nonlinear Regression Regression analyses identify and quantify predictive relationships between variables Options Multiple linear regression Stepwise regression Automatic outlier and influential point detection Plots of residuals vs. predicted values Many nonlinear regression forms DATA ANALYSIS 36
22 Example Linear Regression Analysis Before performing linear regression, it is vital to examine a scatter plot of the data! Outliers at the ends of data set highly influence linear regression Total nonmethane organic compounds (TNMOC) and NO x at 7 a.m. in an urban setting should have relatively good correlation DATA ANALYSIS 38
23 Example Results Effect Coefficient Standard Error Std. Coefficient Tolerance t p-value CONSTANT NOX Final equation: TNMOC =2.5(NOx)+28.1 Dependent Variable TNMOC N 502 Multiple R Squared Multiple R Adjusted Squared Multiple R Standard Error of Estimate Case 344 is an Outlier (Studentized Residual : ) Case 2,360 has large Leverage (Leverage : 0.053) Case 2,576 has large Leverage (Leverage : 0.047) Case 2,648 has large Leverage (Leverage : 0.038) Case 2,936 has large Leverage (Leverage : 0.036) Case 5,408 has large Leverage (Leverage : 0.036) Random Scatter Desired Case 8,028 is an Outlier (Studentized Residual : 5.155) Case 11,490 has large Leverage (Leverage : 0.047) Case 14,536 has large Leverage (Leverage : 0.060) Case 16,240 has large Leverage (Leverage : 0.040) Case 17,488 has large Leverage (Leverage : 0.045) Case 18,256 has large Leverage (Leverage : 0.047) Case 19,432 is an Outlier (Studentized Residual : ) 39
24 Summary Systat is a powerful graphical statistical tool Explore options and learn statistics through use of the Help facility and examples Share your command files, tips, and tricks with other users SUMMARY 71
25 Appendix Key Systat Commands Box plot in black and white DENSITY benz*year / BOX NOTCH COLOR=BLACK Save output, graphs OSAVE file path and name /rtf (best for multiple graphs such as with by command) GSAVE file path and name /wmf (also saves.bmp,.emf,.pct,.eps,.pg, and.cgm formats) Save file path and name Export to Excel EXPORT file path and name.xls /type=excel Note that this saves only 16,000 lines!!! (Excel 3.0) APPENDIX 72
26 Appendix Key Systat Commands Select range of data SELECT QCS=0 AND month>5 AND Month<10 Scatter plot matrix SPLOM var1 var2 etc. / half color=black Setting coordinates DENSITY benz*hour / BOX NOTCH COLOR=BLACK xmin=0 xmax=24 xtick =6 APPENDIX 73
27 Appendix Troubleshooting Ideas Importing Remove any formulas or formatting in file Make sure there are no gaps (empty lines) Make sure each column is uniquely named Save as Excel 3.0 or tab-delimited.txt Scripts Go via menu and compare log with script Move the stats line one line up or down APPENDIX 74
KSTAT MINI-MANUAL. Decision Sciences 434 Kellogg Graduate School of Management
 KSTAT MINI-MANUAL Decision Sciences 434 Kellogg Graduate School of Management Kstat is a set of macros added to Excel and it will enable you to do the statistics required for this course very easily. To
business statistics using Excel OXFORD UNIVERSITY PRESS Glyn Davis & Branko Pecar
 business statistics using Excel Glyn Davis & Branko Pecar OXFORD UNIVERSITY PRESS Detailed contents Introduction to Microsoft Excel 2003 Overview Learning Objectives 1.1 Introduction to Microsoft Excel
Multiple Regression in SPSS This example shows you how to perform multiple regression. The basic command is regression : linear.
 Multiple Regression in SPSS This example shows you how to perform multiple regression. The basic command is regression : linear. In the main dialog box, input the dependent variable and several predictors.
Exercise 1.12 (Pg. 22-23)
") Individuals: The objects that are described by a set of data. They may be people, animals, things, etc. (Also referred to as Cases or Records) Variables: The characteristics recorded about each individual.
Individuals: The objects that are described by a set of data. They may be people, animals, things, etc. (Also referred to as Cases or Records) Variables: The characteristics recorded about each individual.
EPA's Data Analysis and Reporting Tool (DART)
") EPA's Data Analysis and Reporting Tool (DART) Jennifer DeWinter, Hilary Hafner Sonoma Technology, Inc. Petaluma, CA on behalf of the EPA OAQPS PAMS Program National Air Toxics Workshop October 27, 2015
EPA's Data Analysis and Reporting Tool (DART) Jennifer DeWinter, Hilary Hafner Sonoma Technology, Inc. Petaluma, CA on behalf of the EPA OAQPS PAMS Program National Air Toxics Workshop October 27, 2015
Doing Multiple Regression with SPSS. In this case, we are interested in the Analyze options so we choose that menu. If gives us a number of choices:
 Doing Multiple Regression with SPSS Multiple Regression for Data Already in Data Editor Next we want to specify a multiple regression analysis for these data. The menu bar for SPSS offers several options:
430 Statistics and Financial Mathematics for Business
 Prescription: 430 Statistics and Financial Mathematics for Business Elective prescription Level 4 Credit 20 Version 2 Aim Students will be able to summarise, analyse, interpret and present data, make predictions
Diagrams and Graphs of Statistical Data
 Diagrams and Graphs of Statistical Data One of the most effective and interesting alternative way in which a statistical data may be presented is through diagrams and graphs. There are several ways in
Spreadsheet software for linear regression analysis
 Spreadsheet software for linear regression analysis Robert Nau Fuqua School of Business, Duke University Copies of these slides together with individual Excel files that demonstrate each program are available
Simple Predictive Analytics Curtis Seare
 Using Excel to Solve Business Problems: Simple Predictive Analytics Curtis Seare Copyright: Vault Analytics July 2010 Contents Section I: Background Information Why use Predictive Analytics? How to use
Directions for using SPSS
 Directions for using SPSS Table of Contents Connecting and Working with Files 1. Accessing SPSS... 2 2. Transferring Files to N:\drive or your computer... 3 3. Importing Data from Another File Format...
An introduction to using Microsoft Excel for quantitative data analysis
 Contents An introduction to using Microsoft Excel for quantitative data analysis 1 Introduction... 1 2 Why use Excel?... 2 3 Quantitative data analysis tools in Excel... 3 4 Entering your data... 6 5 Preparing
Business Statistics. Successful completion of Introductory and/or Intermediate Algebra courses is recommended before taking Business Statistics.
 Business Course Text Bowerman, Bruce L., Richard T. O'Connell, J. B. Orris, and Dawn C. Porter. Essentials of Business, 2nd edition, McGraw-Hill/Irwin, 2008, ISBN: 978-0-07-331988-9. Required Computing
MTH 140 Statistics Videos
 MTH 140 Statistics Videos Chapter 1 Picturing Distributions with Graphs Individuals and Variables Categorical Variables: Pie Charts and Bar Graphs Categorical Variables: Pie Charts and Bar Graphs Quantitative
GeoGebra Statistics and Probability
 GeoGebra Statistics and Probability Project Maths Development Team 2013 www.projectmaths.ie Page 1 of 24 Index Activity Topic Page 1 Introduction GeoGebra Statistics 3 2 To calculate the Sum, Mean, Count,
Using Excel (Microsoft Office 2007 Version) for Graphical Analysis of Data
 for Graphical Analysis of Data") Using Excel (Microsoft Office 2007 Version) for Graphical Analysis of Data Introduction In several upcoming labs, a primary goal will be to determine the mathematical relationship between two variable
Using Excel (Microsoft Office 2007 Version) for Graphical Analysis of Data Introduction In several upcoming labs, a primary goal will be to determine the mathematical relationship between two variable
Bill Burton Albert Einstein College of Medicine [email protected] April 28, 2014 EERS: Managing the Tension Between Rigor and Resources 1
 Bill Burton Albert Einstein College of Medicine [email protected] April 28, 2014 EERS: Managing the Tension Between Rigor and Resources 1 Calculate counts, means, and standard deviations Produce
1) Write the following as an algebraic expression using x as the variable: Triple a number subtracted from the number
 Write the following as an algebraic expression using x as the variable: Triple a number subtracted from the number") 1) Write the following as an algebraic expression using x as the variable: Triple a number subtracted from the number A. 3(x - x) B. x 3 x C. 3x - x D. x - 3x 2) Write the following as an algebraic expression
1) Write the following as an algebraic expression using x as the variable: Triple a number subtracted from the number A. 3(x - x) B. x 3 x C. 3x - x D. x - 3x 2) Write the following as an algebraic expression
Univariate Regression
 Univariate Regression Correlation and Regression The regression line summarizes the linear relationship between 2 variables Correlation coefficient, r, measures strength of relationship: the closer r is
NCSS Statistical Software Principal Components Regression. In ordinary least squares, the regression coefficients are estimated using the formula ( )
") Chapter 340 Principal Components Regression Introduction is a technique for analyzing multiple regression data that suffer from multicollinearity. When multicollinearity occurs, least squares estimates
Chapter 340 Principal Components Regression Introduction is a technique for analyzing multiple regression data that suffer from multicollinearity. When multicollinearity occurs, least squares estimates
Chapter 7: Simple linear regression Learning Objectives
 Chapter 7: Simple linear regression Learning Objectives Reading: Section 7.1 of OpenIntro Statistics Video: Correlation vs. causation, YouTube (2:19) Video: Intro to Linear Regression, YouTube (5:18) -
There are six different windows that can be opened when using SPSS. The following will give a description of each of them.
 SPSS Basics Tutorial 1: SPSS Windows There are six different windows that can be opened when using SPSS. The following will give a description of each of them. The Data Editor The Data Editor is a spreadsheet
EPA's Data Analysis and Reporting Tool (DART)
") EPA's Data Analysis and Reporting Tool (DART) Jennifer DeWinter, Hilary Hafner Sonoma Technology, Inc. Petaluma, CA on behalf of the EPA OAQPS PAMS Program National Air Toxics Workshop October 27, 2015
EPA's Data Analysis and Reporting Tool (DART) Jennifer DeWinter, Hilary Hafner Sonoma Technology, Inc. Petaluma, CA on behalf of the EPA OAQPS PAMS Program National Air Toxics Workshop October 27, 2015
03 The full syllabus. 03 The full syllabus continued. For more information visit www.cimaglobal.com PAPER C03 FUNDAMENTALS OF BUSINESS MATHEMATICS
 0 The full syllabus 0 The full syllabus continued PAPER C0 FUNDAMENTALS OF BUSINESS MATHEMATICS Syllabus overview This paper primarily deals with the tools and techniques to understand the mathematics
1. What is the critical value for this 95% confidence interval? CV = z.025 = invnorm(0.025) = 1.96
 = 1.96") 1 Final Review 2 Review 2.1 CI 1-propZint Scenario 1 A TV manufacturer claims in its warranty brochure that in the past not more than 10 percent of its TV sets needed any repair during the first two years
1 Final Review 2 Review 2.1 CI 1-propZint Scenario 1 A TV manufacturer claims in its warranty brochure that in the past not more than 10 percent of its TV sets needed any repair during the first two years
Microsoft Excel. Qi Wei
 Microsoft Excel Qi Wei Excel (Microsoft Office Excel) is a spreadsheet application written and distributed by Microsoft for Microsoft Windows and Mac OS X. It features calculation, graphing tools, pivot
Course Text. Required Computing Software. Course Description. Course Objectives. StraighterLine. Business Statistics
 Course Text Business Statistics Lind, Douglas A., Marchal, William A. and Samuel A. Wathen. Basic Statistics for Business and Economics, 7th edition, McGraw-Hill/Irwin, 2010, ISBN: 9780077384470 [This
Chapter 13 Introduction to Linear Regression and Correlation Analysis
 Chapter 3 Student Lecture Notes 3- Chapter 3 Introduction to Linear Regression and Correlation Analsis Fall 2006 Fundamentals of Business Statistics Chapter Goals To understand the methods for displaing
How To Use Statgraphics Centurion Xvii (Version 17) On A Computer Or A Computer (For Free)
 On A Computer Or A Computer (For Free)") Statgraphics Centurion XVII (currently in beta test) is a major upgrade to Statpoint's flagship data analysis and visualization product. It contains 32 new statistical procedures and significant upgrades
Statgraphics Centurion XVII (currently in beta test) is a major upgrade to Statpoint's flagship data analysis and visualization product. It contains 32 new statistical procedures and significant upgrades
Silvermine House Steenberg Office Park, Tokai 7945 Cape Town, South Africa Telephone: +27 21 702 4666 www.spss-sa.com
 SPSS-SA Silvermine House Steenberg Office Park, Tokai 7945 Cape Town, South Africa Telephone: +27 21 702 4666 www.spss-sa.com SPSS-SA Training Brochure 2009 TABLE OF CONTENTS 1 SPSS TRAINING COURSES FOCUSING
EXCEL Tutorial: How to use EXCEL for Graphs and Calculations.
 EXCEL Tutorial: How to use EXCEL for Graphs and Calculations. Excel is powerful tool and can make your life easier if you are proficient in using it. You will need to use Excel to complete most of your
Generating ABI PRISM 7700 Standard Curve Plots in a Spreadsheet Program
 Generating ABI PRISM 7700 Standard Curve Plots in a Spreadsheet Program Overview The goal of this tutorial is to demonstrate the procedure through which analyzed data generated within an ABI PRISM 7700
Data analysis and regression in Stata
 Data analysis and regression in Stata This handout shows how the weekly beer sales series might be analyzed with Stata (the software package now used for teaching stats at Kellogg), for purposes of comparing
Minitab Tutorials for Design and Analysis of Experiments. Table of Contents
 Table of Contents Introduction to Minitab...2 Example 1 One-Way ANOVA...3 Determining Sample Size in One-way ANOVA...8 Example 2 Two-factor Factorial Design...9 Example 3: Randomized Complete Block Design...14
SPSS Tests for Versions 9 to 13
 SPSS Tests for Versions 9 to 13 Chapter 2 Descriptive Statistic (including median) Choose Analyze Descriptive statistics Frequencies... Click on variable(s) then press to move to into Variable(s): list
Engineering Problem Solving and Excel. EGN 1006 Introduction to Engineering
 Engineering Problem Solving and Excel EGN 1006 Introduction to Engineering Mathematical Solution Procedures Commonly Used in Engineering Analysis Data Analysis Techniques (Statistics) Curve Fitting techniques
How To Run Statistical Tests in Excel
 How To Run Statistical Tests in Excel Microsoft Excel is your best tool for storing and manipulating data, calculating basic descriptive statistics such as means and standard deviations, and conducting
Chapter 23. Inferences for Regression
 Chapter 23. Inferences for Regression Topics covered in this chapter: Simple Linear Regression Simple Linear Regression Example 23.1: Crying and IQ The Problem: Infants who cry easily may be more easily
Statistical Models in R
 Statistical Models in R Some Examples Steven Buechler Department of Mathematics 276B Hurley Hall; 1-6233 Fall, 2007 Outline Statistical Models Linear Models in R Regression Regression analysis is the appropriate
STATISTICAL ANALYSIS WITH EXCEL COURSE OUTLINE
 STATISTICAL ANALYSIS WITH EXCEL COURSE OUTLINE Perhaps Microsoft has taken pains to hide some of the most powerful tools in Excel. These add-ins tools work on top of Excel, extending its power and abilities
Bowerman, O'Connell, Aitken Schermer, & Adcock, Business Statistics in Practice, Canadian edition
 Bowerman, O'Connell, Aitken Schermer, & Adcock, Business Statistics in Practice, Canadian edition Online Learning Centre Technology Step-by-Step - Excel Microsoft Excel is a spreadsheet software application
TIPS FOR DOING STATISTICS IN EXCEL
 TIPS FOR DOING STATISTICS IN EXCEL Before you begin, make sure that you have the DATA ANALYSIS pack running on your machine. It comes with Excel. Here s how to check if you have it, and what to do if you
Multiple Linear Regression
 Multiple Linear Regression A regression with two or more explanatory variables is called a multiple regression. Rather than modeling the mean response as a straight line, as in simple regression, it is
Data exploration with Microsoft Excel: analysing more than one variable
 Data exploration with Microsoft Excel: analysing more than one variable Contents 1 Introduction... 1 2 Comparing different groups or different variables... 2 3 Exploring the association between categorical
IBM SPSS Statistics 20 Part 4: Chi-Square and ANOVA
 CALIFORNIA STATE UNIVERSITY, LOS ANGELES INFORMATION TECHNOLOGY SERVICES IBM SPSS Statistics 20 Part 4: Chi-Square and ANOVA Summer 2013, Version 2.0 Table of Contents Introduction...2 Downloading the
Using Excel for Statistical Analysis
 Using Excel for Statistical Analysis You don t have to have a fancy pants statistics package to do many statistical functions. Excel can perform several statistical tests and analyses. First, make sure
Figure 1. An embedded chart on a worksheet.
 8. Excel Charts and Analysis ToolPak Charts, also known as graphs, have been an integral part of spreadsheets since the early days of Lotus 1-2-3. Charting features have improved significantly over the
X X X a) perfect linear correlation b) no correlation c) positive correlation (r = 1) (r = 0) (0 < r < 1)
 perfect linear correlation b) no correlation c) positive correlation (r = 1) (r = 0) (0 < r < 1)") CORRELATION AND REGRESSION / 47 CHAPTER EIGHT CORRELATION AND REGRESSION Correlation and regression are statistical methods that are commonly used in the medical literature to compare two or more variables.
CORRELATION AND REGRESSION / 47 CHAPTER EIGHT CORRELATION AND REGRESSION Correlation and regression are statistical methods that are commonly used in the medical literature to compare two or more variables.
Please follow these guidelines when preparing your answers:
 PR- ASSIGNMNT 3000500 Quantitative mpirical Research The objective of the pre- assignment is to review the course prerequisites and get familiar with SPSS software. The assignment consists of three parts:
Psychology 205: Research Methods in Psychology
 Psychology 205: Research Methods in Psychology Using R to analyze the data for study 2 Department of Psychology Northwestern University Evanston, Illinois USA November, 2012 1 / 38 Outline 1 Getting ready
Predictor Coef StDev T P Constant 970667056 616256122 1.58 0.154 X 0.00293 0.06163 0.05 0.963. S = 0.5597 R-Sq = 0.0% R-Sq(adj) = 0.
 = 0.") Statistical analysis using Microsoft Excel Microsoft Excel spreadsheets have become somewhat of a standard for data storage, at least for smaller data sets. This, along with the program often being packaged
Statistical analysis using Microsoft Excel Microsoft Excel spreadsheets have become somewhat of a standard for data storage, at least for smaller data sets. This, along with the program often being packaged
A Correlation of. to the. South Carolina Data Analysis and Probability Standards
 A Correlation of to the South Carolina Data Analysis and Probability Standards INTRODUCTION This document demonstrates how Stats in Your World 2012 meets the indicators of the South Carolina Academic Standards
Introduction to Regression and Data Analysis
 Statlab Workshop Introduction to Regression and Data Analysis with Dan Campbell and Sherlock Campbell October 28, 2008 I. The basics A. Types of variables Your variables may take several forms, and it
Module 5: Statistical Analysis
 Module 5: Statistical Analysis To answer more complex questions using your data, or in statistical terms, to test your hypothesis, you need to use more advanced statistical tests. This module reviews the
Lean Six Sigma Black Belt-EngineRoom
 Lean Six Sigma Black Belt-EngineRoom Course Content and Outline Total Estimated Hours: 140.65 *Course includes choice of software: EngineRoom (included for free), Minitab (must purchase separately) or
Simple linear regression
 Simple linear regression Introduction Simple linear regression is a statistical method for obtaining a formula to predict values of one variable from another where there is a causal relationship between
From The Little SAS Book, Fifth Edition. Full book available for purchase here.
 From The Little SAS Book, Fifth Edition. Full book available for purchase here. Acknowledgments ix Introducing SAS Software About This Book xi What s New xiv x Chapter 1 Getting Started Using SAS Software
Data exploration with Microsoft Excel: univariate analysis
 Data exploration with Microsoft Excel: univariate analysis Contents 1 Introduction... 1 2 Exploring a variable s frequency distribution... 2 3 Calculating measures of central tendency... 16 4 Calculating
Nominal and Real U.S. GDP 1960-2001
 Problem Set #5-Key Sonoma State University Dr. Cuellar Economics 318- Managerial Economics Use the data set for gross domestic product (gdp.xls) to answer the following questions. (1) Show graphically
How Does My TI-84 Do That
 How Does My TI-84 Do That A guide to using the TI-84 for statistics Austin Peay State University Clarksville, Tennessee How Does My TI-84 Do That A guide to using the TI-84 for statistics Table of Contents
5. Linear Regression
 5. Linear Regression Outline.................................................................... 2 Simple linear regression 3 Linear model............................................................. 4
Tutorial on Using Excel Solver to Analyze Spin-Lattice Relaxation Time Data
 Tutorial on Using Excel Solver to Analyze Spin-Lattice Relaxation Time Data In the measurement of the Spin-Lattice Relaxation time T 1, a 180 o pulse is followed after a delay time of t with a 90 o pulse,
Using R for Linear Regression
 Using R for Linear Regression In the following handout words and symbols in bold are R functions and words and symbols in italics are entries supplied by the user; underlined words and symbols are optional
Dealing with Data in Excel 2010
 Dealing with Data in Excel 2010 Excel provides the ability to do computations and graphing of data. Here we provide the basics and some advanced capabilities available in Excel that are useful for dealing
Using Excel for Statistics Tips and Warnings
 Using Excel for Statistics Tips and Warnings November 2000 University of Reading Statistical Services Centre Biometrics Advisory and Support Service to DFID Contents 1. Introduction 3 1.1 Data Entry and
Scatter Plots with Error Bars
 Chapter 165 Scatter Plots with Error Bars Introduction The procedure extends the capability of the basic scatter plot by allowing you to plot the variability in Y and X corresponding to each point. Each
Introduction to Exploratory Data Analysis
 Introduction to Exploratory Data Analysis A SpaceStat Software Tutorial Copyright 2013, BioMedware, Inc. (www.biomedware.com). All rights reserved. SpaceStat and BioMedware are trademarks of BioMedware,
SPSS Introduction. Yi Li
 SPSS Introduction Yi Li Note: The report is based on the websites below http://glimo.vub.ac.be/downloads/eng_spss_basic.pdf http://academic.udayton.edu/gregelvers/psy216/spss http://www.nursing.ucdenver.edu/pdf/factoranalysishowto.pdf
Getting started in Excel
 Getting started in Excel Disclaimer: This guide is not complete. It is rather a chronicle of my attempts to start using Excel for data analysis. As I use a Mac with OS X, these directions may need to be
Using Excel for descriptive statistics
 FACT SHEET Using Excel for descriptive statistics Introduction Biologists no longer routinely plot graphs by hand or rely on calculators to carry out difficult and tedious statistical calculations. These
MULTIPLE REGRESSION EXAMPLE
 MULTIPLE REGRESSION EXAMPLE For a sample of n = 166 college students, the following variables were measured: Y = height X 1 = mother s height ( momheight ) X 2 = father s height ( dadheight ) X 3 = 1 if
The importance of graphing the data: Anscombe s regression examples
 The importance of graphing the data: Anscombe s regression examples Bruce Weaver Northern Health Research Conference Nipissing University, North Bay May 30-31, 2008 B. Weaver, NHRC 2008 1 The Objective
Fairfield Public Schools
 Mathematics Fairfield Public Schools AP Statistics AP Statistics BOE Approved 04/08/2014 1 AP STATISTICS Critical Areas of Focus AP Statistics is a rigorous course that offers advanced students an opportunity
STATS8: Introduction to Biostatistics. Data Exploration. Babak Shahbaba Department of Statistics, UCI
 STATS8: Introduction to Biostatistics Data Exploration Babak Shahbaba Department of Statistics, UCI Introduction After clearly defining the scientific problem, selecting a set of representative members
Once saved, if the file was zipped you will need to unzip it. For the files that I will be posting you need to change the preferences.
 1 Commands in JMP and Statcrunch Below are a set of commands in JMP and Statcrunch which facilitate a basic statistical analysis. The first part concerns commands in JMP, the second part is for analysis
Tableau Your Data! Wiley. with Tableau Software. the InterWorks Bl Team. Fast and Easy Visual Analysis. Daniel G. Murray and
 Tableau Your Data! Fast and Easy Visual Analysis with Tableau Software Daniel G. Murray and the InterWorks Bl Team Wiley Contents Foreword xix Introduction xxi Part I Desktop 1 1 Creating Visual Analytics
Below is a very brief tutorial on the basic capabilities of Excel. Refer to the Excel help files for more information.
 Excel Tutorial Below is a very brief tutorial on the basic capabilities of Excel. Refer to the Excel help files for more information. Working with Data Entering and Formatting Data Before entering data
Simple Linear Regression
 STAT 101 Dr. Kari Lock Morgan Simple Linear Regression SECTIONS 9.3 Confidence and prediction intervals (9.3) Conditions for inference (9.1) Want More Stats??? If you have enjoyed learning how to analyze
(More Practice With Trend Forecasts)
") Stats for Strategy HOMEWORK 11 (Topic 11 Part 2) (revised Jan. 2016) DIRECTIONS/SUGGESTIONS You may conveniently write answers to Problems A and B within these directions. Some exercises include special
Stats for Strategy HOMEWORK 11 (Topic 11 Part 2) (revised Jan. 2016) DIRECTIONS/SUGGESTIONS You may conveniently write answers to Problems A and B within these directions. Some exercises include special
A Short Introduction to Eviews
 A Short Introduction to Eviews Note You are responsible to get familiar with Eviews as soon as possible. All homeworks are likely to contain questions for which you will need to use this software package.
2. Filling Data Gaps, Data validation & Descriptive Statistics
 2. Filling Data Gaps, Data validation & Descriptive Statistics Dr. Prasad Modak Background Data collected from field may suffer from these problems Data may contain gaps ( = no readings during this period)
Using R for Windows and Macintosh
 2010 Using R for Windows and Macintosh R is the most commonly used statistical package among researchers in Statistics. It is freely distributed open source software. For detailed information about downloading
Moderation. Moderation
 Stats - Moderation Moderation A moderator is a variable that specifies conditions under which a given predictor is related to an outcome. The moderator explains when a DV and IV are related. Moderation
Introduction to Statistical Computing in Microsoft Excel By Hector D. Flores; [email protected], and Dr. J.A. Dobelman
 Introduction to Statistical Computing in Microsoft Excel By Hector D. Flores; [email protected], and Dr. J.A. Dobelman Statistics lab will be mainly focused on applying what you have learned in class with
STATISTICA Formula Guide: Logistic Regression. Table of Contents
 : Table of Contents... 1 Overview of Model... 1 Dispersion... 2 Parameterization... 3 Sigma-Restricted Model... 3 Overparameterized Model... 4 Reference Coding... 4 Model Summary (Summary Tab)... 5 Summary
Data Analysis. Using Excel. Jeffrey L. Rummel. BBA Seminar. Data in Excel. Excel Calculations of Descriptive Statistics. Single Variable Graphs
 Using Excel Jeffrey L. Rummel Emory University Goizueta Business School BBA Seminar Jeffrey L. Rummel BBA Seminar 1 / 54 Excel Calculations of Descriptive Statistics Single Variable Graphs Relationships
Data Analysis Tools. Tools for Summarizing Data
 Data Analysis Tools This section of the notes is meant to introduce you to many of the tools that are provided by Excel under the Tools/Data Analysis menu item. If your computer does not have that tool
Data Mining and Visualization
 Data Mining and Visualization Jeremy Walton NAG Ltd, Oxford Overview Data mining components Functionality Example application Quality control Visualization Use of 3D Example application Market research
Tutorial 3: Graphics and Exploratory Data Analysis in R Jason Pienaar and Tom Miller
 Tutorial 3: Graphics and Exploratory Data Analysis in R Jason Pienaar and Tom Miller Getting to know the data An important first step before performing any kind of statistical analysis is to familiarize
Simple Linear Regression Inference
 Simple Linear Regression Inference 1 Inference requirements The Normality assumption of the stochastic term e is needed for inference even if it is not a OLS requirement. Therefore we have: Interpretation
GRADES 7, 8, AND 9 BIG IDEAS
 Table 1: Strand A: BIG IDEAS: MATH: NUMBER Introduce perfect squares, square roots, and all applications Introduce rational numbers (positive and negative) Introduce the meaning of negative exponents for
Summarizing and Displaying Categorical Data
 Summarizing and Displaying Categorical Data Categorical data can be summarized in a frequency distribution which counts the number of cases, or frequency, that fall into each category, or a relative frequency
Applying Statistics Recommended by Regulatory Documents
 Applying Statistics Recommended by Regulatory Documents Steven Walfish President, Statistical Outsourcing Services [email protected] 301-325 325-31293129 About the Speaker Mr. Steven
Introduction to StatsDirect, 11/05/2012 1
 INTRODUCTION TO STATSDIRECT PART 1... 2 INTRODUCTION... 2 Why Use StatsDirect... 2 ACCESSING STATSDIRECT FOR WINDOWS XP... 4 DATA ENTRY... 5 Missing Data... 6 Opening an Excel Workbook... 6 Moving around
Regression Clustering
 Chapter 449 Introduction This algorithm provides for clustering in the multiple regression setting in which you have a dependent variable Y and one or more independent variables, the X s. The algorithm
DATA INTERPRETATION AND STATISTICS
 PholC60 September 001 DATA INTERPRETATION AND STATISTICS Books A easy and systematic introductory text is Essentials of Medical Statistics by Betty Kirkwood, published by Blackwell at about 14. DESCRIPTIVE
Simple Linear Regression, Scatterplots, and Bivariate Correlation
 1 Simple Linear Regression, Scatterplots, and Bivariate Correlation This section covers procedures for testing the association between two continuous variables using the SPSS Regression and Correlate analyses.