Monitoring HTCondor with Ganglia
|
|
|
- Cameron Meryl Barker
- 10 years ago
- Views:
Transcription
1 Monitoring HTCondor with Ganglia

2 Ganglia Overview Scalable distributed monitoring for HPC clusters Two daemons gmond every host; collects and send metrics gmetad single host; persists metrics from local gmond in RRD Web Frontend Presents graphs from persistent data

3 3

4 4 Why Ganglia? Widely used monitoring system for cluster and grids Easy to add new metrics Can create custom graphs

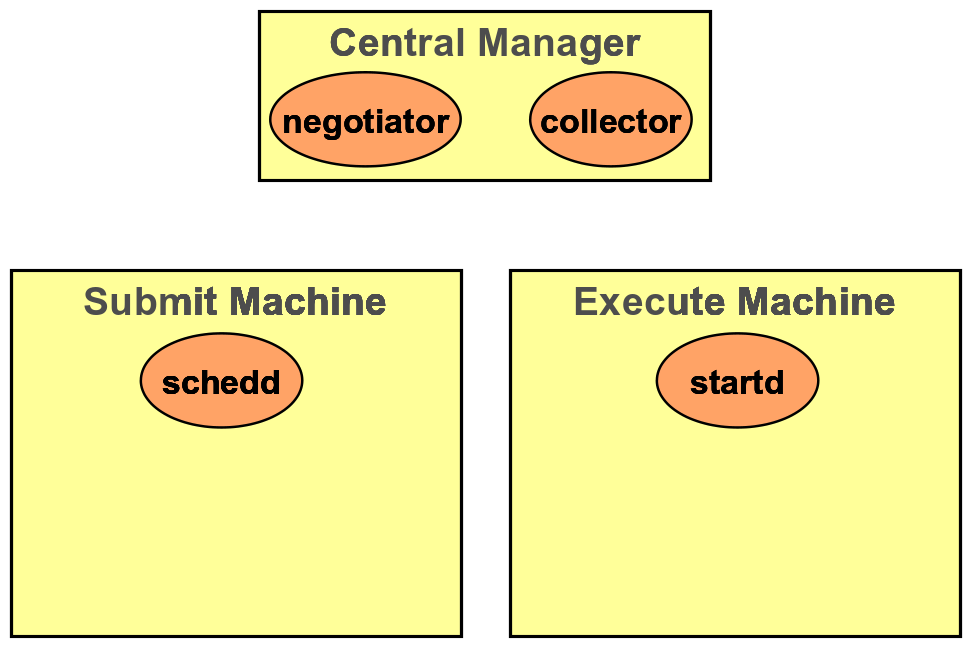
5 Running condor_gangliad condor_gangliad runs on a single host Gathers daemon ClassAds from the Collector Publishes metrics to ganglia with host spoofing Can be on any host May be co-located with condor_collector gmetad Consider network traffic


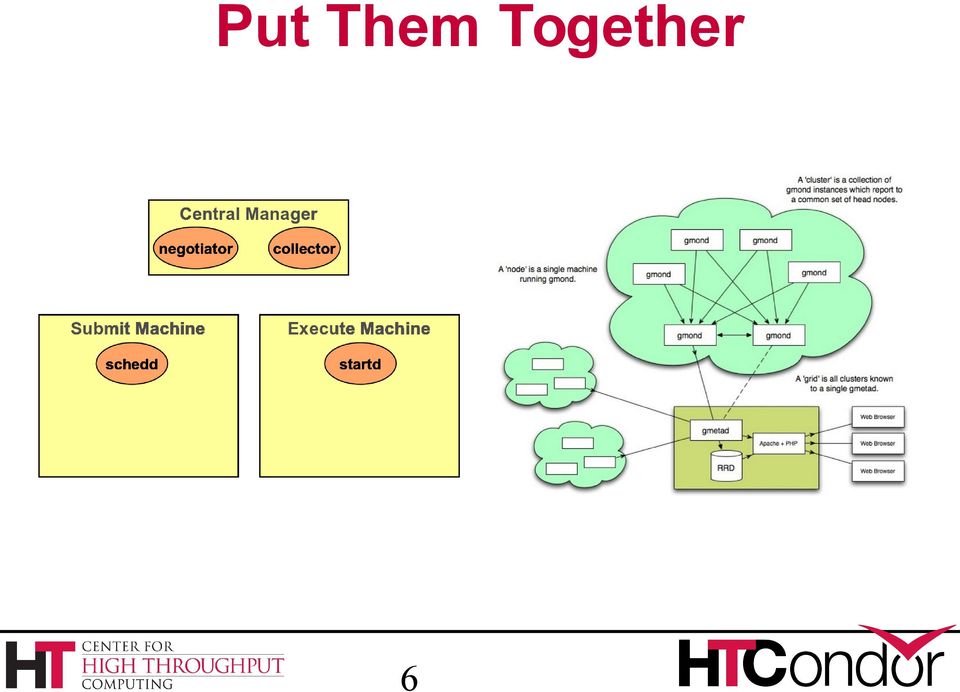
6 Put Them Together 6
7 Possible Deployments Ganglia is already used for monitoring Start condor_gangliad on gmetad host Least configuration Start condor_gangliad on Central Manager Saves network traffic Ganglia is not in use for monitoring Setup dedicated host to run ganglia and condor_gangliad Generates graphs for web pages on demand

8 Ganglia Interface Uses gmetric method to add metrics to ganglia Uses shared library on system to send updates Fast and efficient Falls back to using gmetric command Much slower Uses gstat to determine which hosts are already monitored by ganglia

9 Configuration Macros GANGLIA_GSTAT_COMMAND Defaults to localhost (change master gmond running elsewhere) gstat --all --mpifile --gmond_ip=localhost gmond_port=8649 GANGLIA_SEND_DATA_FOR_ALL_HOSTS Set to true if want hosts not currently in ganglia GANGLIAD_VERBOSITY Defaults to 0, set higher for more monitoring

10 Running condor_gangliad Add to DAEMON_LIST DAEMON_LIST =, GANGLIAD Check GangliadLog for gmetric integration Look for libganglia load message Library has been stable over many releases May have to specify path to library If fall back to gmetric command look closely at timing

11 Log Snippet 04/24/14 08:05:43 Testing gmetric 04/24/14 08:05:43 Loading libganglia /usr/lib64/libganglia so /24/14 08:05:43 Will use libganglia to interact with ganglia. 04/24/14 08:06:03 Starting update... 04/24/14 08:06:03 Ganglia is monitoring 1 hosts 04/24/14 08:06:10 Got 7687 daemon ads 04/24/14 08:06:14 Ganglia metrics sent: /24/14 08:06:14 Heartbeats sent: 80

12 Limit Data GANGLIAD_PER_EXECUTE_NODE_METRICS Set to false if large pool Use Requirement express to limit data fetched GANGLIAD_REQUIREMENTS = Machine == "cm.chtc.wisc.edu" Machine == "submit-1.chtc.wisc.edu" Machine == "submit-2.chtc.wisc.edu" Machine == "submit-3.chtc.wisc.edu"

13 Metrics to Track Described in /etc/condor/ganglia.d/ Default set provided Expressed as ClassAds Name: Unique metric name used by ganglia Value: ClassAd expression, defaults to Name

14 Minimal Example [ ] Name = "JobsSubmitted"; Desc = "Number of jobs submitted"; Units = "jobs"; TargetType = "Scheduler";

15 Simple Example [ Name = strcat(mytype,"daemoncoredutycycle"); Value = RecentDaemonCoreDutyCycle; Desc = "Recent fraction of busy time in the daemon event loop"; Scale = 100; Units = "%"; TargetType = "Scheduler,Negotiator,Machine_slot1"; ]

16 Aggregate Metrics Can aggregate metrics over entire pool Sums: running jobs over pool Min and Max: Space Available Average Aggregates appear in HTCondor Pool group on central manager

17 Aggregate Example [ Name = "TotalJobAds"; Desc = "Number of jobs currently in this schedd's queue"; Units = "jobs"; TargetType = "Scheduler"; ] [ Aggregate = "SUM"; Name = "Jobs in Pool"; Value = TotalJobAds; Desc = "Number of jobs currently in schedds reporting to this pool"; Units = "jobs"; TargetType = "Scheduler"; ]

18 Scaling Example [ ] Name = strcat(mytype,"monitorselfresidentsetsize"); Value = MonitorSelfResidentSetSize; Verbosity = 1; Desc = "RAM allocated to this daemon"; Units = "bytes"; Scale = 1024; Type = "float"; TargetType = "Scheduler,Negotiator,Machine_slot1";

19 Other Attributes Title = Graph Title (defaults to Name) Regex = for dynamic metric (users) Type = automatic based on type Coerce integers to floats if scaling or large Group = Group on Web Page

20 Future Work Composite graphs For example, I/O load and throughput Better able to draw conclusions Graph slot states Determine which metrics are most useful

21 Live Demo
Wait, How Many Metrics? Monitoring at Quantcast
 Wait, How Many Metrics? Monitoring at Quantcast Count what is countable, measure what is measurable, and what is not measurable, make measurable. Galileo Galilei Quantcast offers free direct audience measurement
HTCondor at the RAL Tier-1
 HTCondor at the RAL Tier-1 Andrew Lahiff, Alastair Dewhurst, John Kelly, Ian Collier, James Adams STFC Rutherford Appleton Laboratory HTCondor Week 2014 Outline Overview of HTCondor at RAL Monitoring Multi-core
Ganglia & Nagios. Maciej Lasyk 11. Sesja Linuksowa Wrocław, 2014-04-06 1/25. Maciej Lasyk, Ganglia & Nagios
 Ganglia & Nagios Maciej Lasyk 11. Sesja Linuksowa Wrocław, 2014-04-06 1/25 Ganglia.. what? Ganglia cluster / group of neurons found outside the central nervous system 2/25 Just a little about monitoring
Monitoring Infrastructure for Superclusters: Experiences at MareNostrum
 ScicomP13 2007 SP-XXL Monitoring Infrastructure for Superclusters: Experiences at MareNostrum Garching, Munich Ernest Artiaga Performance Group BSC-CNS, Operations Outline BSC-CNS and MareNostrum Overview
Scaling Graphite Installations
 Scaling Graphite Installations Graphite basics Graphite is a web based Graphing program for time series data series plots. Written in Python Consists of multiple separate daemons Has it's own storage backend
GANGLIA INSTALLATION GUIDE
 GANGLIA INSTALLATION GUIDE -Prashant Bhamidipati ([email protected]) Section-1 : Ganglia installation procedure Section-2 : GMOND & GMETAD Configuration 1 Section 1 Ganglia installation procedure
STUDY AND SIMULATION OF A DISTRIBUTED REAL-TIME FAULT-TOLERANCE WEB MONITORING SYSTEM
 STUDY AND SIMULATION OF A DISTRIBUTED REAL-TIME FAULT-TOLERANCE WEB MONITORING SYSTEM Albert M. K. Cheng, Shaohong Fang Department of Computer Science University of Houston Houston, TX, 77204, USA http://www.cs.uh.edu
Amazon EC2 Product Details Page 1 of 5
 Amazon EC2 Product Details Page 1 of 5 Amazon EC2 Functionality Amazon EC2 presents a true virtual computing environment, allowing you to use web service interfaces to launch instances with a variety of
CycleServer Grid Engine Support Install Guide. version 1.25
 CycleServer Grid Engine Support Install Guide version 1.25 Contents CycleServer Grid Engine Guide 1 Administration 1 Requirements 1 Installation 1 Monitoring Additional OGS/SGE/etc Clusters 3 Monitoring
Lustre & Cluster. - monitoring the whole thing Erich Focht
 Lustre & Cluster - monitoring the whole thing Erich Focht NEC HPC Europe LAD 2014, Reims, September 22-23, 2014 1 Overview Introduction LXFS Lustre in a Data Center IBviz: Infiniband Fabric visualization
Analyzing large flow data sets using. visualization tools. modern open-source data search and. FloCon 2014. Max Putas
 Analyzing large flow data sets using modern open-source data search and visualization tools FloCon 2014 Max Putas About me Operations Engineer - DevOps BS, MS, and CAS in Telecommunications Work/research
Jean-Armand Broyelle / Sebastien Chabrolles IBM Power Benchmark Center Europe NMON. Monitoring. Common 2012. 2009 IBM Corporation
 Jean-Armand Broyelle / Sebastien Chabrolles IBM Power Benchmark Center Europe Monitoring Common 2012 NMON Agenda IBM Power Advisor tools Optimization Nigel s Monitor (NMON) Fine Performance Monitoring
Prepared By : Manoj Kumar Joshi & Vikas Sawhney
 Prepared By : Manoj Kumar Joshi & Vikas Sawhney General Agenda Introduction to Hadoop Architecture Acknowledgement Thanks to all the authors who left their selfexplanatory images on the internet. Thanks
A Year of HTCondor Monitoring. Lincoln Bryant Suchandra Thapa
 A Year of HTCondor Monitoring Lincoln Bryant Suchandra Thapa HTCondor Week 2015 May 21, 2015 Analytics vs. Operations Two parallel tracks in mind: o Operations o Analytics Operations needs to: o Observe
New Relic & JMeter - Perfect Performance Testing
 TUTORIAL New Relic & JMeter - Perfect Performance Testing by David Sale Contents Introduction 3 Demo Application 4 Hooking Into New Relic 4 What Is JMeter? 6 Installation and Usage 6 Analysis In New Relic
SAIP 2012 Performance Engineering
 SAIP 2012 Performance Engineering Author: Jens Edlef Møller ([email protected]) Instructions for installation, setup and use of tools. Introduction For the project assignment a number of tools will be used.
Monitoring Oracle Enterprise Performance Management System Release 11.1.2.3 Deployments from Oracle Enterprise Manager 12c
 Monitoring Oracle Enterprise Performance Management System Release 11.1.2.3 Deployments from Oracle Enterprise Manager 12c This document describes how to set up Oracle Enterprise Manager 12c to monitor
Load balancing MySQL with HaProxy. Peter Boros Consultant @ Percona 4/23/13 Santa Clara, CA
 Load balancing MySQL with HaProxy Peter Boros Consultant @ Percona 4/23/13 Santa Clara, CA Agenda What is HaProxy HaProxy configuration Load balancing topologies Checks Load balancing Percona XtraDB Cluster
SEE-GRID-SCI. www.see-grid-sci.eu. SEE-GRID-SCI USER FORUM 2009 Turkey, Istanbul 09-10 December, 2009
 SEE-GRID-SCI Grid Site Monitoring tools developed and used at SCL www.see-grid-sci.eu SEE-GRID-SCI USER FORUM 2009 Turkey, Istanbul 09-10 December, 2009 V. Slavnić, B. Acković, D. Vudragović, A. Balaž,
Monitoring Clusters and Grids
 JENNIFER M. SCHOPF AND BEN CLIFFORD Monitoring Clusters and Grids One of the first questions anyone asks when setting up a cluster or a Grid is, How is it running? is inquiry is usually followed by the
Deliverable D6.7. Performance testing of cloud applications, Final Release
 REuse and Migration of legacy applications to Interoperable Cloud Services REMICS Small or Medium-scale Focused Research Project (STREP) Project No. 257793 Deliverable D6.7 Performance testing of cloud
The full setup includes the server itself, the server control panel, Firebird Database Server, and three sample applications with source code.
 Content Introduction... 2 Data Access Server Control Panel... 2 Running the Sample Client Applications... 4 Sample Applications Code... 7 Server Side Objects... 8 Sample Usage of Server Side Objects...
Monitoring Elastic Cloud Services
 Monitoring Elastic Cloud Services [email protected] Advanced School on Service Oriented Computing (SummerSoc 2014) 30 June 5 July, Hersonissos, Crete, Greece Presentation Outline Elasticity in Cloud
Comparison of Windows IaaS Environments
 Comparison of Windows IaaS Environments Comparison of Amazon Web Services, Expedient, Microsoft, and Rackspace Public Clouds January 5, 215 TABLE OF CONTENTS Executive Summary 2 vcpu Performance Summary
How To Monitor Infiniband Network Data From A Network On A Leaf Switch (Wired) On A Microsoft Powerbook (Wired Or Microsoft) On An Ipa (Wired/Wired) Or Ipa V2 (Wired V2)
 On A Microsoft Powerbook (Wired Or Microsoft) On An Ipa (Wired/Wired) Or Ipa V2 (Wired V2)") INFINIBAND NETWORK ANALYSIS AND MONITORING USING OPENSM N. Dandapanthula 1, H. Subramoni 1, J. Vienne 1, K. Kandalla 1, S. Sur 1, D. K. Panda 1, and R. Brightwell 2 Presented By Xavier Besseron 1 Date:
INFINIBAND NETWORK ANALYSIS AND MONITORING USING OPENSM N. Dandapanthula 1, H. Subramoni 1, J. Vienne 1, K. Kandalla 1, S. Sur 1, D. K. Panda 1, and R. Brightwell 2 Presented By Xavier Besseron 1 Date:
Integration of the OCM-G Monitoring System into the MonALISA Infrastructure
 Integration of the OCM-G Monitoring System into the MonALISA Infrastructure W lodzimierz Funika, Bartosz Jakubowski, and Jakub Jaroszewski Institute of Computer Science, AGH, al. Mickiewicza 30, 30-059,
MONITORING PERFORMANCE IN WINDOWS 7
 MONITORING PERFORMANCE IN WINDOWS 7 Performance Monitor In this demo we will take a look at how we can use the Performance Monitor to capture information about our machine performance. We can access Performance
Getting Started with SandStorm NoSQL Benchmark
 Getting Started with SandStorm NoSQL Benchmark SandStorm is an enterprise performance testing tool for web, mobile, cloud and big data applications. It provides a framework for benchmarking NoSQL, Hadoop,
vrealize Operations Management Pack for vcloud Air 2.0
 vrealize Operations Management Pack for vcloud Air 2.0 This document supports the version of each product listed and supports all subsequent versions until the document is replaced by a new edition. To
Optimizing your Monitoring and Trending tools for the Cloud
 Optimizing your Monitoring and Trending tools for the Cloud Nagios World Conference 2012 Nicolas Brousse Lead Operations Engineer September 28 th 2012 About TubeMogul What are some of our challenges? Our
Monitoring Load-Balancing Services
 CHAPTER 8 Load-balancing is a technology that enables network traffic to follow multiple paths to a specific destination. It distributes incoming service requests evenly among multiple servers in such
Project Convergence: Integrating Data Grids and Compute Grids. Eugene Steinberg, CTO Grid Dynamics May, 2008
 Project Convergence: Integrating Data Grids and Compute Grids Eugene Steinberg, CTO May, 2008 Data-Driven Scalability Challenges in HPC Data is far away Latency of remote connection Latency of data movement
Emerald. Network Collector Version 4.0. Emerald Management Suite IEA Software, Inc.
 Emerald Network Collector Version 4.0 Emerald Management Suite IEA Software, Inc. Table Of Contents Purpose... 3 Overview... 3 Modules... 3 Installation... 3 Configuration... 3 Filter Definitions... 4
s@lm@n Oracle Exam 1z0-102 Oracle Weblogic Server 11g: System Administration I Version: 9.0 [ Total Questions: 111 ]
![s@lm@n Oracle Exam 1z0-102 Oracle Weblogic Server 11g: System Administration I Version: 9.0 [ Total Questions: 111 ]](/thumbs/34/13135225.jpg "s@lm@n Oracle Exam 1z0-102 Oracle Weblogic Server 11g: System Administration I Version: 9.0 [ Total Questions: 111 ]") s@lm@n Oracle Exam 1z0-102 Oracle Weblogic Server 11g: System Administration I Version: 9.0 [ Total Questions: 111 ] Oracle 1z0-102 : Practice Test Question No : 1 Which two statements are true about java
s@lm@n Oracle Exam 1z0-102 Oracle Weblogic Server 11g: System Administration I Version: 9.0 [ Total Questions: 111 ] Oracle 1z0-102 : Practice Test Question No : 1 Which two statements are true about java
The ganglia distributed monitoring system: design, implementation, and experience
 Parallel Computing 30 (2004) 817 840 www.elsevier.com/locate/parco The ganglia distributed monitoring system: design, implementation, and experience Matthew L. Massie a,1, Brent N. Chun b, *, David E.
Oracle Database 11g: RAC Administration Release 2
 Oracle University Contact Us: 01-800-919-3027 & 01-800-913-0322 Oracle Database 11g: RAC Administration Release 2 Duration: 4 Days What you will learn This Oracle Database 11g: RAC Administration Release
WHITE PAPER Redefining Monitoring for Today s Modern IT Infrastructures
 WHITE PAPER Redefining Monitoring for Today s Modern IT Infrastructures Modern technologies in Zenoss Service Dynamics v5 enable IT organizations to scale out monitoring and scale back costs, avoid service
000-420. IBM InfoSphere MDM Server v9.0. Version: Demo. Page <<1/11>>
 000-420 IBM InfoSphere MDM Server v9.0 Version: Demo Page 1. As part of a maintenance team for an InfoSphere MDM Server implementation, you are investigating the "EndDate must be after StartDate"
Condor: Grid Scheduler and the Cloud
 Condor: Grid Scheduler and the Cloud Matthew Farrellee Senior Software Engineer, Red Hat 1 Agenda What is Condor Architecture Condor s ClassAd Language Common Use Cases Virtual Machine management Cloud
VirtualCenter Database Performance for Microsoft SQL Server 2005 VirtualCenter 2.5
 Performance Study VirtualCenter Database Performance for Microsoft SQL Server 2005 VirtualCenter 2.5 VMware VirtualCenter uses a database to store metadata on the state of a VMware Infrastructure environment.
Exam Name: IBM InfoSphere MDM Server v9.0
 Vendor: IBM Exam Code: 000-420 Exam Name: IBM InfoSphere MDM Server v9.0 Version: DEMO 1. As part of a maintenance team for an InfoSphere MDM Server implementation, you are investigating the "EndDate must
HTCondor within the European Grid & in the Cloud
 HTCondor within the European Grid & in the Cloud Andrew Lahiff STFC Rutherford Appleton Laboratory HEPiX 2015 Spring Workshop, Oxford The Grid Introduction Computing element requirements Job submission
CA Nimsoft Monitor Snap
 CA Nimsoft Monitor Snap Configuration Guide for IIS Server Monitoring iis v1.5 series Legal Notices This online help system (the "System") is for your informational purposes only and is subject to change
So in order to grab all the visitors requests we add to our workbench a non-test-element of the proxy type.
 First in oder to configure our test case, we need to reproduce our typical browsing path containing all the pages visited by the visitors on our systems. So in order to grab all the visitors requests we
Virtualisation Cloud Computing at the RAL Tier 1. Ian Collier STFC RAL Tier 1 HEPiX, Bologna, 18 th April 2013
 Virtualisation Cloud Computing at the RAL Tier 1 Ian Collier STFC RAL Tier 1 HEPiX, Bologna, 18 th April 2013 Virtualisation @ RAL Context at RAL Hyper-V Services Platform Scientific Computing Department
Bernd Ahlers Michael Friedrich. Log Monitoring Simplified Get the best out of Graylog2 & Icinga 2
 Bernd Ahlers Michael Friedrich Log Monitoring Simplified Get the best out of Graylog2 & Icinga 2 BEFORE WE START Agenda AGENDA Introduction Tools Log History Logs & Monitoring Demo The Future Resources
Stratusphere Solutions
 Stratusphere Solutions Deployment Best Practices Guide Introduction This guide has been authored by experts at Liquidware Labs in order to provide a baseline as well as recommendations for a best practices
IBM Tivoli Composite Application Manager for Microsoft Applications: Microsoft Hyper-V Server Agent Version 6.3.1 Fix Pack 2.
 IBM Tivoli Composite Application Manager for Microsoft Applications: Microsoft Hyper-V Server Agent Version 6.3.1 Fix Pack 2 Reference IBM Tivoli Composite Application Manager for Microsoft Applications:
TIBCO Spotfire Metrics Modeler User s Guide. Software Release 6.0 November 2013
 TIBCO Spotfire Metrics Modeler User s Guide Software Release 6.0 November 2013 Important Information SOME TIBCO SOFTWARE EMBEDS OR BUNDLES OTHER TIBCO SOFTWARE. USE OF SUCH EMBEDDED OR BUNDLED TIBCO SOFTWARE
DEPLOYING EMC DOCUMENTUM BUSINESS ACTIVITY MONITOR SERVER ON IBM WEBSPHERE APPLICATION SERVER CLUSTER
 White Paper DEPLOYING EMC DOCUMENTUM BUSINESS ACTIVITY MONITOR SERVER ON IBM WEBSPHERE APPLICATION SERVER CLUSTER Abstract This white paper describes the process of deploying EMC Documentum Business Activity
Monitoring systems: Concepts and tools
 Monitoring systems: Concepts and tools Zdenko Škiljan Branimir Radi Department of Computer Systems, University Computing Centre, Croatia {zskiljan, bradic}@srce.hr Abstract Every computer system has to
LiteSpeed for SQL Server(7.5) How to Diagnose & Troubleshoot Backup
 How to Diagnose & Troubleshoot Backup") LiteSpeed for SQL Server(7.5) How to Diagnose & Troubleshoot Backup Slide Index Learning objectives- slide #3 Backup functional overview- slides # 9 Common issues- slide #17 Common backup error explanation-
LiteSpeed for SQL Server(7.5) How to Diagnose & Troubleshoot Backup Slide Index Learning objectives- slide #3 Backup functional overview- slides # 9 Common issues- slide #17 Common backup error explanation-
Guide to the LBaaS plugin ver. 1.0.2 for Fuel
 Guide to the LBaaS plugin ver. 1.0.2 for Fuel Load Balancing plugin for Fuel LBaaS (Load Balancing as a Service) is currently an advanced service of Neutron that provides load balancing for Neutron multi
Session Storage in Zend Server Cluster Manager
 Session Storage in Zend Server Cluster Manager Shahar Evron Technical Product Manager, Zend Technologies Welcome! All Phones are muted type your questions into the Webex Q&A box A recording of this session
ITG Software Engineering
 IBM WebSphere Administration 8.5 Course ID: Page 1 Last Updated 12/15/2014 WebSphere Administration 8.5 Course Overview: This 5 Day course will cover the administration and configuration of WebSphere 8.5.
Vidi NMs Network Management
 VIDI NMS Network Management The VIDI Network Management System VIDI NMS is a comprehensive tool for a centralised network management with graphical frontend. As it is working in real time the user gets
ESX System Analyzer Version 1.0 Installation Guide
 ESX System Analyzer Version 1.0 Installation Guide Page 1 Table of Contents ESX System Analyzer Installation Guide 1. Installing ESX System Analyzer... 3 ESX System Analyzer Appliance Distribution... 3
Management & Analysis of Big Data in Zenith Team
 Management & Analysis of Big Data in Zenith Team Zenith Team, INRIA & LIRMM Outline Introduction to MapReduce Dealing with Data Skew in Big Data Processing Data Partitioning for MapReduce Frequent Sequence
Hadoop: Embracing future hardware
 Hadoop: Embracing future hardware Suresh Srinivas @suresh_m_s Page 1 About Me Architect & Founder at Hortonworks Long time Apache Hadoop committer and PMC member Designed and developed many key Hadoop
1Z0-102. Oracle Weblogic Server 11g: System Administration I. Version: Demo. Page <<1/7>>
 1Z0-102 Oracle Weblogic Server 11g: System Administration I Version: Demo Page 1. Which two statements are true about java EE shared libraries? A. A shared library cannot bedeployed to a cluster.
Scaling out a SharePoint Farm and Configuring Network Load Balancing on the Web Servers. Steve Smith Combined Knowledge MVP SharePoint Server
 Scaling out a SharePoint Farm and Configuring Network Load Balancing on the Web Servers Steve Smith Combined Knowledge MVP SharePoint Server Scaling out a SharePoint Farm and Configuring Network Load Balancing
New and Improved Lustre Performance Monitoring Tool. Torben Kling Petersen, PhD Principal Engineer. Chris Bloxham Principal Architect
 New and Improved Lustre Performance Monitoring Tool Torben Kling Petersen, PhD Principal Engineer Chris Bloxham Principal Architect Lustre monitoring Performance Granular Aggregated Components Subsystem
Evaluation of Nagios for Real-time Cloud Virtual Machine Monitoring
 University of Victoria Faculty of Engineering Fall 2009 Work Term Report Evaluation of Nagios for Real-time Cloud Virtual Machine Monitoring Department of Physics University of Victoria Victoria, BC Michael
Load Balancing Bloxx Web Filter. Deployment Guide
 Load Balancing Bloxx Web Filter Deployment Guide rev. 1.1.8 Copyright 2002 2016 Loadbalancer.org, Inc. 1 Table of Contents About this Guide...4 Loadbalancer.org Appliances Supported...4 Loadbalancer.org
Architektur XenServer
 1 Architektur XenServer 2 XenServer Architectural Components 3 Architectural Changes The Open vswitch is now the default network stack for the product. Improvements to Distributed Virtual Switching include
The objective of this lab is to learn how to set up an environment for running distributed Hadoop applications.
 Lab 9: Hadoop Development The objective of this lab is to learn how to set up an environment for running distributed Hadoop applications. Introduction Hadoop can be run in one of three modes: Standalone
Scalability Tuning vcenter Operations Manager for View 1.0
 Technical Note Scalability Tuning vcenter Operations Manager for View 1.0 Scalability Overview The scalability of vcenter Operations Manager for View 1.0 was tested and verified to support 4000 concurrent
User and Programmer Guide for the FI- STAR Monitoring Service SE
 User and Programmer Guide for the FI- STAR Monitoring Service SE FI-STAR Beta Release Copyright 2014 - Yahya Al-Hazmi, Technische Universität Berlin This document gives a short guide on how to use the
Configuring Apache HTTP Server With Pramati
 Configuring Apache HTTP Server With Pramati 45 A general practice often seen in development environments is to have a web server to cater to the static pages and use the application server to deal with
Job Scheduling with the Fair and Capacity Schedulers
 Job Scheduling with the Fair and Capacity Schedulers Matei Zaharia UC Berkeley Wednesday, June 10, 2009 Santa Clara Marriott Motivation» Provide fast response times to small jobs in a shared Hadoop cluster»
Orchestrating Distributed Deployments with Docker and Containers 1 / 30
 Orchestrating Distributed Deployments with Docker and Containers 1 / 30 Who am I? Jérôme Petazzoni (@jpetazzo) French software engineer living in California Joined Docker (dotcloud) more than 4 years ago
Building a Scalable News Feed Web Service in Clojure
 Building a Scalable News Feed Web Service in Clojure This is a good time to be in software. The Internet has made communications between computers and people extremely affordable, even at scale. Cloud
Running a Workflow on a PowerCenter Grid
 Running a Workflow on a PowerCenter Grid 2010-2014 Informatica Corporation. No part of this document may be reproduced or transmitted in any form, by any means (electronic, photocopying, recording or otherwise)
Evaluation and implementation of CEP mechanisms to act upon infrastructure metrics monitored by Ganglia
 Project report CERN Summer Student Programme Evaluation and implementation of CEP mechanisms to act upon infrastructure metrics monitored by Ganglia Author: Martin Adam Supervisors: Cristovao Cordeiro,
Estimate Performance and Capacity Requirements for Workflow in SharePoint Server 2010
 Estimate Performance and Capacity Requirements for Workflow in SharePoint Server 2010 This document is provided as-is. Information and views expressed in this document, including URL and other Internet
HAProxy. Free, Fast High Availability and Load Balancing. Adam Thornton 10 September 2014
 HAProxy Free, Fast High Availability and Load Balancing Adam Thornton 10 September 2014 What? HAProxy is a proxy for Layer 4 (TCP) or Layer 7 (HTTP) traffic GPLv2 http://www.haproxy.org Disclaimer: I don't
Grid Computing in SAS 9.4 Third Edition
 Grid Computing in SAS 9.4 Third Edition SAS Documentation The correct bibliographic citation for this manual is as follows: SAS Institute Inc. 2014. Grid Computing in SAS 9.4, Third Edition. Cary, NC:
By Wick Gankanda Updated: August 8, 2012
 DATA SOURCE AND RESOURCE REFERENCE SETTINGS IN WEBSPHERE 7.0, RATIONAL APPLICATION DEVELOPER FOR WEBSPHERE VER 8 WITH JAVA 6 AND MICROSOFT SQL SERVER 2008 By Wick Gankanda Updated: August 8, 2012 Table
MALAYSIAN PUBLIC SECTOR OPEN SOURCE SOFTWARE (OSS) PROGRAMME. COMPARISON REPORT ON NETWORK MONITORING SYSTEMS (Nagios and Zabbix)
 PROGRAMME. COMPARISON REPORT ON NETWORK MONITORING SYSTEMS (Nagios and Zabbix)") MALAYSIAN PUBLIC SECTOR OPEN SOURCE SOFTWARE (OSS) PROGRAMME COMPARISON REPORT ON NETWORK MONITORING SYSTEMS (Nagios and Zabbix) JANUARY 2010 Phase II -Network Monitoring System- Copyright The government
MALAYSIAN PUBLIC SECTOR OPEN SOURCE SOFTWARE (OSS) PROGRAMME COMPARISON REPORT ON NETWORK MONITORING SYSTEMS (Nagios and Zabbix) JANUARY 2010 Phase II -Network Monitoring System- Copyright The government
Load Balancing Clearswift Secure Web Gateway
 Load Balancing Clearswift Secure Web Gateway Deployment Guide rev. 1.1.8 Copyright 2002 2016 Loadbalancer.org, Inc. 1 Table of Contents About this Guide...3 Loadbalancer.org Appliances Supported...3 Loadbalancer.org
Monitoring Cluster on Online Compiler with Ganglia
 Monitoring Cluster on Online Compiler with Ganglia Nuryani, Andria Arisal, Wiwin Suwarningsih, Taufiq Wirahman Research Center for Informatics, Indonesian Institute of Sciences Komp. LIPI, Gd. 20, Lt.
JOB ORIENTED VMWARE TRAINING INSTITUTE IN CHENNAI
 JOB ORIENTED VMWARE TRAINING INSTITUTE IN CHENNAI Job oriented VMWARE training is offered by Peridot Systems in Chennai. Training in our institute gives you strong foundation on cloud computing by incrementing