A PROTOTYPE INDUSTRY-LEVEL PRODUCTION ACCOUNT FOR THE UNITED STATES,
|
|
|
- Sherman Pitts
- 10 years ago
- Views:
Transcription
1 A PROTOTYPE INDUSTRY-LEVEL PRODUCTION ACCOUNT FOR THE UNITED STATES, by Dale W. Jorgenson Harvard University WIOD Conference: Causes and Consequences of Globalization, Groningen, The Netherlands, April 25

2 ACKNOWLEDGEMENTS The data presented in this lecture were prepared by Dale W. Jorgenson, Mun S. Ho, and Jon D. Samuels. We are indebted to Mark Planting, Erich Strassner, and the Industry Division of the Bureau of Economic Analysis for time series data on input-output tables in current prices and to Ankur Patel for his help with the data construction. We are grateful to Trina Ott for preparing the presentation. Financial support was provided by the Donald Marron Gift Fund at Harvard University. The usual disclaimer applies.

3 A PROTOTYPE INDUSTRY-LEVEL PRODUCTION ACCOUNT FOR THE UNITED STATES, Table of Contents Annual Make and Use Tables in Current and Constant Prices, Industry Sectors; NAICS Industrial Classifcation. Annual Capital, Labor, Energy, Materials, and Services Data in Current and Constant Prices, Capital Data Divided between IT and Non-IT; Labor Data Divided between Hours and Labor Quality. Postwar U.S. Economic History The Postwar Recovery, the Big Slump, and the Great Recession Projecting Technology and Economic Growth Substitution versus Technical Change

4 THE HISTORICAL BACKGROUND Benchmark Input-Output Tables for the United States 1947, 1958, 1963, Five-Year Intervals Since 1967 Annual Input-Output Tables for the United States on a Continuously Revised Basis Time Series of Input-Output Tables for the United States Jorgenson, Gollop and Fraumeni (1987), Jorgenson, Ho and Stiroh (2005), Jorgenson, Ho and Samuels (2012),
, 1948-1979 Jorgenson, Ho and Stiroh (2005), 1977-2000 Jorgenson, Ho and Samuels")
5

6

7

8 IT-RELATED INDUSTRIES Machinery Other transportation equipment Furniture and related products Miscellaneous manufacturing Printing and related support activities Wholesale Trade Retail Trade Air transportation Water transportation Truck transportation Pipeline transportation Publishing industries (includes software) Motion picture and sound recording industries Broadcasting and telecommunications Federal Reserve banks credit intermediation and related activities IT-Producing Industries Computer and electronic products Information and data processing services Computer systems design and related services IT-Using Industries Securities commodity contracts and investments Insurance carriers and related activities Rental and leasing services and lessors of intangible assets Legal services Misc. professional scientific and technical services Management of companies and enterprises Administrative and support services Educational services Ambulatory health care services Hospitals Nursing and residential care facilities Social assistance Performing arts spectator sports museums and related activities Other services except government Federal General government S&L Government enterprises

9 NON-IT INDUSTRIES Farms Forestry fishing and related activities Oil and gas extraction Mining except oil and gas Support activities for mining Utilities Construction Wood products Nonmetallic mineral products Primary metals Fabricated metal products Electrical equipment appliances and components Motor vehicles bodies and trailers and parts Food and beverage and tobacco products Textile mills and textile product mills Apparel and leather and allied products Paper products Petroleum and coal products Chemical products Plastics and rubber products Rail transportation Transit and ground passenger transportation Other transportation and support activities Warehousing and storage Funds trusts and other financial vehicles Real estate Waste management and remediation services Amusements gambling and recreation industries Accommodation Food services and drinking places Federal Government enterprises S&L General Government

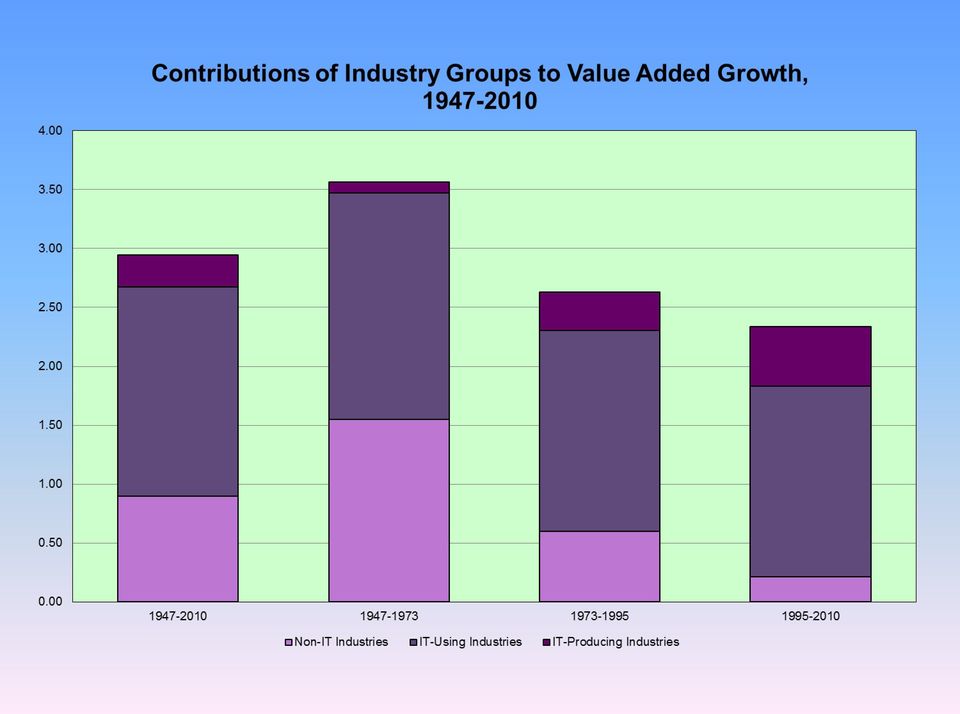
10 ROLE OF INFORMATION TECHNOLOGY Growth of Value Added and Productivity Output Shares of IT Computers, Information and Data Processing Services, Computer Systems Design and Related Services Output Contributions by Type Computers, Information and Data Processing Services, Computer Systems Design and Related Services Output Contribution of IT IT-Producing, IT-Using, and Non-IT

11
12

13 Contributions of Individual Industries to Value Added Growth

14 ROLE OF TOTAL FACTOR PRODUCTIVITY Total Factor Productivity IT-Producing, IT-Using and Non-IT Industries Reallocation of Factor Inputs Capital Input and Labor Input Aggregate Productivity Growth Industry Productivity and Factor Reallocations

15

16

17 Contributions of Individual Industries to Productivity Growth

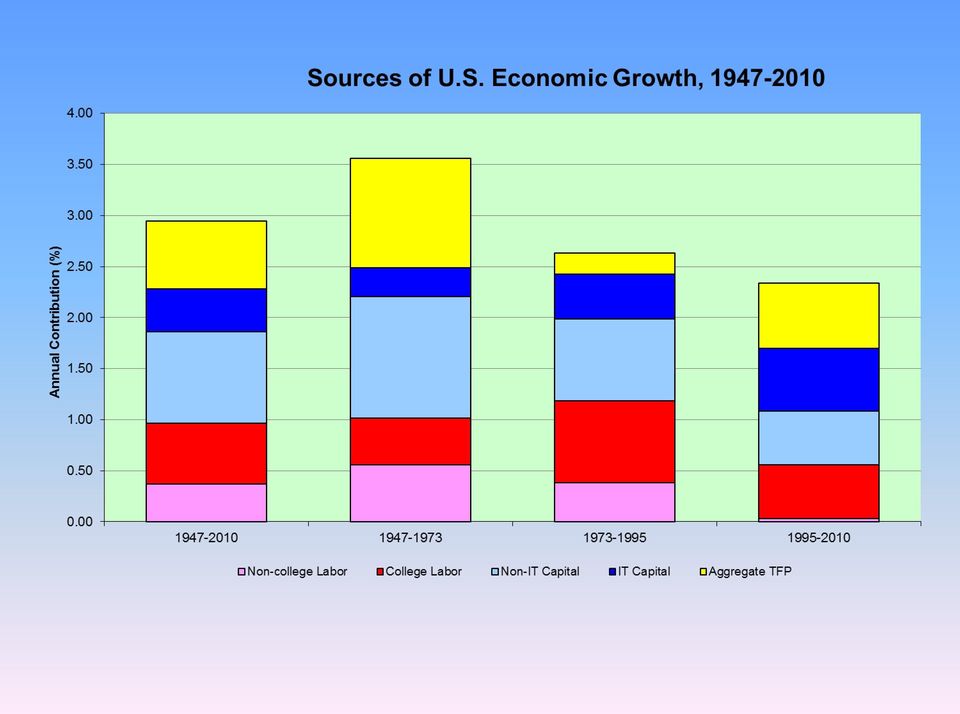
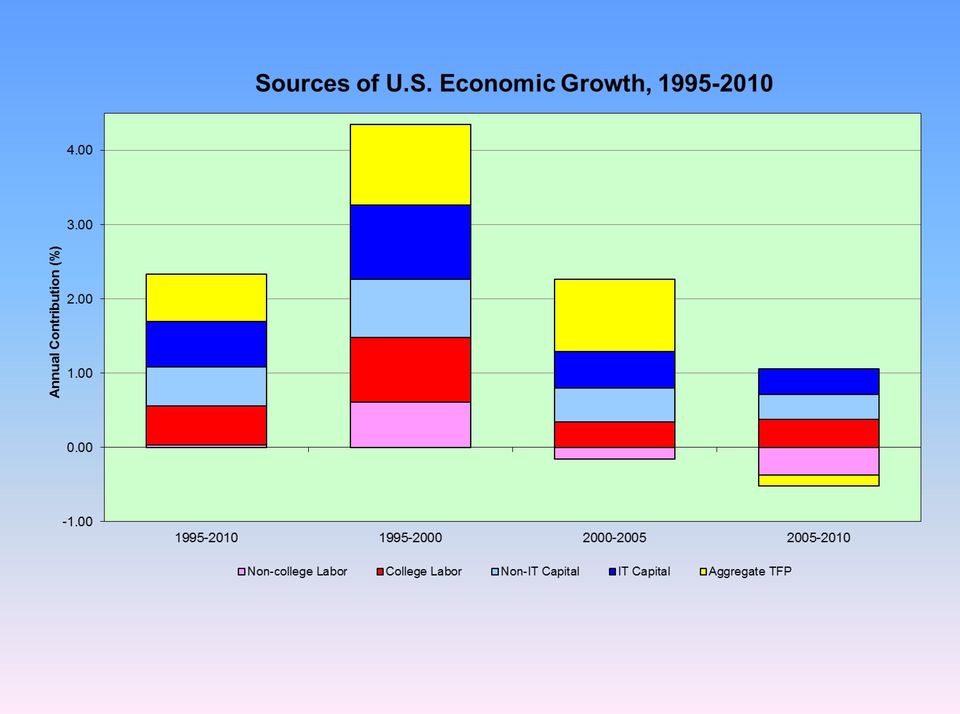
18 SOURCES OF U.S. ECONOMIC GROWTH, Contribution of Capital Input IT and Non-IT Capital Contribution of Labor Input Hours and Labor Quallity Contribution of Productivity Replication vs. Innovation

19
20
21
22
23 PROJECTING TECHNOLOGY AND ECONOMIC GROWTH Substitution versus Technical Change Substitution among Inputs Capital, Labor, Energy, and Materials Biases of Technical Change Capital, Labor, Energy, and Materials Rate of Technical Change Autonomous and Induced Technical Change
24
25
26
27
28
29 A PROTOTYPE INDUSTRY-LEVEL PRODUCTION ACCOUNT FOR THE UNITED STATES, Summary and Conclusions Sources of U.S. Economic Growth Replication versus Innovation Postwar U.S. Economic History The Postwar Recovery, the Big Slump and the Great Recession Projecting Technology and Economic Growth Substitution versus Technical Change
30
31
DRAFT. All NAICS. 3-Digit NAICS BP C 3 P 76 X 0 BP C 0 P 0 X 2 OC C 29 P 44 X 35 OC C 0 P 0 X 2 MH C 96 MH C 8 P 37 X 62 P 1107 X 587
 All NAICS 3-Digit NAICS BP C 3 P 76 X 0 OC C 29 P 44 X 35 MH C 96 P 1107 X 587 BP C 0 P 0 X 2 OC C 0 P 0 X 2 MH C 8 P 37 X 62 ML C 66 P 958 X 772 ML C 4 P 34 X 69 A. Resource Uses. 11 Agriculture, Forestry,
21 - MINING. 42 0.87% 221 Utilities 42 0.87% 6,152 0.68 23 - CONSTRUCTION
 Total of State, Local Government and Private Sector 11 - AGRICULTURE, FORESTRY, FISHING & HUNTING 21 - MINING 4,824 71 1.47% 111 Crop Production 24 0.50% 2,754 0.87 112 Animal Production 35 0.73% 5,402
Business-Facts: 3 Digit NAICS Summary 2015
 Business-Facts: Digit Summary 5 5 Demographics Radius : 9 CHAPEL ST, NEW HAVEN, CT 65-8,. -.5 Miles, Agriculture, Forestry, Fishing and Hunting Crop Production Animal Production and Aquaculture Forestry
Business-Facts: 3 Digit NAICS Summary 2014
 Business-Facts: 3 Digit Summary 4 County (see appendix for geographies), Agriculture, Forestry, Fishing and Hunting 64 4.6 Crop Production 8.8 Animal Production and Aquaculture. 3 Forestry and Logging
VERMONT UNEMPLOYMENT INSURANCE WAGES, BENEFITS, CONTRIBUTIONS AND EMPLOYMENT BY INDUSTRY CALENDAR YEAR 2014
 WAGES, BENEFITS, CONTRIBUTIONS AND EMPLOYMENT BY INDUSTRY Vermont Department of Labor VERMONT UNEMPLOYMENT INSURANCE PROGRAM WAGES, BENEFITS, CONTRIBUTIONS AND EMPLOYMENT BY INDUSTRY Visit us at our web
1997 NAICS Agriculture, Forestry, Fishing and Hunting Mining Utilities
 11 1997 NAICS Adult Entertainment Business Agriculture, Forestry, Fishing and Hunting 111 Crop Production 1114 Greenhouse, Nursery & Floriculture Production L M H MHR CSC NC LNC OPD DD PUD Mixed A-1 L1
GENERAL INFORMATION FORM -- AUTHORIZATION APPLICATION NAICS CODES GENERAL INFORMATION
 GIF CODES COMMONWEALTH OF PENNSYLVANIA DEPARTMENT OF ENVIRONMENTAL PROTECTION GENERAL INFORMATION FORM -- AUTHORIZATION APPLICATION NAICS CODES GENERAL INFORMATION The United States has a new industry
Employment Change Due to Carbon Pricing, 2035 Policy Scenario Vs Baseline Industry Name North American Industrial Classification System # (NAICS)
") Employment Change Due to Carbon Pricing, 2035 Policy Scenario Vs Baseline Industry Name North American Industrial Classification System # (NAICS) 2035 (Net Jobs) Construction - 23 4774 1.21% Scientific
Employment Change Due to Carbon Pricing, 2035 Policy Scenario Vs Baseline Industry Name North American Industrial Classification System # (NAICS) 2035 (Net Jobs) Construction - 23 4774 1.21% Scientific
North Bay Industry Sector Rankings (By County) October 2015 Jim Cassio
 October 2015 Jim Cassio") North Bay Rankings (By County) October 2015 Jim Cassio North Bay Rankings (By County) Source: EMSI (Economic Modeling Specialists, Intl.) Contents Lake County... 3 Jobs... 3 Job Growth (Projected)...
North Bay Rankings (By County) October 2015 Jim Cassio North Bay Rankings (By County) Source: EMSI (Economic Modeling Specialists, Intl.) Contents Lake County... 3 Jobs... 3 Job Growth (Projected)...
What is the New Economy?
 What is the New Economy? Tokyo June 29-30, 2007 By Dale W. Jorgenson, Mun Ho, Jon Samuels, and Kevin Stiroh Harvard University, Resources for the Future, Johns Hopkins University, and the Federal Reserve
REMI Industries for v9 Models
 1 Forestry, fishing, related activities, and other 113-115 1 Forestry and logging; Fishing, hunting, and trapping 113, 114 1 Forestry; Fishing, hunting, and trapping 1131, 1132, 114 2 Logging 1133 2 Agriculture
Business Finance: Will I Make a Profit?
 By: Michael Brown Business Finance: Will I Make a Profit? FOCUS: Overview: Students analyze the financial information from two business plans to learn how revenues can be increased or costs decreased in
NAICS CHANGES IN CES PUBLISHING DETAIL CHANGES FROM SIC TO NAICS By: Joseph F. Winter, CES Supervisor
 NAICS CHANGES IN CES PUBLISHING DETAIL CHANGES FROM SIC TO NAICS By: Joseph F. Winter, CES Supervisor The change in the CES publishing structure from the SIC industry groupings to the NAICS is in effect
Supplier Diversity Program. Ensure a diversity of small businesses work with the Smithsonian to accomplish the Institution s mission.
 SDP Goals Supplier Diversity Program Ensure a diversity of small businesses work with the Smithsonian to accomplish the Institution s mission. Accomplish success through each museum, research institute
Inteligencia-Economica-exportaciones-por-naics
 PrimaryNaics Main_Export_Dest 42 - Wholesale Trades 60 546 - Management, Scientific, and Technical Consulting Services 3-33 - 32 549 - Other Professional, Scientific, and Technical Services 4224 - Grocery
PRINCIPAL BUSINESS ACTIVITIES OF THE COMPANY
 PRINCIPAL BUSINESS ACTIVITIES OF THE COMPANY S. No. Field Name Instructions II Number of business Enter the number of business undertaken by the company. II Main code Based on the number of business undertaken,
The Town of Aurora Business Directory (the Directory ) is published by The Corporation of the Town of Aurora (the Town ) on an annual basis.
 is published by The Corporation of the Town of Aurora (the Town ) on an annual basis.") Disclaimer The Town of Aurora Business Directory (the Directory ) is published by The Corporation of the Town of Aurora (the Town ) on an annual basis. In compiling the Directory, all reasonable efforts
Disclaimer The Town of Aurora Business Directory (the Directory ) is published by The Corporation of the Town of Aurora (the Town ) on an annual basis. In compiling the Directory, all reasonable efforts
Data Appendix to Economic Growth in the Information Age
 Data Appendix to Economic Growth in the Information Age Dale W. Jorgenson, Mun Ho, Ankur Patel, and Jon Samuels Draft April 27 2014 A. Introduction and Classifications A.1 Labor input by NAICS industries
North American Industry Classification System (NAICS) Code and Descriptions
 Code and Descriptions") North American Industry Classification System (NAICS) Code and Descriptions To use this document, please click on NAICS Section code in which you are engaged. The link will direct you to the available
North American Industry Classification System (NAICS) Code and Descriptions To use this document, please click on NAICS Section code in which you are engaged. The link will direct you to the available
Summary of Survey Methods
 2 Summary of Survey Methods 1. Objective of the survey This survey is conducted as part of the basic statistical surveys under the Statistics Act, in accordance with the Regulations on Surveys for the
NEW YORK DBL BENEFITS FROM THE HARTFORD.
 GROUP BENEFITS Rate guide: Effective February 1, 2012 NEW YORK DBL BENEFITS FROM THE HARTFORD. More disability benefit choices for NY employers with 10 to 99 employees. THE HARTFORD EXPANDS NY DISABILITY
Promoting Careers in Maintenance
 Promoting Careers in Maintenance I m 18 years old and don t especially want to go to college. I m not sure what I want to study or what kind of a program or career to pursue. I ve got good grades. I suppose
Total Employees 9,863 17,107 Total Establishments 448 1,751
 Business Comparison Geography: ZIP - 98498, ZIP - The total number of businesses in the demographic reports may be higher due to the roll-up of additional small business entities not otherwise contained
Policy on Scoping Quality/Environmental Management Systems Certification Bodies
 Policy on Scoping Quality/Environmental Management Systems Certification Bodies Purpose: The purpose of this policy is to ensure that the International Accreditation Service (IAS) applicants and accredited
Industry Sector Analysis
 Industry Sector Analysis Growth, Core, and Competitive-Advantage Industries Southeast Michigan Macomb, Monroe, Oakland, St. Clair and Wayne Counties A Regional Profile Prepared by: Michigan Department
Regional Competitive Industry Analysis
 Regional Competitive Industry Analysis Crook, Deschutes, and Jefferson Counties May 2014 Jefferson Deschutes Crook Michael Meyers, Economist (503) 229-6179 [email protected] Global Strategies
0.5 Miles: N ANN ARBOR ST & E MICHIGAN AVE SALINE, MI 48176. Total Employees 1,492 3,240 4,955 Total Establishments 184 403 595
 Business Comparison Geography: 0.5 Miles: N ANN ARBOR ST &, 1 Mile: N ANN ARBOR ST & E MICHIGAN AVE SALINE, MI, 2 Miles: N ANN ARBOR ST & The total number of businesses in the demographic reports may be
Business Major Industries Summary
 Business Major Industries Summary Geography: Youngstown The number of businesses in the Business/Households data includes more small business entities, therefore the count of businesses under that tab
A Prototype BEA/BLS Industry Level Production Account for the United States
 A Prototype BEA/BLS Industry Level Production Account for the United States Susan Fleck* Steven Rosenthal* Matthew Russell** Erich H. Strassner** Lisa Usher* Final version: November, 2012 Presented at
Survey Data Analysis with China and US Geo-Explorers. Shuming Bao China Data Center University of Michigan
 Survey Data Analysis with China and US Geo-Explorers Shuming Bao China Data Center University of Michigan Topics 1. Exploring local amenity data (environmental data) with China Geo-Explorer 2. Integrating
SWITCH TO THE NEW CLASSIFICATION OF ECONOMIC ACTIVITIES (NACE REV2)
") SWITCH TO THE NEW CLASSIFICATION OF ECONOMIC ACTIVITIES ( REV) 1 Introduction of new classification of activities (nace rev) 1.1. General Classifications of activities and products are revised periodically.
SWITCH TO THE NEW CLASSIFICATION OF ECONOMIC ACTIVITIES ( REV) 1 Introduction of new classification of activities (nace rev) 1.1. General Classifications of activities and products are revised periodically.
Afghanistan Statistical Yearbook 2011-12 126
 Afghanistan Statistical Yearbook 2011-12 126 Afghanistan Statistical Yearbook 2011-12 127 Afghanistan Statistical Yearbook 2011-12 128 Afghanistan Statistical Yearbook 2011-12 129 Million Afs Sector 1390
Industry Clusters in New York s Economy: A Statewide and Regional Analysis
 Industry Clusters in New York s Economy: A Statewide and Regional Analysis October 2012 New York State Department of Labor Division of Research and Statistics Bureau of Labor Market Information Peter M.
FOURTH QUARTER 2014 DATA FROM THE QUARTERLY FINANCIAL REPORT: U.S. MANUFACTURING, MINING, WHOLESALE TRADE, AND SELECTED SERVICE INDUSTRIES
 FOR RELEASE MONDAY, MARCH 23, 2015 AT 10 A.M. EDT CB15-48 U.S. Census Bureau Contact: Brandi Maxson or Rose Antonio (301) 763-6600 e-mail: [email protected] FOURTH QUARTER 2014 DATA FROM THE QUARTERLY
Industry Clusters in New York s Economy: A Statewide and Regional Analysis
 Industry Clusters in New York s Economy: A Statewide and Regional Analysis December 2011 New York State Department of Labor Division of Research and Statistics Bureau of Labor Market Information Colleen
THRESHOLD ANALYSIS FOR MOORE, OKLAHOMA
 AE-13042 THRESHOLD ANALYSIS FOR MOORE, OKLAHOMA Susan Moffat, County Extension Director, Cleveland County (405) 321-4774 Dave Shideler, Extension Economist, OSU, Stillwater (405) 744-6170 OKLAHOMA COOPERATIVE
Private sector wage and salary workers 2 Government workers 3 Self-employed workers 4. Number Percent Number Percent Number Percent Number Percent
 Total 106 100.0 88 100.0 11 100.0 7 100.0 Goods producing 45 42.5 44 50.0 -- -- 1 14.3 Natural resources and mining 13 12.3 13 14.8 -- -- -- -- Agriculture, forestry, fishing and hunting -- -- -- -- --
An analysis of the drivers behind the fall in direct investment earnings and their impact on the UK's current account deficit
 Article An analysis of the drivers behind the fall in direct investment earnings and their impact on the UK's current account deficit The UK current account deficit continued to widen in 2015, marking
No Environmentally Sensitive NAICS Codes. Environmentally Sensitive NAICS Codes. No Further Investigation 9
 KILBANE Environmental, Inc. 1. Compare identified NAICS codes to SBA environmentally sensitive codes (see attached). Treat units in multi-unit buildings as having no environmentally sensitive codes. 2.
Further Integrating BEA s Economic Accounts: Introducing Annual Input-Output Estimates into the Gross State Product by Industry Accounts 1
 Further Integrating BEA s Economic Accounts: Introducing Annual Input-Output Estimates into the Gross State Product by Industry Accounts 1 John Sporing, Jr. 2, George K. Downey, and John R. Kort WP2005-04
Variable List. Ifo Investment Database
 Variable List Ifo Investment Database Data: 1991-2012 Date: February 2015 Content Page 1 Variable Description Pages 2-4 LMU-ifo Economics & Business Data Center (EBDC) Poschingerstr. 5 81679 München Variable
Information Form THIS SECTION FOR EPE USE ONLY: EPE Supplier #: Entered By: Date Received:
 THIS SECTION FOR EPE USE ONLY: EPE Supplier #: Entered By: Date Received: El Paso Electric Cash Management Loc: 151 P.O. Box 982 El Paso, TX 79960 Phone: (915) 543-4362 Fax: (915) 543-2204 www.epelectric.com
Overview of Capital Inputs for the BLS Multifactor Productivity Measures
 Bureau of Labor Statistics Multifactor Productivity July 26, 2006 Overview of Capital Inputs for the BLS Multifactor Productivity Measures The Bureau of Labor Statistics (BLS) has published updated multifactor
List of Services Sector
 List of Services Sector SERVICES SECTOR ELECTRICITY, GAS, STEAM & AIR CONDITIONING SUPPLY Electric power generation, transmission and distribution Manufacture of gas; distribution of gaseous fuels through
Voluntary Short-Term Disability Insurance
 Voluntary Short-Term Disability Insurance available from Employee s Choice Group Sizes 5-19 An independent licensee of the Blue Cross and Blue Shield Association. Affordable salary protection in case of
Jan Saxhaug Regional Labor Market Analyst Labor Market Information Office
 Northeast Region Labor Market Trends Jan Saxhaug Regional Labor Market Analyst Labor Market Information Office Labor Market Information (LMI) Office LMI Office supports state workforce and economic development
Map of Industry Classification Benchmark (ICB) to proposed GRI Business Activity Groups
 to proposed GRI Business Activity Groups") Additional information about the project can be found at https://www.globalreporting.org/reporting/sector-guidance/topics-research/pages/default.aspx Map of Industry Classification Benchmark (ICB) to proposed
Additional information about the project can be found at https://www.globalreporting.org/reporting/sector-guidance/topics-research/pages/default.aspx Map of Industry Classification Benchmark (ICB) to proposed
Forest Nurseries and Gathering of Forest Products Logging Timber Tract Operations Miscellaneous Agribusiness
 Industry Definition Outline: Sector / Group / Industry / Subindustry Sector Ind. Group Industry Subindustry Commodities Agribusiness Animal Production Animal Aquaculture Cattle Ranching and Dairy Farming
industry industry_label 0 All NAICS Industry Groups 1111 Oilseed and Grain Farming 1112 Vegetable and Melon Farming 1113 Fruit and Tree Nut Farming
 0 All NAICS Industry Groups 1111 Oilseed and Grain Farming 1112 Vegetable and Melon Farming 1113 Fruit and Tree Nut Farming 1114 Greenhouse, Nursery, and Floriculture Production 1119 Other Crop Farming
Women-Owned Small Business Federal Contract Program; Identification of Eligible
 This document is scheduled to be published in the Federal Register on 03/03/2016 and available online at http://federalregister.gov/a/2016-04762, and on FDsys.gov Billing Code: 8025-01 SMALL BUSINESS ADMINISTRATION
QUARTERLY ESTIMATES FOR SELECTED SERVICE INDUSTRIES 1st QUARTER 2015
 Aidan Smith / Roderick Asekhauno Harold Laney / Rebecca Hutchinson Economic Indicators Division (301) 763-2960 FOR IMMEDIATE RELEASE WEDNESDAY, JUNE 10, AT 10:00 A.M. EDT QUARTERLY ESTIMATES FOR SELECTED
Business Overview (NAICS) By Type of Business Employees (NAICS) Establishments (NAICS)
 By Type of Business Employees (NAICS) Establishments (NAICS)") 10 mi 25 mi 50 mi Business Overview (NAICS) Total: Employees 17,066 22,377 48,289 Total: Establishments 1,888 2,798 6,333 Total: Payroll (NAICS)($mil) $616 $794 $1,789 Total: Retail Sales (NAICS)($mil)
10 mi 25 mi 50 mi Business Overview (NAICS) Total: Employees 17,066 22,377 48,289 Total: Establishments 1,888 2,798 6,333 Total: Payroll (NAICS)($mil) $616 $794 $1,789 Total: Retail Sales (NAICS)($mil)
Appendix Table 1. NAICS based Definition of Coast Industries: List of Industry Sectors Considered to Be Coast Industries
 Appendix Table 1. NAICS based of Coast Industries: List of Industry Sectors Considered to Be Coast Industries Sector and Industry_BLS Construction Marine related Construction 237120 Oil and gas pieline
1.0 Background 1.1 TOWN OF GANANOQUE 1.2 DOWNTOWN CORE
 TOWN OF GANANOQUE BUSINESS MIX ANALYSIS TOWN OF GANANOQUE BUSINESS MIX ANALYSIS Prepared by: Town of Gananoque Economic Development Department 2014 1.0 Background 1.1 TOWN OF GANANOQUE The Town of Gananoque
This release of the Bureau of Labor
 Employment outlook: 2010 2020 Industry employment and output projections to 2020 The health care and social assistance sector and the professional and business services sector will account for almost half
We look forward to serving you!
 Dear Construction Customer: Enclosed you will find your DP&L Electric Construction Packet. This packet provides you with the information needed to obtain your new electric service or electric service change
Alberta Economic Multipliers
 Alberta Economic Multipliers 2011 Representations and Warranties Government of Alberta, 2015 The information contained in this publication is based on the 2011 Input tables produced by Statistics Canada.
Standard Industrial Classification for Companies and Enterprises SIC-C (1980)
") Standard Industrial Classification for Companies and Enterprises SIC-C (1980) SECTOR A - FOOD, BEVERAGE AND TOBACCO Subsector 01 - Food (Except Retailing) 011 - Fish and Other Seafood 0111 Fishing 0112
Standard Industrial Classification for Companies and Enterprises SIC-C (1980) SECTOR A - FOOD, BEVERAGE AND TOBACCO Subsector 01 - Food (Except Retailing) 011 - Fish and Other Seafood 0111 Fishing 0112
Thomson Reuters Business Classification
 Classification Structure 2012 Economic Sector: 50 Energy 5010 Energy - Fossil Fuels 501010 Coal 50101010 Coal 501020 Oil & Gas 50102010 Integrated Oil & Gas 50102020 Oil & Gas Exploration and Production
NAICS Codes - - 251 $164,546,671 236 $52,396,806 195 $28,941,727 190 $6,460,652 165 $33,006,079
 NAICS Codes Description: Filters: Date Signed only show values between '10/01/2006' and '09/30/2007', Contracting Agency ID show only ('8900'), Contracting Office ID show only ('00001') 541519 OTHER COMPUTER
INDUSTRY CODES. MINING 040 Metal mining 041 Coal mining 042 Oil and gas extraction 050 Nonmetallic mining and quarrying, except fuels
 AGRICULTURE, FORESTRY, AND FISHERIES 010 Agricultural production, crops 011 Agricultural production, livestock 012 Veterinary services 020 Landscape and horticultural services 030 Agricultural services,
Aggregated Cluster Definitions
 Aggregated Cluster Definitions To minimize the problems caused by data suppression in the nationwide county analysis, the research team revised the six-digit cluster definitions to use three-digit NAICS
HOUSTON-THE WOODLANDS-SUGAR LAND METROPOLITAN STATISTICAL AREA (H-W-S MSA) Visit our website at www.wrksolutions.com
 Visit our website at www.wrksolutions.com") Labor Market Information SEPTEMBER 2015 Employment Data HOUSTON-THE WOODLANDS-SUGAR LAND METROPOLITAN STATISTICAL AREA () Visit our website at www.wrksolutions.com THE RATE OF UNEMPLOYMENT IN THE WAS UNCHANGED
Labor Market Information SEPTEMBER 2015 Employment Data HOUSTON-THE WOODLANDS-SUGAR LAND METROPOLITAN STATISTICAL AREA () Visit our website at www.wrksolutions.com THE RATE OF UNEMPLOYMENT IN THE WAS UNCHANGED
Colorado Employment Outlook Summary
 Each year, thousands of Coloradans seek employment while others enroll in educational programs designed to prepare them for various occupations. Without information about future occupational and industry
Map of proposed GRI Business Activity Groups to Thomson Reuters Business Classification (TRBC)
") Additional information about the project can be found at https://www.globalreporting.org/reporting/sector-guidance/topics-research/pages/default.aspx Map of proposed GRI Business Activity Groups to Thomson
Additional information about the project can be found at https://www.globalreporting.org/reporting/sector-guidance/topics-research/pages/default.aspx Map of proposed GRI Business Activity Groups to Thomson
NAICS CLASSIFICATION CODES
 NAICS CLASSIFICATION CODES NOTE: When entering the NAICS detail number, a five-digit number is required Accordingly, leading zeros should be used when necessary. NOTE: Please note that Trend Table No.
KING COLLEGE SCHOOL OF BUSINESS KING COLLEGE REGIONAL ECONOMIC STUDIES (KCRES) KCRES PAPER NO. 4, May 2012
 KCRES PAPER NO. 4, May 2012") KING COLLEGE SCHOOL OF BUSINESS KING COLLEGE REGIONAL ECONOMIC STUDIES (KCRES) KCRES PAPER NO. 4, May 2012 Economic Impact Multipliers for the Coalfield Region of Southwestern Virginia The Coalfield Region
KING COLLEGE SCHOOL OF BUSINESS KING COLLEGE REGIONAL ECONOMIC STUDIES (KCRES) KCRES PAPER NO. 4, May 2012 Economic Impact Multipliers for the Coalfield Region of Southwestern Virginia The Coalfield Region
SURVEY OF NEW FOREIGN DIRECT INVESTMENT IN THE UNITED STATES FORM BE-13D
 FORM BE-D (REV. /04) OMB No. 0608-005: Approval Expires 0//07 MANDATORY CONFIDENTIAL* SURVEY OF NEW FOREIGN DIRECT INVESTMENT IN THE UNITED STATES FORM BE-D (Report for the Expansion of an Existing U.S.
KOSGEB Entrepreneurship Supports. July 2011 Ayşegül ÇELİK KOSGEB
 KOSGEB Entrepreneurship Supports July 2011 Ayşegül ÇELİK KOSGEB KOSGEB Supports KOSGEB Supports Supports for SMEs Supports for Potential Entrepreneurs Start-up Training Start-up Capital Business Incubators
SURVEY OF NEW FOREIGN DIRECT INVESTMENT IN THE UNITED STATES FORM BE-13B
 FORM BE-B (REV. /04) OMB No. 0608-005: Approval Expires 0//07 MANDATORY CONFIDENTIAL* SURVEY OF NEW FOREIGN DIRECT INVESTMENT IN THE UNITED STATES FORM BE-B 005 (Report for Establishment of a New U.S.
SURVEY OF NEW FOREIGN DIRECT INVESTMENT IN THE UNITED STATES FORM BE-13A
 FORM BE-A (REV. /0) OMB No. 0608-005: Approval Expires 0//07 MANDATORY CONFIDENTIAL* SURVEY OF NEW FOREIGN DIRECT INVESTMENT IN THE UNITED STATES FORM BE-A (Report for Acquisition of a U.S. Business Enterprise
Baseline data: RCI Economic Development Committee
 2011 County Business Patterns & Non-Employer Statistics, (NAICS), US Census Bureau The US Census provides establishments by employment size (self-employed/non-employer and 9 class sizes) using the NAICS
Copyright: SFSO Neuchâtel 2002 Reproduction with mention of source authorized (except for commercial purposes)
") NOGA General Classification of Economic Activities Structure Bern, 2002 Information: Editor: Obtainable from: Section: Original text: Translation: Cover : Layout: Esther Nagy, BFS Tel. ++41 32 713 66 72
NOGA General Classification of Economic Activities Structure Bern, 2002 Information: Editor: Obtainable from: Section: Original text: Translation: Cover : Layout: Esther Nagy, BFS Tel. ++41 32 713 66 72
LIST OF ECONOMIC ACTIVITIES
 HUNGARIAN POPULATION CENSUS 2001 LIST OF ECONOMIC ACTIVITIES (CODING MANUAL) AGRICULTURE, HUNTING, FORESTRY 01 Agriculture, hunting 011 Growing of crops; market gardening; horticulture 012 Farming of animals
Imported Inputs and Industry Contributions to Economic Growth: An Assessment of Alternative Approaches
 Imported Inputs and Industry Contributions to Economic Growth: An Assessment of Alternative Approaches Erich H. Strassner, Robert E. Yuskavage, and Jennifer Lee U.S. Department of Commerce Bureau of Economic
Nonfatal Workplace Injuries and Illnesses in Maryland for 2010
 Nonfatal Workplace Injuries and Illnesses in Maryland for 2010 Nearly 74 thousand nonfatal work-related injuries and illnesses were reported by Maryland s public and private sector workplaces during 2010
Compatible Uses in APZ-1 as of July 1, 2007
 MANUFACTURING Sawmills 321113 Lumber and wood products (except furniture); Lumber, parallel strand, 321213 Lumber and wood products (except furniture); All Other Miscellaneous Wood Product Manufacturing
Comparison of 1997 NAICS-based ISI codes with 2002 NAICS-based ISI codes
 Comparison of 1997 NAICS-based ISI s with 2002 NAICS-based ISI s The following table shows how the international surveys industry (ISI) s based on the 1997 North American Industry Classification System
Foreign Direct Investors Outlays to Acquire or Establish U.S. Businesses Rose in 2004
 EMBARGOED UNTIL RELEASE AT 8:30 A.M. EDT, WEDNESDAY JUNE 1, 2005 Thomas Anderson: (202) 606-9879 BEA 05-23 Foreign Direct Investors Outlays to Acquire or Establish U.S. Businesses Rose in 2004 In 2004,
Impacts of Government Jobs in Lake County Oregon
 Impacts of Government Jobs in Lake County Oregon April 2011 Prepared by Betty Riley, Executive Director South Central Oregon Economic Development District Annual Average Pay Based on Oregon Labor Market