Market Research and Implementation Plan
|
|
|
- Dorthy Floyd
- 10 years ago
- Views:
Transcription
1 Portland Metro Rideshare Market Research and Implementation Plan Task B: Market Analysis Technical Memorandum July 2005 UrbanTrans Consultants Parsons Brinckerhoff / PB Consult Inc.

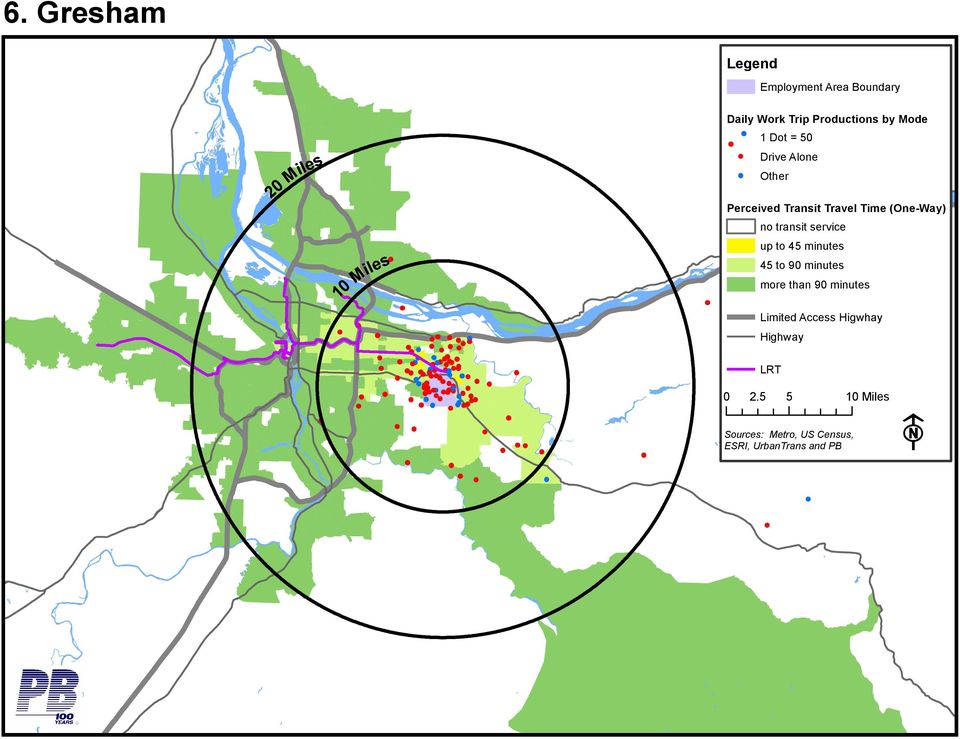
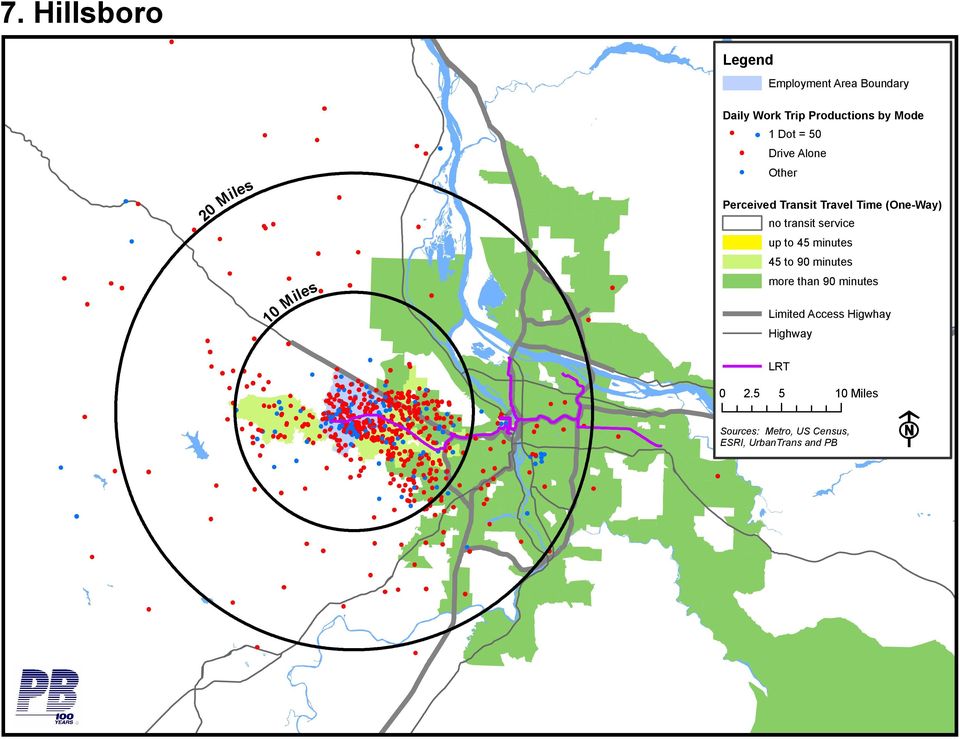
2 Portland Metro Rideshare Marketing and Implementation, Task B Tech Memo, July 2005 Market Analysis Whereas the baseline research described current ridesharing patterns to the region s largest employment areas (see Technical Memorandum A), this research is intended to show where the most promising future opportunities for carpooling and vanpooling may lie. In general, potential rideshare markets were identified by looking for relatively large trip origin clusters (i.e., locations) where a significant number of auto commuters have relatively poor transit access to a particular employment center. Poor transit access for these commuters could be due to: an absolute lack of transit service, infrequent service, or a high number or transfers (the specific method for measuring transit accessibility is described in next section). This analysis focuses on clusters located 10 or miles from the center of each employment area. These are areas that are potentially the most promising for new carpool and vanpool services. or vanpools in particular, the time it takes to collect the participants often becomes longer than the trip unless the trip is of sufficient length. As with the baseline research, this market analysis is intended to inform the development of a comprehensive regional ridesharing program (Task C of this project). Methodology This analysis evaluates the same 16 regional employment centers profiled in the baseline analysis (technical memorandum A). These areas account for the majority of employment in the Portland metropolitan area, and place a higher priority on the use of alternative travel modes. The principal data sources used for the market analysis included: Census for Transportation Planning Package (CTPP), Part 3 (origin / destination), Metro Regional Travel Model The approach to the market analysis is to compare commuter trips by mode to transit travel times for each of the market analysis areas. Places that have relatively poor transit service, produce a large concentration of trips, and are located over ten miles from the market area have better potential as a market for car-pool and van-pool services. Each of the attached maps depicts this information (all maps appear at the end of this memo). UrbanTrans Consultants / Portland Metro,

3 Portland Metro Rideshare Marketing and Implementation, Task B Tech Memo, July 2005 The Census Transportation Planning Package (CTTP), Part 3 is the data source for the home ends (productions) of commuter trips by mode. The CTTP data are tables of commuter trips, by home and work locations, expanded to reflect the population. This data is available at the census tract level. The tables classify trips by mode, household size, and other variables. These trip productions are plotted against perceived transit travel time for oneway work commute trips. This is a measure of travel cost obtained from Metro s travel demand models. Metro s models compute the cost of travel by transportation mode between traffic analysis zones (TAZs). There are three primary transit modes in the Metro model: bus, light rail transit (), and with bus access. Each of the three primary modes is subdivided into walk or drive access. Transit costs in the Metro model are sums of several cost categories: the time spent accessing the transit system, time waiting for a transit vehicle, time to make transfers, and the time spent in the vehicle. Travelers are known to value these cost components differently. Walking time, waiting, and transferring are usually considered more onerous than time spent in the transit vehicle. To compute the weighted one-way transit travel time, the walk time is weighted to be 2.2 times as onerous as the in-vehicle travel time. The initial and transfer wait times have weights of 1.8 and 2.0, respectively. These weights are consistent with other mode choice models. The perceived transit travel time is the minimum weighted transit travel time among the three walk-access-to-transit modes. The maps show the perceived oneway transit travel time from each employment focus area to all areas of the region where transit available. It is important to note that the maps show trip productions by mode as dot densities. Thus, each dot does not necessarily represent the precise location of a commuter cluster. These commuters can in fact be located anywhere within the census tract to which the data applies. Dots appearing in smaller, typically urbanized census tracts, are more likely to represent actual locations, whereas dots in large rural census tracts have less locational accuracy. or readability purposes, the census tract boundaries are not shown on the maps, but were reviewed as part of the analysis. Employment Area indings This section describes the key findings for each of the employment areas. Maps of each of these areas appear at the end of this memo. Downtown / River District Most work trips come from within 10 miles of downtown. UrbanTrans Consultants / Portland Metro,
.")
4 Portland Metro Rideshare Marketing and Implementation, Task B Tech Memo, July 2005 North of downtown, the most promising markets may be in the US 30 corridor up to St. Helens, and also northeast of the I-205/SR 500 interchange in Vancouver. South of downtown, a belt of potential market areas extends from Sherwood in the west (the OR 99W corridor), to Wilsonville, and to Oregon City in the east. Beaverton Most work trips come from west of the Willamette River. The majority of trips are located within 10 miles of Beaverton, although trip origins are also well-scattered throughout the west side of the region. One promising market is west of Beaverton in the cities of Cornelius, orest Grove, and areas northwest of these cities closer to US 26. To the south, a potential market exists in Sherwood and areas further south, both east and west of OR 99W. Clackamas Clackamas attracts a significant number of trips from both Vancouver and areas south of Estacada. To the north, one potential market area is the area northeast of the SR 14/I- 205 interchange in Vancouver. A potential market exists in Beaverton to the west. To the south, the areas around Canby and Molalla may be a potential market. Columbia Corridor A large number to trips originate in Vancouver, and a large number of these are within 10 miles. A potential market exists in Vancouver in the Salmon Creek area west of I-5. Beaverton is potential market. These commuters could also access the Columbia Corridor via light rail, although this may not be occurring due to too many intermediate stops and/or insufficient connections from the Park Rose station. To the south, potential markets are the Oregon City/West Linn/Gladstone area and also Estacada. Gateway Most work trips to Gateway start from within 10 miles away, where transit access is generally good. No significant trip origin clusters exist beyond 10 miles of Gateway. UrbanTrans Consultants / Portland Metro,

5 Portland Metro Rideshare Marketing and Implementation, Task B Tech Memo, July 2005 Gresham Almost all trips to Gresham start from within 10 miles of the employment area. No significant trip origin clusters exist beyond 10 miles of Gresham. Hillsboro Most workers live within 10 miles of Hillsboro or in scattered locations north and west of the city. One potential market is the area northwest and adjacent to orest Grove. Densities in areas further north and closer to US 26 are likely too low to promote carpooling and vanpooling. Kruse Way Kruse Way is a small employment area, and almost all trips start from within 10 miles. No significant trip origin clusters exist beyond 10 miles of Kruse Way. Lloyd District Like downtown Portland, the Lloyd district enjoys good regional transit service. Most work trips come from within 10 miles, and many of these are on transit. Beyond 10 miles from the district, no obvious commuter clusters emerge. Work trip origins to the district are relatively dispersed. Oregon City Relatively few commuters travel to Oregon City from west of the Willamette River. To the north, one potential market is outer southeast Portland (north of Powell Blvd.) and Gresham. A large number of drive alone commuters come from a wide band south of Wilsonville, extending from approximately OR 99E, through Molalla, to Estacada. This area, however, may be too low density/rural in nature to be a promising market. Rivergate Rivergate attracts a significant number of short distance transit users. commuters primarily come from Vancouver and northeast and southeast Portland. UrbanTrans Consultants / Portland Metro,

6 Portland Metro Rideshare Marketing and Implementation, Task B Tech Memo, July 2005 One potential market is the area northeast of the SR 14/I-205 interchange in Vancouver. Another potential market is in southeast Portland, south of Powell Blvd. and west of I-205. SMART / Wilsonville Most work trips to Wilsonville are from within 10 miles or points further north. A potential market exists in Beaverton, although these commuters will benefit from new commuter rail service to Wilsonville in the future. Another potential market exists to the south in Salem. Swan Island Trips to Swan Island are relatively scattered throughout the region, although most come from locations east of the Willamette River. One potential market is the area east of the SR 500/I-205 interchange in Vancouver. Another potential market is the Oregon City/Gladstone area. Troutdale Troutdale is a small employment area, and almost all trips start from within 10 miles. No significant trip origin clusters exist beyond 10 miles of Troutdale. Tualatin Tualatin attracts a significant number of work trips greater than 10 miles in distance. One potential market is in Hillsboro south of the line. Unincorporated Washington County north of US 26 is also a potential market. Northeast and southeast Portland between I-84 and Powell Blvd. is also a potential market. Potential markets also exist in Newberg and Woodburn. Washington Square The large majority of trips come from within 10 miles of the employment area. One potential market is the OR 99W corridor from Sherwood to Newberg. UrbanTrans Consultants / Portland Metro,

7 Portland Metro Rideshare Marketing and Implementation, Task B Tech Memo, July 2005 Top Potential uture Markets Table 1 shows the approximate size of the most promising potential carpool/vanpool markets. Importantly, these markets were identified based solely on the number of commuters to each employment area. No other factors were considered that would likely affect carpool/vanpool formation. Table 1: Most Promising Carpool/Vanpool Markets Employment Area Potential Market Area Commuters Downtown Portland US 30 to St. Helens 800 Downtown Portland NE of I-205/SR Downtown Portland Sherwood 1,000 Downtown Portland Wilsonville 500 Downtown Portland Oregon City 900 Beaverton Cornelius/orest Grove 1,300 Beaverton Sherwood and south 1,000 Clackamas NE of I-205/SR Clackamas Beaverton 500 Clackamas Canby 300 Clackamas Molalla 250 Columbia Corridor Salmon Creek 500 Columbia Corridor Beaverton 750 Columbia Corridor Oregon City/West Linn/Gladstone 500 Columbia Corridor Estacada 250 Hillsboro orest Grove and NW 650 Oregon City Outer SE Portland/Gresham 400 Oregon City Molalla 200 Rivergate NE of I-205/SR Rivergate Outer SE Portland 500 SMART/Wilsonville Beaverton 850 SMART/Wilsonville Salem 1,000 Swan Island E of I-205/SR Swan Island Oregon City/Gladstone 250 Tualatin south Hillsboro 1,000 Tualatin Washington County (north of US 26) 400 Tualatin Newberg 500 Tualatin Woodburn 500 Tualatin NE/SE Portland 650 Washington Square Newberg 800 In addition to understanding the size of markets, other factors need consideration in developing a short list of prioritized markets. or example, places with higher parking prices encourage carpools and vanpool as these help to defray high parking costs. factors to consider include: UrbanTrans Consultants / Portland Metro,

8 Portland Metro Rideshare Marketing and Implementation, Task B Tech Memo, July 2005 Planned high occupancy vehicle (HOV) lanes. HOV lanes provide additional incentives for carpools/vanpool that could benefit adjacent markets. Preferential carpool/vanpool parking. Especially in places facing parking constraints, the presence of these policies will encourage carpools and vanpools. Bridges. The rideshare potential from Vancouver to North Portland areas (e.g., Rivergate, Columbia Corridor) is not fully captured in the prioritized market list. Much of Vancouver falls within a 10 mile radius. However, the presence of only two bridges spanning the Columbia River in this area increases actual drive distances (i.e., out of direction travel). Employer characteristics. Market areas with workers that tend to stay on site and keep regular hours make for better carpool and vanpool opportunities. Planned transit service. Encouraging carpools and vanpools to market areas such as Clackamas Town Center, which is slated to get new MAX service, may not be appropriate as these modes may compete with transit. urther information from the CTPP Part 3 data can be used to develop more detailed profiles of commuters in various travel markets. These data include gender, income, auto ownership, and the diurnal distribution of trips. The data can answer import questions regarding who is making the trip. or instance: Do the travelers in the market have ready access to an automobile? Are these travelers wealthy? Are they male or female? Asking these questions can help to develop commuter profiles, similar to those developed in the Task A report, but targeted to specific markets. These profiles could also be compared to information included in the Travel Behavior Barriers Repor to identify marketing strategies best suited to induce carpool and vanpool formation. UrbanTrans Consultants / Portland Metro,
.")
9 1. Downtown Portland/River District 1 Dot =

10 2. Beaverton

11 3. Clackamas

12 4. Columbia Corridor

13 5. Gateway

14 6. Gresham
15 7. Hillsboro
16 8. Kruse Way

17 9. Lloyd District

18 A. Oregon City

19 B. Rivergate

20 C. SMART/Wilsonville

21 D. Swan Island
22 E. Troutdale Daily Work Trip Productions
23 . Tualatin

24 G. Washington Square
AUGUST 2005. Rideshare Program Market Research and Implementation Plan
 Rideshare Program Market Research and Implementation Plan AUGUST 2005 Prepared by: UrbanTrans Consultants, Inc. In Association With: Parsons Brinckerhoff & Elham Shirazi Acknowledgements Regional Travel
Lents Town Center Mixed-Use Market Study Office Market Analysis Lents, Oregon
 Lents Town Center Mixed-Use Market Study Office Market Analysis Lents, Oregon Portland Development Commission January 2008 Draft Copy 9220 SW Barbur Boulevard Portland, Oregon 97219 503.636.1659 www.marketekinc.com
Oregon Health Leadership Council Low Back Pain Pilot Participating Physical Therapy Clinics
 Oregon Health Leadership Council Low Back Pain Pilot Participating Physical Clinics C.H. Physical 1 16985 NW Cornell Rd. 503.601.9000 Suite 110 Beaverton, OR 97006 Adventist Health Physical 13435 SE 97
Public. A history of public transit in Portland. trimet.org/history. Hilary Pfeifer. Meredith Dittmar. Melody Owen. Mark Richardson Smith
 Hilary Pfeifer Meredith Dittmar Public Transit A history of public transit in Portland Melody Owen Mark Richardson Smith Kristin Mitsu Shiga Chandra Bocci trimet.org/history Traveling through time Dear
Downtown Vancouver Full Block For Sale 1.03 Acre Redevelopment Opportunity
 FOR SALE E Mill Plain & E Main Street, Vancouver, WA E 16th St Main St Columbia St Washington St E 15th St E Mill Plain Blvd Downtown Vancouver Full Block For Sale 1.03 Acre Redevelopment Opportunity $2,00,000
Overview of the Travel Demand Forecasting Methodology
 Overview of the Travel Demand Forecasting Methodology Prepared by the Central Transportation Planning Staff (CTPS) Authors: Scott A. Peterson, Manager Ian Harrington, Chief Planner March 29, 2008 1 OVERVIEW
6 REGIONAL COMMUTE PATTERNS
 6 REGIONAL COMMUTE PATTERNS INTRODUCTION One of the challenges for this study, which has a primary goal of looking at commute opportunities in MnDOT District 3, is that in some portions of the study area,
Chapter 9: Transportation
 Chapter 9: Transportation What is this chapter about? The goals and policies in this chapter convey the City s intent to: Create a coordinated, efficient, and more affordable multimodal transportation
APPENDIX E TASK 5 TECHNICAL MEMORANDUM: TRAVEL DEMAND FORECASTING PROCESS
 APPENDIX E TASK 5 TECHNICAL MEMORANDUM: TRAVEL DEMAND FORECASTING PROCESS INTRODUCTION The purpose of this Technical Memorandum is to describe the methodologies and assumptions used in estimating travel
Executive Summary. Transportation Needs CHAPTER. Existing Conditions
 CHAPTER 1 Executive Summary The City of Forest Grove Transportation System Plan (TSP) was updated to keep it consistent with recent growth trends in the city and other transportation planning efforts in
ORANGE COUNTY TRANSPORTATION AUTHORITY. Final Long-Range Transportation Plan - Destination 2035. Attachment A
 ORANGE COUNTY TRANSPORTATION AUTHORITY Final Long-Range Transportation Plan - Destination 2035 Attachment A DESTINATION 2035 DESTINATION 2035 EXECUTIVE SUMMARY ATTACHMENT A Moving Toward a Greener Tomorrow
14-97. 14-97.002 Definitions. For the purposes of this rule chapter the following definitions shall apply unless the context clearly shows otherwise:
 14-97 14-97.001 Purpose. This rule chapter sets forth an access control classification system and access management standards to implement the State Highway System Access Management Act of 1988. The implementation
2030 DISTRICT PERFORMANCE METRIC BASELINES
 2030 DISTRICT PERFORMANCE METRIC BASELINES The Seattle 2030 District is a groundbreaking high-performance building district in downtown Seattle that aims to dramatically reduce the environmental impacts
Oregon Law Enforcement Staffing Study 2004 2008
 Oregon Law Enforcement Staffing Study 2004 2008 Prepared by the Oregon Criminal Justice Commission Purpose: The purpose of this document is to report law enforcement staffing data for Oregon for the five
Lifeline Selection Summary Report
 Oregon Seismic Lifeline Routes Identification Project Prepared for Oregon Department of Transportation May 1, 2012 1100 NE Circle Boulevard Suite 300 Corvallis, OR 97330 Contents Section 1.0 Introduction...1
EEO PUBLIC FILE REPORT. For the reporting period of 10/01/2014 through 9/30/2015. This report covers the following station employment unit (SEU):
:") EEO PUBLIC FILE REPORT For the reporting period of 1/1/214 through 9/3/215 This report covers the following station employment unit (SEU): Licensee / Permittee Name Call Sign and Type Community of License
EEO PUBLIC FILE REPORT For the reporting period of 1/1/214 through 9/3/215 This report covers the following station employment unit (SEU): Licensee / Permittee Name Call Sign and Type Community of License
Car Wash Locations that Accept the Voyager Fuel Card
 CHEVRONTEXACO INC CARCRAFT CHEVRON 1010 PACIFIC BLVD SE ALBANY CHEVRONTEXACO INC CARSON OIL COMPANY 4175 SANTIAM HWY SE ALBANY CHEVRONTEXACO INC JACKSONS FOOD STORES #108 655 NW NORTH ALBANY RD ALBANY
Oregon City Clackamas County Red Soils Campus
 Oregon City Clackamas County Red Soils Campus Clackamas County Red Soils Campus Oregon City The Clackamas County Red Soils Campus focus area is located in the City of Oregon City. It is situated approximately
Ron Foggin, Dallas City Manager; Jason Locke, Dallas Community Development/Operations Director
 MEMO TO: FROM: Ron Foggin, Dallas City Manager; Jason Locke, Dallas Community Development/Operations Director Daniel Adatto, Administrative Intern DATE: October 2nd, 2014 SUBJECT: City of Dallas Gas Tax
Waco MPO 2040 Socio-Economic Data Forecast Report
 Waco MPO 2040 Socio-Economic Data Forecast Report Purpose and Need In conjunction with the Texas Department of Transportation, the Waco MPO develops a travel demand forecast model to estimate future traffic
Transportation Alternatives
 1 Transportation Alternatives Transportation alternatives involve a variety of components: Location Alternatives - when and where service is provided - general location as well as level of service on the
COADs and EOHS in Oregon Index Updated 2/10/11
 COADs and EOHS in Oregon Index Updated 2/10/11 Community Organizations Active in Disasters 1 - Vernonia's "Unmet Needs Committee" 2 - Clatsop County Long-Term Disaster Recover Committee (CCLTDRC) - contact:
30 Years of Smart Growth
 30 Years of Smart Growth Arlington County s Experience with Transit Oriented Development in the Rosslyn-Ballston Metro Corridor A Presentation by the Arlington County Department of Community Planning,
PERFORMANCE MEASURES FOR MOBILITY MANAGEMENT PROGRAMS
 PERFORMANCE MEASURES FOR MOBILITY MANAGEMENT PROGRAMS Jon E. Burkhardt and Joohee Yum December 30, 2010 In order to be able to assess progress in the implementation of mobility management programs, a system
College of Southern Maryland. Hughesville Transportation Study
 College of Southern Maryland Project Overview Existing Conditions Transit Service Land Use CSM Student Demographics Recommendations Methodology Transit Recommendations Transportation Demand Management
Transit Oriented Development Economic Analysis and Market Study
 Transit Oriented Development Economic Analysis and Market Study Task 2: Regional Demand Analysis & TOD Market Analysis PREPARED FOR City and County of Denver Community Planning and Development PREPARED
HOW WILL PROGRESS BE MONITORED? POLICY AREA. 1. Implement the 2040 Growth Concept and local adopted land use and transportation plans
 PERFORMANCE MONITORING APPROACH OAR 660-044-0040(3)(e) directs Metro to identify performance measures and targets to monitor and guide implementation of the Climate Smart Strategy. The purpose of performance
The Northwest Arkansas Travel Demand Model
 The Northwest Arkansas Travel Demand Model Creation and Results John McLarty Northwest Arkansas Regional Planning Commission Cristina Scarlat Center for Advanced Spatial Technologies What is a Travel Demand
Frequently Asked Questions (FAQs) about DART
 about DART") Frequently Asked Questions (FAQs) about DART What is DART? Where can I take the bus? Where can I take the train? How much does it cost to park at a station? Can I take a train to American Airlines Center?
Frequently Asked Questions (FAQs) about DART What is DART? Where can I take the bus? Where can I take the train? How much does it cost to park at a station? Can I take a train to American Airlines Center?
 Snohomish County Department Of Public Works (DPW) Rules Adopted Pursuant to the Rulemaking Requirements of Chapter 30.82 SCC Providing Detail and Specificity for the Traffic Mitigation and Concurrency
Commuter Choice Certificate Program
 Commuter Choice Certificate Program Current course offerings (subject to change) Core 1 Commuter Choice Toolbox Required Courses Rideshare Options Audience: This 2 credit required course is targeted to
Public Land Survey System - Definition
 Public Land Survey System - Definition The Public Land Survey System (PLSS) is a method used in the United States to locate and identify land, particularly for titles and deeds of farm or rural land. The
Ne w J e r s e y Tr a f f i c Co n g e s t i o n :
 Ne w J e r s e y Tr a f f i c Co n g e s t i o n : A Growing Crisis January 2008 Cover photo : Route 3, Passaic County introduction A rising tide of traffic congestion threatens to increase roadway gridlock,
Schenk-Atwood Neighborhood Business District Master Plan
 Schenk-Atwood Neighborhood Business District Master Plan Prepared for the Schenk-Atwood Revitalization Association (SARA) and the City of Madison SCHREIBER/ANDERSON ASSOCIATES, INC. BEST Real Estate Group,
U.S. Department of Homeland Security Nebraska Avenue Complex Master Plan DRAFT ENVIRONMENTAL IMPACT STATEMENT APPENDIX C
 U.S. Department of Homeland Security Nebraska Avenue Complex Master Plan DRAFT ENVIRONMENTAL IMPACT STATEMENT APPENDIX C January 14, 2011 This page intentionally left blank Transportation Management Plan
Courtney J. Menjivar PRINCIPAL
 Courtney J. Menjivar PRINCIPAL Ms. Menjivar (formerly Kulyk) is a Transportation Demand Management (TDM) Marketing Specialist and has over nine years of transportation marketing experience in research,
In 1992, the US Congress authorized the Moving to Opportunity (MTO) housing voucher
 housing voucher") A Driving Factor in Moving to Opportunity EVELYN BLUMENBERG AND GREGORY PIERCE In 1992, the US Congress authorized the Moving to Opportunity (MTO) housing voucher program to operate in five large metropolitan
A Driving Factor in Moving to Opportunity EVELYN BLUMENBERG AND GREGORY PIERCE In 1992, the US Congress authorized the Moving to Opportunity (MTO) housing voucher program to operate in five large metropolitan
Questions and Answers about the Orange Bus/Rail Investment Plan
 Why are transit improvements needed? Questions and Answers about the Orange Bus/Rail Investment Plan The Triangle Region is now home to 1.5 million people. The U.S. Census and the 2035 Joint Long Range
EEO PUBLIC FILE REPORT. For the reporting period of 10/01/2013 through 9/30/2014. This report covers the following station employment unit (SEU):
:") EEO PUBLIC FILE REPORT For the reporting period of 1/1/213 through 9/3/214 This report covers the following station employment unit (SEU): Licensee / Permittee Name Call Sign and Type Community of License
EEO PUBLIC FILE REPORT For the reporting period of 1/1/213 through 9/3/214 This report covers the following station employment unit (SEU): Licensee / Permittee Name Call Sign and Type Community of License
All questions in this survey were voluntary; all results are based on number of respondents who answered the relevant question.
 Online Survey Results Sound Transit 3 Draft Priority Project List Introduction The primary public engagement method employed to solicit feedback on Sound Transit 3 Draft Priority Project List was an online
NCHRP 8-84/Report 735: Long-Distance and Rural Transferable Parameters for Statewide Travel Forecasting Models
 NCHRP 8-84/Report 735: Long-Distance and Rural Transferable Parameters for Statewide Travel Forecasting Models presented to Atlanta Regional Commission Model Users Group Presented by Robert G. Schiffer,
METROPOLITAN TRANSIT AUTHORITY OF HARRIS COUNTY, TEXAS. Independent Accountants Report on Applying Agreed-Upon Procedures
 METROPOLITAN TRANSIT AUTHORITY OF HARRIS COUNTY, TEXAS Independent Accountants Report on Applying Agreed-Upon Procedures Year ended September 30, 2014 KPMG LLP 811 Main Street Houston, TX 77002 Independent
GTA Cordon Count Program
 Transportation Trends 2001-2011 Executive Summary Project No. TR12 0722 September 2013 1.0 Introduction The Cordon Count program was established to collect traffic data as a tool for measuring travel trends
MOUNTAIN HOUSE MASTER PLAN CHAPTER TEN AIR QUALITY AND TRANSPORTATION MANAGEMENT
 CHAPTER TEN AIR QUALITY AND TRANSPORTATION MANAGEMENT CHAPTER TEN: AIR QUALITY AND TRANSPORTATION MANAGEMENT 10.1 INTRODUCTION 10.1 10.2 OVERALL ISSUES AND CROSS-REFERENCES 10.1 10.3 TRANSPORTATION DEMAND
Appendix J Santa Monica Travel Demand Forecasting Model Trip Generation Rates
 Appendix J Santa Monica Travel Demand Forecasting Model Trip Generation Rates SANTA MONICA TRAVEL DEMAND FORECASTING MODEL TRIP GENERATION RATES SUBMITTED BY: 201 Santa Monica Blvd., Suite 500 Santa Monica,
Attachment B Policy Audit Template
 Attachment B Policy Audit Template 5 6 7 8 9 0 Provide A Variety of Transportation Choices Provide A Variety of Transportation Choices Provide A Variety of Transportation Choices Encourage transit-oriented
2011 Boulder Valley Employee Survey for Transportation Report of Results
 2011 Boulder Valley Employee Survey for Transportation Report of Results June 2012 Image from emerson12 via Flickr, Creative Commons Attribution. 2955 Valmont, Suite 300 Boulder, CO 80301 303 444 7863
State of Oregon Department of Consumer and Business Services Building Codes Division. Oregon epermitting
 State of Oregon Department of Consumer and Business Services Building Codes Division Oregon epermitting 2011 Category: Cross-Boundary Collaboration and Partnerships Project Managers Lori Graham, Building
School-related traffic congestion is a problem in
 SCHOOL TRANSPORTATION Automated Vehicle Location for School Buses Can the Benefits Influence Choice of Mode for School Trips? TORI D. RHOULAC The author is Assistant Professor, Department of Civil Engineering,
OREGON GAMING & ENTERTAINMENT
 OREGON GAMING & ENTERTAINMENT Statewide Oregon Voter Survey June 2009 www.rileyresearch.com 10200 SW Eastridge St, Suite 120, Portland, OR 97225 phone [503] 222-4179 fax [503] 222-4313 INTRODUCTION & METHODOLOGY
Family Planning Clinics in Baker County
 Family Planning Clinics in Baker County Baker County Clinic Baker County Health Department 541-523-8211 3330 Pocahontas Rd. Baker City OR 97814 Pine Eagle Clinic Pine Eagle Clinic 541-742-5023 218 N. Pine
OPCA 14 15 Members, City Sort (list expires June 30, 2015)
") OPCA 14 15 Members, City Sort (list expires June 30, 2015) COMPANY NAME Greene Pest Solutions Albany OR 541 791 1901 www.greenepestsolutions.com Linn, Polk and Marion Counties Services General Pest Control,
OPCA 14 15 Members, City Sort (list expires June 30, 2015) COMPANY NAME Greene Pest Solutions Albany OR 541 791 1901 www.greenepestsolutions.com Linn, Polk and Marion Counties Services General Pest Control,
Results and Opportunities Incorporating Behavioral Economics in Vehicle Use and Parking Pricing Deployments Under the Value Pricing Pilot Program
 Results and Opportunities Incorporating Behavioral Economics in Vehicle Use and Parking Pricing Deployments Under the Value Pricing Pilot Program Allen Greenberg U.S. Department of Transportation Federal
OPCA 14 15 Members, City Sort (list expires June 30, 2015)
") OPCA 14 15 Members, City Sort (list expires June 30, 2015) COMPANY NAME Pointe Pest Control Albany Albany OR 541 371 2966 www.pointepest.com/locations/alb Benton, Linn Services Greene Pest Solutions Albany
OPCA 14 15 Members, City Sort (list expires June 30, 2015) COMPANY NAME Pointe Pest Control Albany Albany OR 541 371 2966 www.pointepest.com/locations/alb Benton, Linn Services Greene Pest Solutions Albany
Memo. Date: January 18, 2013. StarTran Advisory Board. From: Brian Praeuner. Review of Peer Transit Systems
 Memo Date: January 18, 2013 To: StarTran Advisory Board From: Brian Praeuner Re: Review of Peer Transit Systems This memo is in response to the StarTran Advisory Board s request for additional information
Lincoln Downtown Master Plan Update
 Lincoln Downtown Master Plan Update Table of Contents Executive Summary........................................... 1 Complete Streets Framework.................................... 3 Promenade Creating
Transportation Element
 Transportation Element Goal: To maintain and enhance mobility for residents and businesses through the creation and maintenance of a balanced system of transportation alternatives that: Provides a wide
COUNTY PROFILE lauderdale county
 COUNTY PROFILE lauderdale county population households and housing economy education and poverty transporation data sources prepared by Memphis Area Association of Governments preface The purpose of the
CROYDON MAJOR ACTIVITY CENTRE PARKING STUDY
 CROYDON MAJOR ACTIVITY CENTRE PARKING STUDY December 2011 EXECUTIVE SUMMARY Strategic Context The Croydon Town Centre has been classified as a Major Activity Centre (MAC) in the Melbourne 2030 metropolitan
The Fresno COG Travel Demand Forecasting Model How the Pieces Fit Together
 The Fresno COG Travel Demand Forecasting Model How the Pieces Fit Together Mike Bitner PE, Senior Transportation Planner Council of Fresno County Governments 1 COG Modeling Staff Mike Bitner Kathy Chung
VISION, DESIGN PRINCIPLES & OVERALL PLANNING STRATEGY
 3 VISION, DESIGN PRINCIPLES & OVERALL PLANNING STRATEGY The overall planning strategy for the Bank Street CDP is to ensure that future development is undertaken in a coordinated and planned approach, supported
HOT Lanes in Houston Six Years of Experience
 HOT Lanes in Houston Six Years of Experience Mark W. Burris and Bill R. Stockton Texas Transportation Institute Abstract High occupancy/toll (HOT) lanes allow travelers to pay a toll to enter a high occupancy
For more information, visit: rethinkingstreets.com
 For more information, visit: rethinkingstreets.com 37 Arterial Rehab Busy, multi-lane streets, often referred to as arterials, crisscross the landscape of our cities and suburbs. Alongside these wide thoroughfares,
TDC Heavy Vehicle Forecasts - February 2010 Release 2008/09 HOUSEHOLD TRAVEL SURVEY. SUMMARY REPORT 2010 Release
 TDC Heavy Vehicle Forecasts - February 2010 Release 2008/09 HOUSEHOLD TRAVEL SURVEY SUMMARY REPORT 2010 Release 0 About the Transport Data Centre The Transport Data Centre (TDC), of Transport NSW, provides
7.0 TRANSPORTATION MANAGEMENT
 7.0 TRANSPORTATION MANAGEMENT The Kansas City region has invested considerable effort and resources in the design and implementation of its regional multimodal transportation system. As a result of this
Participating Local Government Employers
 Participating Local Government Employers ORS 243.474 authorizes the state to offer its 457 deferred compensation program to all Oregon public employers including special districts, local governments, and
5 Performance Measures
 5 Performance Measures This page left blank intentionally. 5 2 Moving Forward Monterey Bay 2035 Introduction The investments identified in the 2035 MTP/SCS are expected to result in significant benefits