An Introduction to SPSS. Workshop Session conducted by: Dr. Cyndi Garvan Grace-Anne Jackman
|
|
|
- Shon Roberts
- 10 years ago
- Views:
Transcription
1 An Introduction to SPSS Workshop Session conducted by: Dr. Cyndi Garvan Grace-Anne Jackman
2 Topics to be Covered Starting and Entering SPSS Main Features of SPSS Entering and Saving Data in SPSS Importing Data from Excel Simple Data Manipulations Performing Descriptive Statistics
3 Session 1: Starting and Entering SPSS
4 If SPSS is already installed on desktop, double click on the SPSS icon.

5 Open SPSS Via the Start Menu Start > All Programs > SPSS for Windows > SPSS 15.0 for Windows Graduate Pack Your SPSS Version Number may be different.

6 Entering SPSS This Default Window will open Select Cancel
7 Session 2: Overview of Main SPSS Features
8 Four Main Bars 1. The Title Bar 2. The Menu Bar 3. The Tool Bar 4. The Status Bar

9 TITLE BAR MENU BAR TOOL BAR STATUS BAR
10 1 TITLE BAR Name of File Type of Window 2 MENU BAR Located below the Title Bar Lists a set of the actions/procedures that can be performed Uses point and click format to choose from the Pull-Down Menus selection of actions
11 MENU BAR Action Common Uses FILE Open a new/existing file Open a new file Import data into SPSS from an existing text file, Excel spreadsheet or Database Save the data file Exit SPSS for Windows EDIT To make changes to the data - Copy, Paste, Insert Variables, Insert Cases etc. VIEW Hide or show Status bar or Toolbar Change font or point size of the data Hide or show gridlines Switch between Data View and Variable View
12 MENU BAR Action Common Uses DATA To manipulate existing SPSS data files - Define variables, Sort cases, Merge files, Split files, Select cases, Weight cases etc. TRANSFORM Perform computations on variables - Create new variables from existing ones. Recode old variables etc. ANALYZE Contains extensive list of statistical analysis that can be conducted: Ex: Descriptive statistics, ANOVA, Regression etc. GRAPHS To obtain high resolution plots and graphs, which can be edited in Chart Editor window.
13 MENU BAR Action Common Uses UTILITIES To move to any open window or to see which window is active. The window with a check mark is the active one. ADD-ONS Contains a number of Additional Advanced SPSS Products that can be purchased separately and used in conjunction with the base product. Ex: SPSS Conjoint, SPSS Tables, SPSS Maps etc. WINDOW To move to any open window or to see which window is active. The window with a check mark is the active one. HELP To get help on topics in SPSS via a Predefined List of Topics, Tutorial, Statistics Coach, Syntax Guide etc.
14 TOOL BAR 3 Located below the Menu Bar Contains a number of buttons which act as shortcuts Roll cursor over each button to see its function STATUS BAR 4 Shows status of procedures being run Indicates whether data are being filtered, weighted or subdivided
15 Three Primary Windows 1. The Data Editor Window Data Viewer Variable Viewer 2. The Output Viewer Window Contains all the results from performing analyses, e.g. syntax, tables, charts etc. 3. The Syntax Editor Window Used to write SPSS programs to run procedures Used as an alternative to running analyses via the commands in the Menu Bar
16 The Data Editor Window SPSS Data Editor Window - Data View - Variable View

17 Output Viewer Window Syntax Frequency Table Chart

18 Syntax Editor Window SYNTAX
19 Session 3: Entering Data in SPSS
20 Pet Survey We are very interested in learning more about the pets of students, faculty, and staff at the University of Florida! Please take a few minutes to fill out the survey below. If you do not have a pet, please feel free to imagine a fantasy pet and answer the questions with fantasy data. 1. Please circle your average level of happiness on a scale of 1 (extremely unhappy)) to 10 (extremely happy)) (extremely unhappy) (extremely happy) 2. How many pets do you own? pets 3. What is the name of the pet you have owned the longest (or the name of your fantasy pet)? The next set of questions will apply to the pet you have owned for the longest amount of time (or your fantasy pet). 4. How old is this pet? years
21 Pet Survey (cont d) 5. What is the sex of your pet? 1 Male 2 Female 6. What type of animal is this pet? 1 Dog 2 Cat 3 Bird 4 Fish 5 Other, please specify 7. How much does your pet weigh? lbs 8. How satisfied are you with owning this pet? 1 Very dissatisfied 2 Dissatisfied 3 Neutral 4 Satisfied 5 Very satisfied 9. How much money (approximately) do you spend on this pet per year (for food, toys, vet visits, etc.)? $ 10. How much time do you spend each week caring for, exercising or playing with your pet? hours
22 Pet Survey Setting Up the Variables
23 Setting Up the Variables Click on the Variable View Tab at the bottom left of the Data Editor Screen Each row represents one of the variables Each column represents a specific characteristic/attribute of the variable

24 The columns represent specific characteristics of the variables ROWS represent the Variables used in the study Variable View Tab is now highlighted
25 Name In the first column, enter the Name of the Variable. Each name must be unique It can be up to 64 characters long The name cannot begin with a number of contain spaces Keep names short but descriptive of variable Type in Happiness
26 Type In the second column, click on right of this column Select the Variable Type The Default is Numeric If Numeric, select the Width - Number of digits as well as the Number of Decimal Places The Default is Width 8, Decimal Place - 2
")
27 Type (cont d)
28 Label Label allows you to provide the variable with a longer, more complete description Type in Average level of happiness on a scale of 1 to 10
")
29 Value Labels Used for describing the labels of the categories for Nominal or Ordinal (Categorical) Data
30 Missing Values Used to define specific values as being Missing values: non-response, refusal (e.g. 9, 99) Should not be legitimate coded values already included in the data set
31 Column Width The value used for column width indicates how wide the display for each variable will be in the Data View. Column widths can also be changed in Data View, by clicking and dragging the column borders.
32 Alignment Determines how the data for this variable are aligned in their cells in the Data View Window
33 Measurement Level Specify the variable s measurement level as: Nominal Ordinal Scale (Interval or Ratio)
34 Setting up the Variables Set up the other Variables in SPSS numofpets petname petage sexofpet typeofpet Othertype petweight satisfaction moneyspent timespent
35 Setting Up the Variables
36 Setting Up the Variables
37 Pet Survey Entering the Data
38 Pet Survey We are very interested in learning more about the pets of students, faculty, and staff at the University of Florida! Please take a few minutes to fill out the survey below. If you do not have a pet, please feel free to imagine a fantasy pet and answer the questions with fantasy data. 1. Please circle your average level of happiness on a scale of 1 (extremely unhappy)) to 10 (extremely happy)) (extremely unhappy) (extremely happy) 2. How many pets do you own? 3 pets 3. What is the name of the pet you have owned the longest (or the name of your fantasy pet)? Whiskers The next set of questions will apply to the pet you have owned for the longest amount of time (or your fantasy pet). 4. How old is this pet? 3.5 years
39 Pet Survey (cont d) 5. What is the sex of your pet? 1 Male x 2 Female 6. What type of animal is this pet? 1 Dog x 2 Cat 3 Bird 4 Fish 5 Other, please specify 7. How much does your pet weigh? 3.5 lbs 8. How satisfied are you with owning this pet? 1 Very dissatisfied 2 Dissatisfied 3 Neutral x 4 Satisfied 5 Very satisfied 9. How much money (approximately) do you spend on this pet per year (for food, toys, vet visits, etc.)? $ How much time do you spend each week caring for, exercising or playing with your pet? 12.0 hours
40 Entering Data Click on the Data View Tab at the bottom left of the Data Editor Screen Type 7 in the first line under the happiness Column Tab over to the numofpets Column and type 3 Tab over to the petname Column and type Whiskers Tab over to the petage Column and type 3.5 Tab over to the sexofpet Column and type 2 Tab over to the typeofpet Column and type 2 Skip Othertype Column
41 Entering Data (cont d) Tab over to the petweight Column and type 3.5 Tab over to the satisfaction Column and type 4 Tab over to the moneyspent Column and type 350 Tab over to the timespent Column and type 12 Now practice entering the data from the other surveys as well
42
43 Saving Data To Save all the data from the surveys Go to File > Save As Choose a file location Type In Pet Survey SPSS saves the file as Pet Survey.sav Select Save

44 Saving Data
45 Session 4: Importing Data into SPSS

46 Importing an Excel File
47 Importing an Excel File Select File > Open > Data Next, select the folder where the file is located via Look in: Change file type to Excel (*.xls) Select the name of the file and click Open An Excel Data Source Dialogue Box will open Select box to read variables names from the first row, if the first line of the Excel spreadsheet lists the header names Verify the data range Select OK Save File as a SPSS (*.sav) file

48

49

50
51
52

53 Type In File name Select
54 Session 5: Simple Data Manipulations
55 Recoding Data Transform and recode the quantitative variable petweight into an ordinal variable with three new categories Small Medium Large
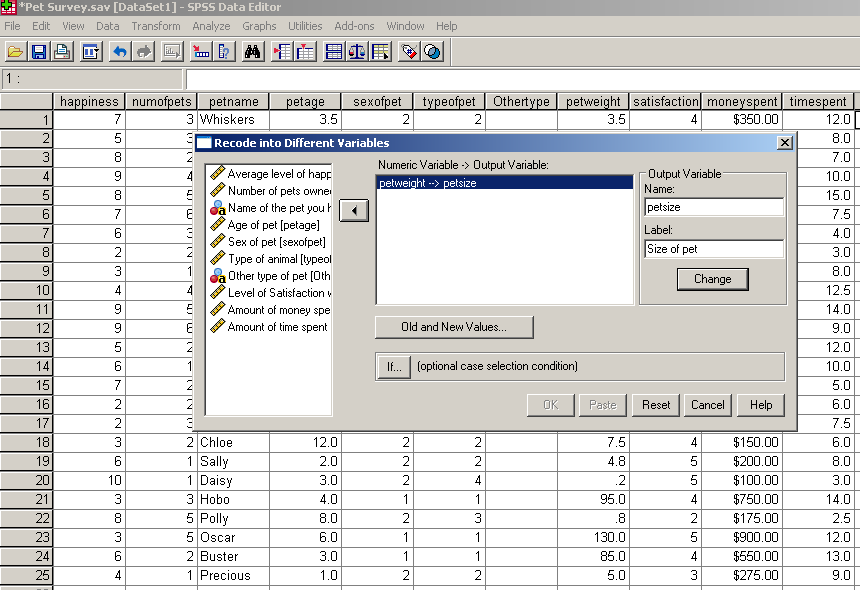
56 Recoding Data Select Transform > Recode Into a Different Variables in order to create a new variable Choosing Recoding Into Same Variables will overwrite the existing data in petweight. This is not the recommended action. A Recode Into a Different Variables dialog box will appear

57
58 Recoding Data Highlight the variable petweight and use the arrow to move that variable into the Input Variable Output Variable box. In the Name box under the Output Variable section, type the new variable name petsize and type the Variable Label Size of pet, then Click the CHANGE button Select the Old and New Values Button. This tell SPSS how to recode the data into our 3 new categories Another Dialog window will appear
59
60 Recoding Data Select Range through Type in 0.0 in the top box and 5.0 in the box under through Type 1 in the Value box under the New Value section, the click ADD Select Range through Type in 5.1 in the top box and 20.0 in the box under through Type 2 in the Value box under the New Value section, the click ADD Select Range, value through HIGHEST Type in 20.1 Type 3 in the Value box under the New Value section, the click ADD Next, select CONTINUE, then click OK

61

62

63

64 In Data View, the new variable, petsize, will now appear as the last column in the variables
65 Recoding Data Click on the bottom left of the screen to switch to Variable View and define the values for this new variable Type 1 in the Value box and Small in the Label box, click ADD Type 2 in the Value box and Medium in the Label box, click ADD Type 3 in the Value box and Large in the Label box, click ADD Select OK Change to the Data View Window to verify whether these changes have been made. Resave the SPSS file

66
67

68 Session 6: Performing Simple Descriptive Statistics
69 The type of data determines the choice of statistical analysis
70 Types of Variables Categorical Variables Variables for which the responses are divided into nonoverlapping categories or groups Numerical Variables A variable for which the responses are meaningful numbers (i.e. you can add and subtract them) Nominal Ordinal Binary Having unordered categories Having categories ordered by size from small to large or visa versa Having only two categories Discrete Continuous Having discrete, countable values, usually with no intermediate values. Having an infinite number of possible values falling between an interval or any two observed values Counts/frequencies Mode Mean, Mode, Median Proportions Range, Variance, Std Deviation, Bar Charts Histograms Pie Charts Box Plot
71 Pet Survey Question # Name Variable Type Q1 happiness Numerical continuous Q2 numofpets Numerical discrete Q3 petname Alphanumeric/text Q4 petage Numerical continuous Q5 sexofpet Binary Q6 typeofpet Categorical nominal Q7 petweight Numerical continuous Q8 satisfaction Categorical ordinal Q9 moneyspent Numerical continuous Q10 timespent Numerical continuous Q11 petsize Categorical ordinal
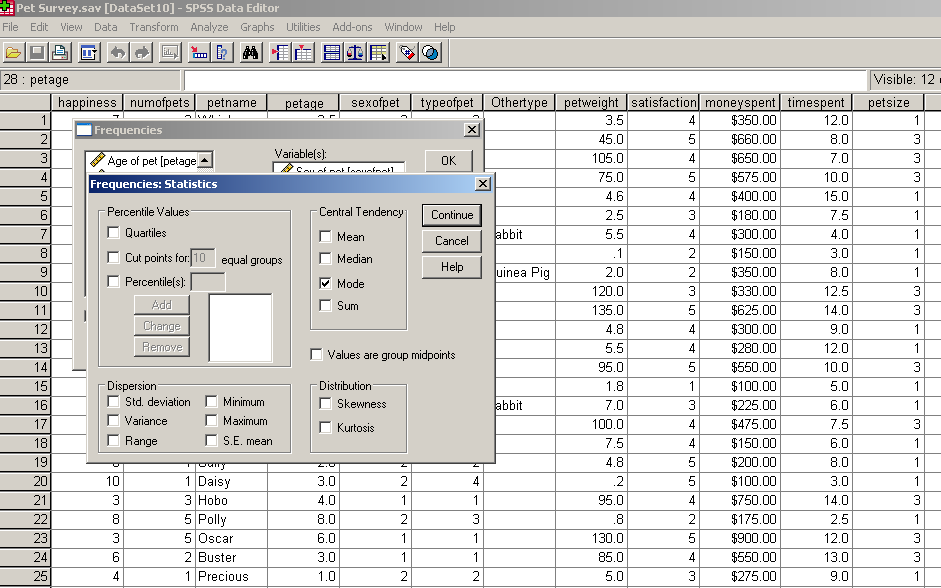
72 Categorical Variables Select Analyze > Descriptive Statistics > Frequencies A Frequencies dialog box will appear Move the categorical variables (sexofpet, satisfaction and petsize), using the arrow into the Variables choice box Click on Statistics

73
74
75 Categorical Variables Under Central Tendency, select Mode, then Select CONTINUE Select Charts. Under Chart Type, select Bar Charts. Under Chart Values, select Percentages Select CONTINUE, then OK.
76

77

78

79 Sample Output Valid Male Female Total Sex of pet Cumulativ e Frequency Percent Valid Percent Percent Valid Dog Cat Bird Fish Other Total Type of animal Cumulativ e Frequency Percent Valid Percent Percent Size of pet Valid Small Large Total Cumulativ e Frequency Percent Valid Percent Percent
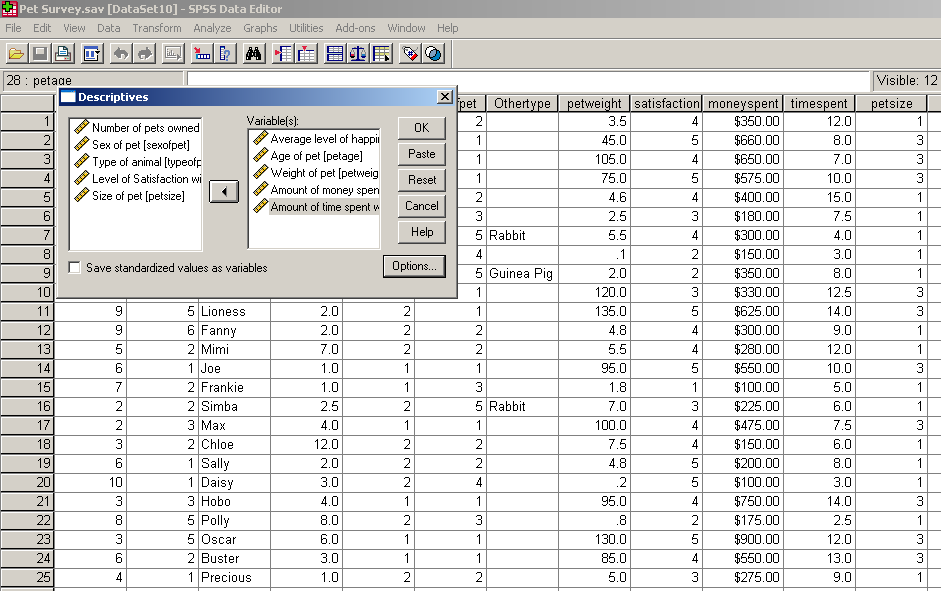
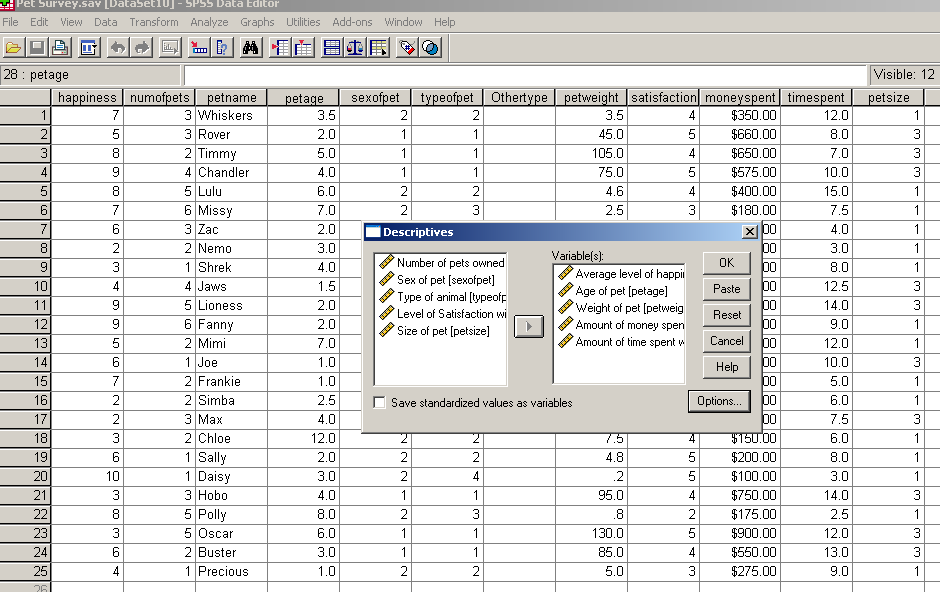
80 Numerical Variables Select Analyze > Descriptive Statistics > Descriptives A Descriptives dialog box will appear Move the numerical variables (happiness, petage, petweight, moneyspent and timespent), using the arrow into the Variables choice box Click on the Options button

81
82
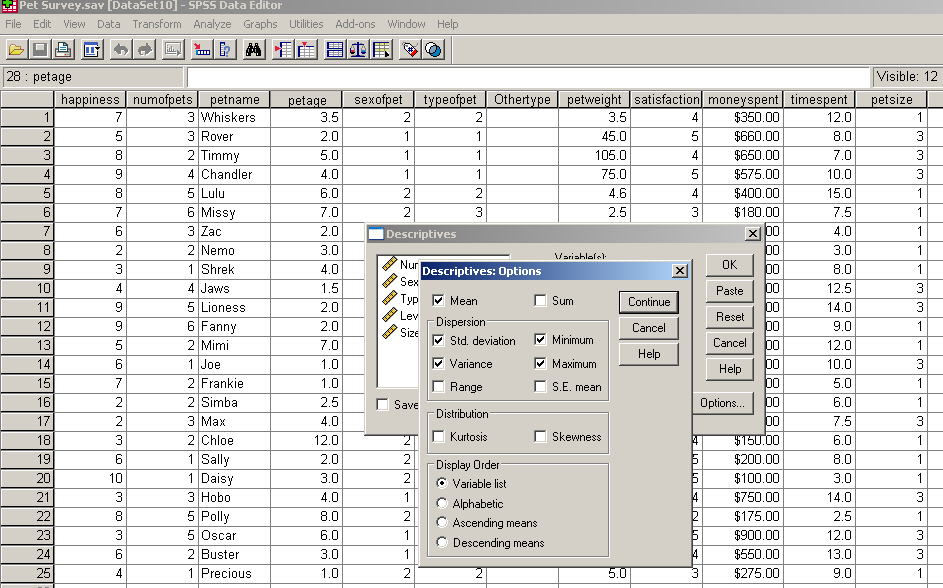
83 Numerical Variables Ensure that the options Mean, Std Deviation, Minimum and Maximum are selected If you are interested in the Skewness or Kurtosis of the distribution you can select those as well Select CONTINUE, then OK.
84
85
86 Sample Output Descriptive Statistics Average level of happiness on a scale of 1 to 10 Age of pet Weight of pet Amount of money spent on pet per year Amount of time spent w ith pet each w eek Valid N (listw ise) N Minimum Maximum Mean Std. Deviation Variance $ $ $ $
87 Summary You should now be able to: Start up and enter SPSS Enter and Save Data in SPSS Import data from an Excel spreadsheet into SPSS Recode a variable Conduct simple descriptive statistics in SPSS
88 Thank You Any Questions??
89 If you have any additional questions or comments, please contact: Cynthia Wilson Garvan, PhD Statistics Director, Office of Educational Research College of Education,University of Florida
Using SPSS, Chapter 2: Descriptive Statistics
 1 Using SPSS, Chapter 2: Descriptive Statistics Chapters 2.1 & 2.2 Descriptive Statistics 2 Mean, Standard Deviation, Variance, Range, Minimum, Maximum 2 Mean, Median, Mode, Standard Deviation, Variance,
SPSS (Statistical Package for the Social Sciences)
") SPSS (Statistical Package for the Social Sciences) What is SPSS? SPSS stands for Statistical Package for the Social Sciences The SPSS home-page is: www.spss.com 2 What can you do with SPSS? Run Frequencies
SPSS (Statistical Package for the Social Sciences) What is SPSS? SPSS stands for Statistical Package for the Social Sciences The SPSS home-page is: www.spss.com 2 What can you do with SPSS? Run Frequencies
IBM SPSS Statistics 20 Part 1: Descriptive Statistics
 CALIFORNIA STATE UNIVERSITY, LOS ANGELES INFORMATION TECHNOLOGY SERVICES IBM SPSS Statistics 20 Part 1: Descriptive Statistics Summer 2013, Version 2.0 Table of Contents Introduction...2 Downloading the
How To Use Spss
 1: Introduction to SPSS Objectives Learn about SPSS Open SPSS Review the layout of SPSS Become familiar with Menus and Icons Exit SPSS What is SPSS? SPSS is a Windows based program that can be used to
Introduction to SPSS 16.0
 Introduction to SPSS 16.0 Edited by Emily Blumenthal Center for Social Science Computation and Research 110 Savery Hall University of Washington Seattle, WA 98195 USA (206) 543-8110 November 2010 http://julius.csscr.washington.edu/pdf/spss.pdf
IBM SPSS Statistics for Beginners for Windows
 ISS, NEWCASTLE UNIVERSITY IBM SPSS Statistics for Beginners for Windows A Training Manual for Beginners Dr. S. T. Kometa A Training Manual for Beginners Contents 1 Aims and Objectives... 3 1.1 Learning
4. Descriptive Statistics: Measures of Variability and Central Tendency
 4. Descriptive Statistics: Measures of Variability and Central Tendency Objectives Calculate descriptive for continuous and categorical data Edit output tables Although measures of central tendency and
Introduction Course in SPSS - Evening 1
 ETH Zürich Seminar für Statistik Introduction Course in SPSS - Evening 1 Seminar für Statistik, ETH Zürich All data used during the course can be downloaded from the following ftp server: ftp://stat.ethz.ch/u/sfs/spsskurs/
GETTING YOUR DATA INTO SPSS
 GETTING YOUR DATA INTO SPSS UNIVERSITY OF GUELPH LUCIA COSTANZO [email protected] REVISED SEPTEMBER 2011 CONTENTS Getting your Data into SPSS... 0 SPSS availability... 3 Data for SPSS Sessions... 4
January 26, 2009 The Faculty Center for Teaching and Learning
 THE BASICS OF DATA MANAGEMENT AND ANALYSIS A USER GUIDE January 26, 2009 The Faculty Center for Teaching and Learning THE BASICS OF DATA MANAGEMENT AND ANALYSIS Table of Contents Table of Contents... i
Data exploration with Microsoft Excel: univariate analysis
 Data exploration with Microsoft Excel: univariate analysis Contents 1 Introduction... 1 2 Exploring a variable s frequency distribution... 2 3 Calculating measures of central tendency... 16 4 Calculating
Getting Started With SPSS
 Getting Started With SPSS To investigate the research questions posed in each section of this site, we ll be using SPSS, an IBM computer software package specifically designed for use in the social sciences.
Introduction to PASW Statistics 34152-001
 Introduction to PASW Statistics 34152-001 V18 02/2010 nm/jdr/mr For more information about SPSS Inc., an IBM Company software products, please visit our Web site at http://www.spss.com or contact: SPSS
SPSS Manual for Introductory Applied Statistics: A Variable Approach
 SPSS Manual for Introductory Applied Statistics: A Variable Approach John Gabrosek Department of Statistics Grand Valley State University Allendale, MI USA August 2013 2 Copyright 2013 John Gabrosek. All
How to Use a Data Spreadsheet: Excel
 How to Use a Data Spreadsheet: Excel One does not necessarily have special statistical software to perform statistical analyses. Microsoft Office Excel can be used to run statistical procedures. Although
Data exploration with Microsoft Excel: analysing more than one variable
 Data exploration with Microsoft Excel: analysing more than one variable Contents 1 Introduction... 1 2 Comparing different groups or different variables... 2 3 Exploring the association between categorical
SPSS: Getting Started. For Windows
 For Windows Updated: August 2012 Table of Contents Section 1: Overview... 3 1.1 Introduction to SPSS Tutorials... 3 1.2 Introduction to SPSS... 3 1.3 Overview of SPSS for Windows... 3 Section 2: Entering
SPSS 12 Data Analysis Basics Linda E. Lucek, Ed.D. [email protected] 815-753-9516
 SPSS 12 Data Analysis Basics Linda E. Lucek, Ed.D. [email protected] 815-753-9516 Technical Advisory Group Customer Support Services Northern Illinois University 120 Swen Parson Hall DeKalb, IL 60115 SPSS
SECTION 2-1: OVERVIEW SECTION 2-2: FREQUENCY DISTRIBUTIONS
 SECTION 2-1: OVERVIEW Chapter 2 Describing, Exploring and Comparing Data 19 In this chapter, we will use the capabilities of Excel to help us look more carefully at sets of data. We can do this by re-organizing
Task Force on Technology / EXCEL
 Task Force on Technology EXCEL Basic terminology Spreadsheet A spreadsheet is an electronic document that stores various types of data. There are vertical columns and horizontal rows. A cell is where the
SPSS Introduction. Yi Li
 SPSS Introduction Yi Li Note: The report is based on the websites below http://glimo.vub.ac.be/downloads/eng_spss_basic.pdf http://academic.udayton.edu/gregelvers/psy216/spss http://www.nursing.ucdenver.edu/pdf/factoranalysishowto.pdf
Excel Charts & Graphs
 MAX 201 Spring 2008 Assignment #6: Charts & Graphs; Modifying Data Due at the beginning of class on March 18 th Introduction This assignment introduces the charting and graphing capabilities of SPSS and
Advanced Presentation Features and Animation
 There are three features that you should remember as you work within PowerPoint 2007: the Microsoft Office Button, the Quick Access Toolbar, and the Ribbon. The function of these features will be more
Excel 2007/2010 for Researchers. Jamie DeCoster Institute for Social Science Research University of Alabama. September 7, 2010
 Excel 2007/2010 for Researchers Jamie DeCoster Institute for Social Science Research University of Alabama September 7, 2010 I d like to thank Joe Chandler for comments made on an earlier version of these
SPSS for Simple Analysis
 STC: SPSS for Simple Analysis1 SPSS for Simple Analysis STC: SPSS for Simple Analysis2 Background Information IBM SPSS Statistics is a software package used for statistical analysis, data management, and
Introduction to IBM SPSS Statistics
 CONTENTS Arizona State University College of Health Solutions College of Nursing and Health Innovation Introduction to IBM SPSS Statistics Edward A. Greenberg, PhD Director, Data Lab PAGE About This Document
S P S S Statistical Package for the Social Sciences
 S P S S Statistical Package for the Social Sciences Data Entry Data Management Basic Descriptive Statistics Jamie Lynn Marincic Leanne Hicks Survey, Statistics, and Psychometrics Core Facility (SSP) July
SAS Analyst for Windows Tutorial
 Updated: August 2012 Table of Contents Section 1: Introduction... 3 1.1 About this Document... 3 1.2 Introduction to Version 8 of SAS... 3 Section 2: An Overview of SAS V.8 for Windows... 3 2.1 Navigating
Using Excel for descriptive statistics
 FACT SHEET Using Excel for descriptive statistics Introduction Biologists no longer routinely plot graphs by hand or rely on calculators to carry out difficult and tedious statistical calculations. These
Excel Reports and Macros
 Excel Reports and Macros Within Microsoft Excel it is possible to create a macro. This is a set of commands that Excel follows to automatically make certain changes to data in a spreadsheet. By adding
SPSS The Basics. Jennifer Thach RHS Assessment Office March 3 rd, 2014
 SPSS The Basics Jennifer Thach RHS Assessment Office March 3 rd, 2014 Why use SPSS? - Used heavily in the Social Science & Business world - Ability to perform basic to high-level statistical analysis (i.e.
There are six different windows that can be opened when using SPSS. The following will give a description of each of them.
 SPSS Basics Tutorial 1: SPSS Windows There are six different windows that can be opened when using SPSS. The following will give a description of each of them. The Data Editor The Data Editor is a spreadsheet
Licensed to: CengageBrain User
 This is an electronic version of the print textbook. Due to electronic rights restrictions, some third party content may be suppressed. Editorial review has deemed that any suppressed content does not
Advanced Microsoft Excel 2010
 Advanced Microsoft Excel 2010 Table of Contents THE PASTE SPECIAL FUNCTION... 2 Paste Special Options... 2 Using the Paste Special Function... 3 ORGANIZING DATA... 4 Multiple-Level Sorting... 4 Subtotaling
Intro to Excel spreadsheets
 Intro to Excel spreadsheets What are the objectives of this document? The objectives of document are: 1. Familiarize you with what a spreadsheet is, how it works, and what its capabilities are; 2. Using
Charting LibQUAL+(TM) Data. Jeff Stark Training & Development Services Texas A&M University Libraries Texas A&M University
 Data. Jeff Stark Training & Development Services Texas A&M University Libraries Texas A&M University") Charting LibQUAL+(TM) Data Jeff Stark Training & Development Services Texas A&M University Libraries Texas A&M University Revised March 2004 The directions in this handout are written to be used with SPSS
Charting LibQUAL+(TM) Data Jeff Stark Training & Development Services Texas A&M University Libraries Texas A&M University Revised March 2004 The directions in this handout are written to be used with SPSS
Instructions for SPSS 21
 1 Instructions for SPSS 21 1 Introduction... 2 1.1 Opening the SPSS program... 2 1.2 General... 2 2 Data inputting and processing... 2 2.1 Manual input and data processing... 2 2.2 Saving data... 3 2.3
Using Microsoft Excel to Manage and Analyze Data: Some Tips
 Using Microsoft Excel to Manage and Analyze Data: Some Tips Larger, complex data management may require specialized and/or customized database software, and larger or more complex analyses may require
Drawing a histogram using Excel
 Drawing a histogram using Excel STEP 1: Examine the data to decide how many class intervals you need and what the class boundaries should be. (In an assignment you may be told what class boundaries to
Sample Table. Columns. Column 1 Column 2 Column 3 Row 1 Cell 1 Cell 2 Cell 3 Row 2 Cell 4 Cell 5 Cell 6 Row 3 Cell 7 Cell 8 Cell 9.
 Working with Tables in Microsoft Word The purpose of this document is to lead you through the steps of creating, editing and deleting tables and parts of tables. This document follows a tutorial format
Basic Microsoft Excel 2007
 Basic Microsoft Excel 2007 The biggest difference between Excel 2007 and its predecessors is the new layout. All of the old functions are still there (with some new additions), but they are now located
Statgraphics Getting started
 Statgraphics Getting started The aim of this exercise is to introduce you to some of the basic features of the Statgraphics software. Starting Statgraphics 1. Log in to your PC, using the usual procedure
SPSS Workbook 1 Data Entry : Questionnaire Data
 TEESSIDE UNIVERSITY SCHOOL OF HEALTH & SOCIAL CARE SPSS Workbook 1 Data Entry : Questionnaire Data Prepared by: Sylvia Storey [email protected] SPSS data entry 1 This workbook is designed to introduce
STC: Descriptive Statistics in Excel 2013. Running Descriptive and Correlational Analysis in Excel 2013
 Running Descriptive and Correlational Analysis in Excel 2013 Tips for coding a survey Use short phrases for your data table headers to keep your worksheet neat, you can always edit the labels in tables
Getting Started with Excel 2008. Table of Contents
 Table of Contents Elements of An Excel Document... 2 Resizing and Hiding Columns and Rows... 3 Using Panes to Create Spreadsheet Headers... 3 Using the AutoFill Command... 4 Using AutoFill for Sequences...
WHO STEPS Surveillance Support Materials. STEPS Epi Info Training Guide
 STEPS Epi Info Training Guide Department of Chronic Diseases and Health Promotion World Health Organization 20 Avenue Appia, 1211 Geneva 27, Switzerland For further information: www.who.int/chp/steps WHO
Custom Reporting System User Guide
 Citibank Custom Reporting System User Guide April 2012 Version 8.1.1 Transaction Services Citibank Custom Reporting System User Guide Table of Contents Table of Contents User Guide Overview...2 Subscribe
MS Excel. Handout: Level 2. elearning Department. Copyright 2016 CMS e-learning Department. All Rights Reserved. Page 1 of 11
 MS Excel Handout: Level 2 elearning Department 2016 Page 1 of 11 Contents Excel Environment:... 3 To create a new blank workbook:...3 To insert text:...4 Cell addresses:...4 To save the workbook:... 5
This book serves as a guide for those interested in using IBM SPSS
 1 Overview This book serves as a guide for those interested in using IBM SPSS Statistics software to assist in statistical data analysis whether as a companion to a statistics or research methods course,
Data Analysis. Using Excel. Jeffrey L. Rummel. BBA Seminar. Data in Excel. Excel Calculations of Descriptive Statistics. Single Variable Graphs
 Using Excel Jeffrey L. Rummel Emory University Goizueta Business School BBA Seminar Jeffrey L. Rummel BBA Seminar 1 / 54 Excel Calculations of Descriptive Statistics Single Variable Graphs Relationships
Access Tutorial 3 Maintaining and Querying a Database. Microsoft Office 2013 Enhanced
 Access Tutorial 3 Maintaining and Querying a Database Microsoft Office 2013 Enhanced Objectives Session 3.1 Find, modify, and delete records in a table Hide and unhide fields in a datasheet Work in the
Tutorial 3 Maintaining and Querying a Database
 Tutorial 3 Maintaining and Querying a Database Microsoft Access 2013 Objectives Session 3.1 Find, modify, and delete records in a table Hide and unhide fields in a datasheet Work in the Query window in
Introduction to SPSS (version 16) for Windows
 for Windows") Introduction to SPSS (version 16) for Windows Practical workbook Aims and Learning Objectives By the end of this course you will be able to: get data ready for SPSS create and run SPSS programs to do simple
Introduction to SPSS (version 16) for Windows Practical workbook Aims and Learning Objectives By the end of this course you will be able to: get data ready for SPSS create and run SPSS programs to do simple
4 Other useful features on the course web page. 5 Accessing SAS
 1 Using SAS outside of ITCs Statistical Methods and Computing, 22S:30/105 Instructor: Cowles Lab 1 Jan 31, 2014 You can access SAS from off campus by using the ITC Virtual Desktop Go to https://virtualdesktopuiowaedu
Survey Research Data Analysis
 Survey Research Data Analysis Overview Once survey data are collected from respondents, the next step is to input the data on the computer, do appropriate statistical analyses, interpret the data, and
Data Analysis Tools. Tools for Summarizing Data
 Data Analysis Tools This section of the notes is meant to introduce you to many of the tools that are provided by Excel under the Tools/Data Analysis menu item. If your computer does not have that tool
INTRODUCTORY LAB: DOING STATISTICS WITH SPSS 21
 INTRODUCTORY LAB: DOING STATISTICS WITH SPSS 21 This section covers the basic structure and commands of SPSS for Windows Release 21. It is not designed to be a comprehensive review of the most important
3 What s New in Excel 2007
 3 What s New in Excel 2007 3.1 Overview of Excel 2007 Microsoft Office Excel 2007 is a spreadsheet program that enables you to enter, manipulate, calculate, and chart data. An Excel file is referred to
Excel Unit 4. Data files needed to complete these exercises will be found on the S: drive>410>student>computer Technology>Excel>Unit 4
 Excel Unit 4 Data files needed to complete these exercises will be found on the S: drive>410>student>computer Technology>Excel>Unit 4 Step by Step 4.1 Creating and Positioning Charts GET READY. Before
IBM SPSS Statistics 20 Part 4: Chi-Square and ANOVA
 CALIFORNIA STATE UNIVERSITY, LOS ANGELES INFORMATION TECHNOLOGY SERVICES IBM SPSS Statistics 20 Part 4: Chi-Square and ANOVA Summer 2013, Version 2.0 Table of Contents Introduction...2 Downloading the
Tutorial #7A: LC Segmentation with Ratings-based Conjoint Data
 Tutorial #7A: LC Segmentation with Ratings-based Conjoint Data This tutorial shows how to use the Latent GOLD Choice program when the scale type of the dependent variable corresponds to a Rating as opposed
An introduction to IBM SPSS Statistics
 An introduction to IBM SPSS Statistics Contents 1 Introduction... 1 2 Entering your data... 2 3 Preparing your data for analysis... 10 4 Exploring your data: univariate analysis... 14 5 Generating descriptive
Microsoft Excel Basics
 COMMUNITY TECHNICAL SUPPORT Microsoft Excel Basics Introduction to Excel Click on the program icon in Launcher or the Microsoft Office Shortcut Bar. A worksheet is a grid, made up of columns, which are
Enterprise Reporting Advanced Web Intelligence Training. Enterprise Reporting Services
 Enterprise Reporting Advanced Web Intelligence Training Enterprise Reporting Services Table of Contents Chapter Page 1 Overview 4 2 Web Intelligence Access 8 3 BI Launch Pad Navigation 12 4 Nested Query
Business Objects Version 5 : Introduction
 Business Objects Version 5 : Introduction Page 1 TABLE OF CONTENTS Introduction About Business Objects Changing Your Password Retrieving Pre-Defined Reports Formatting Your Report Using the Slice and Dice
When to use Excel. When NOT to use Excel 9/24/2014
 Analyzing Quantitative Assessment Data with Excel October 2, 2014 Jeremy Penn, Ph.D. Director When to use Excel You want to quickly summarize or analyze your assessment data You want to create basic visual
MICROSOFT OUTLOOK 2011 READ, SEARCH AND PRINT E-MAILS
 MICROSOFT OUTLOOK 2011 READ, SEARCH AND PRINT E-MAILS Lasted Edited: 2012-07-10 1 Find the Inbox... 3 Check for New Mail... 4 Manually check for new messages... 4 Change new incoming e-mail schedule options...
Appendix III: SPSS Preliminary
 Appendix III: SPSS Preliminary SPSS is a statistical software package that provides a number of tools needed for the analytical process planning, data collection, data access and management, analysis,
IBM SPSS Direct Marketing 23
 IBM SPSS Direct Marketing 23 Note Before using this information and the product it supports, read the information in Notices on page 25. Product Information This edition applies to version 23, release
INTRODUCTION TO SPSS FOR WINDOWS Version 19.0
 INTRODUCTION TO SPSS FOR WINDOWS Version 19.0 Winter 2012 Contents Purpose of handout & Compatibility between different versions of SPSS.. 1 SPSS window & menus 1 Getting data into SPSS & Editing data..
MICROSOFT OUTLOOK 2010 WORK WITH CONTACTS
 MICROSOFT OUTLOOK 2010 WORK WITH CONTACTS Last Edited: 2012-07-09 1 Access to Outlook contacts area... 4 Manage Outlook contacts view... 5 Change the view of Contacts area... 5 Business Cards view... 6
Basic Excel Handbook
 2 5 2 7 1 1 0 4 3 9 8 1 Basic Excel Handbook Version 3.6 May 6, 2008 Contents Contents... 1 Part I: Background Information...3 About This Handbook... 4 Excel Terminology... 5 Excel Terminology (cont.)...
Basic Pivot Tables. To begin your pivot table, choose Data, Pivot Table and Pivot Chart Report. 1 of 18
 Basic Pivot Tables Pivot tables summarize data in a quick and easy way. In your job, you could use pivot tables to summarize actual expenses by fund type by object or total amounts. Make sure you do not
Statistical Analysis Using SPSS for Windows Getting Started (Ver. 2014/11/6) The numbers of figures in the SPSS_screenshot.pptx are shown in red.
 The numbers of figures in the SPSS_screenshot.pptx are shown in red.") Statistical Analysis Using SPSS for Windows Getting Started (Ver. 2014/11/6) The numbers of figures in the SPSS_screenshot.pptx are shown in red. 1. How to display English messages from IBM SPSS Statistics
Statistical Analysis Using SPSS for Windows Getting Started (Ver. 2014/11/6) The numbers of figures in the SPSS_screenshot.pptx are shown in red. 1. How to display English messages from IBM SPSS Statistics
Using an Access Database
 A Few Terms Using an Access Database These words are used often in Access so you will want to become familiar with them before using the program and this tutorial. A database is a collection of related
IBM SPSS Direct Marketing 22
 IBM SPSS Direct Marketing 22 Note Before using this information and the product it supports, read the information in Notices on page 25. Product Information This edition applies to version 22, release
Psych. Research 1 Guide to SPSS 11.0
 SPSS GUIDE 1 Psych. Research 1 Guide to SPSS 11.0 I. What is SPSS: SPSS (Statistical Package for the Social Sciences) is a data management and analysis program. It allows us to store and analyze very large
What is a Mail Merge?
 NDUS Training and Documentation What is a Mail Merge? A mail merge is generally used to personalize form letters, to produce mailing labels and for mass mailings. A mail merge can be very helpful if you
Step 3: Go to Column C. Use the function AVERAGE to calculate the mean values of n = 5. Column C is the column of the means.
 EXAMPLES - SAMPLING DISTRIBUTION EXCEL INSTRUCTIONS This exercise illustrates the process of the sampling distribution as stated in the Central Limit Theorem. Enter the actual data in Column A in MICROSOFT
Table of Contents. Preface
 Table of Contents Preface Chapter 1: Introduction 1-1 Opening an SPSS Data File... 2 1-2 Viewing the SPSS Screens... 3 o Data View o Variable View o Output View 1-3 Reading Non-SPSS Files... 6 o Convert
Adobe Dreamweaver CC 14 Tutorial
 Adobe Dreamweaver CC 14 Tutorial GETTING STARTED This tutorial focuses on the basic steps involved in creating an attractive, functional website. In using this tutorial you will learn to design a site
Using Excel for Analyzing Survey Questionnaires Jennifer Leahy
 University of Wisconsin-Extension Cooperative Extension Madison, Wisconsin PD &E Program Development & Evaluation Using Excel for Analyzing Survey Questionnaires Jennifer Leahy G3658-14 Introduction You
GeoGebra Statistics and Probability
 GeoGebra Statistics and Probability Project Maths Development Team 2013 www.projectmaths.ie Page 1 of 24 Index Activity Topic Page 1 Introduction GeoGebra Statistics 3 2 To calculate the Sum, Mean, Count,
CREATING EXCEL PIVOT TABLES AND PIVOT CHARTS FOR LIBRARY QUESTIONNAIRE RESULTS
 CREATING EXCEL PIVOT TABLES AND PIVOT CHARTS FOR LIBRARY QUESTIONNAIRE RESULTS An Excel Pivot Table is an interactive table that summarizes large amounts of data. It allows the user to view and manipulate
MICROSOFT WORD TUTORIAL
 MICROSOFT WORD TUTORIAL G E T T I N G S T A R T E D Microsoft Word is one of the most popular word processing programs supported by both Mac and PC platforms. Microsoft Word can be used to create documents,
EXCEL PIVOT TABLE David Geffen School of Medicine, UCLA Dean s Office Oct 2002
 EXCEL PIVOT TABLE David Geffen School of Medicine, UCLA Dean s Office Oct 2002 Table of Contents Part I Creating a Pivot Table Excel Database......3 What is a Pivot Table...... 3 Creating Pivot Tables
Importing and Exporting With SPSS for Windows 17 TUT 117
 Information Systems Services Importing and Exporting With TUT 117 Version 2.0 (Nov 2009) Contents 1. Introduction... 3 1.1 Aim of this Document... 3 2. Importing Data from Other Sources... 3 2.1 Reading
MICROSOFT ACCESS 2007 BOOK 2
 MICROSOFT ACCESS 2007 BOOK 2 4.1 INTRODUCTION TO ACCESS FIRST ENCOUNTER WITH ACCESS 2007 P 205 Access is activated by means of Start, Programs, Microsoft Access or clicking on the icon. The window opened
STATGRAPHICS Online. Statistical Analysis and Data Visualization System. Revised 6/21/2012. Copyright 2012 by StatPoint Technologies, Inc.
 STATGRAPHICS Online Statistical Analysis and Data Visualization System Revised 6/21/2012 Copyright 2012 by StatPoint Technologies, Inc. All rights reserved. Table of Contents Introduction... 1 Chapter
Excel 2003 A Beginners Guide
 Excel 2003 A Beginners Guide Beginner Introduction The aim of this document is to introduce some basic techniques for using Excel to enter data, perform calculations and produce simple charts based on
Microsoft Access 2007 Introduction
 Microsoft Access 2007 Introduction Access is the database management system in Microsoft Office. A database is an organized collection of facts about a particular subject. Examples of databases are an
Advanced Excel 10/20/2011 1
 Advanced Excel Data Validation Excel has a feature called Data Validation, which will allow you to control what kind of information is typed into cells. 1. Select the cell(s) you wish to control. 2. Click
STEP TWO: Highlight the data set, then select DATA PIVOT TABLE
 STEP ONE: Enter the data into a database format, with the first row being the variable names, and each row thereafter being one completed survey. For this tutorial, highlight this table, copy and paste
Excel 2007 A Beginners Guide
 Excel 2007 A Beginners Guide Beginner Introduction The aim of this document is to introduce some basic techniques for using Excel to enter data, perform calculations and produce simple charts based on
Directions for Frequency Tables, Histograms, and Frequency Bar Charts
 Directions for Frequency Tables, Histograms, and Frequency Bar Charts Frequency Distribution Quantitative Ungrouped Data Dataset: Frequency_Distributions_Graphs-Quantitative.sav 1. Open the dataset containing
Microsoft Access 2007
 How to Use: Microsoft Access 2007 Microsoft Office Access is a powerful tool used to create and format databases. Databases allow information to be organized in rows and tables, where queries can be formed
SPSS INSTRUCTION CHAPTER 1
 SPSS INSTRUCTION CHAPTER 1 Performing the data manipulations described in Section 1.4 of the chapter require minimal computations, easily handled with a pencil, sheet of paper, and a calculator. However,
General instructions for the content of all StatTools assignments and the use of StatTools:
 General instructions for the content of all StatTools assignments and the use of StatTools: An important part of Business Management 330 is learning how to conduct statistical analyses and to write text