Market Technician, TradeStation Labs
|
|
|
- Brent Harper
- 10 years ago
- Views:
Transcription


1 Market Technician, TradeStation Labs Standard deviation is a common statistical calculation that is often used in the world of finance to measure risk. The higher the standard deviation, the higher the overall risk or volatility. However, standard deviation can also be used as a basis for mean-reversion trading strategies. In this Analysis Concepts paper, we will introduce a strategy and indicator that use standard deviation to calculate a z-score. A z-score is simply the number of standard deviations separating the current price from the mean price. The strategy then looks at the momentum of the average z-score and takes a contrarian approach to trading to generate buy and sell signals. If the z-score is positive, it means that the current price of the security is above its mean. Correspondingly, if the z-score is negative, the current price of the security is below its mean. In essence, plotting the z-score will generate a line that looks similar to the price data. See Figure 1 below for an example. Notice how closely peaks and troughs in the average z-score match peaks and troughs in the price data.


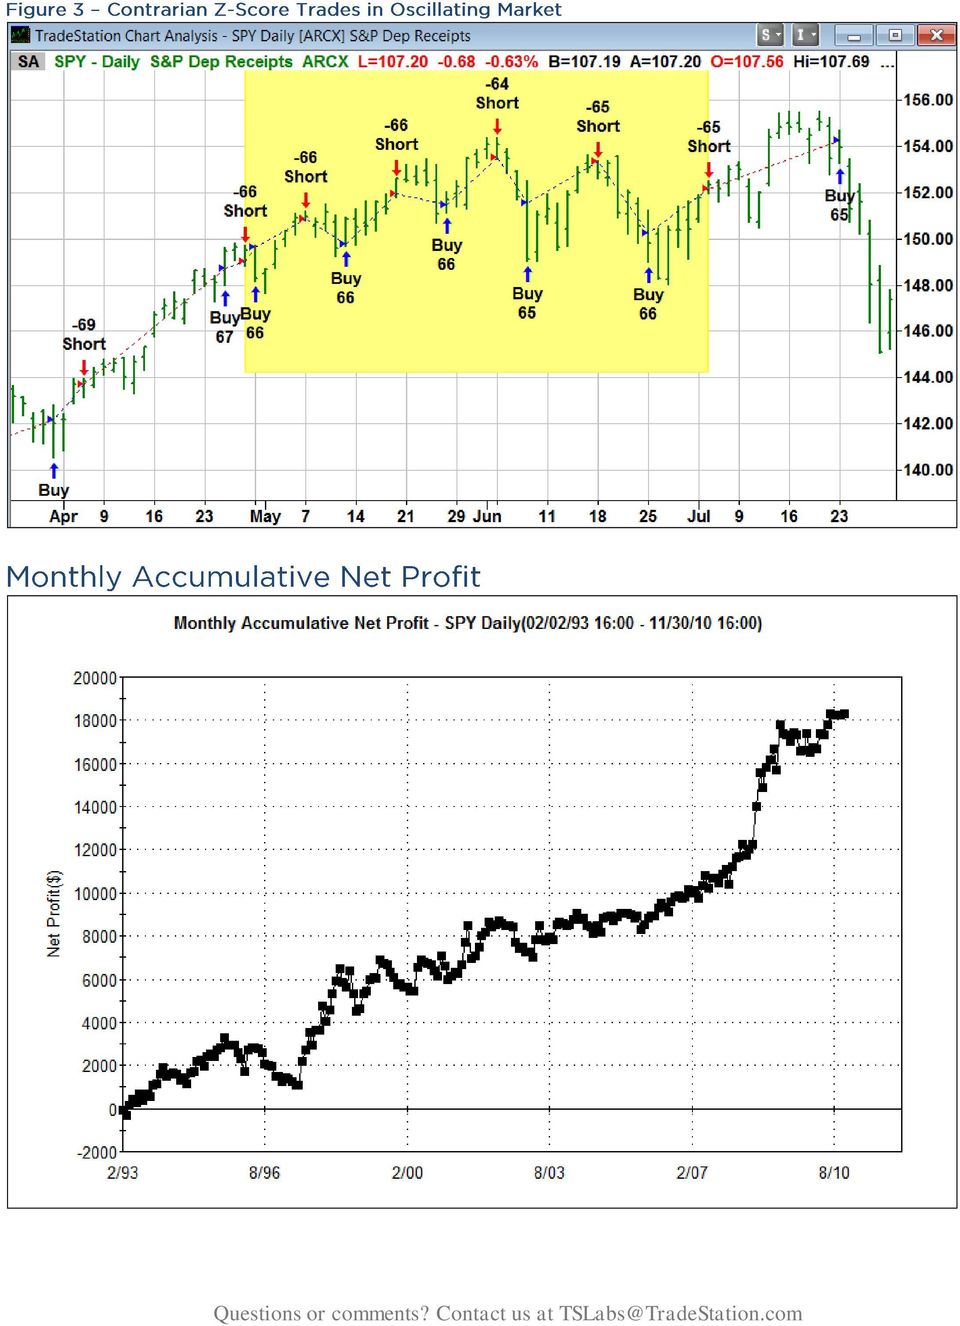
2 The next part of the strategy applies the momentum indicator to the average z-score. Taking a contrarian perspective, if the average z-score momentum is positive, the strategy sells short. If the average z-score momentum is negative, the strategy will go long. As might be expected with a contrarian strategy, the strategy generates more winning trades than losing trades, though the average losing trade is larger than the average winning trade. The strategy is likely to perform better in oscillating (trading range) markets than in trending markets. The indicator will plot both the average z-score and the average z-score momentum. The momentum is plotted as a histogram. Notice in Figure 2 below that when the momentum is positive, the histogram is red. When momentum is negative, the histogram is green. Figure 2 also displays strategy sample trades. When the average z-score momentum changes from negative to positive, the strategy will sell short, whereas when it changes from positive to negative, the strategy will buy. The strategy and indicator are meant to be used on a daily interval. As demonstrated here, the strategy is applied to various major market ETFs, particularly the S&P Depository Receipts (SPY). Strategy Style Asset Type Traded Symbol Data Interval Period Tested Short Term Stocks SPY - S&P Depository Receipts Daily 18 years
 markets than in trending markets. The indicator will plot both the average z-score and the average z-score momentum.")
3 Buy or buy to cover when the momentum of the average z-score is negative. Sell short or sell when the momentum of the average z-score is positive. Name Default Description Length 10 MomLen 5 Length used to calculate standard deviation, average price, and average z-score. Length used to calculate momentum of the average z- score. There are two inputs in both the strategy and the indicator; both are lengths used to calculate all of the variables. The first input, Length, is used to calculate the majority of the variables, including the standard deviation of the closing price, the exponential average of the closing price, and the exponential average of the z-score. The second input, MomLen, is the length used to calculate the momentum of the average z-score. In this case, the default lengths used are 10 and 5. Sensitivity analysis was conducted on both inputs to make sure that the inputs chosen were not corresponding to a peak profit. The z-score is one of the basic tenets of a normal distribution and is often used in conducting statistical analysis. The further from zero the z-score, the further the current price is from its mean. Using a contrarian or mean-reversion strategy, you would take a position opposite the current z-score. If the z-score is positive (the current price of the security is above its mean), the strategy will take a short position. If the z-score is negative (the current price of the security is below its mean), the strategy will take a long position. As an additional filter, strategy signals are generated based on the momentum of the average z-score, not on the average z-score itself. A key to generating extremely efficient trades is the inflection points or turning points of the average z-score. Using the five-day momentum helps identify short-term turning points in the security s price movement. Because this is a mean-reversion strategy, it performs better in oscillating markets than in trending markets. See Figure 3 below for a highlighted example of accurate and efficient trades during an oscillating market. While the strategy is designed to generate both long and short entries, it may be used as a long-only strategy.

4

5 In this paper, we present the results of the strategy as applied to the S&P Depository Receipts. However, this strategy can be applied to various major markets ETFs as presented in the Portfolio Spotlight section.


6
7
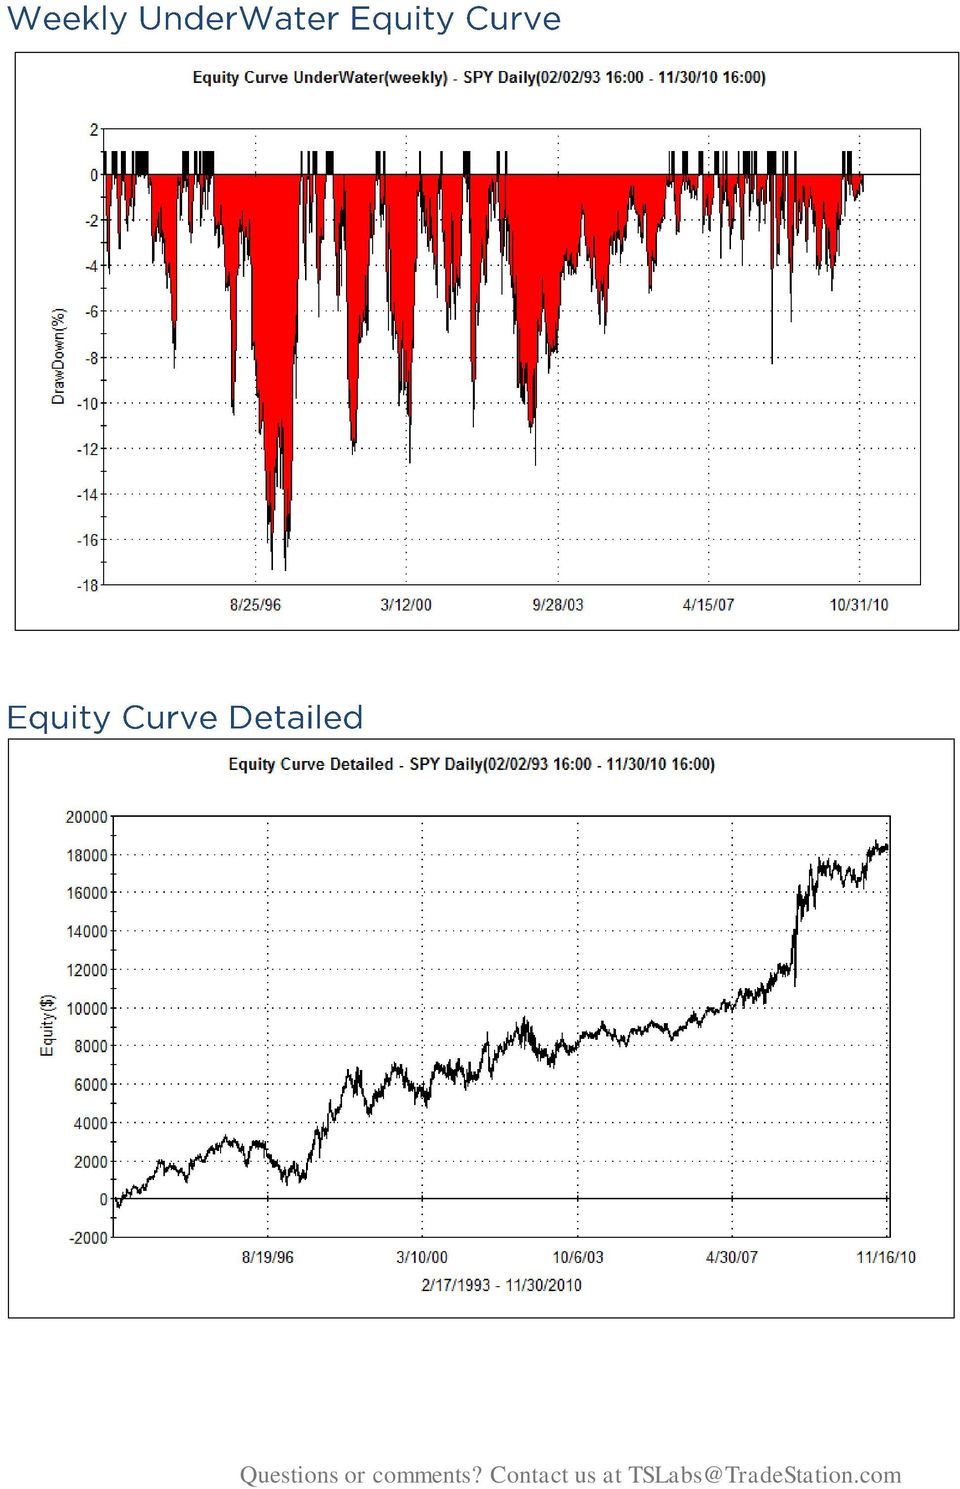
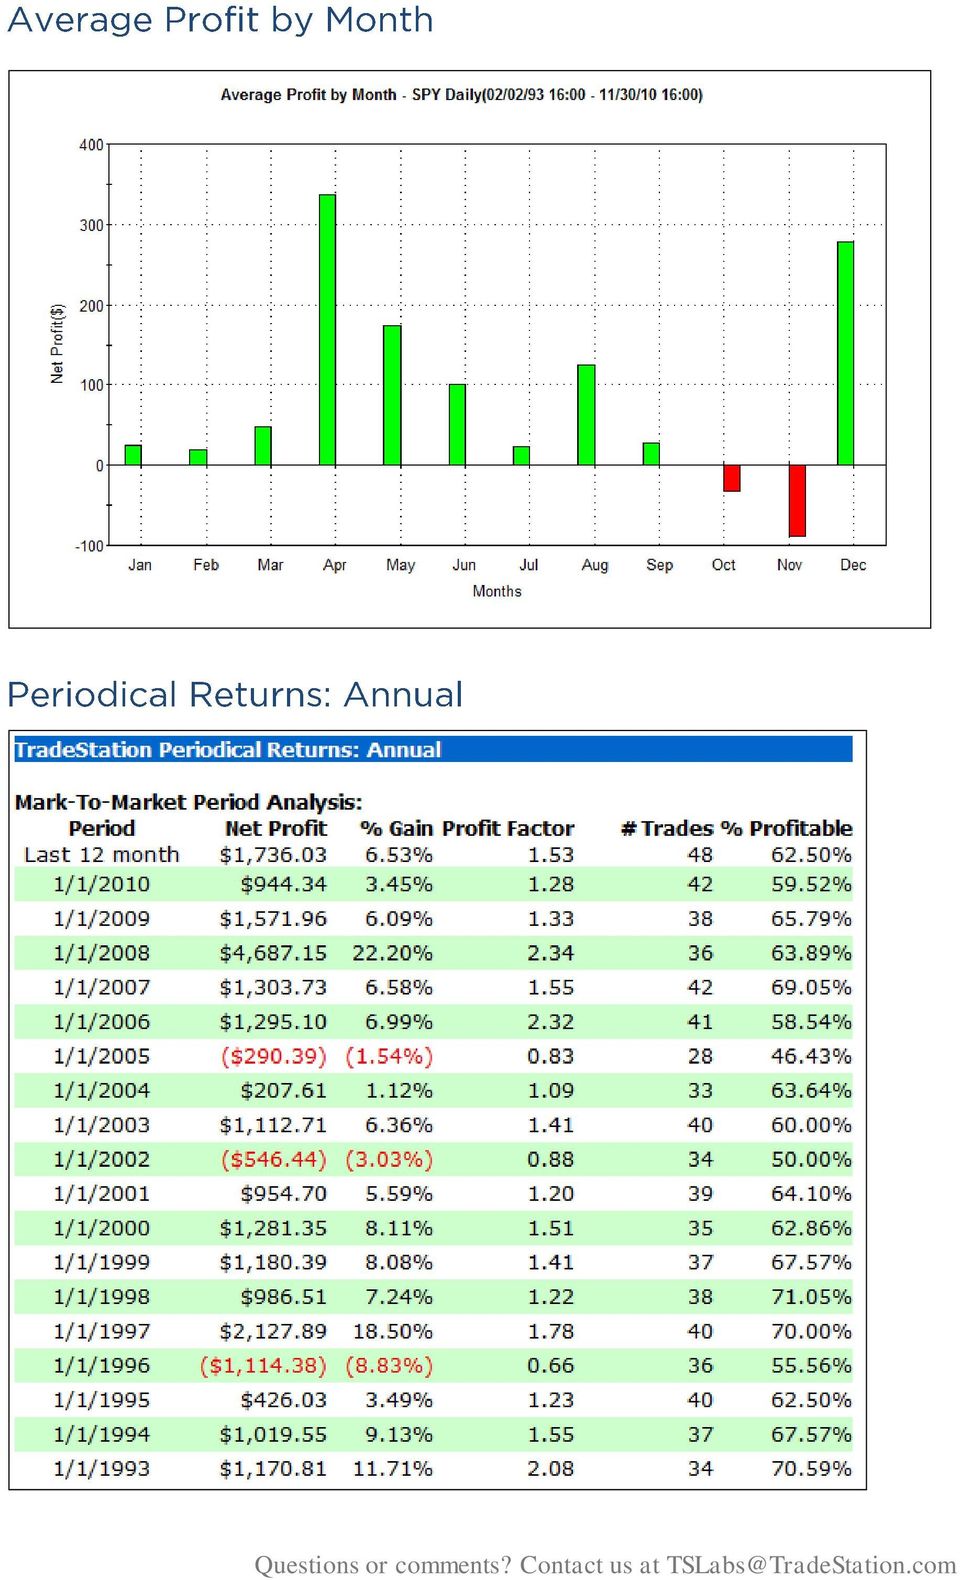
8 Symbol Description K-Ratio RINA Index Buy and Hold Return Return on Account XLF S&P Sel Financial Spdr Fund % % XLE S&P Sel Energy Spdr Fund % % MDY S&P Midcap Dep Receipts % % KBE SPDR Series KBW Bank % % IWB ishares Russell 1000 Index Tru % % IWP ishares Russell Midcap Growth % % Return on Initial Capital % Buy-and-Hold Return % Return on Account % Annual Rate of Return 5.89% Profit Factor 1.36 Avg Monthly Return $ Std. Deviation of Monthly Return $ Net Profit / Maximum Drawdown 6.27 Weekly Underwater Equity % Buy-and-Hold Weekly Underwater Equity % K-Ratio 3.03 RINA Index The return on account of % over the approximately 18 years that the strategy was backtested far exceeded the buy-and-hold return of % (buying at the beginning of the testing period and holding the security). The K-ratio, which is a risk-adjusted performance measure, is The higher the K-ratio, the better the strategy in terms of risk-adjusted performance. The industry standard is The weekly underwater equity of the strategy, %, is much better than that experienced under the buy-and-hold strategy for the security, %. Average profit by month was positive 10 of the 12 months, with November being the worstperforming month. The detailed equity curve is fairly linear over the 18 years that the strategy was back-tested. The strategy was back-tested over the entire period during which the security was tradeable. Risk-adjusted performance is consistent across several ETFs, as presented in the Portfolio Spotlight table. The net profit divided by maximum drawdown ratio was 6.27, signifying low drawdown during the back-test.

9 Because the strategy is a mean-reversion strategy, it performs better in oscillating markets than in trending markets. The strategy has a smaller average winning trade, $168.27, than average losing trade ($214.21). The standard deviation of monthly return is 326% times the average monthly return, signifying higher risk in the strategy. The strategy has a high number of maximum consecutive losing trades (6). In this Analysis Concepts paper, we introduced a mean-reversion strategy that uses the concept of the z-score and momentum to generate buy and sell signals. The z-score can be used to identify periods when an asset s price has deviated from its average. As mentioned earlier, the strategy is likely to be most effective during oscillating rather than trending markets and has more of a short-term outlook. Strategy results are consistent across various major market ETFs, which allows you to use the strategy across a wide range of securities. Considering that the strategy s losing trades tend to be larger than its winning trades, the addition of money-management rules may provide a higher profit factor, as the losing trades would be exited sooner. Overall, the strategy uses two simple concepts standard deviation and momentum to create a short-term mean-reversion strategy. The strategy is not likely to be very effective in a long-term bear or bull market when the trend is extremely strong. However, if the trader is able to identify periods of higher volatility and oscillating markets, the strategy may indeed lend itself to generating satisfactory risk-adjusted returns. An interesting variation to this strategy might include an additional filter, such as the ADX, to allow trades to be generated only when the security is not exhibiting a strong trend. To use the files provided with this issue of Analysis Concepts Reports: Files with extension.eld These contain EasyLanguage documents: analysis techniques and strategies. Double-clicking on this file will start the Easy Language Import Wizard. Follow the prompts to completion. The analysis techniques or strategies will automatically be placed in the correct locations for your use in TradeStation. This should be done before opening any workspaces provided. Files with extension.tsw These are TradeStation workspaces. These may be stored in any folder where you choose to save TradeStation workspaces. Files with extension.txt These are text versions of the EasyLanguage documents and are generally used only by advanced EasyLanguage users. Other supporting documents or files may also be attached to the report. All support, education and training services and materials on the TradeStation Securities website are for informational purposes and to help customers learn more about how to use the power of TradeStation software and services. No type of trading or investment advice is being made, given or in any manner provided by TradeStation Securities or its affiliates. This material may also discuss in detail how TradeStation is designed to help you develop, test and implement trading strategies. However, TradeStation Securities does not provide or suggest trading strategies. We offer you unique tools to help you design your own strategies and look at how they could have performed in the past. While we believe this is very valuable information, we caution you that simulated past performance of a trading strategy is no guarantee of its future performance or success. We also do not recommend or solicit the purchase or sale of any particular securities or derivative products. Any symbols referenced are used only for the purposes of the demonstration, as an example ---- not a

10 recommendation. Finally, this material may discuss automated electronic order placement and execution. Please note that even though TradeStation has been designed to automate your trading strategies and deliver timely order placement, routing and execution, these things, as well as access to the system itself, may at times be delayed or even fail due to market volatility, quote delays, system and software errors, Internet traffic, outages and other factors.

$TICK - Tock - Testing the NYSE TICK Index
 Issue 12 Tuesday November 16, 2010 $TICK - Tock - Testing the NYSE TICK Index By Erik Skyba, CMT Senior Market Technician, TradeStation Labs [email protected] Focus Technical Study Markets Equities
1 P a g e Questions or comments? Contact us at [email protected]
 The Fundamental Score Indicator is an analysis technique created to analyze stocks strictly based on certain financial ratios of the company. The score ranges between 0 and 100, with a higher score signifying
The Intraday Bias Indicator
 Wednesday, June 13, 2012 Issue 41 Wednesday, August 8, 2012 Intraday Time Analysis Erik Skyba, CMT Senior Quantitative Analyst [email protected] Features Studies/Files Included: Focus: Technical
Introducing the Fibonacci Retracement Channel Indicator
 Issue 45 Wednesday, December 12, 2012 Introducing the Fibonacci Retracement Channel Indicator Frederic Palmliden, CMT Senior Quantitative Analyst [email protected] Features Studies/Files Included:
Forex Pair Performance Strength Score
 Issue 50 Wednesday, September 11, 2013 Forex Pair Performance Strength Score Michael Burke Vice-president of Client Training and Education [email protected] Features Studies/Files Included: Focus:
The GridTrading EasyLanguage Application
 The GridTrading EasyLanguage Application By Peter Parandjuk Vice President and Chief Architect of Advanced Trading Technologies [email protected] Important Disclosures All support, education
Using Implied Volatility And Volume
 BASIC TECHNIQUES Forecasting Trends With Indexes Using Implied Volatility And Volume Construct a trend-following system that adjusts to current market conditions. T raditionally, technicians have relied
Turk s ES ZigZag Day Trading Strategy
 Turk s ES ZigZag Day Trading Strategy User Guide 11/15/2013 1 Turk's ES ZigZag Strategy User Manual Table of Contents Disclaimer 3 Strategy Overview.. 4 Strategy Detail.. 6 Data Symbol Setup 7 Strategy
Getting Started with Trading Strategies, Chart Analysis, and Indicators
 Getting Started with Trading Strategies, Chart Analysis, and Indicators 20090707-A TradeStation Securities Member NYSE, FINRA, NFA and SIPC Important Information and Disclaimer: TradeStation Securities,
Getting Started with TradeStation. SESSION 2 Trading Strategies, Chart Analysis, and Indicators 20110801-A. TradeStation
 tsbooks_strategy_trading:live on the web 7/21/2011 3:53 PM Page 1 Getting Started with TradeStation SESSION 2 Trading Strategies, Chart Analysis, and Indicators 20110801-A TradeStation IMPORTANT DISCLOSURES
Day Trading Stock Controller
 Day Trading Stock Controller Disclaimer: Trading stocks, including ETFs, involves substantial risk of loss and is not suitable for all people. You should carefully consider whether trading, especially
ValueCharts TradeStation
 ValueCharts TradeStation ValueCharts TradeStation indicator suite can be located in the TradeStation Strategy Network under MicroQuantSM products. Free trial subscription periods are available for all
Strategies for Trading Inverse Volatility
 Strategies for Trading Inverse Volatility In this paper, I present five different strategies you can use to trade inverse volatility. Why trade inverse volatility you ask? Because since 2011, trading inverse
Dynamic Trading Indicators New Techniques for Evolving Markets. Presented by David Stendahl
 Dynamic Trading Indicators New Techniques for Evolving Markets Presented by David Stendahl Disclaimer ALL HYPOTHETICAL PERFORMANCE RESULTS HAVE MANY INHERENT LIMITATIONS, SOME OF WHICH ARE DESCRIBED BELOW.
High Probability ETF Trading For All
 High Probability ETF Trading For All Version 2.6 Strategy Report Chris White, May 2012 Includes results to end of April 2012 Contents Disclaimer... 2 Summary... 3 The High Probability ETF Trading book
Using Order Book Data
 Q3 2007 Using Order Book Data Improve Automated Model Performance by Thom Hartle TradeFlow Charts and Studies - Patent Pending TM Reprinted from the July 2007 issue of Automated Trader Magazine www.automatedtrader.net
How To Test A Mean Reversion Trading System
 3 Naive System Before expending a lot of energy designing and testing mean reversion systems, we will examine a naive system to see whether SPY, and other highly liquid ETFs and equities exhibit mean reversion
How to Trade Options: Strategy Building Blocks
 How to Trade Options: Strategy Building Blocks MICHAEL BURKE Important Information and Disclosures This course is provided by TradeStation, a U.S.-based multi-asset brokerage company that seeks to serve
COOLTRADE PERFROMANCE TIPS By Regina Guinn. Here are some things that subscribers should be aware of when running an automated trading platform.
 COOLTRADE PERFROMANCE TIPS By Regina Guinn Here are some things that subscribers should be aware of when running an automated trading platform. Run Long and Short Strategies The markets go down, often
Implementing Point and Figure RS Signals
 Dorsey Wright Money Management 790 E. Colorado Blvd, Suite 808 Pasadena, CA 91101 626-535-0630 John Lewis, CMT August, 2014 Implementing Point and Figure RS Signals Relative Strength, also known as Momentum,
Using Historical Probabilities to Trade the Opening Gap
 Using Historical Probabilities to Trade the Opening Gap Scott Andrews Hosted by Hamzei Analytics November 10, 2010 Disclaimer This material is intended for educational purposes only and is believed to
ETFreplay.com. Figure 1: HOME PAGE. This shows top ETF performs and latest blog postings.
 product review ETFreplay.com ETFREPLAY.COM Product: Etf analysis with relative strength and moving average backtesting Requirements: Internet Explorer, Firefox, Chrome, Safari, Windows XP/Vista/7 or Apple
Stock Market Dashboard Back-Test October 29, 1998 March 29, 2010 Revised 2010 Leslie N. Masonson
 Stock Market Dashboard Back-Test October 29, 1998 March 29, 2010 Revised 2010 Leslie N. Masonson My objective in writing Buy DON T Hold was to provide investors with a better alternative than the buy-and-hold
Pattern Recognition and Prediction in Equity Market
 Pattern Recognition and Prediction in Equity Market Lang Lang, Kai Wang 1. Introduction In finance, technical analysis is a security analysis discipline used for forecasting the direction of prices through
Quick Guide To WinTick
 Quick Guide to WinTick Page 1 Quick Guide To WinTick AbleSys Corporation A. Trading WinTick Stock Hot Picks..2 1. Daily Hot Picks 2. Daily Pre-Break Out Stocks 3. Daily Break Out Stocks 4. Put Big Moving
Finanzdienstleistungen (Praxis) Algorithmic Trading
 Algorithmic Trading") Finanzdienstleistungen (Praxis) Algorithmic Trading Definition A computer program (Software) A process for placing trade orders like Buy, Sell It follows a defined sequence of instructions At a speed and
Finanzdienstleistungen (Praxis) Algorithmic Trading Definition A computer program (Software) A process for placing trade orders like Buy, Sell It follows a defined sequence of instructions At a speed and
Introduction to Forex Trading
 Introduction to Forex Trading The Leader in Rule-Based Trading 1 Important Information and Disclaimer: TradeStation Securities, Inc. seeks to serve institutional and active traders. Please be advised that
Daytrading Stock Pairs
 TRADING TECHNIQUES Using Volatility And Correlation Daytrading Stock Pairs Tired of trading Level II quotes and one-minute charts? Try a market-neutral strategy. by Mark Conway and Aaron Behle I t can
Algorithmic Trading Session 1 Introduction. Oliver Steinki, CFA, FRM
 Algorithmic Trading Session 1 Introduction Oliver Steinki, CFA, FRM Outline An Introduction to Algorithmic Trading Definition, Research Areas, Relevance and Applications General Trading Overview Goals
Introduction to Forex Trading
 Introduction to Forex Trading The Leader in Rule-Based Trading 1 Important Information and Disclaimer: TradeStation Securities, Inc. seeks to serve institutional and active traders. Please be advised that
Predictive Indicators for Effective Trading Strategies By John Ehlers
 Predictive Indicators for Effective Trading Strategies By John Ehlers INTRODUCTION Technical traders understand that indicators need to smooth market data to be useful, and that smoothing introduces lag
ADX breakout scanning ADX breakouts can signal momentum setups as well as exit conditions for intraday and swing traders. FIGURE 1: AFTER ADX > 40
 TRADING STRATEGIES ADX breakout scanning ADX breakouts can signal momentum setups as well as exit conditions for intraday and swing traders. BY KEN CALHOUN FIGURE 1: AFTER ADX > 40 Spotting volatility
Trading with the Intraday Multi-View Indicator Suite
 Trading with the Intraday Multi-View Indicator Suite PowerZone Trading, LLC indicators can provide detailed information about the conditions of the intraday market that may be used to spot unique trading
Performance of technical trading rules: evidence from Southeast Asian stock markets
 DOI 10.1186/s40064-015-1334-7 RESEARCH Open Access Performance of technical trading rules: evidence from Southeast Asian stock markets Piyapas Tharavanij *, Vasan Siraprapasiri and Kittichai Rajchamaha
ValueCharts for thinkorswim
 ValueCharts for thinkorswim Contents What are ValueCharts? What is ValueCharts Scanner? What are ValueAlertsSM? What are ValueBarsSM? What are ValueBandsSM What are ValueLevelsSM? What are ValueFlagsSM?
FreeStockCharts.com Workbook
 FreeStockCharts.com Workbook Updated March 2010 FREESTOCKCHARTS.COM WORKBOOK Worden Brothers, Inc. www.worden.com Five Oaks Office Park 4905 Pine Cone Drive Durham, NC 27707 0 FREESTOCKCHARTS.COM WORKBOOK
My Daily Trading Preparation. Establishing Risk Parameters and Positions
 My Daily Trading Preparation Establishing Risk Parameters and Positions My Trading Goals My goals have to be consistent with my trading plan each day. For stocks, I am primarily a long-only trader (and
ETF Total Cost Analysis in Action
 Morningstar ETF Research ETF Total Cost Analysis in Action Authors: Paul Justice, CFA, Director of ETF Research, North America Michael Rawson, CFA, ETF Analyst 2 ETF Total Cost Analysis in Action Exchange
Trading with the High Performance Intraday Analysis Indicator Suite
 Trading with the High Performance Intraday Analysis Indicator Suite PowerZone Trading indicators can provide detailed information about the conditions of the intraday market that may be used to spot unique
UNUSUAL VOLUME SYSTEM
 UNUSUAL VOLUME SYSTEM FREE SAMPLE: THIS DOCUMENT SHOWS JUST ONE EXAMPLE OF THE 30+ TRADING STRATEGIES INCLUDED IN THE HOW TO BEAT WALL STREET VIP PACKAGE. THE VIP PACKAGE ALSO INCLUDES VIDEOS, TUTORIALS,
Futures Trading Using the 14-day Stochastic Signal as Defined and Published by Robert McHugh, Ph.D.,
 Futures Trading Using the 14-day Stochastic Signal as Defined and Published by Robert McHugh, Ph.D., by David Zaitzeff, futures broker at PFG West (Camarillo, CA) 800-656-0443 (office) Robert McHugh, Ph.D.,
User Guide and Definitions
 User Guide and Definitions Above the Chart Get a Quote Use the search bar to look up a stock or ETF listed on any U.S. stock exchange. Examples: MSFT VXX WMT Yellow Information Bar Just above the chart,
STREET SMARTS I. Planetary 2 Library. Introduction: Benefits: L I B R A R I E S
 Planetary 2 Library STREET SMARTS I Introduction: In today s world of computer trading, the small speculator often feels at a disadvantage to traders and corporations that have access to more powerful
Portfolio Rotation Simulator User s Guide
 Portfolio Rotation Simulator User s Guide By Jackie Ann Patterson, author of Truth About ETF Rotation, the first book in the Beat the Crash series Contents Overview... 1 Key Limitations... 2 Enabling Macros
Model Validation Turtle Trading System. Submitted as Coursework in Risk Management By Saurav Kasera
 Model Validation Turtle Trading System Submitted as Coursework in Risk Management By Saurav Kasera Instructors: Professor Steven Allen Professor Ken Abbott TA: Tom Alberts TABLE OF CONTENTS PURPOSE:...
Simpler Options. Indicator guide. An informative reference for John Carter s commonly used trading indicators. www.simpleroptions.
 Simpler Options Indicator guide An informative reference for John Carter s commonly used trading indicators At Simpler Options you will see a handful of proprietary indicators on John Carter s charts.
Overlapping ETF: Pair trading between two gold stocks
 MPRA Munich Personal RePEc Archive Overlapping ETF: Pair trading between two gold stocks Peter N Bell and Brian Lui and Alex Brekke University of Victoria 1. April 2012 Online at http://mpra.ub.uni-muenchen.de/39534/
Commodity Channel Index
 Commodity (CCI) Developed by Donald Lambert, the Commodity (CCI) was designed to identify cyclical turns in commodities but can be applied to shares as well. The Commodity Channel Index uses a typical
Development of Trading Strategies
 Development of Trading Strategies I have been a Chaos Hunter user since it first came out. My interest in CH was to try to learn new relationships about various data series. I was hoping to find a predictive
Evaluating Trading Systems By John Ehlers and Ric Way
 Evaluating Trading Systems By John Ehlers and Ric Way INTRODUCTION What is the best way to evaluate the performance of a trading system? Conventional wisdom holds that the best way is to examine the system
The 15 50 Trading System
 Main Premise: This is considered to be one of the most straight forward systems for a live trading style for day- and/or intraday trading. The 50 SMA is one of the most commonly used moving average numbers
Leon Wilson Trading Success
 Leon Wilson Trading Success A talk given by Mary de la Lande to the BullCharts User Group Meeting on 13 February 2008 1. Who is Leon Wilson? His Books and where to get them. 2. Book 1: The Business of
Mean Reversion - Illustration of Irregular Returns in US Equity and Fixed Income Markets
 AlphaQuest CTA Research Series #4 The goal of this research series is to demystify specific black box CTA trend following strategies and to analyze their characteristics both as a stand-alone product as
CURRENCY TRADING Using Swing Breakouts in Forex Trading
 CURRENCY TRADING Using Swing Breakouts in Forex Trading 28 MAY 2009 Doug Schaff discusses the use of intermediate swing highs and swing lows to develop a shortterm approach to trading the currency markets.
User guide Version 1.1
 User guide Version 1.1 Tradency.com Page 1 Table of Contents 1 STRATEGIES SMART FILTER... 3 2 STRATEGIES CUSTOM FILTER... 7 3 STRATEGIES WATCH LIST... 12 4 PORTFOLIO... 16 5 RATES... 18 6 ACCOUNT ACTIVITIES...
Technical Indicators Tutorial - Forex Trading, Currency Forecast, FX Trading Signal, Forex Training Cour...
 Page 1 Technical Indicators Tutorial Technical Analysis Articles Written by TradingEducation.com Technical Indicators Tutorial Price is the primary tool of technical analysis because it reflects every
292 INDEX. Growth and income style of trading, 12 13 winning strategies (see Winning growth and income strategies)
") Index Aggressive growth strategies, 56 70 all-cap growth, 61 63 call options, 274 first profit, 68 70 generally, 11 market capitalization study, 65 methodology, 56 59, 61 62, 67, 69 70 1-week rebalance
Index Aggressive growth strategies, 56 70 all-cap growth, 61 63 call options, 274 first profit, 68 70 generally, 11 market capitalization study, 65 methodology, 56 59, 61 62, 67, 69 70 1-week rebalance
Navigator Fixed Income Total Return
 CCM-15-12-1 As of 12/31/2015 Navigator Fixed Income Navigate Fixed Income with a Tactical Approach With yields hovering at historic lows, bond portfolios could decline if interest rates rise. But income
AlphaSolutions Reduced Volatility Bull-Bear
 AlphaSolutions Reduced Volatility Bull-Bear An investment model based on trending strategies coupled with market analytics for downside risk control Portfolio Goals Primary: Seeks long term growth of capital
GMMA 2.0 User Guide. August 2010 Edition PF-30-01-02
 GMMA 2.0 User Guide GMMA 2.0 User Guide August 2010 Edition PF-30-01-02 Support Worldwide Technical Support and Product Information www.nirvanasystems.com Nirvana Systems Corporate Headquarters 7000 N.
EVALUATING THE APPLICATION OF NEURAL NETWORKS AND FUNDAMENTAL ANALYSIS IN THE AUSTRALIAN STOCKMARKET
 EVALUATING THE APPLICATION OF NEURAL NETWORKS AND FUNDAMENTAL ANALYSIS IN THE AUSTRALIAN STOCKMARKET Bruce J Vanstone School of IT Bond University Gold Coast, Queensland, Australia [email protected]
ishares MINIMUM VOLATILITY SUITE SEEKING TO WEATHER THE MARKET S UP AND DOWNS
 ishares MINIMUM VOLATILITY SUITE SEEKING TO WEATHER THE MARKET S UP AND DOWNS Table of Contents 1 Introducing the ishares Minimum Volatility Suite... 02 2 Why Consider the ishares Minimum Volatility Suite?...
OmniFunds. About OmniFunds. About Alpha 2.0: About VisualTrader 11 Pro. Alpha 2.0 - Released September 24, 2015
 OmniFunds Alpha 2.0 - Released September 24, 2015 About OmniFunds OmniFunds is an exciting work in progress that our users can participate in. As of Alpha 2.0, we have one canned example our users can
NorthCoast Investment Advisory Team 203.532.7000 [email protected]
 NorthCoast Investment Advisory Team 203.532.7000 [email protected] NORTHCOAST ASSET MANAGEMENT An established leader in the field of tactical investment management, specializing in quantitative research
Dynamic Zones NEW TECHNIQUES
 NEW TECHNIQUES Dynamic Zones Most indicators use a fixed zone for buy and sell signals. Here s a concept based on zones that are responsive to past levels of the indicator. by Leo Zamansky, Ph.D., and
Navigator Fixed Income Total Return
 CCM-15-08-1 As of 8/31/2015 Navigator Fixed Income Total Return Navigate Fixed Income with a Tactical Approach With yields hovering at historic lows, bond portfolios could decline if interest rates rise.
Three-Bar Inside Bar Pattern
 How It Works On Gold And Silver And Crude Three-Bar Inside Bar Pattern This trading strategy uses an inside bar as a three-bar pattern for long and short positions. Find out how it performed on gold, silver,
Planetary GLEN S 2 DAILY Library MOMENTUM STOCK SELECTOR LIBRARY. Introduction: Benefits: L I B R A R I E S
 Planetary GLEN S 2 DAILY Library MOMENTUM STOCK SELECTOR LIBRARY Introduction: Choosing between different stock trading strategies can be a difficult decision. When you investigate fundamentals, technicals,
SUPER TREND PROFIT. (Trend Indicator with alert popup and email alert) DISCLAIMER
 DISCLAIMER") SUPER TREND PROFIT (Trend Indicator with alert popup and email alert) DISCLAIMER Please be aware of the loss, risk, personal or otherwise consequences of the use and application of this book s content.
SUPER TREND PROFIT (Trend Indicator with alert popup and email alert) DISCLAIMER Please be aware of the loss, risk, personal or otherwise consequences of the use and application of this book s content.
9 Questions Every Australian Investor Should Ask Before Investing in an Exchange Traded Fund (ETF)
") SPDR ETFs 9 Questions Every Australian Investor Should Ask Before Investing in an Exchange Traded Fund (ETF) 1. What is an ETF? 2. What kinds of ETFs are available? 3. How do ETFs differ from other investment
SPDR ETFs 9 Questions Every Australian Investor Should Ask Before Investing in an Exchange Traded Fund (ETF) 1. What is an ETF? 2. What kinds of ETFs are available? 3. How do ETFs differ from other investment
Vantage 2.0 Portfolios Stop Loss Analyzed. Presented by:
 Vantage 2.0 Portfolios Stop Loss Analyzed Presented by: Gain a competitive edge through the science of investing. 323 Regency Ridge Drive Dayton, Ohio 45459 866.439.9093 www.beaconinvesting.com Vantage
Chapter 2.3. Technical Indicators
 1 Chapter 2.3 Technical Indicators 0 TECHNICAL ANALYSIS: TECHNICAL INDICATORS Charts always have a story to tell. However, sometimes those charts may be speaking a language you do not understand and you
Savvy Dashboard. User Guide. Savvy Dashboard Version 1.0 Release Date 2014 TradeStation Version Compatibility 9.1 Update 20-25
 User Guide Savvy Dashboard Version 1.0 Release Date 2014 TradeStation Version Compatibility 9.1 Update 20-25 The Savvy Dashboard app displays essential technical, fundamental, and volatility indicators.
The S&P 500 Seasonal Day Trade
 TRADING TECHNIQUES The S&P 500 Seasonal Day Trade Is there a particular day of the week within a month that offers the most opportunity? Here s a trading system based on the best days of the week for trading
ECLIPSE DAY TRADING SYSTEM USER GUIDE
 ECLIPSE DAY TRADING SYSTEM USER GUIDE Revised 25 November 2014 METHOD Trend and Countertrend STYLE Day Trading DESCRIPTION Methodology - ECLIPSE is a hedge-fund style day trading system for accredited
MOON-ES DAY TRADING SYSTEM USER GUIDE
 MOON-ES DAY TRADING SYSTEM USER GUIDE Version 7.0 Revised 8 September 2014 METHOD Trend and Countertrend STYLE Day Trading DESCRIPTION Methodology - MOON is a customizable hedge-fund style day trading
The SPX Size Advantage
 SPX (SM) vs. SPY Advantage Series- Part II The SPX Size Advantage September 18, 2013 Presented by Marty Kearney @MartyKearney Disclosures Options involve risks and are not suitable for all investors. Prior
ACTIVE TRADING WITH TRADESTATION AND THE STOCKSCORES STRATEGIES
 ACTIVE TRADING WITH TRADESTATION AND THE STOCKSCORES STRATEGIES WORKSPACE/DESKTOP LAYOUT There are infinite ways to set up your Tradestation layout; how you do it is a personal preference. The process
Technical Analysis SAmple InveSTIng plans 1
 Technical Analysis Sample Investing Plans 1 Important Information All investing plans and rules are provided for informational purposes only, and should not be considered a recommendation of any security,
Automatic Synthesis of Trading Systems
 Automatic Synthesis of Trading Systems Michael Harris www.priceactionlab.com The process of developing mechanical trading systems often leads to frustration and to a financial disaster if the systems do
Neural Network Stock Trading Systems Donn S. Fishbein, MD, PhD Neuroquant.com
 Neural Network Stock Trading Systems Donn S. Fishbein, MD, PhD Neuroquant.com There are at least as many ways to trade stocks and other financial instruments as there are traders. Remarkably, most people
How To Determine If Technical Currency Trading Is Profitable For Individual Currency Traders
 Is Technical Analysis Profitable for Individual Currency Traders? Boris S. Abbey and John A. Doukas * Journal of Portfolio Management, 2012, 39, 1,142-150 Abstract This study examines whether technical
Trading Multiple CCI Time Periods
 Trading Multiple CCI Time Periods Trader: Mark Whistler Within Forex, there s something professional traders call, chasing indicators. Sadly, so many retail traders with the mindset that trading Forex
Automated Foreign Exchange Trading System
 Automated Foreign Exchange Trading System An Interactive Qualifying Project Report Submitted to the Faculty of WORCESTER POLYTECHNIC INSTITUTE in partial fulfillment of the requirement for the Degree of
[email protected]
 [email protected] 3 Part Now That I Am Bored in Retirement Series Part 1 Basics designed for those new to HGSI or those wanting a refresher of our unique indicator set Part 2 Putting the Tools
To have the ability to pay all benefits obligations when requested.
 INVESTMENT POLICY STATEMENT FOR: Alliance Benefit Group Health Savings Account Program I. GENERAL Purpose and Overview The Alliance Benefit Group Health Savings Account Program ( Program ) was established
Nest Plus StocksIQ User Manual
 Omnesys Technologies Pvt. Ltd. NEST PLUS Nest Plus StocksIQ User Manual February, 2013 https://plus.omnesysindia.com/nestplus/ Page 1 of 7 Document Information DOCUMENT CONTROL INFORMATION DOCUMENT Nest
Value? Growth? Or Both?
 INDEX INSIGHTS Value? Growth? Or Both? By: David A. Koenig, CFA, FRM, Investment Strategist 1 APRIL 2014 Key points: Growth and value styles offer different perspectives on potential investment opportunities,
Stock Trading Systems: Analysis and Development of a System of Systems
 Stock Trading Systems: Analysis and Development of a System of Systems An Interactive Qualifying Project Submitted to the Faculty of WORCESTER POLYTECHNIC INSTITUTE In partial fulfillment of the requirements
THE INVERSE FISHER TRANSFORM By John Ehlers
 THE INVERSE FISHER TRANSFORM By John Ehlers The purpose of technical indicators is to help with your timing decisions to buy or sell. Hopefully, the signals are clear and unequivocal. However, more often
FxPro Education. Automated trading
 FxPro Education More than a quarter of trades with FxPro are executed automatically by computer programs. These types of trades are known by many terms, including expert advisors, algos and robots. Many
ANZ ETFS S&P/ASX 100 ETF. (ASX Code: ZOZI)
") ANZ ETFS S&P/ASX 100 ETF (ASX Code: ZOZI) INVESTMENT BUILDING BLOCKS FOR A CHANGING WORLD Introducing a suite of innovative exchange traded funds (ETFs) designed for Australian investors by ANZ ETFS,
ANZ ETFS S&P/ASX 100 ETF (ASX Code: ZOZI) INVESTMENT BUILDING BLOCKS FOR A CHANGING WORLD Introducing a suite of innovative exchange traded funds (ETFs) designed for Australian investors by ANZ ETFS,
Algorithmic Trading: A Quantitative Approach to Developing an Automated Trading System
 Algorithmic Trading: A Quantitative Approach to Developing an Automated Trading System Luqman-nul Hakim B M Lukman, Justin Yeo Shui Ming NUS Investment Society Research (Quantitative Finance) Abstract:
How to Win the Stock Market Game
 How to Win the Stock Market Game 1 Developing Short-Term Stock Trading Strategies by Vladimir Daragan PART 1 Table of Contents 1. Introduction 2. Comparison of trading strategies 3. Return per trade 4.
Thinking Man s Trader
 Thinking Man s Trader Advanced Trader s Package Trading is a three dimensional world and the Advanced Trader s Package covers all three. Dimension three: Market Dynamics, conditions and change of conditions
9 Questions Every ETF Investor Should Ask Before Investing
 9 Questions Every ETF Investor Should Ask Before Investing 1. What is an ETF? 2. What kinds of ETFs are available? 3. How do ETFs differ from other investment products like mutual funds, closed-end funds,