6 FLOOD DAMAGES ASSESSMENT
|
|
|
- Jeremy Simon
- 10 years ago
- Views:
Transcription
1 FLOOD DAMAGES ASSESSMENT FLOOD DAMAGES ASSESSMENT Flood damage assessment is an important component of any floodplain management framework. This type of analysis enables the floodplain manager to gain an understanding of the magnitude of assets under threat from flooding. The method adopted for the study is ANUFLOOD, which is described in more detail in the following sections. The damages assessment has been undertaken for properties identified by the CoGG as being at risk of flooding. 6.1 Methodology The basic procedure for calculating the monetary flood damages is provided below. Identify the areas inundated and the depth of inundation for the range of design flood events (20%, 10%, 5% and 1% AEP) modelled using the TUFLOW hydraulic model. Determine the damages due to a particular flood event using the surveyed floor levels of properties that are flood-affected. Calculate the depth of above floor flooding within each property for each AEP event. Prepare stage-damage relationships for residential and commercial properties. These relationships will account for such factors as the relative degree of flood preparedness of the community. Produce total flood damages for the range of flood events for both residential and commercial/industrial properties. Sum damages for all properties for each AEP event and present the results in a probability-damage graph. Assume indirect damages are 30% of direct damages as recommended in the RAM (Rapid Appraisal Method) report (NRE 2000). Determine the average annual damages (AAD) Stage-Damage Curves ANUFLOOD residential stage-damage curves were used for this flood damage assessment. These curves were sourced from NRE (2000). The non-residential stage-damage curves, also ANUFLOOD curves, were sourced from a journal paper by Smith (1994) Flood Damage Estimation A review of urban stage-damage curves and loss functions. The curves have all been indexed to the 1 st Quarter 2011 units using appropriate CPI factors sourced from Bureau of Statistics. ANUFLOOD has 15 non-residential stage-damage curves. For each building size (small, medium and large), there are 5 curves representing 5 value classes. Because the existing building floor level information did not include data on the type, size or condition of each of the buildings considered, the size and condition of each residential building was assumed to be medium and average respectively.

2 FLOOD DAMAGES ASSESSMENT 6-2 The RAM report suggests that the ANUFLOOD curves underestimate flood damages. To address this issue, increases of 60% have been applied to both the residential and non-residential curves, as recommended in the RAM. Ratios to convert Potential damages to Actual damages were used as per the recommendations from the RAM. That is, for an inexperienced community with less than 2 hours warning time, a factor (ratio) of 0.9 is used to reduce the potential damages to actual damages. Flood damages were calculated for the 20%, 10%, 5% and 1% AEP design flood events Damages Outside Buildings Damages to equipment outside the building are not included in the standard stage-damage curves used. Such damages may include damage to fences, driveways, lower level laundries and outdoor equipment. To account for this, an estimate of ground equipment damages was made as a function of ground level inundation. That is, assume a sliding scale from $0 to $1000 with $1000 being the maximum. The full $1000 damage is experienced once the flood level has reached the floor level of the building. The sliding scale works on the difference between the ground level and the floor level (e.g. a ground level of 1m, floor level of 2m, flood level of 1.5m receives ground equipment damages of $500). Other damages, such as the loss of plants, lawn and landscaping, are difficult to quantify and are therefore considered in the non-economic assessment Damages Calculations The peak 20%, 10%, 5% and 1% AEP depth of flooding was determined at each property for which floor levels were available and the associated flood damages extracted from the stage-damage relationships. Total damages for each flood event were determined by summing the predicted damages for each individual dwelling. The AAD was then calculated. The AAD is the average damage in dollars per year that would occur in a designated area from flooding over a long period of time. In many years there may be no flood damage, in some years there will be minor damage (caused by small, relatively frequent floods) and, in a few years, there will be major flood damage (caused by large, rare flood events). Estimation of the AAD provides a basis for comparing the effectiveness of different management measures (i.e. the reduction in the AAD). The AAD is the area under the probability-damage graph. Ideally the probable maximum flood damages are included in the AAD analysis, and it is also necessary to assume a flood AEP in which no damages occur. As no flood larger than the 1% AEP event was modelled, the probabilitydamages graph was extrapolated, and it was assumed that no damages would occur in the 50% AEP event. 6.2 Existing Conditions Flood Damages The total existing conditions damages for each design flood event are presented in Table 6-1. They are also illustrated in Figure 6-1. The existing conditions AAD for the Newcomb - Whittington drainage catchments, as presented in Table 6-1, is $178,000.
 of 0.9 is used to reduce the potential damages to actual damages.")
3 FLOOD DAMAGES ASSESSMENT 6-3 Table 6-1 Existing Conditions Damages Summary Event Existing Case (Years ARI) AEP House Damages Indirect Damages Total Damages PMF + 0.0% $ 956,000 Incremental Average Annual Damages 100 1% $ 687,000 $ 206,000 $ 893,000 $ 9, % $ 495,000 $ 148,000 $ 643,000 $ 30, % $ 395,000 $ 119,000 $ 514,000 $ 29, % $ 317,000 $ 95,000 $ 412,000 $ 46, % $ - $ - $ - $ 64,000 Average Annual Damage $ 178,000 + Note PMF damages are an extrapolation of the 1% AEP data, i.e., they were not calculated using PMF flood levels Figure 6-1 Existing Conditions Damages Probability Curve

4 MITIGATION SCHEMES ASSESSMENT MITIGATION SCHEMES ASSESSMENT This section outlines and investigates Schemes designed to reduce existing flood damages: a scheme is a combination of several mitigation options. This section provides details on the formulation and evaluation of each of the Schemes and considers the benefit/cost of the proposed works (tangible benefits) along with various other economic and non-economic factors to assist in recommending a preferred strategy. The assessment followed four key stages: 1. identification of focus areas; 2. mitigation option screening; 3. preliminary assessment of options; and 7.1 Focus Areas 4. detailed assessment of Schemes. Through the modelling of the existing conditions in the Newcomb - Whittington drainage catchments, widespread flooding was observed throughout the study area. Despite the number of properties exposed to flooding, relatively few houses had above floor flooding. However, the majority of houses that would be subject to above floor flooding are concentrated within several different locations; Geelong Portarlington Rd between Boundary Road and Wilsons Road, Between the intersection of Wilsons Road and Hickey Street, and the Southwest corner of the study area, and Between the Bellarine Rail Trail and the Bellarine Highway, west of Coppards Road. The above floor flooding along Geelong Portarlington Road is as a result of the high downstream water level adopted for this study to represent future sea level rise. As a result, conventional flood mitigation measures would not be successful in reducing the flood levels in this area, however further investigation into coastal protection from sea level rise in the Geelong region may aid flood management in this area and areas of similar circumstance. Consequently, reducing the flood levels in the upper part of the study area, south of the Bellarine Highway formed the focus of the mitigation schemes. 7.2 Mitigation Option Screening A wide range of mitigation options were considered as part of the first pass assessment. Options such as localised pipe system upgrades were considered to alleviate a number of the flooding issues in the areas of concern. Table 7-1 sets out the broad categories of options considered and whether any detailed investigation was undertaken. The decision on which options were to be considered was undertaken in consultation with the CoGG.

5 MITIGATION SCHEMES ASSESSMENT 7-2 The options that were selected for consideration are described in more detail in the following sections. Table 7-1 Mitigation Option Element Screening Element Type Strategy Elements Comment Assessed Urban Rural Structural Measures Non Structural Measures Structural Measures Non Structural Measures Pipe system upgrade Considered Pumps Not appropriate Soakage Pits Not appropriate Retarding Basin Not feasible Diversions Considered Floodways Not appropriate Open Drain Not appropriate Channel Improvement Not appropriate Bund Walls Not feasible Lot scale infiltration Not appropriate Lot scale detention Not appropriate Individual Property Floodproofing Possible, however very expensive Planning Scheme Amendments Considered Voluntary House Purchase Considered Voluntary House Raising Not feasible Levees Not applicable Floodwalls Not applicable Floodways Not applicable Floodplain Modification Not applicable Channel Improvement Not applicable Individual Property Floodproofing Not applicable Flood Storage Not applicable Diversions Not applicable Flood Warning Systems Not applicable Land Use Planning Not applicable Floodplain Education Programs Not applicable Purchase and Relocation Not applicable Information and Data Collection Not applicable Planning Scheme Amendments Not applicable Regulation and Enforcement Not applicable 7.3 Detailed Assessment Non-Structural Options The non-structural options considered for the economic assessment were voluntary house raising, voluntary house purchase and amendments to the planning scheme. Voluntary house raising was not considered further because it has limited application in these catchments, where many of the flood affected buildings cannot be economically raised. This is due in part to many vulnerable houses being of slab-on-ground construction. Voluntary house purchase was not considered viable because of the cost of the buy back and re-construction.

6 MITIGATION SCHEMES ASSESSMENT Structural Options The CoGG required that three mitigation schemes be assessed, with one of the schemes being do nothing. The four schemes that were assessed for the Newcomb Whittington drainage catchments are summarised in Table 7-2 and schemes one and three are shown in Figure 7-1 and Figure 7-2 respectively. Hydraulic and economic assessments were undertaken for each scheme. Table 7-2 Scheme Number One Two Three Four Newcomb Whittington Drainage Catchments Mitigation Scheme Details Details The diversion of all overland flow flowing east across Boundary Road and north across Townsend Road away from the study area and into a new pipe draining to the Barwon River. The triplication of all existing pipes within the study area. Whilst this is not a realistic mitigation option due to its prohibitive cost and disruption to the community, it is aimed at determining if significant drainage infrastructure improvements would deliver significant benefits to the community. Pipes laid along Wilsons Road to discharge into the Saltworks to alleviate overland flooding downstream of the intersection of Wilsons Road and Solar Drive. This option has not been tested in the hydraulic model as it was not deemed to be a feasible solution to the flooding problems in the Newcomb-Whittington drainage catchments. For further discussion refer to Section Do Nothing Pipe Works The proposed pipe works have been summarised below for the respective schemes. Scheme One Pipe Works Scheme One proposed pipe works include five new 900 mm RCPs running south down Boundary Road for approximately 830 m from the intersection with Townsend Road, with the outlet into the Barwon River floodplain. Further smaller diameter pipes would be required to convey flow from the required inlet pits to the proposed main drain, however the dimensions, number and location of these pipes could not be determined until detailed design of the scheme is undertaken. Scheme Two Pipe Works Scheme Two proposed pipe works include the triplication of all existing pipes within the study area. This would involve the replacement of existing pipes with pipes of larger diameter or the installation of duplicate pipes. Scheme Three Pipe Works Scheme Three proposed pipe works include 15 new 600 mm RCPs to be laid along Wilsons Road from Solar Drive with the outlet into the open channel drain running along the southern boundary of the salt works.

7 MITIGATION SCHEMES ASSESSMENT Pit Works The proposed pit works have been summarised below for the respective schemes. Scheme One Pit Works In conjunction with the design of the connector pipes a pit arrangement must also be designed in order to capture the flow that originates in the southwest of the catchments. While the dimensions, numbers and locations of the pit network cannot be determined until the detailed design phase, pits have been included in the scheme costing. Scheme Two Pit Works Scheme Two proposed pit works include the triplication of all existing pits within the study area. This would involve replacing the existing pits with pits of larger inlet capacity or the installation of duplicate pits Further Works Land Forming Works Scheme One In order to direct the diverted flow into the drainage network in scheme limited land forming works may be required. While need and hence nature of land forming works cannot be determined until the detailed design phase, the possibility of the impact of any such work has been accounted for in the contingency element of the scheme cost.

8

9

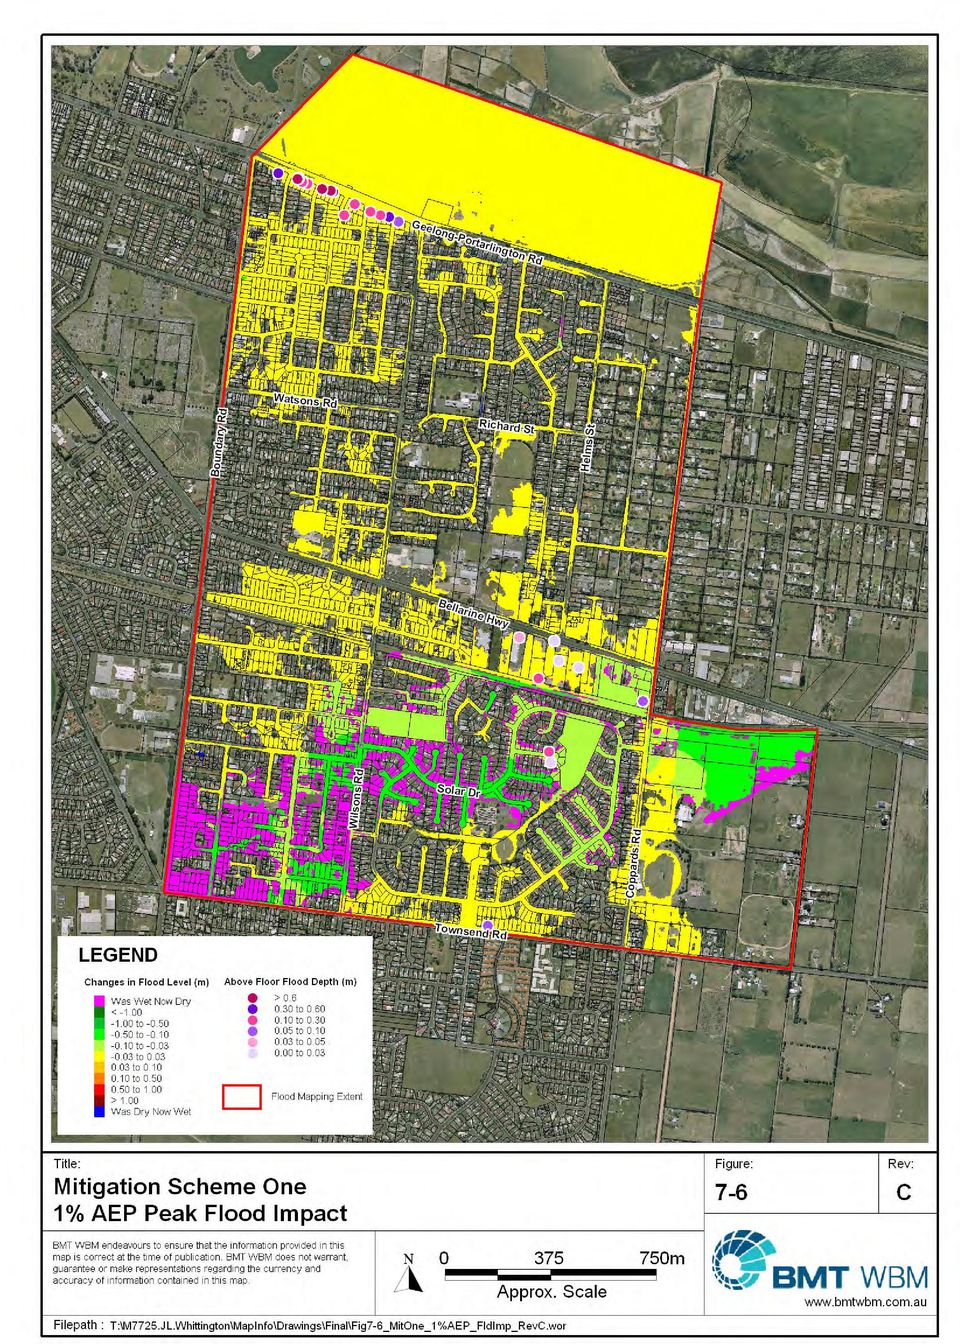
10 MITIGATION SCHEMES ASSESSMENT Hydraulic Assessment The 20%, 10%, 5% and 1% AEP design floods were assessed using the same six storm duration events as used for the existing case. A peak flood height envelope was then developed for each flood event for Schemes One and Two. A hydraulic analysis of Scheme Three was not undertaken, as discussed further in Section The change in peak flood height for each scheme was calculated by subtracting the existing case peak flood heights from the scheme peak flood heights at each TUFLOW grid. The change in peak flood height was then colour contoured and mapped. The modelling and mapping was not done for the Do Nothing scheme as there were no changes from the existing conditions. Peak flood height surfaces were used to calculate the number of properties flooded and depth of above floor flooding, which was then used in the flood damages assessment for the schemes. The mapping pertaining to each scheme in the hydraulic assessment illustrates no change in flood level within a 0.03 m tolerance as a yellow colour, reductions in flood level are shaded with greens and increases in flood level are shaded with browns/reds. A pink colour indicates a region where flooding currently occurs but would no longer occur if the scheme was implemented, and a blue colour indicates a region where flooding currently does not occur but would if the scheme was implemented Scheme One The change in peak flood height and the properties with above floor flooding, for Scheme One of the Newcomb Whittington drainage catchments, are mapped in Figure 7-3 to Figure 7-6 for the four flood events assessed. Table 7-3 summarises the reduction in flooded properties for Scheme One. Modelling of the diversion of flow from the southwest corner of the study into the Barwon River has significantly impacted on flood levels within the area between the intersection of Wilsons Road and Hickey Street, and the Southwest corner of the study area. As shown in the mapping there are no occurrences of above floor flooding in the area of interest, and that up to the 1% AEP event, the majority of the flow is contained within the road network. This scheme also restricts the majority of flooding around Solar Drive to the road reserves and reduces the flood level in the storages created by the Bellarine Highway and the rail trail. Table 7-3 Reduction in Flooded Properties Scheme One AEP No. Flooded Grounds Existing Scheme One Reduction No. Flooded Floors* Existing Scheme One Reduction 20% % % % * Results based on properties surveyed by CoGG.

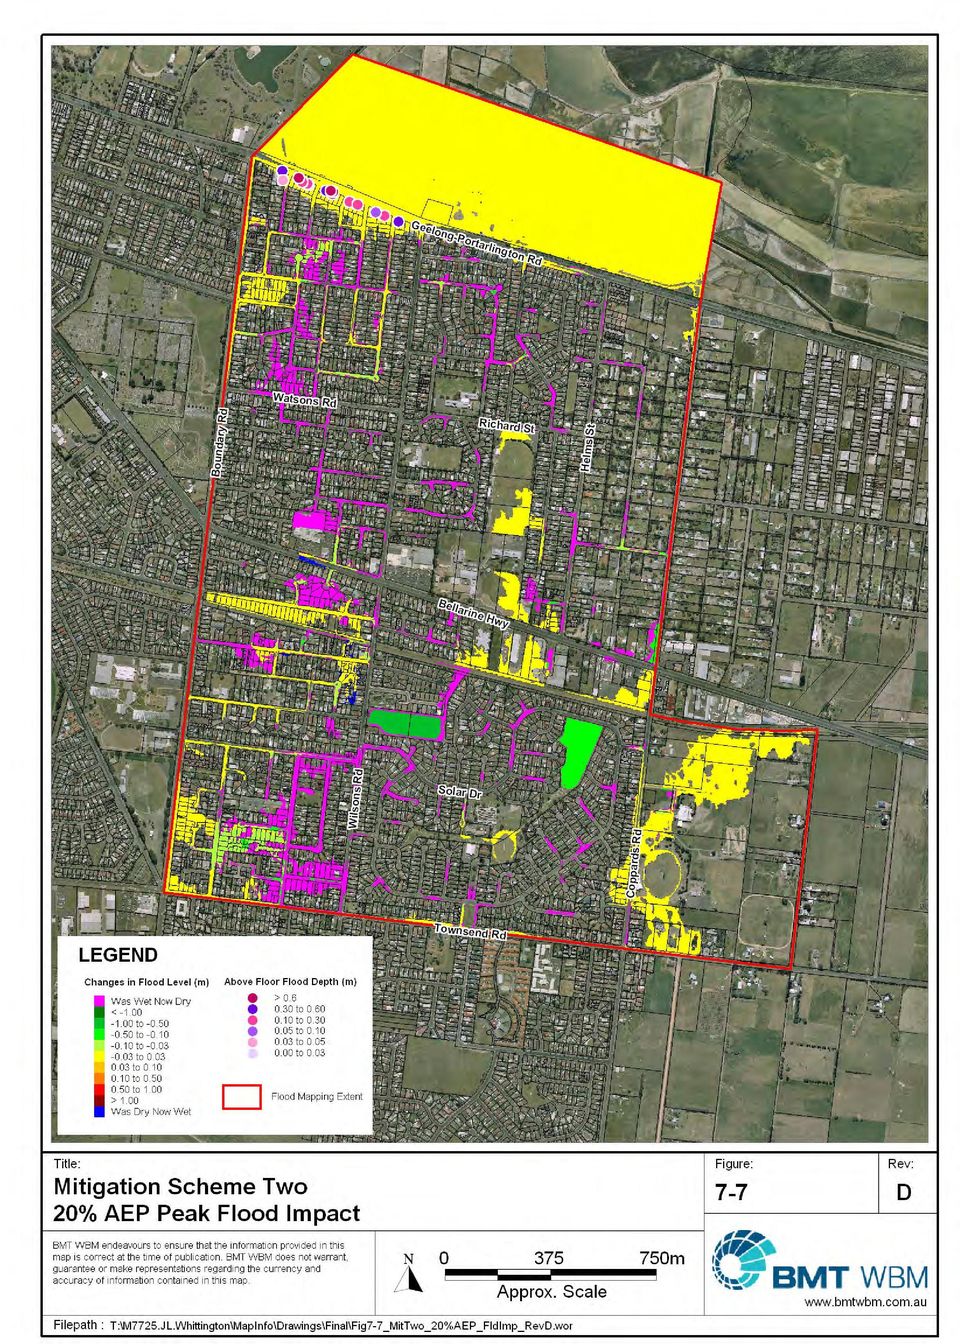
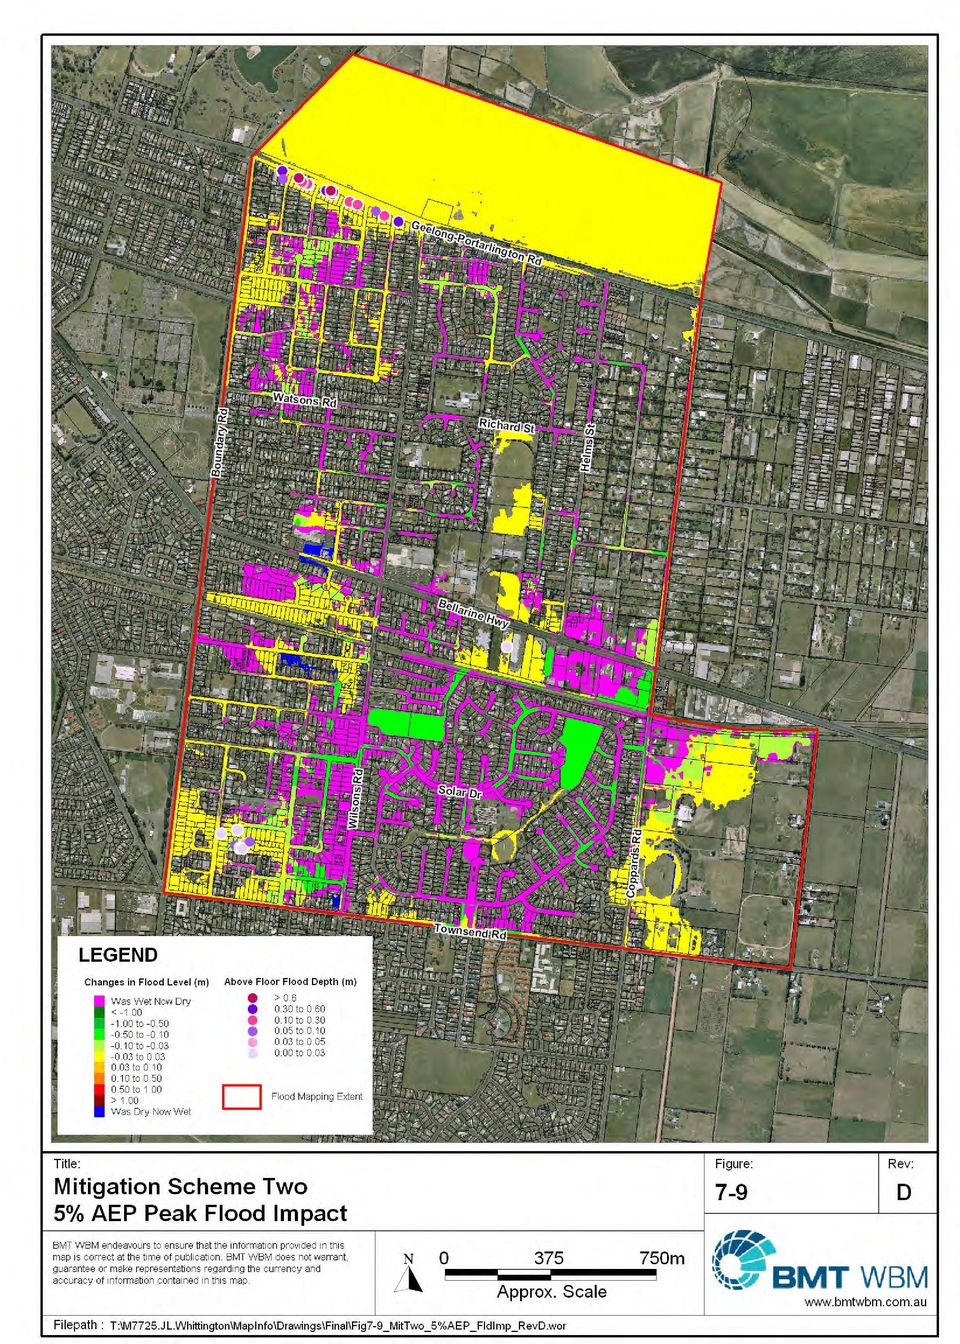
11 MITIGATION SCHEMES ASSESSMENT Scheme Two The change in peak flood height and the properties with above floor flooding, for Scheme Two of the Newcomb Whittington drainage catchments, are mapped in Figure 7-7 to Figure 7-10 for the four flood events assessed. Table 7-4 summarises the reduction in flooded properties for Scheme Two. Modelling of the triplication of existing drainage system capacity shows a reduction in flood levels across all AEP events, however with the exception of the areas whose flooding characteristics are dominated by the influence of the storage provide by the retarding basins and embankments the reduction in flood levels is generally restricted to the road reserves. The reduction in flood levels may not be as great as expected with such a large increase in the capacity of the drainage system within the catchments. This is due to the flat nature of the catchments and the high sea level used in the modelling, which restricts the conveyance efficiency of the pipe network, so that the main benefit of the increased pipe capacity is the extra flood storage provided. The limited reduction in above floor flooding compared to Scheme One is due to the relatively small flood level reductions that Scheme Two achieve in the area between the intersection of Wilsons Road and Hickey Street, and the Southwest corner of the study area compared to Scheme One where flow is diverted from this area. Table 7-4 Reduction in Flooded Properties Scheme Two No. Flooded Grounds No. Flooded Floors* AEP Existing Scheme Two Reduction Existing Scheme Two Reduction 20% % % % * Results based on properties surveyed by CoGG Scheme Three This option has not been tested in the hydraulic model as it was not deemed to be a feasible solution to the flooding problems in the Newcomb-Whittington drainage catchments. The following section outlines the reasoning why. Option Three explored the possibility of a new pipe along Wilsons Road to convey the overland flow from the area surrounding the intersection of Wilsons Road and Solar Drive. Based on an inspection of the Digital Elevation Model (DEM), the proposed pipe would have a pipe grade of only 1 in 715 (or 0.14%) if a minimum cover of 0.6 metres was maintained (the minimum for pipes along a road reserve). In order to maintain a self-cleaning velocity within the pipe of at least 0.5m/s, a potential pipe size that could fit in the proposed alignment would be 0.6 metre diameter. However, the discharge for a pipe of this size under these conditions would only be 0.25 cubic metres per second. In order to capture the required 3.7 cubic metres per second overland flow, fifteen pipes would be required. Placing this number of pipes along the road is not realistic as it would require an easement of at least 14 metres (allowing for rubber ring jointed pipes with minimum pipe clearances), which

12 MITIGATION SCHEMES ASSESSMENT 7-9 could not be accommodated within the existing road reserve. Given the required width of the easement, it is also likely that the alignment would have significant clashes with existing services (telecommunications, sewerage, water supply, etc) that could not easily (if at all) be resolved. Following discussion with CoGG it was agreed that further investigation of the Scheme was not required.
 be resolved.")
13

14

15

16
17
18

19
20

21 MITIGATION OPTIONS ASSESSMENT MITIGATION OPTIONS ASSESSMENT 8.1 Economic Assessment Basis of Assessment In general, the benefits of the construction of flood management schemes are as follows: increased flood immunity of properties protected by the scheme; increased flood immunity of roads protected by the scheme and thus improved mobility of the community during flooding events; decreased cost of flood damage to properties protected by the scheme; decreased potential for loss of life during a flood event within the area protected by the scheme; and decreased emotional, social and psychological trauma experienced by residents in times of flooding. It is important to note that flood management schemes can have the effect of increasing flood levels in other areas, thereby resulting in increased flood damages to properties elsewhere. Of the factors listed above, the change in flood damages is the only one that can be easily quantified in monetary terms. In Section 6, the flood damages for the existing study area were calculated. The reductions (or increases) in these damages have been calculated to quantify the monetary benefit of each scheme. The overall financial viability of a scheme is initially assessed by calculating the monetary benefit-cost ratio (BCR). These ratios are used to evaluate the economic potential for the option to be undertaken. A monetary benefit-cost ratio of 1.0 indicates that the monetary benefits are equal to the monetary costs. A ratio greater than 1.0 indicates that the benefits are greater than the costs while a ratio less than 1.0 indicates that the costs are greater than the benefits. The change in infrastructure damage as a result of implementing the scheme is not included in the benefit-cost analysis. In floodplain management, a BCR substantially less than 1.0 may still be considered viable because the economic analysis does not include the intangible benefits of a flood mitigation scheme. In order to calculate the BCR, the annual financial benefit (the change in average annual damages) of a scheme is summed over the financial project life and converted to present value. A financial project life of 30 years was chosen for this study. This does not imply that the projected structural life of the scheme is only 30 years. In fact, some measures should be effective in reducing the frequency of flooding for centuries to come. It is not correct to simply multiply a long term average annual benefit by the financial project life of 30 years to derive a total worth of the benefits. To do so would ignore the important point that the benefits from this scheme (i.e. reduced flood damages) will occur over time and in the future.
22 MITIGATION OPTIONS ASSESSMENT 8-2 For example, a benefit of $2.3 million to be gained in 10 years time is not worth $2.3 million now but only $1.2 million now. This is because $1.2 million could be invested now and appreciate at say 7% p.a. over and above inflation for 10 years. This would then be equivalent to $2.3 million in 10 years time. This is called the Present Value of the benefit. It is a universally accepted economic theory and used in all major project economic analyses. The adopted rate of 7% is called the discount rate and is the middle of the range 6 to 8% typically considered for assessing public works. As an example, Table 8-1 shows the present value of the annual benefit realised at different times over a 50 year period. Table 8-1 Present Value of Annual Benefits Year Average Annual Benefit ($ million) Present Value ($ million) If the present value benefits for each year are totalled for the 50 years, the total present value (or total benefit) of the benefits is $31.7 million. The calculation of the total benefit can be simplified through the use of a Present Value Factor. Rather than calculating the present value for each year and summing to calculate the total benefit, a Present Value Factor can be used when the average annual benefit is identical in each year. The Present Value Factor is calculated using equation (1). The Present Value Factor is multiplied by the average annual benefit to calculate the total benefit. The Present Value Factor is 13.8 for a 50 year period and a discount rate of 7%. It is interesting to note that if a longer financial project life of say, 100 years was chosen then the total present value of the benefits is only $1.1 million more at $32.8 million. This is due to the fact that the present value of the benefits to be accrued in the second 50 year period is low because of the length of time until the benefits are realised i i n (1) where n is the number of years i is the discount rate(%) The procedure for calculating benefit-cost ratios is outlined below: calculate the average annual benefit associated with the option (i.e. the reduction in average annual damages) using the method described in Section 6; convert the average annual benefit to a total benefit by multiplying by the present value factor; and calculate the total cost of the option.
23 MITIGATION OPTIONS ASSESSMENT 8-3 Calculate the monetary benefit-cost ratio: Benefit Cost Ratio Total Benefit Total Cost It is important to recognise that the monetary benefit-cost ratios represent only one of the issues that must be considered in respect to the viability of an option. Other issues such as social and psychological impacts, although difficult to quantify, must be included in the complete assessment. Benefit-cost ratios may be sensitive to variations and/or inaccuracies in the following: difficulties associated with upgrading pipes under existing roads; service conflicts; difficulties associated with trenching near buildings and power poles; and construction, maintenance and operation costs. Data from Melbourne Water s Land Development Manual and Melbourne Water rate estimates for drainage works were used to estimate the total cost of each option. These rates are summarised in Appendix A. The rates for stormwater pipes and rising mains were factored by 1.5 for sections constructed alongside or under roads. Stormwater pipes were costed on the basis of flush jointed construction with 100% fine crushed rock backfill. An allowance for engineering and contingencies of 15% and 20% has been allowed for in the proposed works with an Administration allowance of 9% (applied to the cost estimate inclusive of the engineering allowance). Maintenance costs were calculated based on recommendations made in the CoGG publication, Report on Asset Maintenance Benchmarking (GHD, 1997). Table Two of this report shows that CoGG are currently spending 0.4% of asset value on maintenance of drainage assets and recommends expenditure be increased to 2.4% of asset value. BMT WBM has adopted the recommended value of 2.4% Scheme One The damages under Scheme One for each design flood event are summarised in Table 8-2 and illustrated in Figure 8-1. The Scheme One AAD, also presented in Table 8-2, is $134,000, which is a reduction of $44,000 from the existing conditions AAD of $178,000 per annum. A summary of the capital costs for Scheme One is presented in Table 8-3 and the benefit cost analysis is summarised in Table 8-4. The BCR for Scheme One is Based on the figures presented in Table 7-3 and Table 8-3, the capital cost of Scheme One per property floor saved from flooding during a 1% AEP flood event is $85,000.
24 MITIGATION OPTIONS ASSESSMENT 8-4 Table 8-2 Scheme One Damages Summary Event Scheme One ARI AEP House Damages Indirect Damages Total Damages Incremental Average Annual Damages PMF + 0.0% $508, % $374,000 $112,000 $486,000 $ 5, % $308,000 $ 92,000 $400,000 $ 17, % $292,000 $ 88,000 $380,000 $ 19, % $280,000 $ 84,000 $364,000 $ 37, % $- $- $- $ 56,000 Average Annual Damage $134,000 + Note PMF damages are an extrapolation of the 1% AEP data, i.e., they were not calculated using PMF flood levels Table 8-3 Scheme One Capital Cost Estimates Item Capital Cost Pipe Works $ 2,334,000 Contingencies (20%) $ 467,000 Engineering (15%) $ 350,000 Administration (9%) $ 242,000 Total $ 3,392,000 Table 8-4 Scheme One BCR Summary Item Existing Scheme One Damages (PA) $178,000 $ 134,000 Benefit (PA) $ 44,000 Benefit (NPV) $ 546,000 Capital Cost $3,392,000 Maintenance (PA) $ 81,000 Maintenance (NPV) $1,005,000 Total Option Cost $4,397,000 BCR 0.12
25 MITIGATION OPTIONS ASSESSMENT 8-5 Figure 8-1 Scheme One Probability Damages Curve Scheme Two The damages under Scheme Two for each design flood event are summarised in Table 8-5 and illustrated in Figure 8-2. The Scheme Two AAD, also presented in Table 8-5, is $144,000, which is a reduction of $34,000 from the existing conditions AAD of $178,000. A summary of the capital costs for Scheme Two is presented in Table 8-6 and the benefit cost analysis is summarised in Table 8-7. The BCR for Scheme Two is From the figures presented in Table 7-4 and Table 8-6, the capital cost of Scheme Two per property floor saved from flooding during a 1% AEP flood event is $2,242,000.
26 MITIGATION OPTIONS ASSESSMENT 8-6 Table 8-5 Scheme Two Damages Summary Event Scheme Two ARI AEP House Damages Indirect Damages Total Damages Incremental Average Annual Damages PMF + 0.0% $721, % $511,000 $153,000 $664,000 $ 7, % $338,000 $102,000 $440,000 $ 22, % $309,000 $ 93,000 $402,000 $ 20, % $286,000 $ 86,000 $372,000 $ 38, % $- $- $- $ 57,000 Average Annual Damage $144,000 + Note PMF damages are an extrapolation of the 1% AEP data, i.e., they were not calculated using PMF flood levels Table 8-6 Scheme Two Capital Costs Item Capital Cost Pipe Works $ 30,854,000 Contingencies (20%) $ 6,171,000 Engineering (10%) $ 4,628,000 Administration (9%) $ 3,193,000 Total $ 44,846,000 Table 8-7 Scheme Two BCR Summary Item Existing Scheme Two Damages (PA) $178,000 $ 144,000 Benefit (PA) $ 34,000 Benefit (NPV) $ 422,000 Capital Cost $44,846,000 Maintenance (PA) $ 1,076,000 Maintenance (NPV) $13,352,000 Total Option Cost $58,198,000 BCR 0.01
27 MITIGATION OPTIONS ASSESSMENT 8-7 Figure 8-2 Scheme Two Probability Damages Curve
28 MITIGATION OPTIONS ASSESSMENT Environmental Assessment Environmental impacts, associated with the construction and operation of each flood mitigation option, are discussed in this section. Table 8-8 presents details regarding the environmental implications for each scheme in the Newcomb Whittington drainage catchments. It is not anticipated that any of the schemes will have long-term environmental impacts. ISSUE Table 8-8 Environmental Implications FLOOD MITIGATION SCHEMES Scheme One Scheme Two Scheme Four Do Nothing (Existing Case) Ecological impact. No Change No Change No Change. Noise. Minor impacts associated with the construction of the pipe works. Minor impacts associated with the construction of the pipe works. No Change. Receiving Water Quality. Increased runoff into the Barwon River from diverted flow. As this runoff is coming from an urban catchments it could contain higher levels of pollutants consistent with urban areas. Following further investigation stormwater water quality works may be required to mitigate environmental impacts and meet stormwater management legislation. No Change No Change. Air. Minimal impact. Manage via construction management plan. Minimal impact. Manage via construction management plan. No Change.
29 MITIGATION OPTIONS ASSESSMENT Social Assessment Table 8-9 outlines the social implications related to each flood mitigation scheme proposed for the Newcomb Whittington drainage catchments. Table 8-9 Social Indicators ISSUE FLOOD MITIGATION SCHEMES Scheme One Scheme Two Scheme Four Recreation and Aesthetic. No Change No Change. No Change. Do Nothing (Existing Case) Cultural Heritage. Manage via Cultural Heritage Management Plan (if required). Same as Scheme One. No Change. Public Safety. Moderate risk due to potentially deep trenching. Manage risk with appropriate construction phase management plans as applicable. Same as Scheme One. No Change. Areas of unsafe flooding would remain. Some potential risk from large drainage structures. Manage with best practice design.
30 MITIGATION OPTIONS ASSESSMENT Feasibility and Performance Indicators Table 8-10 presents the feasibility and performance indicators for the Newcomb Whittington drainage catchments mitigation schemes. The main inhibitors to both schemes are the capital costs and relatively low BCR values; however Scheme One is more favourable than Scheme Two for these two indicators. Table 8-10 Feasibility and Performance Indicators ISSUE FLOOD MITIGATION SCHEMES Scheme One Scheme Two Scheme Four Do Nothing (Existing Case) Maintenance costs. Limited increase in annual maintenance cost as proposed pipe would only make up a small percentage of the drainage infrastructure within the study area. Large increase in annual maintenance cost as a result of the magnitude of the underground drainage infrastructure being tripled. No Change Ease of Construction Difficulties associated with the laying of new pipes, in particularly under Boundary Road, whilst minimising disruption to traffic flow. Difficulties associated with retro-fitting new pit and connector pipe configuration with already established development/drainage network. Potential for other utilities such as sewerage, potable water and gas to be located within the area. Difficulties associated with the laying of new pipes, in particularly under main roads such as Geelong Portarlington Road and the Bellarine Highway whilst minimising disruption to traffic flow. Difficulties with integrating new pipes and pits with an already complex drainage network. Potential difficulties with restrictions on space available as a result of limited road reserve and easement widths, and clashes with other utilities. Not applicable. Funding and feasibility. Moderate capital costs and a low BCR of 0.12 would make funding difficult. Capital cost of Scheme per property floor saved from flooding during a 1% AEP flood event is far lower than scheme two at $85,000. Very high capital cost and a low BCR of 0.01 would make funding difficult. Capital cost of Scheme per property floor saved from flooding during a 1% AEP flood event is $2,242,000. Not applicable.
31 MITIGATION OPTIONS ASSESSMENT 8-11 ISSUE Public acceptability. FLOOD MITIGATION SCHEMES Scheme One Scheme Two Scheme Four There would be issues related to this scheme as works are proposed to be undertaken on existing road infrastructure disturbing transportation. There would be major issues related to this scheme as works are proposed to be undertaken on existing road infrastructure on a very large scale disturbing transportation. Do Nothing (Existing Case) Issues relating to Council being seen to be doing nothing structurally about the problem. However, this issue may not be as significant within the study catchments as in other catchments, due to the communities' experience of flooding and a general appearance that they accept the area as flood prone.
32 PREFERRED MITIGATION SCHEME PREFERRED MITIGATION SCHEME 9.1 Description of Preferred Scheme Scheme One is the preferred mitigation scheme for the Newcomb Whittington drainage catchments. Through consultation with the CoGG, the preferred scheme was selected as it focuses on the mitigation of overland flows and flood depths to reduce the flood hazard within the Newcomb Whittington drainage catchments, in particular the area between the intersection of Wilsons Road and Hickey Street, and the southwest corner of the study area. Scheme One also presents a realistic mitigation option in terms of capital cost and the disturbance caused to transportation within the area. As documented in previous sections, and summarised below in Table 9-1, in comparison with Scheme Two, Scheme One doubles the number of floors saved with a $38.3M decrease in capital cost. Hence, Scheme One has significantly more flood benefit for the community, in terms of reducing flooded floors and flood hazard, whilst maintaining a feasible capital cost per floor saved. Table 9-1 Comparison of Scheme One and Scheme Two Scheme Capital Cost BCR Flooded Floors Saved in 1% AEP Flood Event* Capital Cost per floor saved (1% AEP Flood Event) One $3,392, $85,000 Two $44,846, $2,242,000 * Results based on properties surveyed by CoGG. Also considered in the selection of the preferred scheme were key indicators such as environmental, social and feasibility and performance. This analysis in regard to the preferred scheme, when compared to the other schemes, is summarised as follows: its potential environmental impact is minimal and similar to the other scheme; the social impacts arising from Scheme One are very limited and similar to the other scheme; and the feasibility and performance indicators are far more favourable than Scheme Two. 9.2 Structural Components Scheme One is schematised in Figure 7-1 and involves the following key elements: Five new 900 mm RCPs running south down Boundary Road for approximately 830 m from the intersection with Townsend Road, with the outlet into the Barwon River floodplain. Further smaller diameter pipes would be required to convey flow from the required inlet pits to the proposed main drain, however the dimensions, number and location of these pipes could not be determined until detailed design of the scheme is undertaken. A pit arrangement that is able to capture the flow that originates in the southwest of the catchments. The dimensions, numbers and locations of the pit network cannot be determined until the detailed design phase.
33 PREFERRED MITIGATION SCHEME 9-2 Potential limited land forming works may be required in order to direct the diverted overland flow into the drainage network. 9.3 Non-Structural Components In addition to the structural works associated with Scheme One, a number of additional recommendations are made in regard to the protection of individual buildings and property not provided with flood immunity by the preferred strategy. The following section summaries the additional components recommended for use in conjunction with Scheme One. Further investigation into the feasibility of localised flood mitigation measures, such as lifting footpaths and/or underground drainage augmentation, in order to reduce the flood risk for properties that would not benefit from Scheme 1 but have been the subject of previous drainage/flooding requests for service that have identified capacity deficiencies rather than blockages. These investigations would be undertaken in accordance with the priority ranking established by applying the City's prioritisation method for drainage investigation/design work. Further investigation into the feasibility of property-specific measures to manage risk from residual flooding with Scheme 1 in place. Potential measures include flood-proofing of individual or groups of buildings/properties by landowners, and property buy-back with on-sell following modifications (where feasible) with conditions known to purchaser. Education and awareness program to inform landowners how to minimise the magnitude of damage in a flood event. Development controls via designation of areas as liable to flooding in accordance with Building Regulations 2006 and use of flood zones/overlays within the Greater Geelong Planning Scheme. Recognition that further development within the catchments has the potential to increase flood risk to people and property. Assessment of rezoning proposals to include application of principle of zero adverse flood impact on adjacent, upstream and downstream areas. Assessment of development and subdivision applications to include application of best practice guidelines for development within or upstream of flood-prone areas. Best practice environmental management for stormwater runoff to be encouraged as part of development and subdivision applications in order to reduce runoff and improve water quality, where not a statutory requirement. 9.4 Flood Mapping of Preferred Scheme Flood mapping has been undertaken for the preferred scheme for each flood event as follows: Flood Impacts Figure 7-3 to Figure 7-6; and Flood Hazard Maps - Figure 9-1 to Figure 9-4.
34 PREFERRED MITIGATION SCHEME 9-3 The flood hazard maps (Figure 9-1 to Figure 9-4) show that, as with the existing conditions hazard mapping, the areas of unsafe hazard are restricted to the road reserves with the exception of the flood storages, both formal and informal and the area inundated by Stingaree Bay. No increase in flood hazard has occurred as a result of Scheme One. Large scale A1 plans show detailed mapping of flood extent and flood impacted properties for each of the 20%, 10%, 5% and 1% AEP events. These have been provided to CoGG as part of the data delivery in hard copy and digital GIS formats. 9.5 Funding of Preferred Scheme Funding mechanisms available to Council for the upgrade of drainage infrastructure typically fall into one of two categories: Private Benefit for which a user-charge typically applies associated with a direct link between the infrastructure provided and the benefit received; and Public Benefit is related to infrastructure that provides a benefit to the wider community throughout the municipality. Clearly, augmentation works undertaken within the Newcomb Whittington drainage catchments are for the direct benefit of those residents with an existing flooding problem or threat. There also exists an indirect benefit to those residents within the catchments associated with increased trafficability of roads subject to flooding, as well as public health and safety issues and other non-economic benefits. Benefit may also be deemed to apply to residents with properties that are not flood effected but discharge stormwater within the catchments. This principle of catchment wide benefit within drainage schemes has been successfully implemented under legislation previous to the Local Government Act Special Rates and Charges are the typical mechanism for funding of drainage works under user charges. Section 163 of the Local Government Act 1989 sets out the provisions for the application of a special rate, charge or combination of these. The purpose of the rate or charge is to recoup costs associated with the provision of infrastructure. The charge is typically a one-off payment while a rate is generally an annual payment made over a number of years. Recent decisions handed down at VCAT or AAT suggests a more confined application of special rates and charges particularly in relation to main drainage augmentation schemes. In essence the Ball decision (Appeal No 1993/37685) concluded: a special rate or charge can only be levied where a special benefit is received; the special benefit must be received by the land owners (rather than the property); in this context, a special benefit was recognised by the Tribunal as an increase in property values. That is, according to the Tribunal, while every property in the catchment receives, to a greater or lesser degree, a benefit from the main drainage augmentation works, that benefit does not translate into an increase in property values and is therefore not a special benefit. Thus, according to the tribunal, funding via special rates and charges is not applicable.
35 PREFERRED MITIGATION SCHEME 9-4 Furthermore, the Tribunal ruled that where: properties are already drained to lawful points of discharge and the provision of additional capacity in the main drainage system, although obviously required to drain the entire catchment, will not provide a special benefit to them as owners of their land. Appeal No 1993/37685 pg 7 This would indicate that the main drainage augmentation works within an area with made and kerbed streets is not considered by the Tribunal to provide a specific benefit to property owners in the catchment. Therefore the ruling would imply that in the case of the Newcomb-Whittington catchments, funding via special rates and charges may be problematic due to potential legal uncertainty and social resistance. It is recommended that Council seek independent legal advice to confirm the rationale of a test case involving a special rates and charges scheme. 9.6 Strategy for Implementation The capital cost for the catchments are approximately $3.9M. Council currently allocates approximately $2M per annum for major drainage works. Assuming that $0.5M per annum could be allocated for this program, then the construction program could be staged over a period of 8 years. Allowing four years for the determination and arrangement of funding sources and the design of the drainage works, the period of implementation would be 12 years. It is worth noting that once the main pipe proposed in Scheme One that runs under Boundary Road and outflows into the Barwon River floodplain is constructed then the existing drainage network can then be systematically diverted into the new pipe. As a result the staging of the scheme can be tailored to match funding and other limitations over the lifespan of the entire project. The 12 year schedule allows for one year for the determination and arrangement of funding sources and two years for the design of the drainage works. The designation of flood levels and application of flood zones/overlays would occur in the first 2 years, individual flood proofing would commence in year 3 and an education and awareness program would be ongoing. An approximate schedule of implementation is shown in Table 9-2.
36 PREFERRED MITIGATION SCHEME 9-5 Table 9-2 Implementation Schedule Item Year 1 Year 2 Year 3 Year 4 Year 5 to 12 Determine Funding Source(s) and Prepare Business Case. Detailed Design of Scheme One Staged Construction of Scheme One Designation and Dissemination of Flood Information. Planning Scheme Amendment (Flood Zones/Overlays). Individual Flood proofing. Education and Awareness Program.
37
38
39
40
41 PUBLIC CONSULTATION PROCESS PUBLIC CONSULTATION PROCESS The Newcomb Whittington Drainage/Flood Study Draft Report was placed on display for public consultation. The general public was advised of the exhibition via a public notice and the 2208 owners of properties affected by the 100 year ARI flood event received individual letters with explanatory fact sheets. During the public consultation period six written submission and 16 verbal submissions or enquiries were received. Some of the submitters acknowledged that their properties or roads had experienced flooding in the past in a manner consistent with the Study s flood-mapping. The major issues of concern raised by owners of affected properties are detailed in Appendix C with the relevant responses by CoGG.
42 REFERENCES REFERENCES Melbourne Water 1998, Melbourne Water Land Development Manual, viewed August 4, 2010, < Melbourne Water 2008, Guidelines for Development in Flood-prone Areas, Melbourne Water, Melbourne. (NRE 2000), Department of Natural Resources and Environment 2000, Rapid Appraisal Method (RAM) for Floodplain Management, Department of Natural Resources and Environment, Victoria. Smith, D 1994, Flood Damage Estimation A review of urban stage-damage curves and loss functions, Water SA, vol. 20, pp WBM Oceanics Australia 2004, Moolap Industrial Area Flood Management Plan Final Report, WBM Oceanics Australia, Melbourne..
43 APPENDIX A A-1 Nominal pipe diameter (mm) APPENDIX A: CONSTRUCTION RATES West Region Pipeline Rates ($ per m) Interlocking / Flush Jointed pipes Adopted rates for pipes in road reserves 100% FCR backfill 100% FCR backfill Jacking Rates , , , , , ,
44 APPENDIX B B-1 APPENDIX B: LONGITUDINAL PROFILE PLOTS
45
46
47 APPENDIX C C-1 APPENDIX C: PUBLIC SUBMISSIONS AND RESPONSES Six written submission and 16 verbal submissions or enquiries were received. Some of the submitters acknowledged that their properties or roads had experienced flooding in the past in a manner consistent with the Study s flood-mapping. The major issues of concern raised by owners of affected properties are listed below with the relevant responses provided by the City of Greater Geelong: 1. How can my property be considered subject to flooding when it has never flooded? Response: It cannot be assumed that flooding has not previously or will not occur at any given property, on the basis that there are no records of flooding or flooding to the extent identified by the mapping of the 1 in 100 year overland flows. There is no evidence that the 1 in 100 year or 100 year Average Recurrence Interval (ARI) flood event for the Newcomb-Whittington catchments has occurred within living memory. When reliable rainfall figures have been available, proper analysis has indicated that actual storms were less than the critical event for 1 in 100 year flooding within the catchments. 2. Are flood mitigation works proposed? Response: The drainage/flood study included the identification and modelling of flood mitigation options, preparation of cost estimates, feasibility analysis, identification of preferred options and development of a strategy. Scheme 1 was assessed to be the preferred mitigation scheme and this scheme shall be presented to Council for consideration within future budgets. 3. Will the designation affect my house insurance? Response: The Insurance Council of Australia has advised Melbourne Water that most home insurance policies, which provide coverage for storm damage, include cover for damages resulting from overland flows. Residents are advised to check with their insurance companies, but the nature of flooding, i.e. drainage-related rather than waterway, would need to be disclosed to the insurer. 4. Is the information being gathered by Council going to affect property values or saleability? Response: It is important to note that designation of an area as liable to flooding does not cause or change the likelihood of flooding, but recognises the existing condition of land.
48 APPENDIX C C-2 The designation will not be described on title, but will be disclosed in Land Information Certificates issued under the Local Government Regulations, and for building permits under the Building Regulations. The value of any property is determined by the complex interplay of many different factors such as demand/supply, location, streetscape and amenity, and it is difficult to assign what effect if any, the identification of land as liable to flooding may have on the value of a property. Devaluation of properties (identified as being liable to flooding) is considered unlikely once the nature of flooding is explained and taken into account. 5. If the value of my property is adversely affected by the flood mapping information, is there compensation available? Response: There is no reason for payment of compensation, as nothing has changed about the likelihood of a severe storm occurring or the path that overland flow will take. The City now has accurate information which, in many cases, may already be known by people who have lived at a property for many years. There is also no case for compensation for subdivision of flood-prone land or construction of dwellings without elevated floors as subdivision and building permit applications were assessed in accordance with the planning scheme provisions and the building regulations, respectively, which were in place at that time. 6. I believe flooding of my property is due to blocked drains and pits. Response: Flooding is due mainly to lack of hydraulic capacity within older drainage systems that were designed to the lower standards that were applicable at that time, as well as the lack of easement drainage in some areas. The City s Infrastructure Operations Unit endeavours to check critical council drainage assets for blockages or obstructions, in order to maximise use of capacity that may be available.
49 BMT WBM Brisbane Level 11, 490 Upper Edward Street Brisbane 4000 PO Box 203 Spring Hill QLD 4004 Tel Fax [email protected] Web BMT WBM Denver 14 Inverness Drive East, #B132 Englewood Denver Colorado USA Tel Fax [email protected] Web BMT WBM Mackay Suite 1, 138 Wood Street Mackay 4740 PO Box 4447 Mackay QLD 4740 Tel Fax [email protected] Web BMT WBM Melbourne Level 5, 99 King Street Melbourne 3000 PO Box 604 Collins Street West VIC 8007 Tel Fax [email protected] Web BMT WBM Newcastle 126 Belford Street Broadmeadow 2292 PO Box 266 Broadmeadow NSW 2292 Tel Fax [email protected] Web BMT WBM Perth 1 Brodie Hall Drive Technology Park Bentley 6102 Tel Fax [email protected] Web BMT WBM Sydney Suite 206, 118 Great North Road Five Dock 2046 PO Box 129 Five Dock NSW 2046 Tel Fax [email protected] Web BMT WBM Vancouver 1190 Melville Street #700 Vancouver British Columbia V6E 3W1 Canada Tel Fax [email protected] Web
Objective 4: Enhanced community education, flood awareness and preparedness
 Objective 4: Enhanced community education, flood awareness and preparedness Understanding the extent and full impacts of flooding is essential for planning for potential future pressures on the drainage
11.4 Voluntary Purchase. 11.5 House Raising and Flood Proofing
 11.4 Voluntary Purchase As mentioned in Section 10 in certain high hazard areas of the floodplain, it may be impractical or uneconomic to mitigate flood hazard to existing properties at risk, or flood
Appendix A Flood Damages Assessment
 Appendix A Flood Damages Assessment 106 GHD Report for Bundaberg Regional Council - Floodplain Action Plan, 41/26909 10. Flood Damages Assessment Methodology An important part of assessing flooding impact
Integrated Local Flood Management and Drainage Strategy OVERVIEW
 Integrated Local Flood Management and Drainage Strategy OVERVIEW Flooding is a natural phenomenon. In urban areas where drainage relies on pipe networks, open channels and creeks, flooding can cause infrastructure
The site is Lot 1 DP 837271. Survey of this lot and Willarong Road and Koonya Circuit is given in Figure 2.
 Our Ref : NA49913151-019-L02:BCP/bcp Contact: Dr Brett C. Phillips 8 th May 2015 Cardno (NSW/ACT) Pty Ltd ABN 95 001 145 035 The Manager Bunnings Group Limited, c/- C&M Consulting Engineers 1/142 James
Melbourne Water Flood Risk Assessment: How flood impacts are assessed in the Port Phillip and Westernport region
 Melbourne Water Flood Risk Assessment: How flood impacts are assessed in the Port Phillip and Westernport region INTRODUCTION Melbourne Water is the regional drainage and floodplain management authority
FLOOD INFORMATION SERVICE EXPLANATORY NOTES
 FLOOD INFORMATION SERVICE EXPLANATORY NOTES Part 1 About the flood maps Limitations of the mapping What the maps don t show Where to find more information Definitions of words used to describe flooding.
Melbourne Water s Submission. Draft Victorian Floodplain Management Strategy
 Melbourne Water s Submission Draft Victorian Floodplain Management Strategy Waterways, drainage and floodplains are essential to life and liveability. The rivers, creeks, estuaries, wetlands and floodplains
Action plans for hotspot locations - Ash Study
 Appendix 9 Action plans for hotspot locations - Ash Study Ash Vale North 1. Local evidence indicates the culvert could not discharge during December 2013 because the outlet was blocked on the western side
INFRASTRUCTURE, FLOOD PROTECTION AND REMEDIATION. Infrastructure Flood Protection Remediation Policies
 INFRASTRUCTURE, FLOOD PROTECTION AND REMEDIATION Infrastructure Flood Protection Remediation Policies DRAFT POOLBEG PLANNING SCHEME 196 FIGURE 9.1: UTILITIES WAYLEAVES Electricity Cables 8m Wayleave for
Summary: Introduction
 Summary: Melbourne Water has a range of responsibilities in the Port Phillip and Westernport region, including responsibilities for the protection and restoration of waterways and, in collaboration with
SUSTAINABLE URBAN DRAINAGE SYSTEMS
 overflow can lead into a permeable conveyance system to increase further the benefit and reduce the need for pipe systems. Pollutant removal rates have been shown to be high, with some pollutants being
Control filling, grading, dredging, and other development which may increase erosion or flood damage; and
 ARTICLE 16. FLOOD DAMAGE PREVENTION Section 16-1: Findings of Fact The flood hazard areas of the Town of Lillington are subject to periodic inundation which results in loss of life and property, health
Managing sewer flood risk
 Managing sewer flood risk J. Ryu 1 *, D. Butler 2 1 Environmental and Water Resource Engineering, Department of Civil and Environmental Engineering, Imperial College, London, SW7 2AZ, UK 2 Centre for Water
Appendix C - Risk Assessment: Technical Details. Appendix C - Risk Assessment: Technical Details
 Appendix C - Risk Assessment: Technical Details Page C1 C1 Surface Water Modelling 1. Introduction 1.1 BACKGROUND URS Scott Wilson has constructed 13 TUFLOW hydraulic models across the London Boroughs
Lower Raritan Watershed Management Area Stormwater & Flooding Subcommittee Strategy Worksheet LRSW-S3C1
 Strategy Name: Reduce Existing Potential for Flood Damages LRSW-S3C1. Develop and implement a program to: Minimize flood damages through the use of structural measures. Minimize flood damages through the
History of flooding. 12 Flood Management and Drainage Strategy. Riverine flooding
 History of flooding Riverine flooding The original settlement of Melbourne was situated in a basin intersected by the paths of the Yarra and Maribyrnong Rivers. Many of the early recorded floods occurred
Appendix F Benefit-Cost Analysis of Flood Protection Measures
 Appendix F Benefit-Cost Analysis of Flood Protection Measures Acronyms used in Appendix F: AA B AA C AA D BC BFE EAD FEMA NED O&M PV RED USACE Average Annual Benefits Average Annual Cost Average Annual
Council Strategy DOC/15/86752
 Council Strategy Council strategy title: Council strategy owner: Adopted by: Date adopted: July 2015 Document Reference no: Drainage Upgrade Strategy Director Infrastructure Services Bayside City Council
URBAN DRAINAGE CRITERIA
 URBAN DRAINAGE CRITERIA I. Introduction This division contains guidelines for drainage system design and establishes a policy for recognized and established engineering design of storm drain facilities
Planning for Casey s Community
 2 July 2013 ITEM 2 ATTACHMENT 1 Council Report from Meeting This information is circulated separately. Council Meeting Page 9 Amendment C143 to the Casey Planning Scheme Revisions to various areas within
CASS COUNTY COMMISSION POLICY MANUAL 38.07 ADOPTED DATE: FEBRUARY 2, 1998 PAGE 1 OF 9
 CASS COUNTY COMMISSION POLICY MANUAL 38.07 SUBJECT: ORDINANCE #1998-2 (FLOOD DAMAGE PREVENTION) ADOPTED DATE: FEBRUARY 2, 1998 PAGE 1 OF 9 NORTH DAKOTA COUNTY OF CASS ORDINANCE #1998-2 Be it ordained and
Report Relating to Incidents of Flooding within the Dollar Catchment
 Joint Position Statement Report Relating to Incidents of Flooding within the Dollar Catchment October 2012 Eric McQuarrie, Scottish Water Stuart Cullen, Clackmannanshire Council TABLE OF CONTENTS 1. INTRODUCTION...
City of Valdosta Land Development Regulations. Table of Contents
 TITLE 1 ADMINISTRATION Chapter 102 General Provisions 102-1 Title 102-2 Purpose 102-3 Authority 102-4 Jurisdiction 102-5 Application of Ordinance 102-6 Relationship to Existing Ordinances 102-7 Powers
Melbourne Water. Principles for Provision of Waterway and Drainage Services for Urban Growth
 Melbourne Water Principles for Provision of Waterway and Drainage Services for Urban Growth Contents About Melbourne Water 3 Principles for Creating Development Services Schemes 4 Preface 4 (Original)
APPENDIX 9 INFRASTRUCTURE SERVICING REPORT
 APPENDIX 9 INFRASTRUCTURE SERVICING REPORT Lot 50 Cockram Street, Mundijong Infrastructure Servicing Report Peet Ltd August 2012 LOT 50 COCKRAM STREET, MUNDIJONG-INFRASTRUCTURE SERVICING REPORT Project
Type of Sewer Systems. Solomon Seyoum
 Type of Sewer Systems Solomon Seyoum 0 Learning objectives Upon completion of this lecture, the participants will be able to differentiate between types of sewer systems and discuss different aspects of
Sample DEQ Plan Submitter s Checklist for Stormwater Management Plans
 APPENDIX IV Version: February 2, 2015 Sample DEQ Plan Submitter s Checklist for Stormwater Management Plans Please fill in all blanks and please reference the plan sheets/pages where the information may
INTEGRATED WATER FOR CASEY CLYDE
 INTEGRATED WATER FOR CASEY CLYDE James Westcott 1, Andrew Chapman 1, Jamie Ewert 2, Brigid Adams 3 1. South East Water, Melbourne, Vic, Australia 2. Melbourne Water, Melbourne, Vic, Australia 3. Department
Emergency Spillways (Sediment basins)
") Emergency Spillways (Sediment basins) DRAINAGE CONTROL TECHNIQUE Low Gradient Velocity Control Short-Term Steep Gradient Channel Lining Medium-Long Term Outlet Control Soil Treatment Permanent [1] [1]
Emergency Spillways (Sediment basins) DRAINAGE CONTROL TECHNIQUE Low Gradient Velocity Control Short-Term Steep Gradient Channel Lining Medium-Long Term Outlet Control Soil Treatment Permanent [1] [1]
Guideline: Works that interfere with water in a watercourse watercourse diversions. September 2014
 Guideline: Works that interfere with water in a watercourse watercourse diversions September 2014 This publication has been compiled by the Department of Natural Resources and Mines. State of Queensland,
Recommendations for future developments
 C Recommendations for future developments C.1 Reducing flood risk through site layout and design C.1.1 C.1.2 Flood risk should be considered at an early stage in deciding the layout and design of a site
3.4 DRAINAGE PLAN. 3.4.1 Characteristics of Existing Drainages. 3.4.2 Master Drainage System. Section 3: Development Plan BUTTERFIELD SPECIFIC PLAN
 3.4 DRAINAGE PLAN This section describes the existing onsite drainage characteristics and improvements proposed within this Specific Plan. Following this description, drainage plan development standards
CITY OF VAUGHAN SCHEDULE O LOT GRADING DESIGN FOR RESIDENTIAL DEVELOPMENT
 Page 1 CITY OF VAUGHAN SCHEDULE O LOT GRADING DESIGN FOR RESIDENTIAL DEVELOPMENT CIVIC CENTRE 2141 MAJOR MACKENZIE DRIVE MAPLE ONTARIO L6A 1T1 905-832-2281 Page 2 SECTION 1 - GENERAL OBJECTIVES To provide
APPENDIX 1 Floodplain Management Strategies & Guidelines
 APPENDIX 1 Floodplain Management Strategies & Guidelines A. Port Phillip Flood Management Plan (2012) B. Draft Flood Management Strategy Port Phillip and Westernport (2015) C. Revised Draft Victorian Floodplain
APPENDIX B Understanding the FEMA Benefit-Cost Analysis Process
 ENGINEERING PRINCIPLES AND PRACTICES APPENDIX B Understanding the FEMA Benefit-Cost Analysis Process The Stafford Act authorizes the President to establish a program to provide technical and financial
San Diego Integrated Regional Water Management Implementation Grant Proposal Economic Analysis Flood Damage Reduction Costs and Benefits
 Attachment 9 San Diego Integrated Regional Water Management Economic Analysis Flood Damage Reduction Costs and Benefits Attachment 9 consists of the following items: Flood Damage Reduction Costs and Benefits.
Newbiggin House Farm,
 Newbiggin House Farm, Near Waberthwaite Flood Investigation Report 32 Flood Event 30/8/2012 Cumbria County Council Version Undertaken by Reviewed by Approved by Date Preliminary Colin Parkes Anthony Lane
UPDATED FUNCTIONAL SERVICING and STORMWATER MANAGEMENT REPORT
 TRAFALGAR ENGINEERING LTD. #1-481 Morden Road Oakville Ontario L6K 3W6 UPDATED FUNCTIONAL SERVICING and STORMWATER MANAGEMENT REPORT Fernbrook Homes (Bronte 15) Limited 3059/3047 Lakeshore Road West TOWN
Managing stormwater flooding risks in Melbourne
 V I C T O R I A Auditor General Victoria Managing stormwater flooding risks in Melbourne Ordered to be printed by Authority. Government Printer for the State of Victoria PP No. 144, Session 2003-05 ISBN
PREVENTION. City of Orem FLOOD DAMAGE PREVENTION 10-1-1
 City of Orem FLOOD DAMAGE PREVENTION 10-1-1 CHAPTER 10. Article 10-1. Article 10-2. Article 10-3. Article 10-4. Article 10-5. FLOOD DAMAGE PREVENTION Purposes Definitions General Provisions Administration
Bolton s Flood Risk Management Strategy
 Bolton s Flood Risk Management Strategy www.bolton.gov.uk Public Summary Bolton s Flood Risk Management Strategy Public Summary Introduction Over 5.5 million properties in England and Wales are at risk
A. Flood Management in Nevada
 Nevada Division of Water Planning A. Flood Management in Nevada Introduction Flooding has been a concern for Nevada communities since the first settlers moved to the territory in the mid-1800 s. Fourteen
CHAPTER 17: STORM SEWER STANDARDS. 17.00 Introduction. 17.01 Administration. 17.02 Standards 17.1
 CHAPTER 17: STORM SEWER STANDARDS 17.00 Introduction 17.01 Administration 17.02 Standards 17.1 17.00 INTRODUCTION The purpose of this chapter is to provide guidance for the design and construction of storm
Planning for sea level rise. Assessing development in areas prone to tidal inundation from sea level rise in the Port Phillip and Westernport Region
 Planning for sea level rise Assessing development in areas prone to tidal inundation from sea level rise in the Port Phillip and Westernport Region Table of contents Introduction 1 New flood levels for
5.0 OVERVIEW OF FLOOD DAMAGE REDUCTION MEASURES
 5.0 OVERVIEW OF FLOOD DAMAGE REDUCTION MEASURES Flood damage reduction consists of two basic techniques structural and non-structural. Structural methods modify the flood and take the flood away from people
London Borough of Waltham Forest LOCAL FLOOD RISK MANAGEMENT STRATEGY. Summary Document
 LOCAL FLOOD RISK MANAGEMENT STRATEGY Summary Document October 2013 Local Flood Risk Management Strategy Summary 1 Introduction 2 Partner responsibilities 3 What do we know about flooding in the borough?
APPENDIX I DEVELOPMENT PROCESS CHECKLIST
 APPENDIX I DEVELOPMENT PROCESS CHECKLIST Bureau of Indian Affairs, Western Regional Office 400 N. 5 th St., Two AZ Center/Phoenix, AZ 85004/Telephone/website PRE-DEVELOPMENT PROCESS CHECKLIST This checklist
Appendix C Asset Risk Model Data
 Appendix C Asset Risk Model Data S:\ADV JOBS\48305 ENV WAIKATO\027 THAMES COAST FLOOD RISK\6000 - DELIVERABLES\FINAL REPORT\APPENDIX C.DOC\16-JUL-03 Contents Appendix C Asset Risk Model Data Asset Risk
To prevent increased stormwater runoff entering Council s drainage system and causing overloading of the system that in turn might cause flooding.
 Background & Issues To provide guidelines and requirements for Developers, the Community and the Shire s Planning and Sustainability officers for connection to the Shire s Stormwater Drainage Disposal
Engineering Specifications February, 2004 Schedule H to Bylaw 7452, Subdivision Bylaw Page 18
 Schedule H to Bylaw 7452, Subdivision Bylaw Page 18 3.4 Sanitary Sewers 3.4.1 Materials 3.4.1.1 The class and type of pipe and fittings, together with required class of bedding and trench widths, shall
In addition to the terms defined in this By-law, the following terms shall have the corresponding meanings for the purposes of this Section:
 Click here to access definitions SECTION 12 FLOODPLAIN LANDS 12.1 INTERPRETATION In addition to the terms defined in this By-law, the following terms shall have the corresponding meanings for the purposes
1.7.0 Floodplain Modification Criteria
 1.7.0 Floodplain Modification Criteria 1.7.1 Introduction These guidelines set out standards for evaluating and processing proposed modifications of the 100- year floodplain with the following objectives:
Land Disturbance, Erosion Control and Stormwater Management Checklist. Walworth County Land Conservation Department
 Land Disturbance, Erosion Control and Stormwater Management Checklist Walworth County Land Conservation Department The following checklist is designed to assist the applicant in complying with the Walworth
Essex County Council Flood Investigation Report
 Essex County Council Stock City of Chelmsford Rev Date Details Author Checked and Approved By 01 February 2015 Draft report for stakeholder consultation Ed Clarke Flood Investigation Engineer Lucy Shepherd
FLOOD RISK RECENT TRENDS AND POLICY RESPONSES
 FLOOD RISK RECENT TRENDS AND POLICY RESPONSES DEVELOPING WESTMINSTER S LOCAL PLAN Booklet No. 2 LDF Consultation - CMP Revision November 2013 INTRODUCTION CLLR ROBERT DAVIS Westminster is at risk of flooding
FLOOD PROTECTION BENEFITS
 IV. (340 points) Flood Protection Benefits A. Existing and potential urban development in the floodplain (50) 1. Describe the existing and potential urban development at the site and the nature of the
MIKE 21 FLOW MODEL HINTS AND RECOMMENDATIONS IN APPLICATIONS WITH SIGNIFICANT FLOODING AND DRYING
 1 MIKE 21 FLOW MODEL HINTS AND RECOMMENDATIONS IN APPLICATIONS WITH SIGNIFICANT FLOODING AND DRYING This note is intended as a general guideline to setting up a standard MIKE 21 model for applications
Standard terms and conditions
 Standard terms and conditions INTRODUCTION For the provision of a water service (Water Supply, Wastewater and Drainage) Under Section 73(2)(a) of the Water Services Act 2012, landowners may be entitled
ACO Water Management: Civils + Infrastructure
 ACO Water Management: Civils + Infrastructure Technical data Introduction to The unit provides an aesthetically pleasing solution when linking proprietary conveyance drainage systems to vegetated infiltration
Victoria Planning Provisions
 August 2000 APPLYING FOR A PLANNING PERMIT UNDER THE FLOOD PROVISIONS A guide for councils, referral authorities and applicants This VPP Practice Note provides guidance about making an application for
REPORTS SUSTAINABILITY AND ENVIRONMENT 11 MAY 2015 ORDINARY COUNCIL MEETING OF COUNCIL
 REPORT NO: 0.0 REPORT TITLE: SOURCE: DIVISION: FILE NO: POLICY: - STRATEGIC OBJECTIVE: Planning Scheme Amendment C202: 140-204 Western Avenue, Westmeadows Gareth Edgley, Senior Strategic Planner City Sustainability
House Code. House Code
 1 Application This Code will apply in assessing material change of use and/or building work for a house. 2 Using this Code In using this Code reference should also be made to Section 1.1 How to use the
Environment Agency 2014 All rights reserved. This document may be reproduced with prior permission of the Environment Agency.
 Flood and coastal erosion risk management Long-term investment scenarios (LTIS) 2014 We are the Environment Agency. We protect and improve the environment and make it a better place for people and wildlife.
Acknowledgments. Feedback and enquiries
 Acknowledgments Melbourne Water prepared the Guidelines with the assistance of a specially appointed Reference Committee of experienced people who provided valuable comment and advice on the contents of
Building over or close to a public sewer
 Building over or close to a public sewer thameswater.co.uk/developerservices thameswater.co.uk/developerservices 1 Questions and answers Did you know Thames Water is legally responsible for more than 100,000
PUBLIC WORKS DESIGN, SPECIFICATIONS & PROCEDURES MANUAL LINEAR INFRASTRUCTURE
 REGION OF PEEL PUBLIC WORKS DESIGN, SPECIFICATIONS & PROCEDURES MANUAL LINEAR INFRASTRUCTURE Storm Sewer Design Criteria REVISED July 2009 PUBLIC WORKS STORM SEWER DESIGN CRITERIA TABLE OF CONTENTS 1.0
rescue and relief efforts in the aftermath of flooding, (iii) repair of flood damaged public facilities and utilities, and
 repair of flood damaged public facilities and utilities, and") 1. Purpose (1) It is the purpose of this Ordinance to protect human life, health, and property from flood conditions, to preserve the ability of floodplains to carry and discharge a base flood, and to
1. Purpose (1) It is the purpose of this Ordinance to protect human life, health, and property from flood conditions, to preserve the ability of floodplains to carry and discharge a base flood, and to
Components of a Basement Flooding Protection Plan: Sewer System Improvements. November 2000
 Components of a Basement Flooding Protection Plan: Sewer System Improvements November 2000 Components of a Basement Flooding Protection Plan: Sewer System Improvements November 2000 SEMCOG 2000 Prepared
Project Evaluation Guidelines
 Project Evaluation Guidelines Queensland Treasury February 1997 For further information, please contact: Budget Division Queensland Treasury Executive Building 100 George Street Brisbane Qld 4000 or telephone
Flood Risk Management
 Flood Risk Management Value of Flood Risk Management Every year floods sweep through communities across the United States taking lives, destroying property, shutting down businesses, harming the environment
Flood Risk Management
 Flood Risk Management Value of Flood Risk Management Value to Individuals and Communities Every year floods sweep through communities across the United States taking lives, destroying property, shutting
Attachment 1. Drainage. Service-Driven Asset Management Plan 2015. Drainage Service-Driven Asset Management Plan Page 0
 Attachment 1 Drainage Service-Driven Asset Management Plan 2015 Drainage Service-Driven Asset Management Plan Page 0 Drainage Asset Management Plan Contents Executive Summary... 4 1.0 Introduction... 6
Flooding Hazards, Prediction & Human Intervention
 Page 1 of 10 EENS 3050 Tulane University Natural Disasters Prof. Stephen A. Nelson Flooding Hazards, Prediction & Human Intervention This page last updated on 19-Oct-2015 Hazards Associated with Flooding
Homes and Environment Scrutiny Committee. (Environment & Transport)
") REPORT TO: REPORT NO: Homes and Environment Scrutiny Committee HHPPE/89/15S DATE: 9 September 2015 LEAD MEMBER: Councillor David A Bithell (Environment & Transport) CONTACT OFFICER: Neil Taunt (Tel: 729734)
REPORT TO: REPORT NO: Homes and Environment Scrutiny Committee HHPPE/89/15S DATE: 9 September 2015 LEAD MEMBER: Councillor David A Bithell (Environment & Transport) CONTACT OFFICER: Neil Taunt (Tel: 729734)
Interactive comment on A simple 2-D inundation model for incorporating flood damage in urban drainage planning by A. Pathirana et al.
 Hydrol. Earth Syst. Sci. Discuss., 5, C2756 C2764, 2010 www.hydrol-earth-syst-sci-discuss.net/5/c2756/2010/ Author(s) 2010. This work is distributed under the Creative Commons Attribute 3.0 License. Hydrology
Flood Risk Assessment and Drainage Impact Assessment: Planning Guidance for Developers
 Flood Risk Assessment and Drainage Impact Assessment: Planning Guidance for Developers Development and Regeneration Services Glasgow City Council 229 George Street Glasgow G1 1QU May 2011 1. Introduction...-
8.1.3 General Design Guidelines. The following guidelines shall be used when designing inlets along a street section:
 . Introduction Presented in this chapter are the criteria and methodology for design and evaluation of storm sewer inlets located in Town of Castle Rock. The review of all planning submittals will be based
THE APPRAISAL OF REAL ESTATE 3 RD CANADIAN EDITION BUSI 330
 THE APPRAISAL OF REAL ESTATE 3 RD CANADIAN EDITION BUSI 330 REVIEW NOTES by CHUCK DUNN CHAPTER 10 Copyright 2010 by the Real Estate Division and Chuck Dunn. All rights reserved ARE 3 rd EDITION REVIEW
Advice can also be sought from specific specialist officers in the Council.
 Canterbury City Council Validation of Planning Applications Guidance note 2010: Introduction Up to date advice on the validation of planning applications is contained in the CLG Guidance on information
London Borough of Merton Local Flood Risk Management Strategy
 Local Flood Risk Management Strategy Summary 2014-2020 Introduction In response to the severe flooding across large parts of England and Wales in summer 2007, the Government has recently enacted the Flood
Vital Earth Composting Facility Flood Risk and Drainage Statement
 Vital Earth Flood Risk and Drainage Statement Final December 2011 Prepared for Vital Earth Ltd Revision Schedule Flood Risk and Drainage Statement December 2011 Rev Date Details Prepared by Reviewed by
Climate Change and Infrastructure Planning Ahead
 Climate Change and Infrastructure Planning Ahead Climate Change and Infrastructure Planning Ahead Infrastructure the physical facilities that support our society, such as buildings, roads, railways, ports
CLACKAMAS COUNTY ZONING AND DEVELOPMENT ORDINANCE
 1008 STORM DRAINAGE (3/24/05) 1008.01 PURPOSE To minimize the amount of stormwater runoff resulting from development utilizing nonstructural controls where possible, maintain and improve water quality,
Chapter 3 CULVERTS. Description. Importance to Maintenance & Water Quality. Culvert Profile
 Chapter 3 CULVERTS Description A culvert is a closed conduit used to convey water from one area to another, usually from one side of a road to the other side. Importance to Maintenance & Water Quality
How To Amend A Stormwater Ordinance
 Regulatory Alternatives to Address Stormwater Management and Flooding in the Marlboro Street Study Area Alternative 1: Amend Existing Local Regulations This proposed alternative provides an incremental
SECTION 6A STORM DRAIN DESIGN Mar. 2002 S E C T I O N 6A STORM DRAIN - DESIGN
 S E C T I O N 6A STORM DRAIN - DESIGN 6A.l Scope 6A.2 Storm Water Quantity 6A.3 Storm Drain Hydraulics 6A.4 Depths 6A.5 Locations 6A.6 Curved Storm Drains 6A.7 Manholes 6A.8 Catch basins 6A.9 Storm Drain
Standard Operating Procedures for Flood Preparation and Response
 Standard Operating Procedures for Flood Preparation and Response General Discussion Hurricanes, tropical storms and intense thunderstorms support a conclusion that more severe flooding conditions than
ASSET MANAGEMENT STRATEGY
 ASSET MANAGEMENT STRATEGY Version 3 - Final Adopted 19 February 2013 NAMS.PLUS Burnie City Council Asset Strategy Document Control Document Control NAMS.PLUS Asset www.ipwea.org.au/namsplus Document ID:
Floor level for a house on a flood-prone site
 Determination No 99/005 Floor level for a house on a flood-prone site 1 THE MATTER TO BE DETERMINED 1.1 The matter before the Authority is a dispute as to whether building consent should be granted for
5. Environmental Analysis
 5.11 The potential for adverse impacts on utilities and service systems was evaluated based on information concerning current service levels and the ability of the service providers to accommodate the
Product 4 (Detailed Flood Risk) for: Sam Murray (Amey) Site: Land at Kingsnorth Reference: KSL151125 KR79 Date: 30 th November 2015.
 for: Sam Murray (Amey) Site: Land at Kingsnorth Reference: KSL151125 KR79 Date: 30 th November 2015.") Product 4 (Detailed Flood Risk) for: Sam Murray (Amey) Site: Land at Kingsnorth Reference: KSL151125 KR79 Date: 30 th November 2015 Contents Flood Map Confirmation Flood Map Extract Model Output Data Data
Product 4 (Detailed Flood Risk) for: Sam Murray (Amey) Site: Land at Kingsnorth Reference: KSL151125 KR79 Date: 30 th November 2015 Contents Flood Map Confirmation Flood Map Extract Model Output Data Data
Management of flooding downstream of dams
 Management of flooding downstream of dams Attachment to Victoria State Flood Emergency Plan Version 1.0 (6 February 2013) This plan is produced by the Victoria State Emergency Service and Department of
Floodplain Development Land Use Review
 COMMUNITY DEVELOPMENT DEPARTMENT Planning Division P.O. Box 490 333 Broadalbin Street SW Albany, OR 97321 Phone 541-917-7550 Fax 541-791-0150 www.cityofalbany.net Floodplain Development Land Use Review
Micromanagement of Stormwater in a Combined Sewer Community for Wet Weather Control The Skokie Experience
 Micromanagement of Stormwater in a Combined Sewer Community for Wet Weather Control The Skokie Experience Robert W. Carr 1 * and Stuart G. Walesh 2 1 Water Resources Modeling, LLC, 4144 S. Lipton Ave,