A Citizen s Guide to Washington State. K-12 Finance
|
|
|
- Milton Casey
- 8 years ago
- Views:
Transcription
1 A Citizen s Guide to Washington State K-12 Finance 2014
2 Table of Contents Subject... Page Introduction... 1 How do recent basic-education bills affect K-12 funding?... 2 How many students attend K-12 schools in the state?... 3 How are public schools in Washington organized?... 3 What does the Washington State Constitution say about K-12 public school funding?... 3 How has this been interpreted by the state courts?... 4 How has the Legislature implemented the court rulings?... 5 What is the levy lid act and why was it passed? How much of the state general fund is spent on K-12 public schools? How has the amount of the general fund support of K-12 public schools changed since 2001? What are other sources of funding used by school districts? How are these funds spent by school districts? How much is spent per student? How has total per-student spending changed since 1994? How has state per-student funding changed since 1994? How is the salary level of teachers determined? What is the average salary level of teachers? How is the salary level of administrators and classified staff determined? How does Washington compare to other states? How does the state lottery support public schools? What is the role of the federal government in public elementary and secondary education? What are other types of dedicated funding utilized by school districts? How is school construction funded in the state? What is Initiative 732? What was Initiative 728? Appendix A: Maximum Levy Authority Appendix B: K-12 Allocation Schedule for Certificated Instructional Staff Appendix C: Certificated Instructional Staff Base Salaries... 40
3 Introduction A 2014 Citizen s Guide to K-12 Finance is offered to provide a clear and simple overview of K-12 financial issues. It provides general information on K-12 finance by answering frequently asked questions. For more in-depth information of K-12 finance, see Organization and Financing of Washington Public Schools published by the Office of Superintendent of Public Instruction. It is available at the following: The information presented in this document is based on statewide data. For information on a specific school district, inquire with that school district. Detailed K-12 fiscal data, on both statewide and district-specific levels, are also reported on the Washington State fiscal transparency website at: A 2014 Citizen s Guide to K-12 Finance was prepared by staff of the Senate Ways and Means Committee and the Senate Early Learning & K-12 Committee (within Senate Committee Services) with the assistance of staff of the Legislative Evaluation and Accountability Program (LEAP) Committee. Questions regarding the guide or requests for additional copies should be addressed to: Senate Ways and Means Committee 311 John A. Cherberg Olympia, Washington Telephone: Fax:
4 How do recent basic-education bills affect K-12 funding? In the biennium, two major pieces of legislation were enacted to redefine the program of basic education and restructure K-12 funding formulas. The first was ESHB 2261 (Chapter 548, Laws of 2009) which added programs to the definition of basic education including the program for highly capable students and phasing in all-day kindergarten. It increased the number of instructional hours, increased the minimum number of credits for high school graduation, and changed the system for funding student transportation. The bill also created the framework for a new K-12 funding allocation formula based on prototypical schools. Changes took effect September 1, 2011 and most enhancements are to be phased in by 2018 on a schedule set by the Legislature. The second bill, SHB 2776 (Chapter 236, Laws of 2010), enacted in statute the funding formulas for the new prototypical schools format at levels that represented what the state was spending on basic education at the time. It set targets for class-size reduction in the lower grades and established a timeline for phasing in certain enhancements to the program of basic education and the new funding levels. The new funding model is intended to provide greater understanding about how state funds for K-12 are allocated to school districts, and to improve accountability. The bills require school-district reporting of actual staffing and expenditures, compared to the funding provided in the prototypical model. The comparisons are to be available on a public website of the Office of the Superintendent of Public Instruction. The 2014 Citizen's Guide to K-12 Finance uses the descriptions of the system that took effect September 1, 2011, along with the schedule of when each future funding enhancement is to take place. 2
5 How many students attend K-12 schools in the state? In the school year, over 1,004,458 students were enrolled at 2,281 public schools across the state. In addition, it is estimated that about 72,577 students attended private schools and 16,582 students were homeschooled during the school year. How are public schools in Washington organized? Washington is largely considered a local control state. This means that local school districts are generally responsible for delivering the actual instructional programs for the state s elementary and secondary school-age population. Each district is governed by a locally-elected school board whose members serve staggered four-year terms. Each school board hires a Superintendent who oversees the day-to-day operation of the school district. Currently, there are a total of 295 school districts. The public school system in the state of Washington involves various entities at both the state and local levels, including the Legislature, the Governor, the State Board of Education, the Office of the Superintendent of Public Instruction, the federal Department of Education, the State Auditor s Office, the Professional Educator Standards Board, Educational Service Districts, and local school districts. Each of these entities plays a role in establishing educational policies, implementing these policies, or providing administrative and financial oversight of the public school system. What does the Washington State Constitution say about K-12 public school funding? It is the paramount duty of the state to make ample provision for the education of all children residing within its borders, without distinction or preference on account of race, color, caste or sex. Washington Constitution, article IX, section I This constitutional provision is unique to Washington. While other states have constitutional provisions related to education, no other state makes K-12 education the paramount duty of the state. 3
6 How has this been interpreted in the state courts? Beginning with the 1978 decision in the Seattle School District No. 1 v. State, 90 Wn.2d 476, 585 P.2d 71, and most recently in 2012 in McCleary v State, 173 Wn.2d 477, 269 P.3rd 227, the Washington Supreme Court has interpreted Article IX, section 1 of the state constitution to mean that the state must define a program of basic education, within the guidelines of the Court, distinguished from all other educational programs or services, and sufficiently and amply fund it from a regular and dependable source that cannot be dependent on local tax levies. The Court has found that this paramount duty is superior in rank and above all others. Neither fiscal crisis nor financial burden changes the Legislature s constitutional duty. The state has no duty to fund programs outside the definition of basic education. School districts may use local levies to fund enrichment programs and programs outside the legislative definition of basic education. However, the use of local levies cannot reduce the state s obligation to fund basic education. The Court did not require the state to provide a total education or the offerings of all knowledge, programs, subjects or services; however, the Court did find that the duty goes beyond mere reading, writing, and arithmetic. The Court noted that a basic education also embraces broad educational opportunities needed in the contemporary setting to equip children for their role as citizens and as potential competitors in today s market as well as in the marketplace of ideas. Additionally, the Court found that the education required by the constitution does not reflect a right to a guaranteed educational outcome. The Court acknowledged that the Legislature has an obligation to review the definition of a basic education program as the needs of students and the demands of society evolve. But any reduction from the basic education program must be accompanied by an educational policy rational and not for reasons unrelated to educational policy. When the state courts originally addressed these issues, there was no state definition of basic education, so the courts considered three definitions, and the cost of each, to determine whether the state provided sufficient funds to implement a basic education program. The courts noted that, in terms of quantitative inputs, staffing ratios (the ratio of staff to students) and staff salaries are the most significant factors in determining the cost of education. Most recently the Supreme Court has found that the system of education defined by the Legislature to comply with the constitution included the Basic Education Act of 1977 (BEA); the special education program for students with disabilities; the Learning Assistance Program; the Transitional Bilingual Education program; and portions of the student transportation program. 4
7 In January 2012 in the McCleary case, the Supreme Court held that the state has not complied with its Article IX, section 1 constitutional duty to make ample provision for the basic education of all children in Washington. The court did acknowledge the recent enactment of promising reforms under Chapter 548, Laws of 2009, and acknowledged the current progress toward implementing those reforms. The Court also noted that, if fully funded, the reform package will remedy deficiencies in the K-12 funding system. The Court retained jurisdiction to help "facilitate progress" in the State's plan to fully implement the reforms by 2018 and later ordered the Legislature to file reports after each operating budget is enacted summarizing the legislative actions taken towards compliance with the state constitutional duty. The Court's review of the report will focus on whether the actions taken by the Legislature show "real and measurable" progress towards achieving full compliance by After its review, the Court will determine whether to request additional information, direct further fact-finding or take any other steps. The Court provided that while it is not realistic to measure the steps taken in each legislative session between 2012 and 2018 against full constitutional compliance, the State must demonstrate "steady progress" according to the schedule anticipated by the enactment of the ESHB 2261 (Chapter 548, Laws of 2009) reforms. The Legislature has filed two reports with the Court, which can be found at: In a December 2012 order, the Court responded to the first legislative report by finding that the first report fell short and that the Legislature needed to provide a detailed phase-in plan addressing all areas identified in ESHB 2261 and then follow it. In January 2014, the Court acknowledged the, "meaningful steps" taken by the 2013 Legislature, but the Legislature did not provide a plan for how they will measure their success. The Court ordered the Legislature to respond by April, with, "a complete plan for fully implementing its program of basic education for each school year between now and the school year." How has the Legislature implemented court rulings? In order to carry out its constitutional responsibility, the Legislature passed the Basic Education Act of 1977 (BEA), which defined a basic education by establishing goals, minimum program hours, teacher contact hours, and a mix of course offerings for a school district to provide. Currently, at least some portion of seven programs (general apportionment; the special education program for students with disabilities; some pupil transportation; the Learning Assistance Program for remediation assistance; the Transitional Bilingual Education program; the highly capable program; and educational programs in juvenile detention centers and state institutions) fall within the Legislature s definition of basic education. 5
8 The Legislature is also proceeding with implementing the reform package under Chapter 548, Laws of 2009 by putting into place the new funding formulas and phasing in funding enhancements in specified programs. General Apportionment - Foundational state funding to school districts is provided through the General Apportionment formula and funds basic education as well as a number of non-basic education adjustments. The amount received by each school district varies based on certain characteristics such as teacher experience and education level, and historical salary levels. On average, the statewide allocation through the General Apportionment formula is estimated at approximately $5,552 per student in the school year. General Apportionment formula: Under the new funding structure, which was effective September 1, 2011, the general apportionment formula follows the prototypical school model. Prototypes illustrate a level of resources to operate a school of a particular size with particular types and grade levels of students. Allocations to school districts are based on actual full-time equivalent (FTE) student enrollment in each grade in the district, adjusted for small schools and reflecting other factors in the state's biennial budget. Under SHB 2776 (Chapter 236, Laws of 2010), the Legislature designed a funding formula that allocates funding in three primary groups: schools, district-wide support, and central administration. The prototypical model applies staff ratios and an assumed class size for each school type: elementary, middle, and high school. Each prototype has a theoretical number of students and designated levels of staffing. The funding to each district is scaled according to actual enrollment in each of the grade ranges. For example, an elementary school is assumed to have 400 students in the prototypical model. If a district has 800 elementary-grade students, it will receive funding for double the numbers of staff positions shown in Table 2, below. The class sizes represent the levels of funding associated with assumed ratios of students to teachers, given certain assumptions about the length of a teacher's day and the amount of time reserved for planning. Funding is for allocation purposes only (except for the categorical, or dedicated, programs) and it is up to the school district to budget the funds at the local level. Beginning with the school year, the Office of Superintendent of Public Instruction (OSPI) began reporting how school districts are deploying those same state resources through their allocation of staff and other resources to school buildings, so that citizens are able to compare the state assumptions to district allocation decisions for each local school building. The information, by school building, is available on an internet portal hosted by the Office of the Superintendent of Public Instruction at: 6
9 One of four 1 funding enhancements included in SHB 2776 (Chapter 236, Laws of 2010) requires average class size for grades K-3 to be reduced beginning in the biennium and beginning with schools with the highest percent of low-income students, until the class size in the formula beginning in the school year is 17.0 students per classroom teacher. The budget includes funding to reduce Kindergarten and First grade class size from full time equivalent students to in the school year and in school year for schools with poverty rates higher than 50 percent at a cost of $53.7 million and $66.1 million respectively. Funding in for these reduced class sizes will be contingent upon, and proportional to, the school's documented average class size. State funded class size reductions for second and third grade in high poverty schools is maintained at full time equivalent students. Grade Table 1: School Year Class Sizes Class Size Grades K-1 (High poverty schools) Grades 2-3 (High poverty schools) Grades K-3 (Non-poverty schools) Grade Grades Grades Grades Career & Tech. Ed (CTE) CTE Skills Centers Lab Science As above Advanced Placement As above International Baccalaureate As above Length of teacher day is assumed to be 5.6 hours in elementary school and 6.0 hours in middle and high school. Planning time is assumed to be 45 minutes per day in elementary school and 60 minutes in high school. The operating budget includes funding enhancements for guidance counselors in middle and high school and parent involvement 1 Other required enhancements include: phased in funding for full-day kindergarten until full statewide implementation is achieved in the school year; annual increases for materials, supplies, and operating costs (MSOC) until a specified level is reached in the school year; and enhanced funding for pupil transportation. 7
10 coordinators in elementary schools at a cost of $13.6 million and $13.8 million for the and school years, respectively. Table 2: Staffing Elementary School Middle School High School Prototypical school size: Number of students Staff per-school: Principals/administrators Librarian/media specialist School nurses Social workers Psychologists Guidance counselors Instructional aides Office support & non-instructional aides Custodians Classified staff for student & staff safety Parent involvement coordinators District-wide support will be funded, under the prototypical model, in addition to staffing levels presumed to be needed for individual school buildings, since these services need to be provided across the district. Funding will be based on overall student enrollment levels. 8 Table 3: District-wide Support Number of students 1,000 Classified Staff Per 1,000 Students Technology Facilities, Maintenance, Grounds Warehouse, Laborers, Mechanics Under the new formula, administration costs directly associated with prototypical schools are included in those staffing levels for example, the number of principals and level of office support needed for each elementary school, middle school, and high school. Central administration, however, will be funded as an additional 5.3 percent of other staffing units generated by the formula. These general staffing units on which the 5.3 percent is calculated include K-12 teachers, school-level staffing, and district-wide support; it does not include additional staffing for skills centers, future enhancements for poverty, specialized classes, or categorical programs such as highly capable, special education, or the learning assistance program.
11 For Career and Technical Education (CTE) and skills center programs, in addition to the class sizes designated in Table 1 on page 7, SHB 2776 (Chapter 236, Laws of 2010) states that staffing allocations for administrative and other school-level certificated staff will be specified in the omnibus appropriations act (budget bill). Finally, the new prototypical funding formula for General Apportionment includes an allocation for Materials, Supplies, and Operating Costs (MSOC), formerly known as non-employee related costs. Initially established based on district information from the school year, the formula will provide the following funding, which will be adjusted annually for inflation, once the school year levels are reached. The budget includes funding increases to $ for school year and $ for school year at a cost of $190.1 million and $229.8 million for the respective school years. Table 4: SY Materials, Supplies, and Operating Costs (MSOC) MSOC Component Per Student Allocation SY Per-Student SY (at 2008 Values) Technology $77.46 $ Utilities and insurance Curriculum and textbooks Other supplies and library materials Instructional professional development for certified and classified staff Facilities' maintenance Security and central office Total $ $1, Special Education - The state funding formula for Special Education, which was implemented in 1995 and does not change under the new prototypical funding formula, is based on the additional excess costs of educating students receiving special education services. The amount is provided for three categories of students. For birth through five-year olds, the special education allocation is 115 percent of the district s average per-student General Apportionment allocation. For five to 21-year olds, the state Special Education allocation is 93 percent of the district s average per-student General Apportionment allocation. For birth through two-year olds, districts must provide or contract for early-intervention services for eligible children with disabilities, and school districts are required to ensure an appropriate educational opportunity for children ages three though 21 with disabilities. 9
12 In addition to the per-student Special Education allocation, the special education funding structure includes a safety net for districts that can show extraordinary special education program costs beyond state and federal resources. For the school year, the statewide average allocation per birth-to-five-year old special education student is estimated at $6,266 and the statewide average allocation per five to 21-year old special education student is estimated at $5,048 per year. For five to 21-year olds, this amount is in addition to the General Apportionment allocations described above. Pupil Transportation - The new transportation formula was effective September 1, 2011, and phases in funding the transportation of students "to and from school" as part basic education. The new formula requires the funding to be calculated using a regression analysis of major cost factors that are expected to increase (or decrease) the prior year's pupil-transportation costs, including the count of basic and special-student ridership, district land area (geography), roadway miles, the average distance to school, and other statistically-significant coefficients. Funding in the budget completes the phase-in of the new transportation formula. Funding in school year provides forty percent or $42.8 million of the enhancement needed for full funding. Funding in school year provides 100 percent or $109.7 million to complete the phase-in of the new transportation formula. In addition, the state provides funding for school bus replacement costs using a depreciation schedule. Annual payments are made to districts from the year a bus is purchased until it reaches the end of its scheduled lifecycle. State allocations are deposited into the district's Transportation Vehicle Fund to be used only for the purchase of new buses or for major repairs. Learning Assistance Program - The Learning Assistance Program (LAP) provides remediation assistance to students scoring below grade level in reading, math and language arts. Districts receive LAP allocations based on the number of students in poverty, as measured by eligibility for free or reduced-price lunch. As with other categorical programs, the new funding formula provides a designated number of hours of instruction per week. (A "categorical" program is one in which funds may be used for only the dedicated program and may not be re-allocated for use elsewhere in the school district.) The new law provides hours of LAP instruction per-week, assuming class sizes of 15 students per certificated instructional staff. The formula translates to additional funding of approximately $466 per eligible student in the school year. Transitional Bilingual Education - The statewide Transitional Bilingual Instruction Program (TBIP) was created by the Legislature in State 10
13 TBIP funding supports school staff and training intended to teach English as a second language to students in the public K 12 school system. As with other categorical programs, the funding formula provides a designated number of hours of instruction. Assuming class sizes of 15 students per certificated instructional staff, the formula provides hours of bilingual instruction per week. The formula translates to additional funding of approximately $930 per eligible student in the school year. New funding for transitional support for up to two years after a student has exited the TBIP is provided to assist students who have met the proficiency standards. In school year , 3.0 hours of additional instruction are provided for students who exited the program the immediate prior year at a cost of $584 per eligible student. Beginning in school year , 3.0 hours of additional instruction are provided for students who exited the program in the immediate prior two years. Institutional Education Programs - The state funds a 220-day educational program for children in certain institutions. Institutional education moneys are allocated to the school districts, educational service districts, or others that provide the educational programs. While the amounts vary based on the type and size of program, the current institutional education allocation is projected to be approximately $12,264 per student in the school year. The formula for Institutional Education has not changed under the new funding structure. Highly Capable Program - The Highly Capable, or gifted, program is funded under basic education statutes for up to percent of enrollment and, as is the case with other categorical programs, the allocation cannot be used for other programs. This translates to additional funding of approximately $420 per student in the school year. As with other categorical programs, the new funding formula for the Highly Capable Program provides a designated number of hours of instruction per week, in this case , assuming class sizes of 15 students per certificated instructional staff. Full-Day Kindergarten - The definition of basic education provides halfday instruction for kindergarten students (180 half days, or equivalent, and 450 hours of instruction compared to 180 full days and 1,000 hours of instruction for grades 1 through 12), to be increased to 1,000 hours of instruction for all kindergarten students. The increase is to be phased-in on a schedule set by the Legislature, and beginning with schools with the highest percentage of low-income students, until full statewide implementation of full-day kindergarten is achieved in the school year. Once fully implemented, full-day kindergarten will be part of the program of basic education. 11
14 Funding in the budget increased the state funded full-day kindergarten from approximately 22 percent in the school year to percent in the and school years at a cost of $49.3 million and $50.6 million, respectively., The additional state funds are targeted to those schools with the highest percentage of poverty as measured by the rate of eligibility for free or reduced-price lunch. A list of schools eligible for state funding for full-day kindergarten is published by the Office of Superintendent of Public Instruction and can be found at the following site: The Legislature also funds a variety of programs and activities outside of its definition of basic education. The chart below reflects the funding for the biennium (fiscal years 2014 and 2015) for the seven programs currently defined as basic education as well as the funding for other K-12 programs and activities funded by the state. 12
15 Biennial Operating Budget BASIC EDUCATION PROGRAMS (Dollars in Millions) General Apportionment (RCW 28A ) $11, % Special Education (RCW 28A ) 1, % Transportation (RCW 28A ) % Learning Assistance Program (RCW 28A.165) % Bilingual (RCW 28A.180) % Highly Capable Program (RCW 28A.185) % Institutions (RCW 28A.190) % Sub-Total: Basic Education Programs $14, % Biennial Operating Budget NON-BASIC EDUCATION PROGRAMS (Dollars in Millions) Initiative 732 COLA & Other Compensation Increases % Local Effort Assistance (Levy Equalization) % Full-Day Kindergarten* % Education Reform % State Office and Education Agencies % Statewide Programs and Allocations % Educational Service Districts % Food Service % Summer Vocational and Other Skills Centers % Pupil Transportation Coordinators % Sub-Total: Non-Basic Education Programs $1, % TOTAL - STATE FUNDS** $15, % * Full-day kindergarten is being phased in as part of the definition of basic education and will be fully implemented by the school year. ** "State Funds" include the General Fund-state and the Education Legacy Trust Account, together known as Near General Fund-State 13
16 What is the levy lid act and why was it passed? In a major 1978 decision (Seattle School District No. 1 v. State, 585 P.2d 71, 978) interpreting constitutional provisions related to education, among other things, the Washington State Supreme Court found that school districts may use local tax levies to fund enrichment programs and programs outside the legislative definition of basic education. However, the use of local levies cannot reduce the state s obligation to fund basic education. At the same time that the Legislature defined and took on responsibility for fully funding a basic education program, they passed the Levy Lid Act. The act limits the amount of revenue that a school district can raise through maintenance and operation (M & O) levies. While local levy revenues made up 32 percent of total school district revenues prior to the levy failures of 1975 that precipitated the 1977 school funding lawsuit, they fell to less than 10 percent of total school district revenues after the enactment of the Levy Lid Act. Since that time, the Legislature has made various changes to the Levy Lid Act, ultimately increasing school districts ability to raise levy revenues. Currently, 205 of the 295 school districts have a levy lid of 28 percent, which was increased in the 2010 Legislative session from 24 percent. This means that revenue raised from local tax levies cannot exceed 28 percent of the district s state and federal revenues (with other technical adjustments to that base). The other 90 school districts have a levy lid ranging from percent to percent. These 90 districts have higher levy lid authority because, at the time the Levy Lid Act was passed, these districts raised a higher amount of their revenues through M & O levies. (A list of these districts and their current levy lid rates is included in appendix A.) 14
17 How much of the state near-general fund is spent on K-12 public schools? The state general fund is the largest single fund within the state budget. It is the principal fund supporting the operation of state government. Because the purposes are similar and fund transfers between the two are common, the education legacy trust account is often discussed in combination with the state general fund; together, they are referred to as the state near-general fund. In the biennium (fiscal years 2014 and 2015), the Legislature appropriated $15.2 billion, or 45 percent, of the state near-general fund for the support and operation of K-12 public schools. The following chart shows how the state near-general fund budget is currently - allocated: Dollars in Billions K-12 Public Schools $15.2 Human Services 11.9 Higher Education 3.1 Other* 2.3 General Government 0.8 Natural Resources 0.3 Statewide Total $33.6 * Includes debt service, pensions, other education, transportation, and special approps. Source: WinSum budget development system after the biennial budget 15

18 How has the amount of the near-general fund support of K-12 public schools changed since 2001? As depicted on the following chart, the amount of state near-general funds spent for K-12 public schools has increased from $10.2 billion to $15.2 billion per biennium since This represents approximately a 51 percent increase in state support. The chart on the next page shows that state near-general fund expenditures for K-12 public schools as a percent of the statewide total has varied over the biennia, with a low of approximately 39 percent in to a high of approximately 45 percent today. Increases in the share for K-12 funding can be related to increased K-12 funding, decreased funding for other programs, or both. 16

19 Factors contributing to the decline in the biennium include a slowing of the growth in overall K-12 enrollment, compared to the growth rate in the early 1990s, and fairly rapid growth in other areas of the state budget, particularly health care, human services, and corrections. 17

20 What are other sources of funding used by school districts? In addition to state funding, school districts receive funding from the federal government, local taxes, and other miscellaneous sources. The sources of funding budgeted by school districts for operating costs for the school year are described below. Dollars in Millions State $6,708 Local Taxes 2,052 Federal 905 Other Revenues & Reserves 442 Total $10,108 Excludes capital costs, debt service, transportation vehicle, and associated student body revenues. Source: OSPI F195/F196 School Financial Services reports. State Approximately 66 percent of budgeted school district revenues in the last school year were from state sources. This amount consists of funding for the seven categorical programs currently defined as basic education (general apportionment; the special education program for students with disabilities; some pupil transportation; the Learning Assistance program for remediation assistance; the Transitional Bilingual Instructional Program; the 18
21 Highly Capable program; and educational programs in juvenile detention centers and state institutions) as well as a variety of other grants, allocations, and items funded from the state general fund and the education legacy trust account. Local Taxes Approximately $2.1 billion, or 20 percent of the total amount spent, is from local taxes. This is primarily local property taxes, which are often referred to as maintenance and operations levies. Federal School districts spent about $905 million from federal sources for the school year. This represented about 9 percent of their total spending. This includes funding for the implementation of the federal Individuals with Disabilities Education Act; instructional assistance and other strategies aimed at improving student achievement in high-poverty schools; a variety of professional development activities; the school lunch and other nutrition programs; financial assistance to compensate school districts as the result of federal land ownership; and a variety of smaller allocations and grants. Other Revenue & Reserves This category, totaling $442 million or about four percent of total funding, includes a variety of miscellaneous sources such as charges and fees for non-basic education programs, school lunch charges, revenue from other school districts, rental income, donations, and the use of reserves or fund balance. 19
22 How are these funds spent by school districts? Another way to examine school spending is to identify how school districts spend the money received from state, federal, local, and other sources. School districts report detailed data to the Office of Superintendent of Public Instruction, including the activities on which they spend money. The amounts spent on each activity for the school year are depicted below. Dollars in Millions Teaching $5,937 Other Support Services 1,112 Teaching Support 1,071 Central Administration 577 Building Administration 602 Pupil Transportation 417 Food Services 357 Total $10,073 Source: OSPI F195/F196 School Financial Services reports. 20
23 Teaching For the school year, school districts spent approximately $5.9 billion (59 percent of the total) for teaching activities. This includes payments for salaries and benefits for classroom teachers, direct classroom instruction, extracurricular activities, and payments to other districts for educational services. Teaching Support School districts spent $1.1 billion on teaching support activities in the school year. This represents approximately 11 percent of total school district spending. This includes guidance counseling, library services, audio-visual functions, psychological services, healthrelated activities, and other services that support the delivery of teaching services. Other Support Activities After teaching, the largest activity for school district spending is utilities, grounds care, plant operation and maintenance, insurance, information systems, and other support functions. In the school year, school districts spent approximately $1.1 billion, or 11 percent of their total spending, on this activity. Central Administration Approximately $577 million or six percent of total school district spending is for central administration. This includes school board functions, the superintendents offices, business functions, human resources, centralized programs, and other district-level administrative functions. Building Administration In the school year, school districts spent $602 million, or six percent, on unit administration. This includes expenditures for principals and other building-level administrative functions. Pupil Transportation School districts spent $417 million or four percent on pupil transportation in the school year. This includes bus and other vehicle operating costs, related maintenance, and program supervision. Food Services Approximately $357 million, or four percent of the total, is spent for food-operation functions, including program supervision and federal-nutrition programs, in the school year. 21
24 How much is spent per student? In the school year, on a statewide basis, school districts spent $10,063 per student. The following chart depicts a breakdown of the sources of funding for per student spending: State $6,678 Local Taxes 2,043 Federal 901 Other Revenues 440 Total Per Student $10,063 Sources: OSPI F195/F196 School Financial Services and OSPI enrollment reports. Of the $10,063 spent by school districts in per-student resources, $6,678 or 66 percent of the funding is from state sources, $2,043 or 20 percent is from local taxes, $901 or 9 percent is from federal sources, and $440 or 4 percent came from other revenue. For more detail on these sources, please see What are other sources of funding used by schools districts? on page
 per-student spending has increased from $5,608 in 1994 to $10,029 in 2013.")
25 How has total per-student spending changed since 1994? As can be seen from the following chart, total (from state, federal, local, and other sources) per-student spending has increased from $5,608 in 1994 to $10,029 in This represents an increase of approximately 79 percent over this period. The growth rate of total per-student spending exceeds both the Seattle Consumer Price Index (CPI) and Implicit Price Deflator (IPD), which are two commonly used measures of inflation. 23

26 How has state per-student funding changed since 1994? As can be seen from the following chart, state funding per student has increased from $4,342 in 1994 to $6,678 in This represents approximately a 54 percent increase over this period. The growth rate of state funding per student spending exceeds the Implicit Price Deflator (IPD) but not the Seattle Consumer Price Index (CPI). How is the salary level for teachers determined? State funding The Legislature allocates money to each district for state-funded employee salaries and associated fringe benefits. In the case of certificated instructional staff (CIS) teachers, counselors, librarians, and other instructional staff requiring certification the state funding is provided based on a state-salary allocation schedule. An individual s education level and teaching experience determines the allocation for base salary. Additional funds (a one- to three-percent increase) are provided for each additional year of experience up to 16 years. Additional funds (a three- to 20-percent increase) are also provided for additional credits of approved education acquired up to a Ph.D. (See appendix B for the state allocation schedule for certificated instructional staff for the school year.) In the biennium, the Legislature made a one-time reduction in certificated instructional and classified staff salaries by 1.9% and certificated administrative salaries by 3.0% for school years and
27 The state does not require school districts to pay certificated instructional staff in accordance with the state-salary allocation schedule. However, most school districts have adopted a salary schedule the same as, or similar to, the state allocation schedule. Some of the state s 295 school districts receive higher salary allocations for certificated instructional staff. The primary reason for this higher allocation is that these districts were paying their certificated instructional staff higher salaries when the Legislature took on responsibility for fully funding basic education programs in the late 1970s. In the budget, the Legislature took steps that reduced the number of grandfathered salary districts. (See appendix C for a list of these districts and their allocation rate for school year ) Additionally, the Legislature limits a school district s authority to establish salaries for certificated instructional staff by setting a minimum and an average salary level. Minimum salary The actual minimum salaries in the district cannot be less than the minimum on the state-salary allocation schedule for a certificated instructional staff member who has a BA or MA with no years of experience. The rationale for this limitation is to ensure a minimum salary for beginning certificated instructional staff. Average salary The actual average salary in the district cannot exceed the average salary calculated based on the state allocation schedule. A rationale for this limitation is to prevent districts from paying a few certificated instructional staff a very large salary and the rest at the minimum. The state funding provided to school districts for certificated instructional staff salaries is subject to collective bargaining within the state limitations. Supplemental Pay School districts may provide supplemental pay for additional time, responsibilities, and incentives (also known as TRI ) beyond that provided by the state. The vast majority of supplemental contracts are paid from local revenue. State law provides that supplemental pay contracts must not create any present- or future-funding obligation for the state. 25

28 What is the average salary level for teachers? In the school year, the statewide average annual base salary for full time teachers was $52,526. In addition, the average additional salary was $12,317. This means that the total average annual was $64,843. How is the salary level of administrators and classified staff determined? The Legislature allocates money to each district for employee salaries and associated fringe benefits. In the case of administrators and classified staff (such as bus drivers, food service workers, custodial staff, classroom aides), there is not a state-salary allocation schedule. However, each district receives an allocation for these staff based on historical salary allocations adjusted for any cost-of-living increases. This means that there are variations in the salary levels used for allocating administrator and classified staff position from district to district. In the budget, the Legislature provided additional funding to reduce the variation and increase the salary amounts for districts that have historically received lower funding. However, variations in the salary amounts continue to exist. The actual salary levels for administrators and classified staff are determined through the local collective-bargaining process. There are no state limitations with respect to salary levels of administrators or classified staff. 26
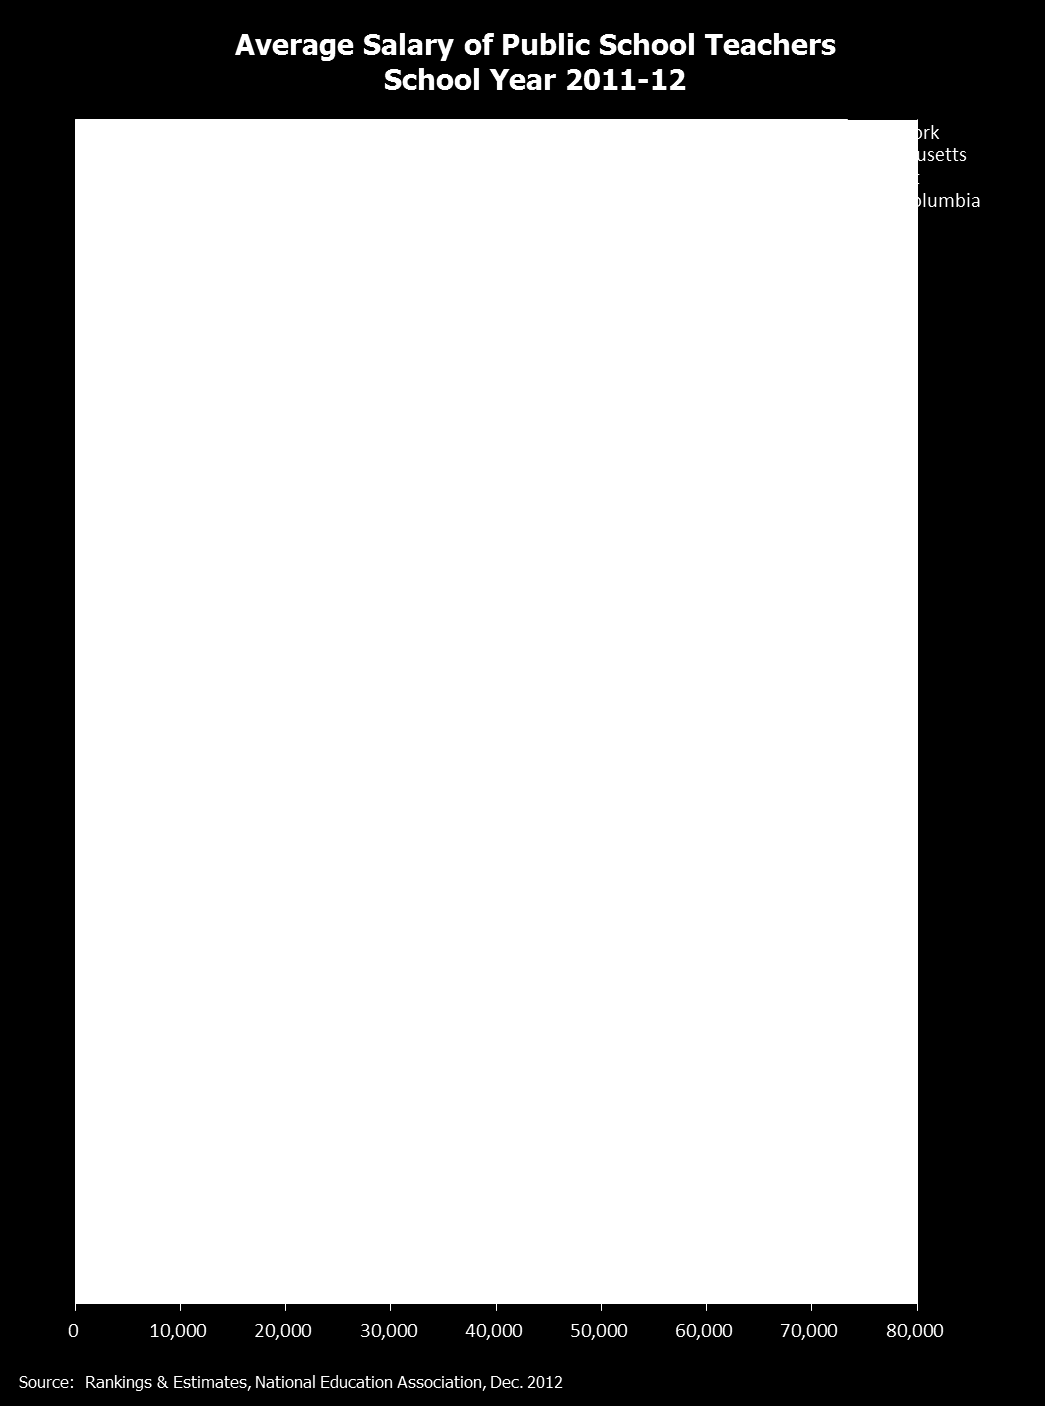
29 How does Washington compare to other states? National information is often used to compare different aspects of K-12 finance. On the following three pages are charts comparing per-student spending, students enrolled per teacher, and teacher average salary levels in Washington and other states. It should be noted that comparisons with other states, while interesting, often do not lend themselves to any definitive conclusions regarding each state s K-12 finance system, due to differences in reporting practices, demographics, and public-school funding systems. Per-Student Spending As depicted on the chart on page 28, Washington s total per-student spending of $10,682 ranks 28th compared to the other states in the school year. The national average was $11,254. Compared to other states in the western region, Washington s per student spending was $1,550 below Oregon ($12,232), $1,522 above California ($9,160) and $1,794 above Idaho ($8,888). Students Enrolled Per Teacher The chart on page 29 compares students enrolled per teacher in the school year. Washington s 19.7 enrolled students per teacher makes it the fourth highest in the nation. The national average was Compared to other states in the western region, Washington s number of enrolled students per teacher was below California (25.6) and Oregon (20.2) but above Idaho (18.2). For a variety of reasons, this measure of students to teachers does not translate into the average class size in any given school, district, or state. Teacher Average Salary Levels The chart on page 30 provides a comparison of average salary levels for teachers. In the school year, Washington s reported teacher average salary of $52,232 made it the 23rd highest in the nation. The national average was $55,418. Compared to other states in the western region, Washington s average teacher salary was $16,299 below California ($68,531), $5,116 below Oregon ($57,348), and $3,681 above Idaho ($48,551). The average salary levels depicted on this chart do not include supplemental pay. Since data related to supplemental pay in other states is not available, it is unknown how this might affect the rankings. 27
30 28
31 29
32 30
33 How does the state lottery support public schools? When the state lottery was established in 1982, the state was in an economic recession. The Legislature deposited the lottery revenues into the state general fund, which supports K-12 public schools, higher education, human services, natural resources, and other state programs. Prior to the actual creation of the lottery, there were various proposals to dedicate the lottery proceeds to the developmentally disabled, public schools, or state institutions. While none of these proposals were actually enacted into law, they are probably the source of the popular misconception that the lottery had been entirely dedicated to K-12 education. As a result of the passage of Initiative 728 in 2000, all lottery revenues were, in fact, dedicated for educational purposes (with the exception of about 10 percent, which was dedicated by previous legislation for debt service on the stadiums in Seattle). For fiscal years , a portion of lottery revenues were distributed to school districts to allow them to make improvements, such as reducing class sizes, extending learning opportunities, and expanding professional development and early childhood education programs. The remainder was deposited into the Education Construction Account, which is used to fund a portion of the state matching funds for K-12 public school and higher education construction. From fiscal year 2005 through 2009, all lottery revenues were deposited into the Education Construction Account. In 2009, the Legislature redirected lottery dollars to the state general fund to support a range of state programs, including education, for fiscal year K-12 school construction costs were covered with additional general obligation bonds. Also in 2009, the Legislature approved the sale of the multi-state game Powerball. While the education construction fund previously has been lottery's largest beneficiary, the lottery has been directed by the Legislature to make contributions to stadium funding and problem gambling prevention and treatment. The Legislature repealed I-728 during the 2012 Legislative session as part of HB 2824 (Chapter 10, Laws of 2012). It should be noted that while Initiative 728 dedicated lottery revenues to educational purposes, the Legislature passed legislation in 2002 that authorized a new lottery game that is not subject to the distribution for educational purposes. The legislation authorized participating in a multistate lottery (now named Mega Millions ) with the profits from the game going to the state general fund. The legislation had provisions addressing the concern that some people might play the new multi-state lottery rather than the existing lottery games and, therefore, diminish the base revenues for educational purposes. For this reason, the legislation required $102 million annual transfers to make the educational-related accounts whole before distributing any excess profits to the general fund. In other words, it was intended that the educational related activities would receive as much money as they would have without the multi-state lottery. 31
HOUSE BILL 2742. State of Washington 64th Legislature 2016 Regular Session
 H-.1 HOUSE BILL State of Washington th Legislature 0 Regular Session By Representatives Reykdal, Muri, Bergquist, Hayes, Magendanz, Kilduff, and Rossetti Read first time 01/0/. Referred to Committee on
Initiative 1351 Fiscal Impact
 Initiative 1351 Fiscal Impact Initiative 1351 (I-1351) will not increase or decrease state revenues. State expenditures will increase through distributions to local school districts by an estimated $4.7
CERTIFICATION OF ENROLLMENT ENGROSSED SUBSTITUTE HOUSE BILL 2065. 62nd Legislature 2011 1st Special Session
 CERTIFICATION OF ENROLLMENT ENGROSSED SUBSTITUTE HOUSE BILL 2065 62nd Legislature 2011 1st Special Session Passed by the House May 25, 2011 Yeas 71 Nays 25 Speaker of the House of Representatives Passed
E2SSB 6552 - H AMD 829 By Representative Stonier WITHDRAWN 03/12/2014
 -S.E AMH STON MCLA ESSB - H AMD By Representative Stonier WITHDRAWN 0// 1 Strike everything after the enacting clause and insert the following: "NEW SECTION. Sec. 1. The legislature recognizes that preparing
2005 SCHOOL FINANCE LEGISLATION Funding and Distribution
 2005 SCHOOL FINANCE LEGISLATION Funding and Distribution RESEARCH REPORT # 3-05 Legislative Revenue Office State Capitol Building 900 Court Street NE, H-197 Salem, Oregon 97301 (503) 986-1266 http://www.leg.state.or.us/comm/lro/home.htm
Organization and Financing. Of Washington Public Schools
 Organization and Financing Of Washington Public Schools Randy I. Dorn State Superintendent of Public Instruction May 2013 OSPI provides equal access to all programs and services without discrimination
CTE and Skill Center Program Funding, Accounting & Data Reporting
 Randy I. Dorn State Superintendent Office of Superintendent of Public Instruction Old Capitol Building P.O. Box 47200 Olympia, WA 98504-7200 CTE and Skill Center Program Funding, Accounting & Data Reporting
ORGANIZATION AND FINANCING WASHINGTON PUBLIC SCHOOLS
 ORGANIZATION AND FINANCING OF WASHINGTON PUBLIC SCHOOLS Michael L. Bigelow, Associate Superintendent Budget and School Business Services Allen H. Jones, Director School Apportionment and Financial Services
TENNESSEE BASIC EDUCATION PROGRAM 2.0
 TENNESSEE BASIC EDUCATION PROGRAM 2.0 HANDBOOK FOR COMPUTATION Revised April 2014 TENNESSEE DEPARTMENT OF EDUCATION OFFICE OF LOCAL FINANCE 710 JAMES ROBERTSON PARKWAY NASHVILLE, TENNESSEE 37243-0381 FY
The NEVADA PLAN For School Finance An Overview
 The NEVADA PLAN For School Finance An Overview Fiscal Analysis Division Legislative Counsel Bureau 2013 Legislative Session Nevada Plan for School Finance I. Overview of Public K-12 Education Finance
Overview of State Funding for Public Education in Idaho
 Overview of State Funding for Public Education in Idaho Idaho s public schools receive revenue from state, local, and federal sources. This brief focuses on the allocation of state funds for public education,
Understanding Washington s Property Tax. Dean Carlson, Ways and Means Staff
 Understanding Washington s Property Tax Dean Carlson, Ways and Means Staff Constitutional Requirements All taxes on real estate must be uniform within a taxing district. Tax uniformity requires both an
School District Funding - How to Get the Most Money You Want
 Funding Pennsylvania Public Schools TM 1 Introduction A recent study by the Pennsylvania School Boards Association determined that many citizens do not understand how Pennsylvania s public schools are
2009 SCHOOL FINANCE LEGISLATION Funding and Distribution
 2009 SCHOOL FINANCE LEGISLATION Funding and Distribution RESEARCH REPORT #8-09 Legislative Revenue Office State Capitol Building 900 Court Street NE, #143 Salem, Oregon 97301 (503) 986-1266 http://www.leg.state.or.us/comm/lro/home.htm
Assembly Bill No. 1 Committee of the Whole THE PEOPLE OF THE STATE OF NEVADA, REPRESENTED IN SENATE AND ASSEMBLY, DO ENACT AS FOLLOWS:
 Assembly Bill No. 1 Committee of the Whole CHAPTER... AN ACT relating to education; revising the requirements for the biennial budgetary request for the State Distributive School Account; creating the
Understanding Alabama Schools Accounting System. A Guide to State Allocation Calculations 2013-2014 3/4/2014. Funding Components.
 Understanding Alabama Schools Accounting System A Guide to State Allocation Calculations 2013-2014 Sonja Peaspanen State Department of Education March 5, 2014 Funding Components Total Units Total Foundation
The Basics of Quality Basic Education (QBE) Funding
 Funding") The Basics of Quality Basic Education (QBE) Funding Public schools in Chatham County receive a combination of federal, state and local funds to pay for the education of public school students. Public school
The Basics of Quality Basic Education (QBE) Funding Public schools in Chatham County receive a combination of federal, state and local funds to pay for the education of public school students. Public school
THE DESIGN OF THE RHODE ISLAND SCHOOL FUNDING FORMULA: TOWARD A COHERENT SYSTEM OF ALLOCATING STATE AID TO PUBLIC SCHOOLS
 THE DESIGN OF THE RHODE ISLAND SCHOOL FUNDING FORMULA: TOWARD A COHERENT SYSTEM OF ALLOCATING STATE AID TO PUBLIC SCHOOLS Kenneth K. Wong Chair and Annenberg Professor Education Department, Brown University
(1) Bases the computations for steps 1, 2 and 5 on net enrollment only, eliminating the adjusted enrollment limits;
 Bases the computations for steps 1, 2 and 5 on net enrollment only, eliminating the adjusted enrollment limits;") STATE OF WEST VIRGINIA EXECUTIVE SUMMARY OF THE PUBLIC SCHOOL SUPPORT PROGRAM BASED ON THE FINAL COMPUTATIONS FOR THE 2011-12 YEAR The Public School Support Program (PSSP) is a plan of financial support
STATE OF WEST VIRGINIA EXECUTIVE SUMMARY OF THE PUBLIC SCHOOL SUPPORT PROGRAM BASED ON THE FINAL COMPUTATIONS FOR THE 2011-12 YEAR The Public School Support Program (PSSP) is a plan of financial support
School Finance How Does it Work???
 School Finance How Does it Work??? March 3, 2016 Leanne Emm, Associate Commissioner Emm_l@cde.state.co.us 303-866-6202 School Finance Total Program Funding 2 1 Total Program Funding The vast majority of
STATE OF WEST VIRGINIA PUBLIC SCHOOL SUPPORT PROGRAM EXECUTIVE SUMMARY For the 2000-01 Year
 STATE OF WEST VIRGINIA PUBLIC SCHOOL SUPPORT PROGRAM EXECUTIVE SUMMARY For the 2000-01 Year The Public School Support Program is a plan of financial support for the public schools in the State of West
STATE OF WEST VIRGINIA EXECUTIVE SUMMARY OF THE PUBLIC SCHOOL SUPPORT PROGRAM BASED ON THE FINAL COMPUTATIONS FOR THE 2014-15 YEAR
 STATE OF WEST VIRGINIA EXECUTIVE SUMMARY OF THE PUBLIC SCHOOL SUPPORT PROGRAM BASED ON THE FINAL COMPUTATIONS FOR THE 2014-15 YEAR The Public School Support Program (PSSP) is a plan of financial support
Summary of Total Expenditures. 1. Summary of General and Supplemental General Fund Expenditures 2. Instruction Expenditures.3
 409 - Atchison Summary of Total Expenditures. 1 Summary of General and Supplemental General Fund Expenditures 2 Instruction Expenditures.3 Sources of Revenue and Proposed Budget for 2009-10 (previously
SCHOOL FINANCE IN COLORADO
 STATE OF COLORADO LEGISLATIVE COUNCIL COLORADO GENERAL ASSEMBLY STATE CAPITOL BUILDING RM 029 200 EAST COLFAX AVENUE DENVER CO 80203-1784 M110300000 SCHOOL FINANCE IN COLORADO Legislative Council Staff
EDUCATION EDUCATION (K-12)
") EDUCATION EDUCATION The Education function includes three sub-functions: The Department of Education (K-12); the Nevada System of Higher Education; and other educational programs, which include the Western
EDUCATION EDUCATION The Education function includes three sub-functions: The Department of Education (K-12); the Nevada System of Higher Education; and other educational programs, which include the Western
Funding North Carolina s Public Schools
 Funding North Carolina s Public Schools Brian Matteson Fiscal Research Division Key Takeaways State Public Schools funding is distributed to Local Education Agencies (LEAs) through allotments Allotments
Summary of Total Expenditures...1. Summary of General and Supplemental General Fund Expenditures..2. Instruction Expenditures 3
 SOUTH CENTRAL Summary of Total Expenditures...1 Summary of General and Supplemental General Fund Expenditures..2 Instruction Expenditures 3 Sources of Revenue and Proposed Budget for 2005-06 (previously
SCHOOL FINANCE IN COLORADO
 SCHOOL FINANCE IN COLORADO Legislative Council Staff State Capitol Building, Room 029 200 East Colfax Avenue Denver, CO 80203 Phone: (303) 866-3521 April 2012 STATE OF COLORADO LEGISLATIVE COUNCIL COLORADO
FORT HAYS STATE UNIVERSITY
 FORT HAYS STATE UNIVERSITY Actual FY 2014 Agency Est. FY 2015 FY 2015 Agency Req. Agency Req. FY 2017 FY 2017 Operating Expenditures: State General Fund $ 32,656,997 $ 34,036,691 $ 33,988,112 $ 33,921,728
SCHOOL FUNDING COMPLETE RESOURCE
 [Type text] LEGISLATIVE SERVICE COMMISSION SCHOOL FUNDING COMPLETE RESOURCE Updated February 2011 [Type text] TABLE OF CONTENTS INTRODUCTION... 4 STATE OPERATING REVENUE... 8 Adequacy State Model Amount...
The districts are divided into the following four groups, based on student net enrollment per square mile:
 STATE OF WEST VIRGINIA EXECUTIVE SUMMARY OF THE PUBLIC SCHOOL SUPPORT PROGRAM BASED ON THE PRELIMINARY COMPUTATIONS FOR THE 2016-17 YEAR The Public School Support Program (PSSP) is a plan of financial
Summary of Total Expenditures. 1. Summary of General and Supplemental General Fund Expenditures 2. Instruction Expenditures.3
 USD 257 - Iola Summary of Total Expenditures. 1 Summary of General and Supplemental General Fund Expenditures 2 Instruction Expenditures.3 Sources of Revenue and Proposed Budget for 2008-09 (previously
Summary of Total Expenditures. 1. Summary of General and Supplemental General Fund Expenditures 2. Instruction Expenditures.3
 435 - Abilene Summary of Total Expenditures. 1 Summary of General and Supplemental General Fund Expenditures 2 Instruction Expenditures.3 Sources of Revenue and Proposed Budget for 2011-12.4 Enrollment
A Cost Analysis for Texas Public Schools. Prepared by: Sponsored by: 2008 Update
 A Cost Analysis for Texas Public Schools Prepared by: Sponsored by: 2008 Update Table of Contents A Progress Report on Texas Public School Finance 4 Adequacy 4 Equity 7 Capacity 10 How Are Educational
August 2014 Report No. 14-705
 John Keel, CPA State Auditor A Report on Executive Compensation at State Agencies Report No. 14-705 A Report on Executive Compensation at State Agencies Overall Conclusion The decisions of state agencies
School Finance 101. MASA / MASE Spring Conference Joel Sutter Ehlers Greg Crowe - Ehlers
 School Finance 101 MASA / MASE Spring Conference Joel Sutter Ehlers Greg Crowe - Ehlers 3/13/2014 1 Overview Minnesota has one of the most complex school funding systems of any state It is not a logical,
VIRGINIA. Description of the Formula
 VIRGINIA Description of the Formula The foundation formula is based on pupils in average daily membership (ADM) for the current year. Basic program funding is determined by multiplying total ADM by a per
Financing Education In Minnesota 2013-14. A Publication of the Minnesota House of Representatives Fiscal Analysis Department
 Financing Education In Minnesota 2013-14 A Publication of the Minnesota House of Representatives Fiscal Analysis Department November 2013 Financing Education in Minnesota 2013-14 A Publication of the Minnesota
Appendix E. Texas State Education Data
 Appendix E Texas State Education Data The state of Texas oversees education services to more that 4.2 million children and employs more than 300,000 teachers and other professional staff in 7,733 schools
AUBURN-WASHBURN USD 437
 AUBURN-WASHBURN USD 437 Summary of Total Expenditures. 1 Summary of General and Supplemental General Fund Expenditures 2 Instruction Expenditures.3 Sources of Revenue and Proposed Budget for 2003-04 (previously
Essential Programs & Services State Calculation for Funding Public Education (ED279):
:") Essential Programs & Services State Calculation for Funding Public Education (ED279): Maine s Funding Formula for Sharing the Costs of PreK-12 Education between State and Local: 1. Determine the EPS Defined
Essential Programs & Services State Calculation for Funding Public Education (ED279): Maine s Funding Formula for Sharing the Costs of PreK-12 Education between State and Local: 1. Determine the EPS Defined
I. GENERAL BACKGROUND
 KENTUCKY Sheila E. Murray University of Kentucky I. GENERAL BACKGROUND State The watershed event for school finance in Kentucky was the 1989 Kentucky Supreme Court decision, Rose v. Council for Better
9. Compensatory Education Guidelines, Financial Accounting Treatment, and an Auditing and Reporting System. Update 14
 9 Compensatory Education Guidelines, Financial Accounting Treatment, and an Auditing and Reporting System Update 14 A MODULE OF THE TEXAS EDUCATION AGENCY FINANCIAL ACCOUNTABILITY SYSTEM RESOURCE GUIDE
Florida Education Finance Program (FEFP)
") F l o r i d a H o u s e o f R e p r e s e n t a t i v e s Florida Education Finance Program (FEFP) EDUCATION FACT SHEET 2010-11 What is the Florida Education Finance Program? The Florida Education Finance
F l o r i d a H o u s e o f R e p r e s e n t a t i v e s Florida Education Finance Program (FEFP) EDUCATION FACT SHEET 2010-11 What is the Florida Education Finance Program? The Florida Education Finance
Proposition 38. Tax for Education and Early Childhood Programs. Initiative Statute.
 Proposition 38 Tax for Education and Early Childhood Programs. Initiative Statute. OVERVIEW This measure raises personal income taxes on most California taxpayers from 2013 through 2024. The revenues raised
LSC Redbook. Analysis of the Executive Budget Proposal. Department of Education
 LSC Redbook Analysis of the Executive Budget Proposal Department of Education Emily W. H. Gephart, Budget Analyst Andrew Plagenz, Budget Analyst Edward M. Millane, Budget Analyst Legislative Service Commission
To inspire every student to think, to learn, to achieve, to care
 Our Mission To inspire every student to think, to learn, to achieve, to care MESSAGE FROM OUR SUPERINTENDENT Our Dedication to Excellence Harry Bull, Jr., Ed.D. We are dedicated to excellence every day.
Department of Legislative Services Maryland General Assembly 2015 Session
 Department of Legislative Services Maryland General Assembly 2015 Session SB 595 Senate Bill 595 Education, Health, and Environmental Affairs and Budget and Taxation FISCAL AND POLICY NOTE Revised (The
Special Education Cross-Subsidies Fiscal Year 2013. Fiscal Year 2013. Report. To the. Legislature. As required by. Minnesota Statutes,
 Special Education Cross-Subsidies Fiscal Year 2013 Fiscal Year 2013 Report To the Legislature As required by Minnesota Statutes, section 127A.065 COMMISSIONER: Special Education Cross-Subsidies Brenda
NEW YORK. Description of the Formula. District-Based Components
 NEW YORK NOTE: The following is a high level summary of the NYS school finance system and not an exhaustive or comprehensive description of every school aid formula used in the State. Description of the
Data Housed at the North Carolina Education Research Data Center
 Data Housed at the North Carolina Education Research Data Center District-level data Community Index Data, Year 2004 Each file has one record per Local Education Agency with the percent of students (a)
Alternative Learning Experience (ALE) Programs 2011 Interim Background Legislation Enacted in the 2011 Session
 Programs 2011 Interim Background Legislation Enacted in the 2011 Session") Alternative Learning Experience (ALE) Programs 2011 Interim Staff: Juliana Roe, Senate Early Learning & K-12 Education Committee (360-786-7438) Elise Greef, Senate Ways & Means Committee (360-786-7708)
Alternative Learning Experience (ALE) Programs 2011 Interim Staff: Juliana Roe, Senate Early Learning & K-12 Education Committee (360-786-7438) Elise Greef, Senate Ways & Means Committee (360-786-7708)
Components 127th General Assembly 128th General Assembly
 League of Women Voters of Ohio Comparison of the Components of the Education Provisions of Am. Sub. HB 119 (127th General Assembly) and Am. Sub. HB 1 (128th General Assembly) Updated February 2010 Components
TAX TO FUND EDUCATION AND EARLY CHILDHOOD PROGRAMS. INITIATIVE STATUTE.
 PROPOSITION 30 TAX TO FUND EDUCATION AND EARLY CHILDHOOD PROGRAMS. OFFICIAL TITLE AND SUMMARY PREPARED BY THE ATTORNEY GENERAL TAX TO FUND EDUCATION AND EARLY CHILDHOOD PROGRAMS..Increases personal income
KANSAS ASSOCIATION OF SCHOOL BOARDS 1420 SW Arrowhead Road, Topeka, Kan. 66604 785.273.3600 800.432.2471 www.kasb.org
 KANSAS ASSOCIATION OF SCHOOL BOARDS 1420 SW Arrowhead Road, Topeka, Kan. 66604 785.273.3600 800.432.2471 www.kasb.org Special Report: February, 2014 School Funding, At-Risk and All-Day Kindergarten and
The Corporate Income Tax Credit Scholarship Program Saves State Dollars
 December 2008 Report No. 08-68 The Corporate Income Tax Credit Scholarship Program Saves State Dollars at a glance The corporate income tax credit scholarship program produces a net savings to the state.
Report on Adequacy of. Public Education Funding. As Required by Article VIII, Section 8, of the Oregon. Constitution. 2013-2015 Education Budget
 Report on Adequacy of November 2013 Joint Special Committee on Public Education Appropriation Membership: Sen. Rod Monroe Co-Chair Public Education Funding As Required by Article VIII, Section 8, of the
MISSOURI. Gerri Ogle Coordinator, School Administrative Services Department of Elementary and Secondary Education I. GENERAL BACKGROUND.
 MISSOURI Gerri Ogle Coordinator, School Administrative Services Department of Elementary and Secondary Education I. GENERAL BACKGROUND State The major portion of state funds for elementary and secondary
Indicators for Florida School District Best Financial Management Practices
 Indicators for Florida School District Best Financial Management Practices January 1998 Office of Program Policy Analysis and Government Accountability Report No. 97-33 Contents Introduction... i Chapter
S earching. Tax Relief. for Property. As New York considers a property tax cap, many wonder what it would mean for the state s schools
 E ducation leaders across the state understand the need for property tax relief. However, many are concerned that if a property tax cap is enacted in New York as the Governor and many lawmakers have proposed
Education Revenue, Expenditures, And Staffing Over 10 Years
 Office Of Education Accountability Legislative Research Commission Education Revenue, Expenditures, And Staffing Over 10 Years Research Report No. 409 Prepared By Karen M. Timmel, Acting Director; Gerald
The costs of charter and cyber charter schools. Research and policy implications for Pennsylvania school districts. Updated January 2014
 The costs of charter and cyber charter schools Updated January 2014 Research and policy implications for Pennsylvania school districts Education Research & Policy Center 400 Bent Creek Blvd., Mechanicsburg,
COLORADO. Terry N. Whitney, Senior Policy Specialist National Conference of State Legislatures
 COLORADO Terry N. Whitney, Senior Policy Specialist National Conference of State Legislatures Richard A. King, Professor University of Northern Colorado Byron Pendley, Director of School Finance Colorado
FUNDING AND FINANCIAL MANAGEMENT OF FLORIDA S PUBLIC CHARTER SCHOOLS
 T TECHNICAL ASSISTANCE PAPER No: 2009-03 FUNDING AND FINANCIAL MANAGEMENT OF FLORIDA S PUBLIC CHARTER SCHOOLS This manual describes the funding of Florida s public charter schools and related budget issues.
BUDGET AT A GLANCE. USD 105 - Rawlins County 2015-16
 BUDGET AT A GLANCE 215-16 USD 15 - Rawlins County School Finance Kansas State Department of Education Landon State Office Building 9 SW Jackson Street, Suite 356 Topeka, Kansas 66612-1212 www.ksde.org
Serving Public Education: Employment of Graduates from Missouri Public Higher Education Institutions in Missouri s Public Schools.
 Serving Public Education: Employment of Graduates from Missouri Public Higher Education Institutions in Missouri s Public Schools October 2014 Mark Ehlert Jiaxi Li Department of Economics University of
MINNESOTA SCHOOL FINANCE HISTORY 1849 2014
 Division of School Finance May 2014 MINNESOTA SCHOOL FINANCE HISTORY 1849 2014 1849 1915: Local Property Tax Supplemented with State Flat Grants Early revenue sources included county and school district
Education Funding in South Carolina
 Education Funding in South Carolina OVERVIEW South Carolina has one of the nation s most complicated public school funding systems. Funding for K-12 schools has rapidly increased year after year, far outpacing
Supplement, Not Supplant Handbook A Guide for Grants Administered by the Texas Education Agency
 Supplement, Not Supplant Handbook A Guide for Grants Administered by the Texas Education Agency 2013 THE TEXAS EDUCATION AGENCY Contents Supplement, Not Supplant Handbook Introduction... 2 Definition
Higher Education. Higher Education Compact Funding Levels. Higher Education
 Higher Education Total Funding The Budget continues to recognize the significant contributions and benefits to society from broad access to higher education at the University of California (UC), the California
Status Report: Progress on Implementation of The New Student Transportation Funding System
 Status Report: Progress on Implementation of The New Student Transportation Funding System Report to the Legislature Randy I. Dorn State Superintendent of Public Instruction September 2011 OSPI provides
TITLE IX, PART E UNIFORM PROVISIONS SUBPART 1 PRIVATE SCHOOLS. Non-Regulatory Guidance
 TITLE IX, PART E UNIFORM PROVISIONS SUBPART 1 PRIVATE SCHOOLS Equitable Services to Eligible Private School Students, Teachers, and Other Educational Personnel Non-Regulatory Guidance Office of Non-Public
K-12 Employee Benefits Equity, Affordability, and the Impacts of System Consolidation
 Report to the Governor, Legislature and Joint Legislative Audit and Review Committee K-12 Employee Benefits Equity, Affordability, and the Impacts of System Consolidation June 1, 2015 A report to the Legislature
Fiscal Note & Local Impact Statement 122 nd General Assembly of Ohio
 Fiscal Note & Local Impact Statement 122 nd General Assembly of Ohio BILL: Sub. S.B. 135 DATE: July 29, 1997 STATUS: As Reported by Senate Education SPONSOR: Sen. Watts LOCAL IMPACT STATEMENT REQUIRED:
Ohio Legislative Service Commission
 Ohio Legislative Service Commission Fiscal Note & Local Impact Statement Jason Phillips and other LSC staff Bill: Am. H.B. 555 of the 129th G.A. Date: December 13, 2012 Status: As Enacted Sponsor: Reps.
Grants for Statewide Longitudinal Data Systems
 Washington s Application: Grants for Statewide Longitudinal Data Systems American Recovery and Reinvestment Act of 2009 Purpose The Education Research and Data Center (ERDC) has developed this concept
Career and Professional Education: Preparing Florida s Students for the Knowledge Economy Florida Master Plan for K-20 Education
 COUNCIL FOR EDUCATION POLICY, RESEARCH & IMPROVEMENT Career and Professional Education: Preparing Florida s Students for the Knowledge Economy Florida Master Plan for K-20 Education 2005 Progress Report
SCHOOL FINANCE IN COLORADO
 SCHOOL FINANCE IN COLORADO Prepared by: Legislative Council Staff State Capitol Building, Room 029 200 East Colfax Avenue Denver, CO 80203 Phone: (303) 866-3521 April 2015 FOREWORD The purpose of this
The Education Dollar. A Look at Spending and Funding Trends
 The Education Dollar A Look at Spending and Funding Trends September 2015 Executive Summary This annual study examines school district spending and funding over a ten-year period. The study identifies
Policy Guide 2015. Supporting Student-centered Learning
 Policy Guide 2015 The Colorado Education Association s commitment to quality public schools requires that we advocate for issues vital to children and public education. It is our responsibility to work
Understanding School Choice in Alachua County: Funding School Choice in Florida
 Understanding School Choice in Alachua County: Funding School Choice in Florida Florida has been a leader in developing both public and private school alternative programs to address the challenges of
ATTACHMENT D CHARTER SCHOOLS IN MICHIGAN
 ATTACHMENT D CHARTER SCHOOLS IN MICHIGAN Introduction In December of 1993, Michigan became the ninth state to pass charter school legislation. The current charter school statute applicable to this RFP
6. Education. Overview
 6. Education The Executive Budget reflects the Governor s commitment to improving student outcomes by providing a $1.1 billion increase in aid (4.8 percent) and conditioning it on the implementation of
SCHOOL FINANCE IN COLORADO
 SCHOOL FINANCE IN COLORADO Legislative Council Staff State Capitol Building, Room 029 200 East Colfax Avenue Denver, CO 80203 Phone: (303) 866-3521 March 2011 STATE OF COLORADO LEGISLATIVE COUNCIL COLORADO
BOARD OF TRUSTEES MINNESOTA STATE COLLEGES AND UNIVERSITIES BOARD ACTION. Fiscal Years 2010-2011 Biennial Operating Budget
 BOARD OF TRUSTEES MINNESOTA STATE COLLEGES AND UNIVERSITIES BOARD ACTION Fiscal Years 2010-2011 Biennial Operating Budget BACKGROUND Every other year, as part of the state s operating budget process, the
Rider Comparison Packet. 2012-13 General Appropriations Bill
 Rider Comparison Packet Conference Committee on Bill 1 2012-13 General Appropriations Bill Article III, Public Education Prepared by the Legislative Budget Board Staff 5/5/2011 ARTICLE III - AGENCIES OF
Using GIS to Determine Equitable Funding for School Bus Transportation
 Using GIS to Determine Equitable Funding for School Bus Transportation Cathy Walker, MS GISP GIS Data Administrator/Analyst Washington State Office of the Superintendent of Public Instruction (OSPI) Washington
Planning a NCLB Title VA Program ODE April 2007
 This document is a companion piece to the Planning a NCLB Title VA Program power point. The NCLB Title VA text and USDE Guidance referencing the items in the power point are listed by page number with
GLOSSARY OF TERMS. BUILDING MANAGER Non-certified persons hired by the school district to manage and oversee the operation of a school.
 GLOSSARY OF TERMS ACCUMULATIVE ENROLLMENT - The total number of students enrolled in a school year (beginning of the year enrollment plus any students added after that date), this count is used to determine
A Guide to. NYC Public Schools Budget
 A Guide to NYC Public Schools Budget Dear New York City Community Member, With 1.1 million students and over 1,700 schools, the New York City Department of Education (DOE) is the largest school system
Overview of Adult Education Programs L E G I S L A T I V E A N A L Y S T S O F F I C E
 March 11, 2015 Overview of Adult Education Programs L E G I S L A T I V E A N A L Y S T S O F F I C E Presented to: Assembly Education Committee Hon. Patrick O Donnell, Chair Assembly Higher Education
HOUSE OF REPRESENTATIVES ~ 2348 TWENTY-EIGHTH LEGISLATURE, 2016 IN H.D. 1 STATE OF HAWAII A BILL FOR AN ACT
 HOUSE OF REPRESENTATIVES 2348 TWENTY-EIGHTH LEGISLATURE, 2016 IN H.D. 1 STATE OF HAWAII A BILL FOR AN ACT RELATING TO PERMANENT EXEMPT POSITIONS IN THE DEPARTMENT OF HUMAN SERVICES. BE IT ENACTED BY THE
Gov. Rec. FY 2015. Agency Req. FY 2016
 UNIVERSITY OF KANSAS Actual FY 2014 Agency Est. Agency Req. Agency Req. FY 2017 FY 2017 Operating Expenditures: State General Fund $ 135,402,775 $ 137,384,253 $ 137,168,039 $ 136,930,098 $ 135,932,220
Online Mathematics Curricula Request for Information Responses
 Online Mathematics Curricula Request for Information Responses Report to the Legislature Dr. Terry Bergeson State Superintendent of Public Instruction December 2008 Office of Superintendent of Public Instruction
S-2568.1 SENATE BILL 5909. State of Washington 63rd Legislature 2013 Regular Session
 S-2568.1 SENATE BILL 5909 State of Washington 63rd Legislature 2013 Regular Session By Senators McAuliffe, Litzow, Chase, Rivers, Kohl-Welles, and Rolfes Read first time 04/15/13. Referred to Committee
Issue Brief. Illinois School Funding Formula and General State Aid. August 2006
 70 East Lake Street Suite 1700 Chicago, IL 60601 312-332-1041 www.ctbaonline.org Issue Brief Illinois School Funding Formula and General State Aid August 2006 For more information please contact Chrissy
Improving Unaccredited Schools in Missouri
 Improving Unaccredited Schools in Missouri A Position Paper by the Cooperating School Districts of Greater St. Louis Executive Summary St. Louis area superintendents urge the state to move beyond providing
Willoughby-Eastlake City Schools 3707 Ridge Road Willoughby, Ohio. Financial Recovery Plan 1/25/12
 1 Willoughby-Eastlake City Schools Willoughby-Eastlake City Schools 3707 Ridge Road Willoughby, Ohio 1/25/12 2 Willoughby-Eastlake City Schools CONTENTS Executive Summary Current Five-Year Forecast Objectives
M D R w w w. s c h o o l d a t a. c o m 8 0 0-3 3 3-8 8 0 2
 MDR s Guide to Federally Funded Education Programs Major federal programs in the Education Budget for Fiscal Year 2011 are listed below. Twenty-three programs were eliminated from the FY2011 budget, including
General Fund Expenditures
 The general fund is used to report all financial expenditures related to the basic education programs and operations of the school system. Expenditures are grouped into object classes and categories as