North American Midstream Infrastructure Through 2035 A Secure Energy Future
|
|
|
- Ferdinand Mason
- 9 years ago
- Views:
Transcription


1 North American Midstream Infrastructure Through 2035 A Secure Energy Future Prepared for the INGAA Foundation June 28, 2011 Kevin R. Petak Vice President ICF International [email protected] David Fritsch Senior Associate ICF International [email protected] E. Harry Vidas Vice President ICF International [email protected]
2 Disclaimer This presentation presents views of ICF International. The presentation includes forward looking statements and projections. ICF has made every reasonable effort to ensure that the information and assumptions on which these statements and projections are based are current, reasonable, and complete. However, a variety of factors could cause actual market results to differ materially from the projections, anticipated results or other expectations expressed in this presentation ICF International. All rights reserved. 2
3 Contents Study Overview Summary of Reference Case Trends Midstream Infrastructure Requirements for Natural Gas Midstream Infrastructure Requirements for Natural Gas Liquids (NGL) and Oil Summary and Conclusions Appendices with NGL, Oil, and Nominal Dollar Slides 3
4 Study Overview 4
5 Study Objectives The objective of this study is to estimate future midstream infrastructure requirements, including natural gas, natural gas liquids, and oil infrastructure through Study is based on a detailed supply/demand outlook for North American energy markets. In the context of this analysis, the midstream includes natural gas gathering, processing, pipeline transportation and storage, and LNG import and export facilities. Bracketing results around a reference case are considered. Provides an update to INGAA Foundation s 2009 infrastructure study. Robust growth in gas production has resulted in more midstream infrastructure development from 2008 through 2010 than the 2009 study had estimated. The study adds NGL and oil infrastructure requirements that were not explicitly considered in the 2009 analysis. So, this study has been initiated to more fully consider recent trends and to more fully investigate the impacts of those trends, particularly robust shale gas development, on future infrastructure requirements. 5
6 Scope of Work This study provides natural gas and liquids infrastructure requirements Provides Regional Supply/Demand Projections Considering Most Current Trends in Gas Markets Provides Well Completion and Production Information for Major Supply Areas Provides Capital Requirements for New Gas Plants and Associated Pipeline Connection Requirements by Region Provides Gas-fired Generation, Gas Use, and Estimates for Number of Gas Power Plants and the Associated Pipeline Connection Requirements by Region Reviews Underground Natural Gas Storage Requirements and Associated Pipeline Connection Requirements by Region Completes Bracketing Case Results on Natural Gas Infrastructure Needs Completes an analysis of NGL and Oil infrastructure Requirements using Production and Well information by Major Supply Area 6
7 Summary of Deliverables Results of a Reference Case projection of infrastructure requirements and their associated expenditures during the next 25 years Projected midstream infrastructure needs from the Reference Case Region requirements for pipelines, storage, gathering, processing, and LNG Facilities Quantification of expenditures and relevant expansion statistics Bracketing of infrastructure needs Summary PowerPoint Presentation that highlights results of analysis Executive Summary style report discussing results 7
8 Study Methodology Study relies on ICF s April 2011 Reference Case for projections. The case projects market changes over time, more specifically, the amount of gas used by sector and region at gas prices that are computed by ICF s Gas Market Model (GMM). Changes in power generation gas use are computed, and an estimate for the number of new gas power plants is provided assuming a prototypical plant. The case also projects supply development and production growth that occurs at the solved market prices. Production projections from the model are cross checked with a vintage production analysis that considers number of wells, well recoveries, and representative decline curves to estimate production trends for about 50 different supply areas. The modeling also projects the amount of gas transmission capacity that is likely to be developed based on the market and supply dynamics from the GMM. 8
9 Study Methodology (continued) From incremental gas production and well completions, the incremental amounts of gathering line and processing capacity have been computed. Gathering line estimates have been derived based on the number of wells and considering the first month and average production from the wells assuming an average feet of line per well. Processing plant capacity is computed based on the average production of wells and the characteristics of the production stream. Number of processing plants is estimated by assuming average plant sizes that are area dependent. The number of laterals needed and the associated pipeline mileage is derived for processing plants. Number of laterals and associated pipeline mileage is derived for power plants. Horsepower requirements are derived separately for each transmission project. Storage capacity is added based on market growth and seasonal price spreads. Unit cost measures have been derived for pipeline and gathering ($/inch mile), horsepower ($/HP), processing capacity ($/MMcfd), and storage ($/Bcf) based on historical expenditure information provided by various sources. Unit cost measures are applied to estimate total expenditures for midstream infrastructure. 9
.")
10 Study Regions Canada Western Central Midwest Northeast Southeast Southwest Offshore EIA s pipeline regions with regions added for Offshore Gulf of Mexico, Canada, and Arctic (Alaska and NWT). This is the same regional format as used in the INGAA 2009 Infrastructure Study. 10
11 Categories of Pipeline Characterized in Study Natural Gas Mainline Pipe New Line New Greenfield New Line Extensions Expansion Looping & Compression Expansion Compression Only Lateral Pipe Power Laterals Storage Field Laterals Gas Plant Laterals Other Laterals (Delivery or receipt area) Gathering Pipe Natural Gas Liquids (NGL) Mainline Pipe Oil Mainline Pipe 11
12 Summary of Reference Case Trends 12
13 Reference Case Overview The ICF April 2011 Reference Case applied as a starting point for this study generally depicts a world in which: Economic growth in the U.S. continues at a rate of 2.8% per year, consistent with the average observed during the past 20 years. U.S. electric load grows at 1.3% per year. Thus, significant growth in gas use occurs, particularly in the power sector where incremental gas fired generation is required to satisfy the electric load growth. Some other gas uses also increase. For example in Canada, incremental gas is needed for oil sands development in Western Canada and for coal to gas plant conversions in Ontario. Continued robust growth in shale gas development makes it possible for the growing market needs to be satisfied. 13
14 Projected Natural Gas Price in Reference Case The Reference Case projects real gas prices that rise from $4 to between $6 and $7 per MMBtu. This price level is sufficiently high to encourage significant gas supply development, but not so high as to significantly limit market growth. The gas price is not low enough to motivate significant amounts of gas for coal substitution in the power sector beyond the amounts that are motivated by environmental policies assumed in the projection. Average Annual Natural Gas Prices at Henry Hub (2010$/MMBtu) $11 $10 $9 $8 $7 $6 $5 $4 $3 $2 $1 $
15 ICF Model Reference Case Compared to the Recently Completed EIA AEO Reference Case ICF Model Reference Case AEO 2011 Reference Case US Natural Gas Production (Tcf) Net Imports (Canada + Mexico + LNG) US Natural Gas Supply (Tcf) Natural Gas Consumption (Tcf) Natural Gas Power Sector (Tcf) Henry Hub Price (2010$/MMbtu) $4.38 $5.59 $7.15 $5.15 $7.21 The ICF case projects significant market growth for natural gas while EIA AEO 2011 projects slower market growth. 15
16 ICF s North American Natural Gas Resource Base (Tcf) In total, the U.S. and Canada have almost 4,000 Tcf of resource that can be economically recovered using current exploration and production (E&P) technologies. At current levels of consumption, this is enough resource for about 140 years. Over 50% of the assumed resource is shale gas. EIA AEO 2011 Resource Base is 2,552 Tcf for the U.S. compared to ICF s 3,105 Tcf ICF International. All rights reserved. U.S. and Canada Natural Gas Resource Base (Tcf of Economically Recoverable Resource, Assuming Current E&P Technologies) Unproved Plus Discovered Undeveloped Total Remaining Resource Proven Reserves Shale Resource 1 Alaska West Coast Onshore Rockies & Great Basin West Texas Gulf Coast Onshore Mid continent Eastern Interior 2, Gulf of Mexico U.S. Atlantic Offshore U.S. Pacific Offshore WCSB Arctic Canada Eastern Canada Onshore Eastern Canada Offshore Western British Columbia US Total , , ,652.5 Canada Total US and Canada Total , , , Shale Resource is a subset of Total Remaining Resource 2. Eastern Interior includes Marcellus, Huron, Utica, and Antrim shale. 3. Reference case assumes drilling levels are constant at today s level over time, reflecting restricted access to the full resource development.
17 Reference Case Assumptions U.S. economy grows at 2.8% per year. Oil prices in the U.S. average about $80 per barrel in real terms. Demographic trends consistent with trends during past 20 years. U.S. population growth averages about 1% per year. Electric load growth averages 1.3% per year. ICF s Base Case reflects one plausible outcome of EPA s proposals for major rules that have been drawing the attention of the power industry these include the Clean Air Transport Rule (for SO 2 and NO X ), air toxics (including mercury), water intake structures and coal combustion residuals (CCR, or ash). It also includes a charge starting in 2018 on CO 2 reflecting the continuing lack of consensus in Congress and the time it may take for direct regulation of CO 2 to be implemented. The case generally leads to retirement and replacement of some coal generating capacity with gas generating capacity. Power plant mix: renewables up to meet state RPS s, coal generation down, and other forms of non-gas generation are slightly down. Gas generation grows to fill the gap between electric load and the total amount of generation from other types of generation. Adoption of DSM programs and conservation and efficiency trends continue, consistent with recent history. CNG vehicles are assumed to be limited to commercial fleets and busses. 17
18 Reference Case Assumptions (continued) Weather assumed to be consistent with past 30 year averages. Gas supply development is permitted to continue at recently observed activity levels no significant restrictions on permitting and fracturing beyond current restrictions. No significant hurricane disruptions to natural gas supply (20-year average). No Arctic projects (specifically no Alaska and Mackenzie Valley gas pipelines). Net LNG exports occur only at the Kitimat facility (no net LNG exports from elsewhere in the U.S. and Canada). Near-term midstream infrastructure development assumed per project announcements. Unplanned projects included when market signals need of capacity, and there are no significant delays in permitting and construction. 18
19 Natural Gas Consumption Total gas consumption is projected to increase at a rate of 1.6% per year By 2035, total gas consumption in the U.S. and Canada is projected to approach an average of 110 Bcf per day. About 75% of the incremental demand growth is in the power sector. Power sector gas consumption is projected to more than double by In aggregate, very little demand growth occurs in the other sectors. U.S. and Canadian Gas Consumption (Average Annual Bcfd) Power Generation Industrial Commercial Residential Other* * Other includes lease, plant, and pipeline fuel gas use. 19
20 Regional Gas Consumption Gas consumption grows by 12.7 Tcf (or 35 Bcfd) by The regions with the greatest increases in gas demand are the Southeast, Northeast, Southwest, and Canada. Demand increases are primarily due to power generation growth, but gas demand in extracting oil from oil sands is a significant share of Canada s growth. Trillion Cubic Feet to to 2035 Billion Cubic Feet per day to to 2035 Northeast Southeast Midwest Central Southwest Western Offshore Arctic Canada US & Canada ICF International. All rights reserved. 20

 U.S.")


21 Regional Natural Gas Demand (Bcfd) U.S. Demand increases are primarily due to power generation growth. Canada s gas demand growth includes gas used in extracting oil from oil sands. 21
22 U.S. Power Generation Capacity (GW) Net Summer Dependable Capacity After Retirements Natural Gas Coal Nuclear Hydro Other Total Gas generating capacity is net up by about 240 GW over the next 25 years. Coal capacity net down by over 45 GW. Nuclear capacity is down by 12 GW. Other types of capacity net up by about 160 GW. 22
23 Natural Gas Supply Onshore conventional and offshore gas production continues to decline, while unconventional production grows robustly. Unconventional production comprises two thirds of the total supply by U.S. and Canadian Natural Gas Supplies (Average Annual Bcfd) LNG Imports Onshore Unconventional Gas Production Onshore Conventional Gas Production 0 Offshore Conventional (primarily Gulf of Mexico)
24 Unconventional Gas Production Unconventional gas production increases by over 40 Bcfd between 2010 and U.S. and Canadian Unconventional Gas Production (Average Annual Bcfd) Over 90% of the increase in unconventional gas production is due to increases in shale gas Shale Gas
25 Shale Gas Production The shale gas plays are among the fastest growing production areas worldwide. Total U.S. and Canada shale gas production is expected to increase from about 13 Bcfd in 2010 to 52 Bcfd by Barnett has been under development for 10 years, while development of Eagle Ford began in The strength of the shale plays was evident during the recession, when development continued despite relatively low natural gas prices U.S. and Canadian Shale Gas Production (Average Annual Bcfd) Marcellus Haynesville 1 Fayetteville Barnett Woodford/ Anadarko Haynesville values shown here include production from other shales in the vicinity, e.g., the Bossier Shale. 25

26 Projected Changes in Gas Flows ( ) Increases in flows from the Gulf Coast to the Southeast are due to increases in Midcontinent shale gas production. REX Pipeline enables increasing flow from the Rocky Mountains eastward. Marcellus gas production growth displaces gas flows into the Northeast U.S. (Shifts within the Northeast are not depicted on this interregional flow map). Declining conventional production in Alberta and increasing gas consumption for oil sands development causes flows from Western Canada to decline. Note that this map does not generally show intra regional pipeline expansions such as those that occur in the Marcellus shale production area. 26
27 Projected Changes in Gas Flows ( ) Substantial increases in flows continue to occur out of the Mid continent shales and the Rocky Mountain producing basins. Marcellus gas production growth continues to displace gas flows into the Northeast U.S. (Shifts within the Northeast are not depicted on this interregional flow map). Flows on TCPL to eastern markets recover slightly, but remain down in the longer term. Note that this map does not show generally intra regional pipeline expansions such as those that occur within the Marcellus shale production area. 27
28 Summary of Key Market Trends in the Reference Case (Tcf) U.S. and Canada % Change 2010 to 2020 % Change 2010 to 2035 Gas Consumption % 47% Gas Use in Power Generation % 129% Gas Production % 48% Conventional Onshore Gas Production % 20% Unconventional Onshore Gas Production % 132% Offshore Production % 2% Shale Gas Production % 308% Net LNG Imports % 120% Net Exports to Mexico % 245% 28
29 Variables that Impact Projected Market Growth While the reference case makes reasonable middle-of-the-road assumptions for each variable, there are alternate assumptions that could affect the projection for market growth. Some variables are potential Big Market Movers, for which a change in assumption would create significantly more or less incremental market growth. Other variables are Smaller Market Movers, which would have less (but still significant) impacts on incremental growth. More Market Growth Less Market Growth Big Market Movers NG passenger vehicles NG trucks Increased economic growth Increased electricity demand growth Increased LNG exports Reduced coal fired capacity Gas to liquids Arctic gas Reduced nuclear capacity Limits on hydraulic fracturing Reduced economic growth Reduced electricity demand growth Increased coal fired capacity Increased nuclear capacity Base Case Smaller Market Movers Oil to gas conversions Increased industrial production Increased population growth Increased Alberta oil sands production Increased conversions of industrial boilers Increased R/C customer growth Decreased R/C efficiency gains Higher oil prices Natural gas hydrates Modest Appalachia drilling constraints Increased shale production costs Rockies access restrictions GOM offshore access restrictions Decreased industrial production Decreased population growth Decreased R/C customer growth Increased R/C efficiency gains Lower oil prices 29
30 Big Market Movers Natural gas passenger vehicles a potentially huge new market for natural gas. Natural gas trucks smaller than the passenger vehicle market, but still significant. Limits on hydraulic fracturing new regulations placing limitations on hydraulic fracturing could have significant negative impact on U.S. gas production. Economic growth increased or decreased GDP growth in the economy would have wide ranging impacts on gas markets. Electricity demand growth the power sector is the source of most of the projected incremental demand growth, so this is a key variable. LNG exports growing U.S. shale gas production may make LNG exports an attractive option for both producers and overseas consumers. Coal-fired capacity changes in environmental policies could result in increased or reduced capacity. Nuclear capacity if units are not retired or retired early and if new units are built. Gas-to-liquids another potential demand market for growing natural gas production. Arctic gas developing Alaska and Mackenzie Delta gas could add significant incremental supplies to the North American market. 30
31 Smaller Market Movers Oil-to-gas conversions high fuel oil prices may encourage additional conversions by residential and commercial consumers to convert heaters, boilers, and other equipment from oil to natural gas. Industrial production compared to GDP growth, changes in industrial production growth would have a smaller, but still significant, impact on gas markets. Population growth - while not necessarily a major driver of market growth, the population growth rate may also impact economic activity. Regional shifts of population and immigration policy could also introduce uncertainty on gas market growth. Increased conversions of industrial boilers an increase in the number of coal-fired boilers that convert to natural gas would have an impact on this subset of total industrial gas demand. Residential/Commercial customer growth changes in the number of R/C customer additions would affect demand growth, but are somewhat offset by end-use efficiency gains. Residential/Commercial end-use efficiency per customer gas use has been declining, but the rate of decline could be faster or slower in the future. Alberta oil sands producing oil from the oil sands requires significant quantities of natural gas, so accelerating production growth would increase gas demand. Increased shale production costs even if drilling activity is not expressly limited, new regulations that increase costs of shale drilling could limit market growth. Modest Appalachia drilling constraints constraints on drilling activity in Appalachia, such as a limit on new permits, would limit production growth from Marcellus and Utica shale. Rockies access restrictions additional access restriction in the Rockies would hamper supply development in this key growth region. Gulf of Mexico offshore access restrictions while offshore production is not expected to grow, production could decline significantly if deep water drilling does not return to pre-2010 levels or is impaired by regulations. Natural gas hydrates while a potentially huge supply source, gas hydrate production is not currently technically or commercially competitive. Oil Prices higher or lower oil prices are expected to have relatively little impact on gas market growth. 31
32 Midstream Infrastructure Requirements for Natural Gas 32

33 Interregional Pipeline Expansions Roughly 29 Bcfd of incremental pipeline capacity is built from 2011 to 2020 and from 2021 to 2035 an additional 14 Bcfd is built. A total of 43 Bcfd of incremental pipeline is needed to accommodate increasing gas supply that is necessary to satisfy market needs over time. Note that these maps do not generally show intra regional pipeline expansions such as those that occur within the Marcellus shale production area. 33


34 Miles of New Pipeline Added Most new pipe (about 16,500 miles) is gathering line, which is generally smaller diameter pipe that is planned for and financed as part of upstream project development. An average of almost 2,000 miles of new transmission line are added each year, which is well within the range of recent years.. Roughly 1,400 miles per year are mainline miles, while about 600 miles per year are for lateral connections to power plants, processing plants, and other facilities. 34


35 Inch Miles of New Pipeline Added On an inch mile basis, about 110,000 inch miles of lines are added each year, breaking out as: Approximately 40,000 inch miles of transmission line. Approximately 60,000 inch miles of gathering line. Approximately 10,000 inch miles of laterals from processing plants and to power plants. 35

36 Miles of Transmission Mainline (Excluding Laterals) By Region (1000 Miles) 16.4 Thousand Miles 35.6 Thousand Miles The Central region which includes the Rocky Mountains gets the largest share of the new transmission pipe, followed closely by the Southwest and Southeast regions. Much of the new mainline capacity is required to make transport of growing shale gas production possible. 36
37 Miles of Gathering Pipe By Region (1000 Miles) 165 Thousand Miles 414 Thousand Miles Over 30 percent of new gathering line will be concentrated in the Southwest, but other areas where shale gas production is growing like the Northeast (Marcellus shale) and Canada (Montney and Horn River shales) also require significant amounts of new gathering lines. 37
38 Miles of Laterals Needed to Hook Up New Gas Power Plants Almost 600 laterals and about 8,500 miles of new gas delivery capability to new gas power plants will be needed over the next 25 years. Cumulative Additions from 2010 New Gas Builds (GW) Plant Connections Miles of Laterals , , , , ,520 Assumes 15 Miles of 24 pipeline per plant. Note: Upstream mainline capacity to support service to these laterals is included In the transmission mainline slide. 38

39 Miles of Laterals to Gas Power Plants 3,465 Miles 8,520 Miles Regionally, gas power plant additions and their associated pipeline laterals are concentrated in the southern part of the continent, with the Southeast and Southwest accounting for half of the new builds. 39
40 Gas Processing Plant Additions Cumulative from 2010 Change in Gas Production (Tcf) Change in Gas Production (Bcfd) New Plants Added Additional Gas Plant Capacity (Bcfd) Gas Plant Expenditures Billions 2010$ $ $ $ $ $21.2 Large production growth in natural gas from shale formations and previously unproduced frontier areas will require additional gas plant infrastructure over what is simply needed to maintain existing production levels. Roughly 240 new processing plants with over 32 Bcfd of processing capability is needed to process much of the incremental gas production occurring over the next 25 years. Capital costs of the new processing plants will exceed $20 billion. 40
41 Regional Gas Processing Plant Capacity Added (Bcfd) 18.1 Bcfd 32.5 Bcfd A large portion of the new processing plant capacity is added in the Southwest where production is growing in a number of shale formations. However, changes in production elsewhere, for example in the Marcellus in the Northeast and in the Horn River and Montney shales in Western Canada also yield significant growth in processing plant requirements. 41

42 Pipeline Compression Additions Horsepower Added Each Year An average of 200,000 Horsepower of compression per year is added over the next 25 years. 42
43 Regional Breakout for Added Pipeline Compression (1000 HP) 3,039 Thousand Horsepower 4,946 Thousand Horsepower Many regions have significant compression additions as pipelines are enhanced in a number of locations. 43

44 Underground Gas Storage Additions By Region and Storage Field Type (Bcf) 589 Bcf of Working Gas Capacity Additions Almost 600 Bcf of new gas storage capacity will be needed during the next 25 years. Much of the new capacity will be needed to park growing gas supplies until the market needs the supplies as load changes across seasons and across days. Storage additions are regionally widespread. 44
45 Summary of Incremental Gas Infrastructure Added in the Reference Case (cumulative) 2011 to to 2035 Average Annual Inter regional Pipeline Capacity (Bcfd) Miles of Transmission Mainline (1000s) Miles of Laterals to/from Power Plants, Storage Fields and Processing Plants (1000s) Miles of Gathering Line (1000s) Inch Miles of Transmission Mainline (1000s) 491 1, Inch Miles of Laterals to/from Power Plants, Storage Fields and Processing Plants (1000s) Inch Miles of Gathering Line (1000s) 592 1, Compression for Pipelines (1000 HP) 3,039 4, Gas Storage (Bcf Working Gas) NA Processing Capacity (Bcfd)


46 Costs for All Pipelines and Compression/Pumping All Costs Reported in 2010 Dollars Projected costs of pipelines and compression on a real dollar per inch mile and a real dollar per horsepower basis. Pipeline costs are assumed to remain constant at about $90,000 per inch mile in real 2010$. Compression costs are assumed to remain constant at about $1,800 per HP in real 2010$. 46

47 Capital Expenditures for New Gas Pipeline Million dollars (Real 2010$) Spent Each Year, Including the Cost of Compression Between 2005 and 2010, pipeline expenditures averaged $8.8 Billion per year in real 2010 dollars. Annual pipeline expenditures are projected to be between $4 and $13 billion per year between 2011 and Of the $178 billion of projected investment between 2011 and 2035, roughly 50 percent is for new transmission lines. Capital expenditures for the new pipeline infrastructure projected here average about $7 billion per year in real 2010 dollars. If upstream gathering lines are excluded, average annual capital expenditures for new pipeline are $5.5 billion per year in real 2010 dollars. 1. Pipeline project costs are represented in the year the project enters service. While in actuality, pipeline investment costs are generally spread over one or more years leading up to a project entering service. 1 47
48 Regional Breakout for Accumulated Capital Expenditures for New Gas Pipeline Capacity $82.3 Billion over 10 years $178.3 Billion over 25 years The largest investment in new pipelines occurs in the supply areas of the Southwest and Central regions, followed closely by the Southeast and Northeast which are demand regions with access to growing supply. 48
49 Expenditures for New Gas Storage Capacity All Values in Real 2010 Dollars Regional Comparison of Costs (Index =1.0) Storage Costs for in Millions of 2010$ per Bcf of Working Gas Capacity Field Type Expansion New Salt Cavern $8.7 $10.9 Depleted Reservoir $6.3 $8.6 Aquifer $14.2 $17.2 $4.8 Billion over 25 years Cost for gas storage projects are flat in real 2010 dollars per Bcf of Working Gas Capacity. Excludes pipeline connection cost. Capital expenditures for new gas storage capacity total nearly $5 billion over the next 25 years. 49
50 Natural Gas Infrastructure Capital Requirements (Billions of 2010$) Natural Gas Infrastructure Capital Requirements (Billions of 2010$) 2011 to to 2035 Average Annual Expenditures Gas Transmission Mainline $46.2 $97.7 $3.9 Laterals to/from Power Plants, Gas Storage and Processing Plants $14.0 $29.8 $1.2 Gathering Line $16.3 $41.7 $1.7 Gas Pipeline Compression $5.6 $9.1 $0.3 Gas Storage Fields $3.6 $4.8 $0.2 Gas Processing Capacity $12.4 $22.1 $0.9 Total Gas Capital Requirements $98.1 $205.2 $8.2 Recent historical trends have matched or surpassed the average annual expenditures shown here. 50

51 Regional Gas Infrastructure Capital Requirements for 2011 to 2020 (Billions of 2010$) Capital Requirements for new gas infrastructure total $98 billion over the next 10 years. 51
52 Regional Gas Infrastructure Capital Requirements for 2011 to 2035 (Billions of 2010$) Capital Requirements for new gas infrastructure total $205 billion over the next 25 years. 52
53 Results for Midstream Infrastructure Requirements for Oil and Natural Gas Liquids (See Appendix A for Details of the Oil and NGL Projection) 53
54 Premises for NGL Infrastructure Analysis Refinery production of Ethane, Propane, and Butane is unchanged over time. Natural gas plant liquids are produced as a function of natural gas production trends and gas composition. The natural gas oil price ratio is assumed to remain low enough to make ethane extraction economic for all new gas supplies. Demand for propane and butane grows by 1 percent per year in US and Canada. Any excess propane and butane is exported. Since exports occur mostly from the Gulf Coast, pipeline infrastructure needs would be the same as if Gulf Coast refineries/petrochem demand increased to sop up Propane/Butane supplies (and exports are zero). All of the incremental ethane production is used for ethylene cracking. Regional pattern of demand is same as in An alternative premise would be to assume that ethylene crackers are built in or near the Appalachian Basin (and less NGL pipeline would be needed). All pentanes+ increases are used in US and Canadian refineries. Seasonal variability is not considered in the flows. To the extent that US East supplies own propane/butane, local underground LPG storage may have to be built. Otherwise Midcon/Gulf storage may be utilized (with a increase in pipeline flows back and forth) 54
55 U.S. and Canada Oil Production Growth Oil production is projected to increase by 1.7 percent annually through The largest areas of production growth include Western Canada and the north eastern Rocky Mountains. Nearly all of Canada s oil production growth comes from increases of bitumen and synthetic crude production from oil sands which will account for over 85 percent of western Canada oil production in 2035 (versus 65 percent in 2010). The Rocky Mountains have several areas where oil production is projected to grow significantly, i.e., by 925 MBpd. These include the Bakken and Three Forks shale formations in North Dakota and Montana, the Niobrara shale formation in Denver, Powder River, and Green River basins of Wyoming, Colorado and Utah. Oil production is also projected to grow significantly from the Eagle Ford shale of South Texas, the Avalon, Bone Springs and Wolfberry plays (West Texas) the Utica shale (Ohio, Pennsylvania and West Virginia), and other tight oil plays. Production from all forms of tight oil (oil shales and associated low permeability carbonates and sands) is projected to reach 2,386 MBpd of crude oil and condensate by
56 Premises for Crude Oil Infrastructure Analysis Demand for crude oil at US refineries would follow slowly declining trajectory in EIA s AEO. Canadian crude runs would stay constant at 2010 levels. Runs within each PADD or Canadian province would not change dramatically from 2010 levels. In other words, regional trade in products would not shift. This premise avoids the issue of having to build new or expand existing refinery capacity. However, refinery upgrades due to changing crude slates may be needed. Another premise is that North America would use its own crude first, so all increases in North American crude oil production will back out imports. These assumptions mean that due to decline in AK crude production, West Coast refineries need to get more crude supplies from Canada or the Rockies. The case results presented here assume that crude comes from WCSB via pipeline to western British Columbia and ships to California from there. Alternative configurations are possible in which CA imports more oil and WCSB oil is exported. This would likely reduce infrastructure changes. Transport of oil from wellhead to pipeline/rail terminals is assumed to be predominantly by truck, so no estimate is made for the capital cost of new oil gathering line. 56
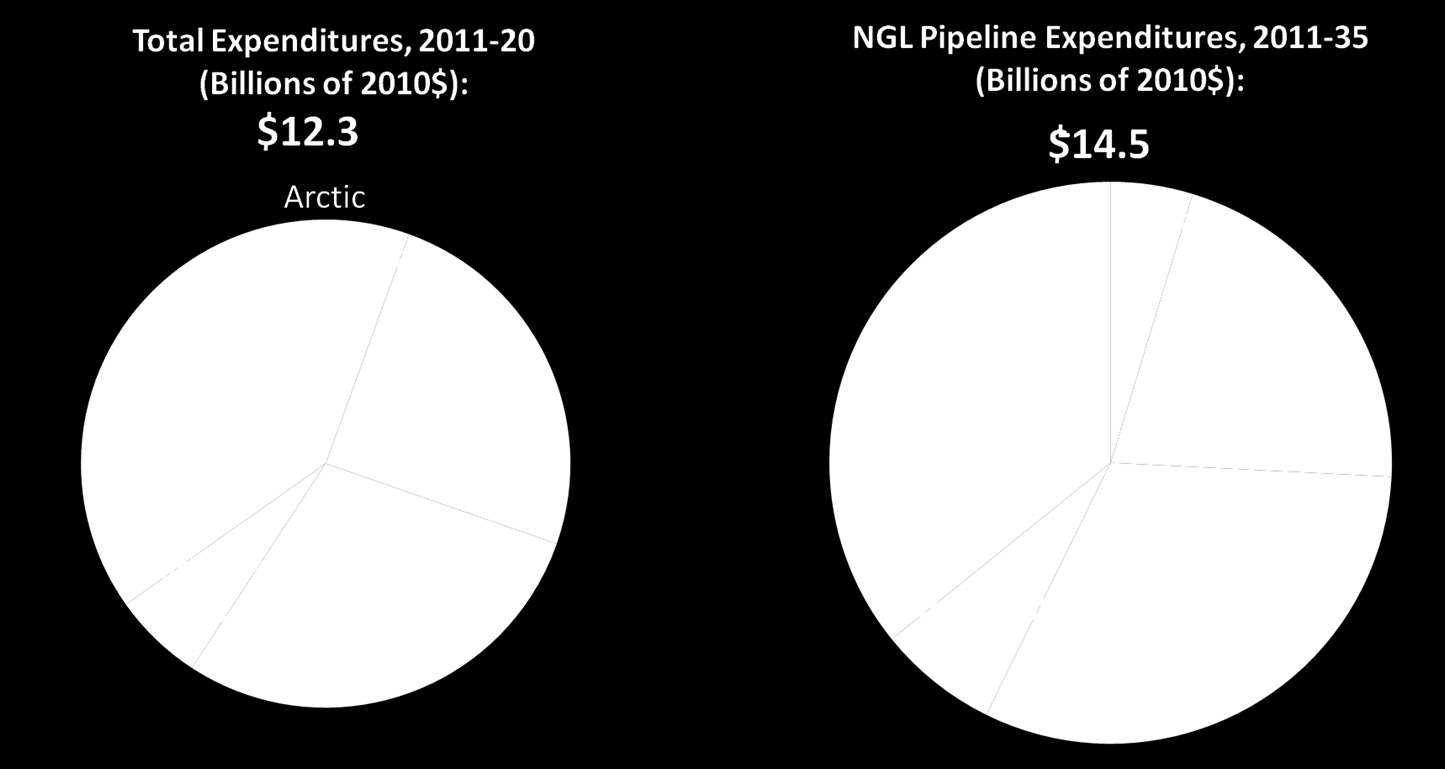
57 NGL and Oil Infrastructure Capital Requirements NGL Pipeline Infrastructure Average Annual Miles of Transmission Mainline (1000s) Cost of Transmission Mainline (Billions 2010$) $12.3 $14.5 $0.6 Oil Pipeline Infrastructure Average Annual Miles of Transmission Mainline (1000s) Cost of Transmission Mainline (Billions 2010$) $19.6 $31.4 $1.3 NGL and Oil Pipeline Infrastructure Average Annual Miles of Transmission Mainline (1000s) Cost of Transmission Mainline (Billions 2010$) $31.9 $45.9 $1.8 57

58 Regional NGL Pipeline Expenditures 58

59 Regional Oil Pipeline Expenditures 59
60 Oil and NGL Infrastructure Needs The oil and gas industry will need to invest roughly $50 Billion (2010$) over the next 25 years in pipeline infrastructure for the transport of oil and NGLs to consumers of these products. This is in addition to the $205 Billion dollar investment by this industry in natural gas transport, processing, and storage. Oil and NGL infrastructure will require over 30 thousand miles and 500 thousand inch miles over the next 25 years. The average pipe size is approximately 16 inch diameter, where oil pipelines are generally larger than the average and NGL pipelines smaller than the average. Comparing oil and NGL infrastructure needs with natural gas for a total oil and gas industry view, the inch miles of oil and NGL pipelines are roughly one third of the mainline required by the industry through 2035, and through 2020 the share for liquids pipelines is about 40 percent. Investment in both oil and gas mainlines is projected to be over $150 Billion dollars through 2035 or approximately $6 Billion dollars per year, of which roughly onethird is for oil and natural gas liquids. 60
61 Oil and NGL Share of Total Oil and Gas Mainline Transmission Expenditures New pipelines for Oil and NGL growth represent 30 to 40 percent of all mainline expenditures in the combined projection. 61
62 Cost of Infrastructure Added in the Combined Natural Gas and Liquids Reference Case (Billions of 2010$) Cost of Infrastructure Added in the Combined Natural Gas and Liquids Reference Case (Billions of 2010$) 2011 to to 2035 Average Annual Expenditures Gas Transmission Mainline $46.2 $97.7 $3.9 Laterals to/from Power Plants, Gas Storage and Processing Plants $14.0 $29.8 $1.2 Gathering Line $16.3 $41.7 $1.7 Gas Pipeline Compression $5.6 $9.1 $0.3 Gas Storage Fields $3.6 $4.8 $0.2 Gas Processing Capacity $12.4 $22.1 $0.9 Sub Total of Gas Capital Requirements $98.1 $205.2 $8.2 Oil Transmission $19.6 $31.4 $1.3 NGL Transmission $12.3 $14.5 $0.6 Total Gas and Liquids Capital Expenditure $130.0 $251.1 $
63 Summary and Conclusions 63
64 Summary of Key Market Trends in the Reference Case (Tcf) U.S. and Canada % Change 2010 to 2020 % Change 2010 to 2035 Gas Consumption % 47% Gas Use in Power Generation % 129% Gas Production % 48% Conventional Onshore Gas Production % 20% Unconventional Onshore Gas Production % 132% Offshore Production % 2% Shale Gas Production % 308% Net LNG Imports % 120% Net Exports to Mexico % 245% 64
65 Summary of Incremental Gas Infrastructure Added in the Reference Case (cumulative) 2011 to to 2035 Average Annual Inter regional Pipeline Capacity (Bcfd) Miles of Transmission Mainline (1000s) Miles of Laterals to/from Power Plants, Storage Fields and Processing Plants (1000s) Miles of Gathering Line (1000s) Inch Miles of Transmission Mainline (1000s) 491 1, Inch Miles of Laterals to/from Power Plants, Storage Fields and Processing Plants (1000s) Inch Miles of Gathering Line (1000s) 592 1, Compression for Pipelines (1000 HP) 3,039 4, Gas Storage (Bcf Working Gas) NA Processing Capacity (Bcfd) Inch Miles of Oil & NGL Mainline (1000s)
66 Cost of Infrastructure Added in the Combined Natural Gas and Liquids Reference Case (Billions of 2010$) Cost of Infrastructure Added in the Combined Natural Gas and Liquids Reference Case (Billions of 2010$) 2011 to to 2035 Average Annual Expenditures Gas Transmission Mainline $46.2 $97.7 $3.9 Laterals to/from Power Plants, Gas Storage and Processing Plants $14.0 $29.8 $1.2 Gathering Line $16.3 $41.7 $1.7 Gas Pipeline Compression $5.6 $9.1 $0.3 Gas Storage Fields $3.6 $4.8 $0.2 Gas Processing Capacity $12.4 $22.1 $0.9 Sub Total of Gas Capital Requirements $98.1 $205.2 $8.2 Oil Transmission $19.6 $31.4 $1.3 NGL Transmission $12.3 $14.5 $0.6 Total Gas and Liquids Capital Expenditure $130.0 $251.1 $
67 Conclusions The ICF Reference Case projects significant gas market growth, particularly in the power sector where gas use doubles over the next 25 years. Significant infrastructure will be needed to support growing long run demand in many regions including the Southeast, Northeast, Southwest and Canada. The case also projects significant supply development and growth in gas production, primarily from shale resources. Producers are also likely to develop shale plays with large quantities of oil and natural gas liquids, which have needs for new pipeline infrastructure in addition for those required for natural gas. Key to this projection are gas prices that rise from $4 per MMBtu in real terms to between $6 and $7 per MMBtu in the longer-term. This gas price level is sufficiently high to foster the development of incremental gas supplies while not so high as to significantly limit market growth. The ICF Reference Case represents a middle of the road case where a variety of variables could change and result in more or less gas market growth. 67
68 Conclusions (continued) Midstream infrastructure development in the environment projected in the reference case is relatively robust. From 2010 through 2035: Approximately 43 Bcfd of new transmission capability. Approximately 1,400 miles per year of new gas transmission mainline. Approximately 550 miles per year of new laterals to/from power plants, processing facilities, and storage fields. Approximately 16,500 miles per year of new gathering line. Approximately 1.3 Bcfd per year of new processing capability. Almost 25 Bcf per year of new working gas capacity. About 200,000 HP per year for pipeline compression. Over 5 MMBpd of new oil transmission capacity. Approximately 800 miles per year of new oil transmission line. About 2 MMBpd of new NGL transmission capacity. Approximately 500 miles per year of new NGL transmission line. 68
69 Conclusions (continued) Expenditures for the incremental infrastructure projected here are significant but similar to those observed in recent years.: Over $251 billion (Real 2010$) or about $10 billion per year of total capital expenditures are required over the next 25 years for the combined natural gas and liquids outlook. $3.9 billion, or almost 40 percent of this amount is required for new or expanded gas mainline capacity. $1.2 billion per year required for laterals. $1.7 billion per year needed for gathering lines. $0.9 billion per year required for processing plants. $1.3 billion per year for new oil pipelines. $0.6 billion per year for new NGL pipelines. Pipeline compression and storage fields account for the remainder of the capital requirements. Roughly one-third of the mainline infrastructure requirement will be for oil and natural gas liquids pipelines. The future environment for market growth and supply development hinges on a number of key assumptions, many of which are uncertain. 69
70 Appendix A: Details from Midstream Infrastructure Requirements for Oil and Natural Gas Liquids 70
71 Recent US Ethylene Feedstock Inputs, Approximate Byproduct Ratios Average (July December 2010) US Ethylene Feed Slate (1,000 bpd) Ethane Propane n Butane 41.9 Naptha, Gas Oil Total 1,588.1 Ethylene from US Steam Crackers (billion pound per month) LPG Crackers 1.59 Multi feed 2.81 Total 4.40 Co product Propylene from US Steam Crackers (billion pounds per month) LPG FEEDS NGO FEEDS Total Output by Weight for Each Ethylene Cracker Feedstock Ethane Propane Butane Naptha Ethylene Propylene Butylene Butadiene Hydrogen Methane Gasoline Gas Oil Total Output Products Theoretical bbl/tonne Ethylene Source: Petral Consulting; Oil and Gas Journal, March and ICF estimates. 71
72 Overall North American NGL Balances (bpd) % p.a to 2035 Ethane NGP Production 1,073,254 1,286,366 1,509,740 1,646,562 1,772,061 1,899, % Ethane Refinery Production 20,367 20,367 20,367 20,367 20,367 20, % Ethane Consumption (US+Can) 1,093,621 1,306,733 1,530,107 1,666,929 1,792,428 1,919, % Net Imports (Exports) % Propane NGP Production 674, , , ,608 1,053,689 1,122, % Propane Refinery Production 619, , , , , , % Propane Consumption (US+Can) 1,223,755 1,286,179 1,351,787 1,420,742 1,493,214 1,569, % Net Imports (Exports) 69, , , , , , % Butane Production 411, , , , , , % Butane Refinery Production 130, , , , , , % Butane Consumption (US+Can) 543, , , , , , % Net Imports (Exports) 1,088 29,497 55,299 58,679 56,282 54, % Pentanes+ Production 416, , , , , , % Pentanes+ Refinery Production 17,710 17,710 17,710 17,710 17,710 17, % Pentanes+ Consumption (US+Can) 390, , , , , , % Net Imports (Exports) 8,578 8,578 8,578 8,578 8,578 8, % All NGPL Production 2,575,820 3,032,221 3,481,870 3,758,544 4,008,869 4,265, % All Refinery Production 753, , , , , , % All Consumption (US+Can) 3,251,566 3,620,095 3,992,582 4,259,944 4,517,057 4,783, % Net Imports (Exports) 77, , , , , , % 72
73 Regional All Gas Plant Liquids Production Trends (bpd) Node Name Node Number % p.a to 2035 New England 1A Mid Atlantic 1B 3,137 82, , , , , % DE MD VA WV 1C 20,959 47,581 68,645 83,310 98, , % South Atlantic 1D MI IN OH 2A 6,023 10,865 28,133 51,499 74,905 99, % KY TN 2B 6,173 5,912 5,809 5,801 5,613 5, % Illinois 2C 65,548 64,001 63,718 63,327 62,968 62, % Upper Midwest (MN WI) 2D North and South Dakota 2E 19,633 68,804 91, , , , % Central Plains (NE KS IA MO) 2F 51,610 38,321 33,716 30,248 27,506 27, % Oklahoma Cushing 2G 211, , , , , , % AL MS 3A 65,197 64,449 65,257 65,921 66,434 67, % Gulf Coast Texas and Louisiana 3B 373, , , , , , % West Texas and NM Permian 3C 431, , , , , , % North New Mexico 3D 84,914 76,143 67,418 58,776 50,515 42, % Northeast Texas, North LA, Ark 3E 256, , , , , , % Eastern Rockies (DJB) 4A 26,722 41,915 54,799 64,912 74,108 82, % Baker Powder River 4B 15,920 55,380 80,284 96, , , % Billings 4C 12,244 10,781 10,274 9,546 9,014 8, % Salt Lake City Green River 4D 162, , , , , , % Southwestern Rockies 4E 127, , , , , , % Western U.S. 5A 27,703 25,037 22,124 24,173 26,961 31, % Pacific Northwest 5B Alaska 5C 31,607 34,755 37,636 39,998 42,145 44, % Western Canada 6A 567, , , , , , % Montreal 7A Sarnia 7B 7,092 7,092 7,092 7,092 7,092 7, % Sum Gas Plant Liquids 2,575,820 3,032,221 3,481,870 3,758,544 4,008,869 4,265, % 73

74 Major NGL Flow Patterns
75 Major NGL Flow Patterns
76 Major NGL Flow Patterns
77 Major NGL Change in Flow Patterns 77
78 Major NGL Change in Flow Patterns 78
79 NGL Pipeline Infrastructure A significant number of pipeline expansions and new pipelines are under development to accommodate growing NGL production. Many of these projects are in areas like the Gulf Coast, West Texas, and Oklahoma, which have a significant amount of existing pipeline infrastructure. Rapid growth in emerging shale and tight gas formations like the Eagle Ford or Granite Wash, is putting a strain on existing infrastructure, and creating a need for expansions. Other areas that will need new pipeline capacity for NGLs, both in the short and the long term, are the frontier shale plays like Marcellus, Utica, Bakken, and Niobrara. These liquids rich plays do not have much existing capacity and will require significant investment. Roughly 80 percent of the new NGL infrastructure requirements will be in these areas. This projection builds roughly 2 million barrels per day of new natural gas liquids transmission lines between 2010 and
80 Overall North American Crude Oil and Lease Condensate Balances (bpd) Production 8,346,583 9,238,937 10,621,826 11,382,251 12,024,555 12,741,672 Imports 7,782,546 6,630,456 5,106,754 4,155,596 3,425,162 2,845,953 Refinery Runs 16,129,129 15,869,394 15,728,580 15,537,847 15,449,716 15,587,625 80
81 US Liquid Fuels Supply and Disposition from AEO (million barrels per day, unless otherwise noted) Supply and Disposition %ch p.a. Crude Oil Domestic Crude Production 1/ % Alaska % Lower 48 States % Net Imports % Gross Imports % Exports % Other Crude Supply 2/ Total Crude Supply (US Refinery Runs) % Other Petroleum Supply % Natural Gas Plant Liquids % Net Product Imports % Gross Refined Product Imports 3/ % Unfinished Oil Imports % Blending Component Imports % Exports % Refinery Processing Gain 4/ % Product Stock Withdrawal Other Non-petroleum Supply % Supply from Renewable Sources % Ethanol % Domestic Production % Net Imports % Biodiesel % Domestic Production % Net Imports Other Biomass derived Liquids 5/ Liquids from Gas Liquids from Coal Other 6/ % US Crude Oil and Petroleum Liquids Balance from AEO (Million Barrels per day) Only AEO data used for this study is refinery runs. Total Primary Supply 7/ % Liquid Fuels Consumption by Fuel Liquefied Petroleum Gases % E85 8/ % Motor Gasoline 9/ % Jet Fuel 10/ % Distillate Fuel Oil 11/ % of which: Diesel % Residual Fuel Oil % Other 12/ % by Sector Residential and Commercial % Industrial 13/ % Transportation % Electric Power 14/ % Total % 81
82 Regional Crude & Condensate Production Trends (bpd) Node Name Node Number % p.a to 2035 New England 1A Mid Atlantic 1B 10,400 21,860 36,956 50,607 62,842 73, % DE MD VA WV 1C 5,333 10,177 17,210 23,836 29,736 34, % South Atlantic 1D 4,747 5,523 6,040 6,182 6,157 6, % MI IN OH 2A 38,320 57, , , , , % KY TN 2B 7,250 7,003 6,810 6,748 6,668 6, % Illinois 2C 24,373 20,165 21,661 20,003 17,819 16, % Upper Midwest (MN WI) 2D North and South Dakota 2E 304, , , , , , % Central Plains (NE KS IA MO) 2F 115, , , , , , % Oklahoma Cushing 2G 183, , , , , , % AL MS 3A 84,106 97, , , , , % Gulf Coast Texas and Louisiana 3B 2,015,476 1,789,262 2,084,271 2,197,059 2,364,903 2,526, % West Texas and NM Permian 3C 971,189 1,096,044 1,126,817 1,102,549 1,067,352 1,043, % North New Mexico 3D 6,814 7,167 6,211 4,728 3,095 1, % Northeast Texas, North LA, Ark 3E 163, , , ,216 99,571 88, % Eastern Rockies (DJB) 4A 54, , , , , , % Baker Powder River 4B 100, , , , , , % Billings 4C 64,753 61,489 58,668 55,506 52,674 51, % Salt Lake City Green River 4D 48,826 39,017 55,427 51,852 57,314 68, % Southwestern Rockies 4E 87, , , , , , % Western U.S. 5A 621, , , , , , % Pacific Northwest 5B Alaska 5C 599, , , , , , % Western Canada 6A 2,550,283 3,312,979 4,295,167 4,845,639 5,374,428 5,664, % Montreal 7A 282, , , , , , % Sarnia 7B 1,468 1,468 1,468 1,468 1,468 1, % Sum US & Can. Crude and Condensate 8,346,583 9,238,937 10,621,826 11,382,251 12,024,555 12,741, % 82
83 Major Crude & Condensate Flow Patterns
84 Major Crude & Condensate Flow Patterns

85 Major Crude & Condensate Flow Patterns
86 Major Crude & Condensate Change in Flow 86
87 Major Crude & Condensate Change in Flow 87
88 Oil Pipeline Infrastructure The current trend of building new pipelines to deliver oil from Western Canada to the refineries of the Central US and Gulf Coast is expected to continue. The two Keystone projects (the first is complete and the second Keystone XL is waiting final approval in the US to begin construction in 2012) will increase capacity from western Canada by 1.3 Million Barrels per day and should accommodate the growth for the next 10 to 20 years. Significant pipe capacity is also built to the Pacific Coast to facilitate exports from ports in British Columbia. Additional oil pipeline capacity is also built out of the Rockies, but no where near the amount needed from western Canada. Over 5 Million Barrels per Day of new oil transmission capacity will be required between 2010 and 2035, in addition to reversing capacity on some existing oil pipes where changes in supply sources affect oil movement patterns. 88
89 Appendix B: Nominal Dollar Slides 2010 ICF International. All rights reserved. 89


90 Costs of Pipelines and Compression All Costs Reported in Nominal Dollars Projected costs of pipelines and compression on a nominal dollar per inch mile and a nominal dollar per horsepower basis start off in 2011 at levels that are consistent with average costs over the prior five years and are projected to rise at a rate that is consistent with inflation (i.e., they are projected to remain constant in real terms). Pipeline costs rise from about $90,000 per inch mile to about 170,000 per inch mile by Compression costs rise from about $1,700 per HP to about $3,500 per HP by
91 Gas Processing Plant Additions Cumulative from 2010 Change in Gas Production (Tcf) Change in Gas Production (Bcfd) New Plants Added Additional Gas Plant Capacity (Bcfd) Gas Plant Expenditures Billions $ $ $ $ $ $29.3 Roughly 240 new processing plants with over 32 Bcfd of processing capability is needed to process much of the incremental gas production occurring over the next 25 years. Capital costs of the new processing plants almost of $30 billion. Large production growth in natural gas from shale formations and previously unproduced frontier areas will require additional gas plant infrastructure over what is simply needed to maintain the existing production levels. 91

92 Capital Expenditures for New Pipeline Capacity Million dollars (Nominal$) Spent Each Year, Including the Cost of Compression Between 2005 and 2010, pipeline expenditures averaged $8.5 Billion per year in nominal dollars. Annual pipeline expenditures are projected to be between $7 and $15 billion per year between 2011 and Of the $24 billion of projected investment between 2011 and 2035, roughly 50 percent is for new transmission lines. Capital expenditures for the new pipeline infrastructure projected here average about $10 billion per year in nominal dollars. If upstream gathering lines are excluded, average annual capital expenditures for new pipeline are $7.4 billion per year in nominal dollars. 1. Pipeline project costs are represented in the year the project enters service. While in actuality, pipeline investment costs are generally spread over one or more years leading up to a project entering service. 1 92
93 Regional Breakout for Capital Expenditures for New Pipeline Capacity $93.7Billion over 10 years $242.6 Billion over 25 years The largest investment in new pipelines occurs in the supply areas of the Southwest and Central, followed closely by the Southeast and Northeast which are demand regions with access to growing supply. 93
94 Expenditures for New Gas Storage Capacity Pie Chart in Nominal Dollars Regional Comparison of Costs (Index =1.0) Storage Costs for in Millions of Nominal$ per Bcf of Working Gas Capacity Field Type Expansion New Salt Cavern $8.5 $10.7 Depleted Reservoir $6.2 $8.4 Aquifer $13.9 $16.9 Nominal storage projects cost are escalated at 2.5% per year. Excludes pipeline connection cost. $5.4 Billion over 25 years Capital expenditures for new gas storage capacity total over $5 billion over the next 25 years. 94
95 Natural Gas Infrastructure Capital Requirements from 2010 (Billions of Nominal$) 2011 to to 2035 Average Annual Expenditures Transmission Mainline $52.4 $131.9 $5.3 Laterals to/from Power Plants, Gas Storage and Processing Plants $16.2 $40.5 $1.6 Gathering Line $18.7 $58.6 $2.3 Pipeline Compression $6.3 $11.7 $0.5 Gas Storage Fields $3.9 $5.4 $0.2 Processing Capacity $14.0 $29.3 $1.2 Total Gas Capital Expenditure $111.5 $277.4 $11.1 Recent historical trends have matched or surpassed the average annual expenditures shown here. 95
96 Oil Pipeline Infrastructure Added in Reference Case (Cumulative) Oil Pipeline Infrastructure Average Annual Miles of Transmission Mainline (1000s) Cost of Transmission Mainline (Billions $) $22.5 $ NGL Pipeline Infrastructure Average Annual Miles of Transmission Mainline (1000s) Cost of Transmission Mainline (Billions $) $14.4 $17.9 $0.7 Oil and NGL Pipeline Infrastructure Average Annual Miles of Transmission Mainline (1000s) Cost of Transmission Mainline (Billions $) $36.9 $60.4 $2.4 96
97 Regional NGL Pipeline Expenditures in Nominal Dollars 97
98 Regional Oil Pipeline Expenditures, in Nominal Dollars 98

99 Oil and NGL Share of Total Gas Infrastructure Cost Main Line Transmission Expenditures New pipelines for Oil and NGL growth are expected to represent 30 to 40 percent of all main transmission line expenditures in the projection. 99
100 Cost of Infrastructure Added in the Combined Natural Gas and Liquids Reference Case (Billions of Nominal$) Cost of Infrastructure Added in the Combined Natural Gas and Liquids Reference Case (Billions of Nominal$) 2011 to to 2035 Average Annual Expenditures Gas Transmission Mainline $52.4 $131.9 $5.3 Laterals to/from Power Plants, Gas Storage and Processing Plants $16.2 $40.5 $1.6 Gathering Line $18.7 $58.6 $2.3 Gas Pipeline Compression $6.3 $11.7 $0.5 Gas Storage Fields $3.9 $5.4 $0.2 Gas Processing Capacity $14.0 $29.3 $1.2 Sub Total of Gas Capital Requirements $111.5 $277.4 $11.1 Oil Transmission $22.5 $42.5 $1.7 NGL Transmission $14.4 $17.9 $0.7 Total Gas and Liquids Capital Expenditure $148.4 $337.8 $
101 North American Midstream Infrastructure Through 2035 A Secure Energy Future Prepared for the INGAA Foundation June 28, 2011 Kevin R. Petak Vice President ICF International [email protected] David Fritsch Senior Associate ICF International [email protected] E. Harry Vidas Vice President ICF International [email protected]
North American Natural Gas Midstream Infrastructure Through 2035: A Secure Energy Future
 North American Natural Gas Midstream Infrastructure Through 2035: A Secure Energy Future Updated Supply Demand Outlook Background Executive Summary June 28, 2011 Sufficient midstream natural gas infrastructure,
Natural Gas: Winter 2012-13 Abundance! and Some Confusion
 Natural Gas: Winter 2012-13 Abundance! and Some Confusion NASEO Winter Fuels Outlook Washington, D.C. October 10, 2012 Bruce B. Henning Vice President, Energy Regulatory and Market Analysis [email protected]
North American Midstream Infrastructure through 2035: Capitalizing on Our Energy Abundance. An INGAA Foundation Report, Prepared by ICF International
 North American Midstream Infrastructure through 2035: Capitalizing on Our Energy Abundance An INGAA Foundation Report, Prepared by ICF International Executive Summary March 18, 2014 Background Since the
Suzanne Minter. Manager, Oil and Gas Consulting BENTEK Energy. Natural Gas Outlook
 Suzanne Minter Manager, Oil and Gas Consulting BENTEK Energy Natural Gas Outlook North American Natural Gas The Fertilizer Institute November, 2014 2013 Platts, McGraw Hill Financial. All rights reserved.
Natural Gas Pipeline and Storage Infrastructure Projections Through 2030
 Natural Gas Pipeline and Storage Infrastructure Projections Through 2030 October 20, 2009 Submitted to: The INGAA Foundation, Inc. 10 G Street NE Suite 700 Washington, DC 20002 Submitted by: ICF International
U.S. Energy Outlook. Oil and Gas Strategies Summit May 21, 2014 New York, NY. By Adam Sieminski, EIA Administrator
 U.S. Energy Outlook May 21, 214 New York, NY By Adam Sieminski, EIA Administrator U.S. Energy Information Administration Independent Statistics & Analysis www.eia.gov The U.S. has experienced a rapid increase
Join Together With Demand:
 A RBN Energy Drill Down Report Copyright 2015 RBN Energy Join Together With Demand: The Who and How of Marcellus/Utica Midstream MarkWest Processing and Fractionation Plants 1. Introduction RBN Pipeline
Natural Gas Monthly. October 2015. Office of Oil, Gas, and Coal Supply Statistics www.eia.gov. U.S. Department of Energy Washington, DC 20585
 Natural Gas Monthly October 2015 Office of Oil, Gas, and Coal Supply Statistics www.eia.gov U.S. Department of Energy Washington, DC 20585 This report was prepared by the U.S. Energy Information Administration
Gas/NGL Developments from Western Canada to the US Midwest
 Gas/NGL Developments from Western Canada to the US Midwest Purvin & Gertz International LPG Seminar March 7, 2012 Tim Stauft, President Aux Sable Canada About Alliance/Aux Sable Alliance is a 1.6 bcf/d
Natural Gas Monthly. May 2016. Office of Oil, Gas, and Coal Supply Statistics www.eia.gov. U.S. Department of Energy Washington, DC 20585
 Natural Gas Monthly May 2016 Office of Oil, Gas, and Coal Supply Statistics www.eia.gov U.S. Department of Energy Washington, DC 20585 This report was prepared by the U.S. Energy Information Administration
LONG-TERM ASSESSMENT OF NATURAL GAS INFRASTRUCTURE TO SERVE ELECTRIC GENERATION NEEDS WITHIN ERCOT
 LONG-TERM ASSESSMENT OF NATURAL GAS INFRASTRUCTURE TO SERVE ELECTRIC GENERATION NEEDS WITHIN ERCOT Prepared for The Electric Reliability Council of Texas JUNE 2013 Black & Veatch Holding Company 2011.
AVAILABILITY, ECONOMICS, AND PRODUCTION POTENTIAL OF NORTH AMERICAN UNCONVENTIONAL NATURAL GAS SUPPLIES
 AVAILABILITY, ECONOMICS, AND PRODUCTION POTENTIAL OF NORTH AMERICAN UNCONVENTIONAL NATURAL GAS SUPPLIES Prepared for The INGAA Foundation, Inc. by: ICF International 9300 Lee Highway Fairfax, VA 22031
The Growth of U.S. Natural Gas: An Uncertain Outlook for U.S. and World Supply
 The Growth of U.S. Natural Gas: An Uncertain Outlook for U.S. and World Supply For 2015 EIA Energy Conference Washington, D.C. By John Staub, Team Lead, Exploration and Production Analysis U.S. Energy
Outlook for the North American and Ontario Gas Markets
 Outlook for the North American and Ontario Gas Markets Union Gas Customer Meeting London, Ontario June 5, 2014 Presented by: Frank Brock Senior Energy Market Specialist ICF International [email protected]
LNG Poised to Significantly Increase its Share of Global Gas Market David Wood February 2004 Petroleum Review p.38-39
 LNG Poised to Significantly Increase its Share of Global Gas Market David Wood February 2004 Petroleum Review p.38-39 For the past few years LNG has experienced high levels of activity and investment in
REVIEW OF NATURAL GAS SUPPLY PORTFOLIO OPTIONS FOR CENTRA GAS CENTRA GAS MANITOBA, INC.
 Page 1 of 106 REVIEW OF NATURAL GAS SUPPLY PORTFOLIO OPTIONS FOR CENTRA GAS Prepared for: CENTRA GAS MANITOBA, INC. Submitted By: ICF INTERNATIONAL 9300 Lee Highway Fairfax, VA 22031 USA (703) 218-2758
Natural Gas. Shale Gas Impacts. Natural Gas Liquids (NGLs) Dan Brockett Penn State Extension
 Dan Brockett Penn State Extension") Natural Gas Shale Gas Impacts Natural Gas Liquids (NGLs) Dan Brockett Penn State Extension Natural Gas Liquids Natural Gas Liquids (NGLs) are found in wet gas or rich gas areas of shale gas producing regions.
Natural Gas Shale Gas Impacts Natural Gas Liquids (NGLs) Dan Brockett Penn State Extension Natural Gas Liquids Natural Gas Liquids (NGLs) are found in wet gas or rich gas areas of shale gas producing regions.
OUR CONVERSATION TODAY
 OUR CONVERSATION TODAY Our goal is to raise the level of awareness around the natural gas supply chain among key stakeholders in order to facilitate positive working relationships and more informed decision
And Then There Was Abundance: Examining Natural Gas in 2012. Bruce McDowell Director, Policy Analysis American Gas Association bmcdowell@aga.
 And Then There Was Abundance: Examining Natural Gas in 2012 Bruce McDowell Director, Policy Analysis American Gas Association [email protected] NOTICE: In issuing and making this presentation and publication
A Case for Midstream Energy
 Case Studies March 2014 Listed Infrastructure: A Case for Midstream Energy Case Studies is a Cohen & Steers series that evaluates compelling investment themes in our various sectors of expertise. This
Issue. September 2012
 September 2012 Issue In a future world of 8.5 billion people in 2035, the Energy Information Administration s (EIA) projected 50% increase in energy consumption will require true all of the above energy
PIPELINE FUNDAMENTALS. texaspipelines.com
 PIPELINE FUNDAMENTALS texaspipelines.com Texas Oil & Gas: Generating $2.6 Billion for State Revenues texaspipelines.com Texas Oil & Gas Texas produces 20% of US Domestic Oil Production 1.1 Million Barrels
Displacement of Coal with Natural Gas to Generate Electricity
 Displacement of Coal with Natural Gas to Generate Electricity The American Coalition for Clean Coal Electricity (ACCCE) supports a balanced energy strategy that will ensure affordable and reliable energy,
Modeling the US Natural Gas Network
 Modeling the US Natural Gas Network James Ellison Sandia National Laboratories, Critical Infrastructure Modeling and Simulation Group Abstract In order to better understand how the US natural gas network
Upstream Developments Generate Growing Hydrocarbon Gas Liquids Supply! Alan Farquharson, SVP - Reservoir Engineering & Economics!
 Upstream Developments Generate Growing Hydrocarbon Gas Liquids Supply! Alan Farquharson, SVP - Reservoir Engineering & Economics! June 16, 2015 Forward-Looking Statements Certain statements and information
Inter Pipeline Fund Announces Strong Third Quarter 2009 Results
 News Release Inter Pipeline Fund Announces Strong Third Quarter 2009 Results CALGARY, ALBERTA, NOVEMBER 5, 2009: Inter Pipeline Fund ( Inter Pipeline ) (TSX: IPL.UN) announced today its financial and operating
Son of a Beast Utica Triggers Regional Role Reversal
 Son of a Beast Utica Triggers Regional Role Reversal KEYTAKEAWAYS Son of a Beast Utica Triggers Regional Role Reversal Overview only. Contact BENTEK to subscribe. For more information about BENTEK s industry-leading
Gulf Natural Gas Region
 Gulf Gas Market: Overview and Focal Points Page 1 of 15 Gulf Natural Gas Region Colonial Gas Mainline TX NGPL TXOK Carthage LA Waha Tennessee Zone 0 Katy Freeport Cameron Sabine Pass Henry Texas Eastern
Luke Saban, Peregrine Midstream Partners. Gas Storage Strategies Financing new asset development and expansion
 Luke Saban, Peregrine Midstream Partners Gas Storage Strategies Financing new asset development and expansion How are developers raising capital for new asset construction: Good projects with contracted
US Ethane and Ethylene Exports & Markets Report
 US Ethane and Ethylene Exports & Markets Report Introduction With the development of shale gas and oil the U.S. production landscape has experienced a dramatic shift over the last 5 years. There has been
Keeping Our Options Open: Markets for Canadian Crude and the Pipeline Dilemma
 Keeping Our Options Open: Markets for Canadian Crude and the Pipeline Dilemma Trisha Curtis, Research Analyst Energy Policy Research Foundation, Inc. (EPRINC) CERI Oil Conference 2012 April 23 rd, 2012
Platts 3 rd Annual Midstream Development & Management Conference - Houston, Texas
 Platts 3 rd Annual Midstream Development & Management Conference - Houston, Texas Rodney L. Waller Senior Vice President May 21, 2010 Platts 3 rd Annual Midstream Development & Management Conference l
Natural Gas Markets in 2006
 Order Code RL33714 Natural Gas Markets in 2006 Updated December 12, 2006 Robert Pirog Specialist in Energy Economics and Policy Resources, Science, and Industry Division Natural Gas Markets in 2006 Summary
Energy Value Chains. What is a Value Chain?
 Energy s Overview of Fundamentals Center for Energy Economics, UT-Austin. No reproduction, distribution or attribution without permission. 1 What is a? The process of linking specific functions from input
Effect of Increased Natural Gas Exports on Domestic Energy Markets
 Effect of Increased Natural Gas Exports on Domestic Energy Markets as requested by the Office of Fossil Energy January 2012 This report was prepared by the U.S. Energy Information Administration (EIA),
Canadian Oil Sands. Enhancing America s Energy Security
 Canadian Oil Sands Enhancing America s Energy Security May 2011 The importance of Canada s oil sands stems from the value of oil to our economy and energy security. Global demand for energy continues to
The Economic Benefits of Natural Gas Pipeline Development on the Manufacturing Sector
 IHS ECONOMICS The Economic Benefits of Natural Gas Pipeline Development on the Manufacturing Sector Prepared for the National Association of Manufacturers May 2016 Consulting Report ECR Private Report
How To Build A Gas Plant
 1 NGL Fractionation & Storage Phoenix Energy Marketing Consultants Inc. 2 Fractionation & Storage 1. Storage 3 Fractionation & Storage Important part of the liquids transportation infrastructure NGLs must
NATURAL GAS PRICES TO REMAIN AT HIGHER LEVELS
 I. Summary NATURAL GAS PRICES TO REMAIN AT HIGHER LEVELS This brief white paper on natural gas prices is intended to discuss the continued and sustained level of natural gas prices at overall higher levels.
Understanding. Natural Gas Markets
 Understanding Natural Gas Markets Table of Contents Overview 1 The North American Natural Gas Marketplace 3 Understanding Natural Gas Markets Natural Gas Demand 9 Natural Gas Supply 12 Summary 25 Glossary
Challenges and Opportunities for Small Businesses Engaged in Energy Development and Energy Intensive Manufacturing
 Statement of Toby Mack, EEIA President, Before the U.S Senate Committee on Small Business and Entrepreneurship July 14, 2015 Challenges and Opportunities for Small Businesses Engaged in Energy Development
Weekly Petroleum Status Report
 DOE/EIA-0208(2013-04) Distribution Category UC-98 Data for Week Ended: January 25, 2013 Weekly Petroleum Status Report EIA DATA ARE AVAILABLE IN ELECTRONIC FORM The tables in the Weekly Petroleum Status
Suncor Denver Refinery Overview
 Suncor Denver Refinery Overview COQA June 10, 2010 Randy Segato Denver Refinery Suncor History Integration Projects Project Odyssey Crude Qualities Suncor Synthetics Canadian Heavy Colorado Sweet other
Transforming America s Energy Future. Kentucky. Energy Statistics. Developed by
 Transforming America s Energy Future Kentucky Energy Statistics Developed by 2 2 Summary The first edition of Kentucky Energy Statistics is offered by the National Association for State Energy Officials
Outlook for Oil and Natural Gas Markets
 Outlook for Oil and Natural Gas Markets Helen Currie, PhD Senior Economist Legislative Finance Committee State of New Mexico 09-July-2014 Farmington, New Mexico Cautionary Statement The following presentation
Oil and Gas Terms. Anticline: An arch of stratified rock layers that may form a trap for hydrocarbons.
 Oil and Gas Terms American Petroleum Institute (API): The API is the trade organization for the oil and gas industry, which establishes standards governing industry operations, safety and the manufacturing
Sabal Trail Transmission, LLC
 FGU 2014 ANNUAL MEETING JUNE 25, 2014 Sabal Trail Transmission, LLC Connecting diverse natural gas supplies to southeast markets Josh Browning Changing Natural Gas Flows Value of capacity increases with
Natural Gas, Natural Gas Liquids, and Crude Trends Primer
 Natural Gas, Natural Gas Liquids, and Crude Trends Primer 31 October 2013 Alerian 1717 McKinney Avenue Suite 1450 Dallas, TX 75202 www.alerian.com PRODUCTION NATURAL GAS PRIMER TRANSPORTATION LNG EXPORT
LECET MARKET SUMMARY NATURAL GAS PIPELINE DEPLOYMENT
 LECET MARKET SUMMARY NATURAL GAS PIPELINE DEPLOYMENT MARKET FUNDAMENTALS The market for the construction of natural gas pipelines continues to be strong and promises significant growth in the United States
Spectra Energy Builds a Business
 » Introducing Spectra Energy Builds a Business CEO Fowler on Challenges Ahead By Martin Rosenberg Natural gas once again looms as an important fuel for electricity generation, given a spate of cancellations
EIA s U.S. Crude Oil Import Tracking Tool: Selected Sample Applications
 EIA s U.S. Crude Oil Import Tracking Tool: Selected Sample Applications November 2014 Independent Statistics & Analysis www.eia.gov U.S. Department of Energy Washington, DC 20585 This report was prepared
A Look at Western Natural Gas Infrastructure During the Recent El Paso Pipeline Disruption
 A Look at Western Natural Gas Infrastructure During the Recent El Paso Pipeline Disruption This analysis examines the impact of the August 2000 El Paso Natural Gas Pipeline system disruption upon the ability
Investment Options for Crude & Condensate Stabilization and Splitting
 Investment Options for Crude & Condensate Stabilization and Splitting Ryan M. Couture Senior Consultant 2015 AFPM Annual Meeting March 23, 2015 San Antonio, TX Presentation Outline U.S. Production and
Will the Marcellus/Utica Overtake the Henry Hub? U.S. Natural Gas Price Volatility in 2015 & Beyond
 Will the Marcellus/Utica Overtake the Henry Hub? U.S. Natural Gas Price Volatility in 2015 & Beyond Presented by Natural Gas Intelligence & Observ Commodities April 7, 2015 Presented by Patrick C. Rau,
The Economic Benefits of Oil and Natural Gas Production: An Analysis of Effects on the United States and Major Energy Producing States
 August 2014 The Economic Benefits of Oil and Natural Gas Production: An Analysis of Effects on the United States and Major Energy Producing States THE PERRYMAN GROUP 510 N. Valley Mills Dr. Suite 300 Waco,
Spectra Energy Reports Second Quarter 2014 Results Quarter in Line with Company Plans; On Track to Exceed Full-Year EBITDA Targets
 Date: August 6, 2014 Spectra Energy Reports Second Quarter 2014 Results Quarter in Line with Company Plans; On Track to Exceed Full-Year EBITDA Targets 12 percent increase in distributable cash flow quarter-over-quarter
Electricity Sources. Coal Fleet
 This paper is called Coal Facts because it provides factual information and data related to coal-based electricity. Most of the data are taken from independent third party sources, such as the Energy Information
Oil and Gas U.S. Industry Outlook
 Oil and Gas U.S. Industry Outlook VERSION 01 YEAR 13 OUTLOOK: Positive fundamentals & outlook www.eulerhermes.us Key points WTI Crude is expected to continue to converge to Brent crude prices, narrowing
OPTIONS FOR COMMERCIAL GAS DEVELOPMENT OF MARGINAL FIELDS
 OPTIONS FOR COMMERCIAL GAS DEVELOPMENT OF MARGINAL FIELDS Gabriel N. Bujulu Principal Petroleum Engineer TANZANIA PETROLEUM DEVELOPMENT CORPORATION PRESENTATION OUTLINE! Introduction! Origin of Natural
(713) 627-5353 (713) 627-4747 (24-hour media line) (713) 627-4600. Date: May 3, 2013
 627-5353 (713) 627-4747 (24-hour media line) (713) 627-4600. Date: May 3, 2013") Media: Analysts: Caitlin Currie (713) 627-5353 (713) 627-4747 (24-hour media line) John Arensdorf (713) 627-4600 Date: May 3, 2013 Spectra Energy Reports First Quarter 2013 Results Reported net income
Media: Analysts: Caitlin Currie (713) 627-5353 (713) 627-4747 (24-hour media line) John Arensdorf (713) 627-4600 Date: May 3, 2013 Spectra Energy Reports First Quarter 2013 Results Reported net income
CBRE CLARION SECURITIES MASTER LIMITED PARTNERSHIPS: GLOBALIZATION OF ENERGY MARKETS LEADING TO SECULAR GROWTH
 CBRE CLARION SECURITIES MASTER LIMITED PARTNERSHIPS: GLOBALIZATION OF ENERGY MARKETS LEADING TO SECULAR GROWTH MAY 2014 201 King of Prussia Road, Suite 600 Radnor, PA 19087 USA T. 610.995.2500 www.cbreclarion.com
Representation of LPG Retail Costs TAFV Model Technical Note DRAFT David Bowman, Paul Leiby, and Jonathan Rubin
 February 5, 1998 Representation of LPG Retail Costs TAFV Model Technical Note DRAFT David Bowman, Paul Leiby, and Jonathan Rubin This note summarizes the treatment of the supply of Liquid Petroleum Gas
An Investigation of Natural Gas as a Substitute for Diesel in Heavy Duty Trucks and Associated Considerations
 1 An Investigation of Natural Gas as a Substitute for Diesel in Heavy Duty Trucks and Associated Considerations Muneer Mohammad, Student Member, IEEE, Mehrdad Ehsani, Fellow, IEEE Abstract In this paper,
Natural Gas as a Chemical Industry Fuel and Feedstock: Past, Present, Future (and Far Future)
") Natural Gas as a Chemical Industry Fuel and Feedstock: Past, Present, Future (and Far Future) Jeffrey J. Siirola Eastman Chemical Company Kingsport, TN 37662 Fuel and Feedstock Natural gas is the fuel
Natural Gas as a Chemical Industry Fuel and Feedstock: Past, Present, Future (and Far Future) Jeffrey J. Siirola Eastman Chemical Company Kingsport, TN 37662 Fuel and Feedstock Natural gas is the fuel
REFINING U.S. PETROLEUM
 REFINING U.S. PETROLEUM A SURVEY OF U.S. REFINERY USE OF GROWING U.S. CRUDE OIL PRODUCTION March 2015 A Report by American Fuel & Petrochemical Manufacturers Survey Conducted by Veris Consulting Charles
Global Oil and Gas Capital Expenditure Outlook 2010: National Oil Companies (NOCs) to Drive Investment
 to Drive Investment") Global Oil and Gas Capital Expenditure Outlook 21: GlobalData s new report Global Oil and Gas Capital Expenditure Outlook 21: National Oil Companies (NOCs) to Drive Investment provides in-depth analysis
Global Oil and Gas Capital Expenditure Outlook 21: GlobalData s new report Global Oil and Gas Capital Expenditure Outlook 21: National Oil Companies (NOCs) to Drive Investment provides in-depth analysis
J.P. Morgan Energy Conference
 J.P. Morgan Energy Conference June 27, 2016 Don Marchand, Executive Vice President, Corporate Development and Chief Financial Officer Forward Looking Information and Non-GAAP Measures This presentation
OUR CONVERSATION TODAY
 OUR CONVERSATION TODAY Our goal is to raise the level of awareness around the oil supply chain among key stakeholders in order to facilitate positive working relationships and more informed decision making.
Unconventional Oil and Gas Production Drives Trends in Water Management and Treatment
 Unconventional Oil and Gas Production Drives Trends in Water Management and Treatment Jelena Stanic, Global Water Intelligence A research report, Water for the Onshore Oil and Gas, by Global Water Intelligence
Thank you for the kind introduction, and congratulations to the organizers of ANIQ for completing another very successful annual forum.
 Thank you for the kind introduction, and congratulations to the organizers of ANIQ for completing another very successful annual forum. Today, I am going to discuss Wood Mackenzie s view about the opportunities