Missouri River Bed Degradation Study
|
|
|
- Maximilian Parker
- 7 years ago
- Views:
Transcription
1 Missouri River Bed Degradation Study Greater Kansas City Post Industry Day Education & Training Workshop 28 January BUILDING STRONG
2 Presentation Contents Background Impacts Data Potential Causes 2 BUILDING STRONG
3 Bed Degradation Impacts 3

4 Examples of Degradation Impacts Power Plant Intakes Required Modification Public Water Supply Intakes Required Modification Tributary Erosion River Bank Instability Pipeline Crossings Exposed Drainage Outfall Structure Instability 4

5 Degradation Exposing Bridge Pier Footings 5

6 Tributary Head-cutting Causing Bank Failure on Tributary 6

7 Degrading River Creating a Perched Outlet 7
8 Concerns for the Future Bank Failures Continued Tributary Head Cutting Power Plant Water Intakes Problems Levees and Floodwalls Placed in Jeopardy Water Supply Intakes Continue to Require Modifications Pipeline Crossings Impacted Additional Tributary Bridge Crossings at Risk Navigation Obstructions Exposed Loss Missouri River Recovery Shallow Water Habitat Lower Groundwater Levels Damage Wetlands Water Supply Groundwater Pumping Costs Increase 8
9 Data 9
10 Existing Data Sources Aerial Photography Historical Hydrographic Surveys Low Water Profiles USGS Gathered Data from Discharge Measurements 10 BUILDING STRONG

11 September 23,

12 Current Google Earth Image 12
13 Missouri River Cross-Section RM Bed Elevation in Feet Distance From Left Bank in Feet BUILDING STRONG 13
14 Missouri River Mile Missouri River Cross-Section RM Elevation in Feet Distance from Left Bank in Feet 14
15 Lower Missouri River Low Water Profiles 1990 and 2005 (Adjusted to Common Construction Reference Plane Discharges) Water Surface Elevation in Feet Difference???? River Miles 1990 Profile 2005 Profile 15
16 Change in Low Water Profile 1990 to 2005 Change in Low Water Profile Between 1990 and Rulo St. Joseph Kansas City Waverly Boonville Hermann St. Charles (- Degradation) Change in Feet (+ Aggradation) 38,900 cfs 40,600 cfs 44,200 cfs 45,100 cfs 48,300 cfs 55,900 cfs River Miles Above Mouth BUILDING STRONG
17 USGS Discharge Measurements U.S. DEPARTMENT OF THE INTERIOR - U.S. GEOLOGICAL SURVEY - WATER RESOURCES Long-Form Discharge Measurement Summary STATION NUMBER Missouri River at Kansas City, MO SOURCE AGENCY USGS STATE 29 COUNTY 095 LATITUDE LONGITUDE NAD83 DRAINAGE AREA CONTRIBUTING DRAINAGE AREA DATUM NGVD29 Date Processed: :08 By jloewel Meas+ACM-: 4940 STAGE: 7.12 RATED: F IND. SHIFT: RAT ANLY Q: STATUS: L DATE: 2008/01/16 DISCH: GHCH: 0.0 APP. SHIFT: 1.03 AUX. GH: TIME: 1352 CST QCODE: MEAS TIME: 0.2 BASE +ACU-DIFF: STD. SEC. AREA: PARTY: JBW/TEH RATING: BAFLOW: UNSP SHFT +ACU-DIFF: 0.0 STD. SEC VEL: MEAN INDEX VEL: CONTROL LOCATION: CONTROL CONDITION: Clear CONTROL REMARKS: MEASUREMENT REMARKS: CHANNEL 1 : NAME: Unspecified LOC: UNSP Q METH: QADCP HORIZ DIST: UNSP TYPE: UNSP DISCH: VEL. METH: VADCP VEL DESC: UNSP WIDTH: 752 AREA: 9720 MEAN VEL: ACU-MEAS: NAV METH: UNSP WATER MODE: UNSP COEFF VAR: CELL SIZE: CHANNEL CONDITION: Unspecified 17
18 Average Bed Elevation Based on Hydraulic Depth from USGS Kansas City, MO Average Bed Elevation Year 18 BUILDING STRONG
19 Mean Bed Elevation From Multiple USGS Measurements Average Bed Kansas City Missouri River Mile Bed Elevation Year 19
20 Average Bed USGS Stream Gages Missouri River Referenced to a Common Stage of 15 feet in 1950 Bed Stage in Feet (1950 bed stage = 15 ft.) Rulo 15.0 Waverly 14.0 St. Joseph Boonville 10.0 Hermann Kansas City Year Rulo St Joseph Kansas City Waverly Boonville Hermann 20 BUILDING STRONG
21 Missouri River at St. Joseph USGS Gage Measured Discharges Water Surface Elevation in Feet to to to to to to ,000 10, ,000 1,000,000 Discharge in CFS BUILDING STRONG 21
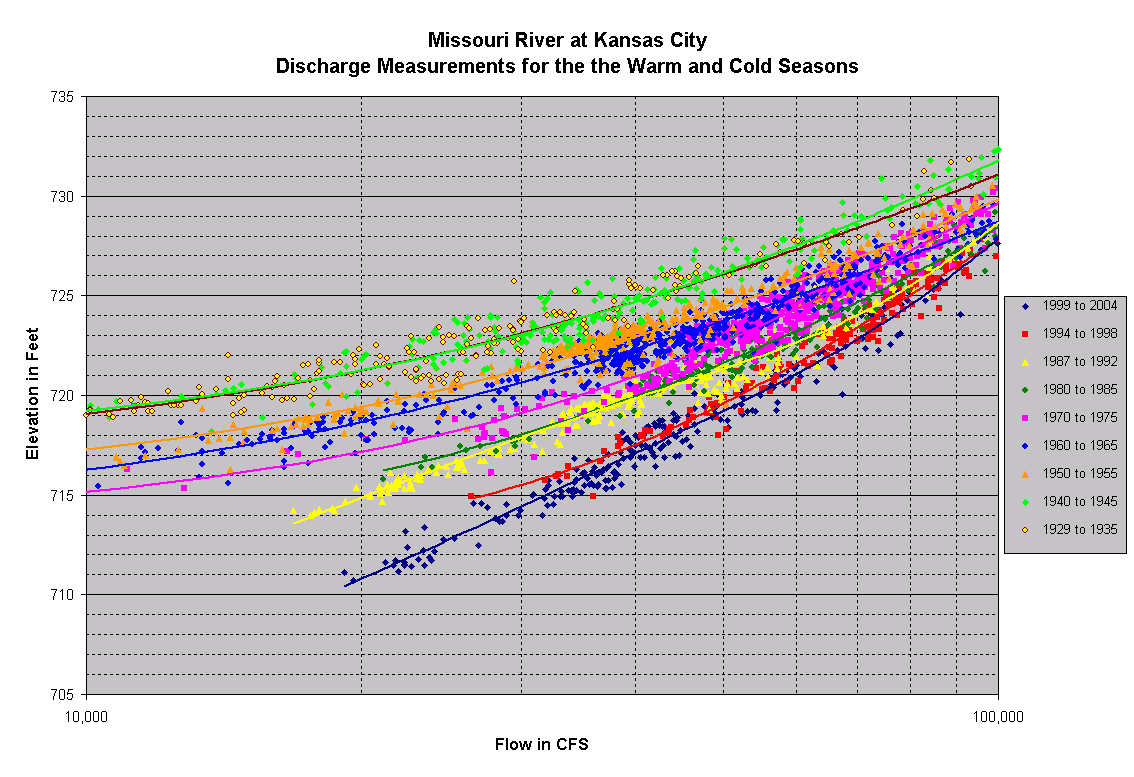
22 760.0 Missouri River at Kansas City USGS Gage Measured Discharges Water Surface Elevation in Feet to to to to to to ,000 10, ,000 1,000,000 Discharge in CFS BUILDING STRONG 22
23 Missouri River at Waverly USGS Gage Measured Discharges Water Surface Elevation in Feet to to to to to to ,000 10, ,000 1,000,000 Discharge in CFS 23 BUILDING STRONG
24 24

25 Water Surface Elevation 25
26 Potential Causes 26
27 Potential Causes of Degradation (listed in general historical sequence) Land Use Changes Dikes and Revetment Construction (Navigation) River Cut-Offs Major Flood Events Missouri River and Tributaries Dam Construction Flow Modification by Reservoir Regulation Commercial Sand/Aggregate Dredging 27
28 Dikes and Revetment Construction (Bank Stabilization and Navigation Project) 28 BUILDING STRONG
29 Dikes and Revetment Construction (Bank Stabilization and Navigation Project) The dikes and revetments were designed primarily to maintain an open navigatable channel during times of low flow. This results in sediments that would ordinarily be deposited for a given discharge being transported downstream. The lack of stream bed recovery is consistent with the design and function of the dikes and revetments. 29
30 Dikes and Revetments Kansas City Reach Kansas City reach has required additional dikes and the accompanying flow restrictions to support navigation. Resulted in a very constrictive dike system to maintain a navigation channel. River that is very efficient at cleaning and maintaining the low-flow channel. Modifications lowering the channel bed either natural or man induced are unlikely to return to pre-event levels. 30
31 New Dikes Miles of Revetment Dike Extensions Year Number % of Total Length % of Total Number % of Total NA NA NA NA NA NA NA NA 31
32 Dike Installation History (Dikes are rocks structures generally perpendicular to river flow.) Dike Installation Over Time % % Number Completed % 60% 40% 20% % Date 32 BUILDING STRONG
33 Summary (Bank Stabilization and Navigation Project Impacts) Drastically changed the Missouri River channel Degraded low flow channel Inhibits deposition in degraded reaches Essentially complete in 1980s 33 BUILDING STRONG
34 River Cut-Offs 34
35 35
36 Name River Cut-off Locations and Extents Pre Cut- Off Slope ft/mi ~ River Mile Miles Cut-Off Date of Cut-Off Napoleon Bend Blue River Bend Liberty Bend Jackass Bend ~ ~ ~ ~ St. Joseph ~ Total Miles ~
37 River Mile before Cut-Off BUILDING STRONG 37 Average Invert Elevation Cut-off
38 Potential erosion Average Invert Elevation Cut-off ΔB Slope before cut-off River Mile after Cut-Off 38
39 39
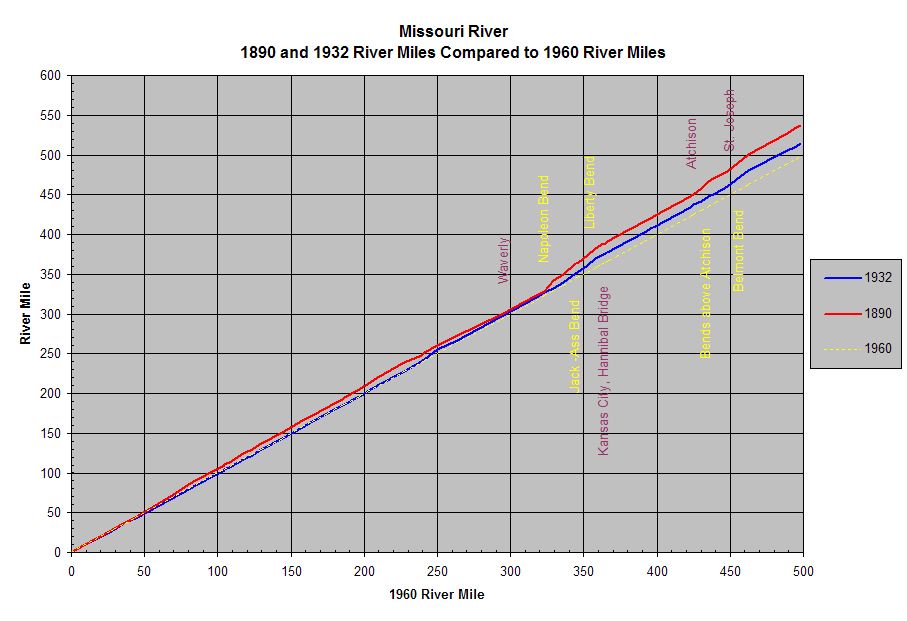
40 Missouri River Change in River Mile River Mile BUILDING STRONG 1890 to to to Change in River Mile Kansas City, Hannibal Bridge Atchison St. Waverly Napoleon Bend Jack -Ass Bend Liberty Bend Bends above Atchison Belmont Bend

41 Cut Offs Above River Mile
")
42 Napoleon Bend Cut Off (RM 324) 42

43 Napoleon Bend (natural cut-off in 1915) 43

44 Jackass Bend Cut Off (RM 337) 44

45 Jackass Bend Cut-Off (RM 337) 45

46 Liberty Bend Cut Off (RM 352) 46

47 Liberty Bend Cut-Off (RM 352) 47
")
48 Big Blue Bend Cut Off (RM 357) 48
")
49 St. Joseph Cut Off (RM 450) 49
 St.")
50 St. Joseph Bend Cut Off (RM 450) St. Joseph, MO 50
51 Summary (Cut-Offs) Cut-offs have contributed to degradation in certain reaches of the river. These reaches have also been altered in character by the construction of dikes and revetments. This constraining of the river placed additional stresses on the stream bed. Detailed data not available/analyzed to fully quantify. 51
52 Major Flood Events 52
53 Average Bed Elevation Based on Hydraulic Depth from USGS Kansas City, MO Average Bed Elevation Year 53 BUILDING STRONG
54 Major Flood Events at KC Average Bed Elevation Based on USGS Flow Measurements (out of bank flows yield erroneously high average bed elevation values) Average Bed El. (based on hydraulic depth) Flood 2007 Flood Flood Discharge above 200,000 cfs Date of Measurement Ave. Bed Daily Discharge Poly. (Ave. Bed) 0 54
55 Major Flood Events at KC Average Bed Elevation Based on USGS Flow Measurements (out of bank flows yield erroneously high average bed elevation values) Average Bed El. (based on hydraulic depth) Flood 1952 Flood Flood Discharge above 200,000 cfs Date of Measurement Ave. Bed Daily Discharge Linear (Ave. Bed) BUILDING STRONG 0 55
56 Major Flood Events 18 Missouri River at Kansas City Stage Trends Before and After the 1993 Flood Fitted Linear Functions Stage (feet) ,000 20,000 30,000 40,000 50,000 60,000 Discharge (cfs) BUILDING STRONG 56
57 12 Missouri River at Kansas City Stage Trends Before and After May 2007 Flood (Q<48,000 CFS) R 2 = R 2 = Stage in Feet R 2 = 0.97 After May 2007 Flood May 2006 through Apr 2007 May 2005 through Apr ,000 20,000 25,000 30,000 35,000 40,000 45,000 50,000 Measured Discharge in CFS 57 BUILDING STRONG
58 Average Bed Elevation Based on Hydraulic Depth for USGS Kansas City, MO Flow Less Than 200,000 CFS , Flood 500,000 Pre-Flood Fit Average Bed Elevation Post-Flood Fit 400, , ,000 Flow(cfs) , Year BUILDING STRONG 0 58
59 Major Flood Events Average Bed Elevation Based on Hydraulic Depth for USGS Kansas City, MO Flood Elevation 708 Pre-Flood Fit Post-Flood Fit Flow (cfs) Year 59 BUILDING STRONG
60 Bed Stage in Feet (1950 bed stage = 15 ft.) Average Bed USGS Stream Gages Missouri River Referenced to a Common Stage of 15 feet in Rulo Waverly St. Joseph Boonville Hermann Kansas City Year Rulo St Joseph Kansas City Waverly Boonville Hermann 60 BUILDING STRONG
61 Major Flood Events Summary Short Term Degradation (~ 2 yrs.) Long Term Degradation Evident at Waverly, Kansas City and St. Joseph Gaging Stations Not Clearly Evident at Other Gaging Stations Major Flood Events Contribute to Long Term Degradation in Some River Reaches 61
62 Dams 62
63 Missouri River and Tributaries Dam Construction Main-Stem Dams ( ) 6 Dams in Series Gavins Point at Downstream (1955) Kansas River Basin ( ) 18 Dams Throughout the Basin 7 at Downstream Locations Osage River Basin Bagnell Dam Most Downstream Other Smaller Tributaries 63
64 Missouri River and Tributaries Dam Construction Sediment Starvation Peak Flow and Flow Duration 64
65 Sediment Starvation Dam Construction 65
66 Change in Low Water Profile 1990 to 2005 Change in Low Water Profile Between 1990 and Rulo St. Joseph Kansas City Waverly Boonville Hermann St. Charles (- Degradation) Change in Feet (+ Aggradation) 38,900 cfs 40,600 cfs 44,200 cfs 45,100 cfs 48,300 cfs 55,900 cfs River Miles Above Mouth BUILDING STRONG
67 30 Missouri River Stage and Average Bed Trends at Omaha, Nebraska (River Mile 615.9) Stage (feet) Elevation (feet) ,000 cfs 60,000 cfs 40,000 cfs 20,000 cfs Average Bed 67 BUILDING STRONG
68 Missouri River Stage and Average Bed Trends at Nebraska City, Nebraska (River Mile 562.9) Stage (feet) Elevation (feet) Year 100,000 cfs 70,000 cfs 40,000 cfs 20,000 cfs Average Bed 68 BUILDING STRONG
69 Missouri River Average Bed at Rulo, Nebraska (River Mile 498.1) Elevation (feet) Year Average Bed 69 BUILDING STRONG
70 Mean Daily flows on the Kansas and Missouri Rivers Water Year Kansas River Desoto Mean Daily Flow (cfs) Kansas City Mean Daily Flow (cfs) Kansas River Contribution % % % % % % % % % % % % % % % 70 BUILDING STRONG
71 Mean Daily flows on the Kansas and Missouri Rivers (continued) Water Year Desoto Mean Daily Flow (cfs) Kansas City Mean Daily Flow (cfs) Kansas River Contribution % % % % % % % % % % % % % % % % % % Average = 13% 71
72 Summary of Sediment Trap Impacts Mainstem dam impacts have not extended below Rulo, NE. Impacts on the Missouri River resulting from trapped sediment above Kansas Basin dams are consider minimal based on: earlier work (Simons, Li and Associates, 1984), mean daily flow records the dams are on tributaries considerably removed from the mouth of the river. none of the dams are the main stem of the Kansas River The impact of the structures on the Osage River have not been evaluated. The remaining structures on tributaries to the Missouri River represent small drainage areas some distance from the Missouri River and are considered to have little or no impact. Open to further evaluation. 72
73 Flow Modification by Reservoir Regulation 73
74 Flow Duration Curve St. Joseph Gage FLOW in cfs Percent of Time At or Above 74 BUILDING STRONG
75 Flow Duration Curve Kansas City USGS Gage RM , ,000 Flow in cfs 100,000 80,000 60, ,000 20, Percent of Time At or Above 75
76 Flow Duration Curve Waverly Gage FLOW in cfs Percent of Time At or Above 76 BUILDING STRONG
77 Stage Duration Curve St. Joseph Gage Elevation (ft msl) Percent of Time At or Above 77 BUILDING STRONG
78 Stage Duration Curve Waverly Gage Elevation (ft msl) Percent of Time At or Above 78
79 Stage Duration Curve Kansas City Gage Elevation (ft m sl) Percent of Time At or Above 79
80 Construction Reference Plane The sloping plane along the river defined by the elevation/stage associated with the river flow that is exceeded 75% of the time during the navigation season (1 April -1 December). This plane is used as a reference for structure maintenance and new construction. BUILDING STRONG 80
81 Flow Modification by Regulation Summary: Flow regulation has at least a twofold impact: Changes the CRP design and maintenance criteria Potentially lessens the severity of degradation caused by flood events. The combined effects of these have not been quantified to date in this study BUILDING STRONG 81
82 Dredging 82
83 Dredging Dredging Material Removed from the River Primarily Commercial Dredging for Aggregate Dredging for Out of Channel Fill 83 BUILDING STRONG
84 Annual Sand Extraction from Missouri River Annual Sand Extractions from the Missouri River Main Channel ,000,000 9,000,000 8,000,000 Sand Removed (tons) 7,000,000 6,000,000 5,000,000 4,000,000 3,000,000 2,000,000 1,000,
85 Commercial Dredging In the Kansas City Reach of the Missouri River by Year BUILDING STRONG Year Dredging Tons in Millions
86 Kansas River Commercial Sand Dredging Sand on the and Kansas River Gravel Dredging Data Gap Sand Dredging (millions of tons) Years BUILDING STRONG 86
87 0 Dredging Quantity Per Mile and Change in Low Water Profile Between 1990 and Dredging in 100,000 of Tons/River Mile Rulo St. Joseph Dredging Kansas City Waverly Bed Change Boonville Dredging Hermann St. Charles (- Degradation) Change in Feet (+ Aggradation) River Miles Above Mouth 87
88 Average Change in Low Water Profiles From 1990 to 2005 vs. Dredging In Reach RM 0-51 R 2 = RM Change in Low Stage (ft.) RM RM RM RM RM ,000,000 10,000,000 15,000,000 20,000,000 25,000,000 30,000,000 35,000,000 40,000,000 45,000,000 50,000,000 Tons Dredged 88
89 1.8 Degradation (Stage 40k CFS) vs. Dredging Tons 2000 thru 2005 Change in Stage in ft, (+ = dropping) Boonville Gage Waverly Gage Hermann Gage R 2 = 0.87 Kansas City Gage 0.2 St. Joseph Gage 0 0 5,000,000 10,000,000 15,000,000 20,000,000 25,000,000 Dreding in Tons 89
90 Average Bed Blevation at Kansas City USGS Gage Bed Elevevation in Feet ' 1.3' 2.2' 2.3' Date 90 BUILDING STRONG
91 Degradation between breaks in rate of degradation vs. total dredged quantities during the same KC Gage 3 R 2 = CY KC Gage CY CY CY ,000,000 10,000,000 15,000,000 20,000,000 25,000,000 30,000,000 Dredging Totals in Tons 91
92 Summary of Dredging Data evaluated shows a link between bed degradation and dredging. This link is exhibited to some extent at a variety of locations along the lower 498 miles of the Missouri River. BUILDING STRONG 92
93 Dike Installation Over Time % % Number Completed % 60% 40% 20% Date BUILDING STRONG 0% 93
94 Summary of Degradation Causes Primary Bank Stabilization and Navigation Project and Cutoffs Major Flood Events Dredging (extraction) Secondary Kansas River Basin Sedimentation 94
95 Questions and Comments? Kansas City District Allen Tool 95 BUILDING STRONG
SIMULATION OF SEDIMENT TRANSPORT AND CHANNEL MORPHOLOGY CHANGE IN LARGE RIVER SYSTEMS. Stephen H. Scott 1 and Yafei Jia 2
 US-CHINA WORKSHOP ON ADVANCED COMPUTATIONAL MODELLING IN HYDROSCIENCE & ENGINEERING September 19-21, Oxford, Mississippi, USA SIMULATION OF SEDIMENT TRANSPORT AND CHANNEL MORPHOLOGY CHANGE IN LARGE RIVER
TENNESSEE GAS PIPELINE COMPANY, L.L.C.
 TENNESSEE GAS PIPELINE COMPANY, L.L.C. HYDROLOGIC & HYDRAULIC CALCULATIONS FOR WATERBODIES CROSSED BY CONNECTICUT PIPELINE EXPANSION PROJECT CONNECTICUT LOOP Submitted by: Tennessee Gas Pipeline Company,
Stream Channel Cross Sections for a Reach of the Boise River in Ada County, Idaho
 U.S. Department of the Interior U.S. Geological Survey In cooperation with Federal Emergency Management Agency, City of Boise, City of Garden City, City of Eagle, and Ada County Stream Channel Cross Sections
Prattsville Berm Removal Project. 1.0 Project Location
 Prattsville Berm Removal Project 1.0 Project Location The project site is located between the New York State Route 23 Bridge over the Schoharie Creek and the Schoharie Reservoir. The restoration plan encompassed
EFFECTS OF ARUNDO DONAX ON RIVER HYDRAULICS, SEDIMENT TRANSPORT, AND GEOMORPHOLOGY, SANTA MARGARITA RIVER, CALIFORNIA
 EFFECTS OF ARUNDO DONAX ON RIVER HYDRAULICS, SEDIMENT TRANSPORT, AND GEOMORPHOLOGY, SANTA MARGARITA RIVER, CALIFORNIA René Leclerc Geomorphologist Robert C. MacArthur, Ph.D., P.E. Principal Headwaters
The Basics of Chapter 105 Waterways and Wetlands Permitting in PA
 The Basics of Chapter 105 Waterways and Wetlands Permitting in PA April 17, 2013 Goal To develop a basic understanding of PA Department of Environmental Protection (DEP) and US Army Corps of Engineers
Lower Breton Sound Sediment Diversion Conceptual Engineering Design Presentation
 EXPERT PANEL ON DIVERSION PLANNING AND IMPLEMENTATION Lower Breton Sound Sediment Diversion Conceptual Engineering Design Presentation February 12, 2015 Topics I. Introduction II. Geotechnical Study III.
5.0 OVERVIEW OF FLOOD DAMAGE REDUCTION MEASURES
 5.0 OVERVIEW OF FLOOD DAMAGE REDUCTION MEASURES Flood damage reduction consists of two basic techniques structural and non-structural. Structural methods modify the flood and take the flood away from people
Hydrologic History of the Lower Missouri River
 Hydrologic History of the Lower Missouri River Fig. 1. The Missouri River basin and study sites along the Lower Missouri River. Nicholas Pinter Geology Department Southern Illinois University, Carbondale
ROSE CREEK WATERSHED HYDROLOGIC, HYDRAULIC, SEDIMENT TRANSPORT, AND GEOMORPHIC ANALYSES TASK 1 EXISTING DATA AND INFORMATION SUMMARY REPORT BACKGROUND
 ROSE CREEK WATERSHED HYDROLOGIC, HYDRAULIC, SEDIMENT TRANSPORT, AND GEOMORPHIC ANALYSES TASK 1 EXISTING DATA AND INFORMATION SUMMARY REPORT BACKGROUND The Rose Creek Watershed (RCW) consists of three planning
Land Disturbance, Erosion Control and Stormwater Management Checklist. Walworth County Land Conservation Department
 Land Disturbance, Erosion Control and Stormwater Management Checklist Walworth County Land Conservation Department The following checklist is designed to assist the applicant in complying with the Walworth
Travel Time. Computation of travel time and time of concentration. Factors affecting time of concentration. Surface roughness
 3 Chapter 3 of Concentration and Travel Time Time of Concentration and Travel Time Travel time ( T t ) is the time it takes water to travel from one location to another in a watershed. T t is a component
CITY UTILITIES DESIGN STANDARDS MANUAL
 CITY UTILITIES DESIGN STANDARDS MANUAL Book 2 (SW) SW9 June 2015 SW9.01 Purpose This Chapter provides information for the design of open channels for the conveyance of stormwater in the City of Fort Wayne.
Stream Rehabilitation Concepts, Guidelines and Examples. Objectives. Pierre Y. Julien. Three Laws of Stream Restoration
 Stream Rehabilitation Concepts, Guidelines and Examples Pierre Y. Julien Wuhan 2005 Objectives Part I - Stream restoration and rehabilitation: 1. Present and discuss important concepts, laws, criteria
STORMWATER MANAGEMENT CHECKLIST
 STORMWATER MANAGEMENT CHECKLIST *This checklist must be completed and part of the Land Disturbing Permit submittal for review if the acreage disturbed is one (1) acre or more: I. SUPPORTING DATA Narrative
Lower Raritan Watershed Management Area Stormwater & Flooding Subcommittee Strategy Worksheet LRSW-S3C1
 Strategy Name: Reduce Existing Potential for Flood Damages LRSW-S3C1. Develop and implement a program to: Minimize flood damages through the use of structural measures. Minimize flood damages through the
Quantifying Potential Floodplain Restoration Benefits in the Upper Mississippi River Basin, USA
 Quantifying Potential Floodplain Restoration Benefits in the Upper Mississippi River Basin, USA Michael Schwar, Ph.D. PE (MARS) Eileen Fretz (American Rivers) Mississippi River Commission/USACE Upper Mississippi
1. INTRODUCTION 5. THE PERMIT PROCESS
 1. INTRODUCTION Laws of the United States and the State of Iowa have assigned the US Army Corps of Engineers and the Iowa Department of Natural Resources with specific and different regulatory roles designed
The Mississippi River & Tributaries Project
 The Mississippi River & Tributaries Project The Mississippi River & Tributaries (MR&T) project was authorized by the 1928 Flood Control Act. Following the devastating 1927 flood, the nation was galvanized
FLOOD PROTECTION BENEFITS
 IV. (340 points) Flood Protection Benefits A. Existing and potential urban development in the floodplain (50) 1. Describe the existing and potential urban development at the site and the nature of the
King County Flood Hazard Management Plan Update Cedar/ Sammamish Rivers. Public Meeting December 5, 2012
 King County Flood Hazard Management Plan Update Cedar/ Sammamish Rivers Public Meeting December 5, 2012 Goals of the Presentation Cedar and Sammamish R. Plan Update Context - Brief summary info about the
How To Check For Scour At A Bridge
 Case Studies Bridge Scour Inspection and Repair Edward P. Foltyn, P.E. Senior Hydraulic Engineer ODOT Bridge Unit 2013 PNW Bridge Inspectors Conference April 2013 REFERENCES Stream Stability at Highway
https://orm.usace.army.mil/orm2/f?p=106:34:4198546103662037::no::
 Page 1 of 6 APPROVED JURISDICTIONAL DETERMINATION FORM U.S. Army Corps of Engineers JD Status: DRAFT SECTION I: BACKGROUND INFORMATION A. REPORT COMPLETION DATE FOR APPROVED JURISDICTIONAL DETERMINATION
FINAL TECHNICAL MEMORANDUM AWD-00002 FLOWS THROUGH FLOOD DAMAGE REDUCTION AREA July 16, 2012
 FINAL TECHNICAL MEMORANDUM AWD-00002 FLOWS THROUGH FLOOD DAMAGE REDUCTION AREA July 16, 2012 Table of Contents TABLE OF CONTENTS Table of Contents... 1 Executive Summary... 2 1 Objective... 4 2 Study Approach...
Floodplain Connectivity in Restoration Design
 Floodplain Connectivity in Restoration Design 2015 Symposium on Restoration in a Contaminated Environment: Lessons Learned and Challenges in Moving Forward Part II April 2015 Karin Boyd Applied Geomorphology,
Swannanoa River Flood Risk Management Study
 Swannanoa River Flood Risk Management Study Measures Evaluated to Reduce Future Flood Damages City of Asheville U.S. Army Corps of Engineers Flooding History Part of the 132 square mile Swannanoa River
 Coldwater Heritage Partnership Implementation Grant Final Report Morrison Run Watershed Restoration Project Western Pennsylvania Conservancy Project Summary The goal of the Morrison Run Watershed Restoration
MAPPING THE ST. FRANCIS DAM OUTBURST FLOOD WITH GEOGRAPHIC INFORMATION SYSTEMS
 MAPPING THE ST. FRANCIS DAM OUTBURST FLOOD WITH GEOGRAPHIC INFORMATION SYSTEMS J. David Rogers Kevin James Department of Geological Engineering University of Missouri-Rolla St. Francis Dam was a 200-ft
EXPERIMENTAL INVESTIGATION OF FLOODING PROBLEM- A CASE STUDY ON ARUNAVATI RIVER IN SHIRPUR CITY BY TOTAL STATION SURVEY
 International Journal of Civil Engineering and Technology (IJCIET) Volume 7, Issue 1, Jan-Feb 2016, pp. 172-179, Article ID: IJCIET_07_01_014 Available online at http://www.iaeme.com/ijciet/issues.asp?jtype=ijciet&vtype=7&itype=1
URBAN DRAINAGE CRITERIA
 URBAN DRAINAGE CRITERIA I. Introduction This division contains guidelines for drainage system design and establishes a policy for recognized and established engineering design of storm drain facilities
720 Contour Grading. General. References. Resources. Definitions
 720 Contour Grading General Contour grading directs water to a desired point, prevents erosion, provides noise deflection, provides visual fit of the facility into the landscape, and protects desirable
CHECKLIST FOR FILING AN APPLICATION FOR A GROUND AND/OR SURFACE WATER WITHDRAWAL PROJECT IN THE DELAWARE RIVER BASIN
 CHECKLIST FOR FILING AN APPLICATION FOR A GROUND AND/OR SURFACE WATER WITHDRAWAL PROJECT IN THE DELAWARE RIVER BASIN PLEASE COMPLETE CHECKLIST AND ENCLOSE WITH THE APPLICATION. If you need assistance,
2.0 BASIC CONCEPTS OF OPEN CHANNEL FLOW MEASUREMENT
 2.0 BASIC CONCEPTS OF OPEN CHANNEL FLOW MEASUREMENT Open channel flow is defined as flow in any channel where the liquid flows with a free surface. Open channel flow is not under pressure; gravity is the
Earth Science. River Systems and Landforms GEOGRAPHY 1710. The Hydrologic Cycle. Introduction. Running Water. Chapter 14.
 Earth Science GEOGRAPHY 1710 River Systems and Landforms DAVID R. SALLEE Robert W. Christopherson Charlie Thomsen Chapter 14 Introduction Rivers and streams are dynamic systems that continually adjust
COMMUNITY CERTIFICATIONS
 National Flood Insurance Program Community Rating System COMMUNITY CERTIFICATIONS Public reporting burden for this form is estimated to average 4 hours for annual recertification, per response. The burden
Chapter 3 CULVERTS. Description. Importance to Maintenance & Water Quality. Culvert Profile
 Chapter 3 CULVERTS Description A culvert is a closed conduit used to convey water from one area to another, usually from one side of a road to the other side. Importance to Maintenance & Water Quality
Catchment Scale Processes and River Restoration. Dr Jenny Mant Jenny@therrc.co.uk. The River Restoration Centre therrc.co.uk
 Catchment Scale Processes and River Restoration Dr Jenny Mant Jenny@therrc.co.uk The River Restoration Centre therrc.co.uk 3 Main Catchment Elements Hydrology Energy associated with the flow of water affects
Neversink River East Branch
 Neversink River East Branch Management Unit 10 Summary of Post-Flood Recommendations Intervention Level Full restoration of the stream reach including the eroding bank site between Station 38380 and Station
Basic Principles of Channel Design
 United States Department of Agriculture Natural Resources Conservation Service Stream Restoration Design Chapter 7 Basic Principles of Channel Design Issued August 2007 Cover photo: Where modification
Appendix H Dredging and Stream Channel Restoration
 Appendix H Dredging and Stream Channel Restoration Mankind s intrusion into the natural environment in West Virginia began in earnest following the Civil War when extractive industries and settlement all
Shooks Run Drainage Study Basic Terminology
 Shooks Run Drainage Study Basic Terminology PREPARED FOR: PREPARED BY: City of Colorado Springs CH2M DATE: April 9, 2015 Introduction This document is intended to provide an introduction to Colorado Springs
A Stream Restoration Case Study in the California Central Coast
 International Erosion Control Association Annual Conference 2009, Reno, Nevada Case Study Technical Presentation A Stream Restoration Case Study in the California Central Coast Justin S. Rogers, P.E.,
UNION COUNTY, FLORIDA AND INCORPORATED AREAS
 UNION COUNTY, FLORIDA AND INCORPORATED AREAS COMMUNITY NAME COMMUNITY NUMBER LAKE BUTLER, CITY OF 120595 RAIFORD, TOWN OF 120593 UNION COUNTY 120422 (UNINCORPORATED AREAS) WORTHINGTON SPRINGS, CITY OF
DIVISION OF WATER QUALITY CONSTRUCTION GRANTS & LOANS SECTION FAST TRACK AUDIT CHECKLIST
 DIVISION OF WATER QUALITY CONSTRUCTION GRANTS & LOANS SECTION FAST TRACK AUDIT CHECKLIST CERTIFICATION 1. Did the engineer submit a certificate of completion utilizing the appropriate page of the issued
Basic Hydrology. Time of Concentration Methodology
 Basic Hydrology Time of Concentration Methodology By: Paul Schiariti, P.E., CPESC Mercer County Soil Conservation District What is the Time of Concentration? The time it takes for runoff to travel from
CONSTRUCTION STORMWATER POLLUTION PREVENTION PLAN TEMPLATE
 CONSTRUCTION STORMWATER POLLUTION PREVENTION PLAN TEMPLATE The following template may be used as a general guide for development of a Stormwater Pollution Prevention Plan (SWPPP) for construction activities.
Hydrologic Engineering Techniques for Regional Water Resources Planning
 US Army Corps of Engineers Hydrologic Engineering Center Hydrologic Engineering Techniques for Regional Water Resources Planning October 1969 Approved for Public Release. Distribution Unlimited. TP-17
STORMWATER POLLUTION PREVENTION PLAN TEMPLATE. 1.0 SITE DESCRIPTION 1.1 Project Name and Location Date
 STORMWATER POLLUTION PREVENTION PLAN TEMPLATE Disclaimer: This template was developed for guidance purposes only in an effort to assist Construction Storm Water permit applicants in meeting state and local
CHAPTER 17: STORM SEWER STANDARDS. 17.00 Introduction. 17.01 Administration. 17.02 Standards 17.1
 CHAPTER 17: STORM SEWER STANDARDS 17.00 Introduction 17.01 Administration 17.02 Standards 17.1 17.00 INTRODUCTION The purpose of this chapter is to provide guidance for the design and construction of storm
CLACKAMAS COUNTY ZONING AND DEVELOPMENT ORDINANCE
 1008 STORM DRAINAGE (3/24/05) 1008.01 PURPOSE To minimize the amount of stormwater runoff resulting from development utilizing nonstructural controls where possible, maintain and improve water quality,
EMERGENCY HOME PROTECTION. Homeowner's Guide for Emergency Flood Control. Contents INTRODUCTION
 EMERGENCY HOME PROTECTION Homeowner's Guide for Emergency Flood Control Contents Discussion or Section Page Number Introduction 3 Potential Flooding Periods 4 General Rules and Control Aids 5,6 Sandbags
DRAFT SOUTH FORK SKYKOMISH RIVER
 DRAFT SOUTH FORK SKYKOMISH RIVER 9 levees and revetments / Approximately 1.1 miles of river bank are armored Revetments provide limited, localized erosion protection, but impact habitat Frequent and costly
Jackson Gulch Outlet Canal Rehabilitation Project
 Jackson Gulch Outlet Canal Rehabilitation Project Preliminary Budgetary Estimate for Rehabilitation February 2004 Prepared for the Mancos Water Conservancy District Jackson Gulch Reservoir 42888 County
March 2008. Prepared by: Irvine Ranch Water District. 15600 Sand Canyon Avenue. Irvine, CA 92618. Contact: Natalie Likens (949) 453-5633
 453-5633") ADDENDUM TO THE MICHELSON WATER RECLAMATION PLANT PHASE 2 & 3 CAPACITY EXPANSION PROJECT FEBRUARY 2006 FINAL ENVIRONMENTAL IMPACT REPORT AND THE SAN JOAQUIN FRESHWATER MARSH ENHANCEMENT PLAN REVISED SEPTEMBER
ADDENDUM TO THE MICHELSON WATER RECLAMATION PLANT PHASE 2 & 3 CAPACITY EXPANSION PROJECT FEBRUARY 2006 FINAL ENVIRONMENTAL IMPACT REPORT AND THE SAN JOAQUIN FRESHWATER MARSH ENHANCEMENT PLAN REVISED SEPTEMBER
DOÑA ANA COUNTY DESIGN STORM CRITERIA GUIDELINES FOR COMMERCIAL AND RESIDENTIAL SITES. Run-off Analysis Methods
 DOÑA ANA COUNTY DESIGN STORM CRITERIA GUIDELINES FOR COMMERCIAL AND RESIDENTIAL SITES Run-off Analysis Methods This document sets forth the minimum design, technical criteria and specifications for the
Chehalis River Basin Flood Damage Reduction 2013-2015 Capital Budget Approved by Legislature in June 2013
 Chehalis River Basin Flood Damage Reduction 2013-2015 Capital Budget Approved by Legislature in June 2013 1. Design alternatives for large capital flood projects (basinlevel water retention and Interstate
Small Dam Hazard Assessment Inventory
 Small Dam Hazard Assessment Inventory What would happen if your dam were to fail? This is a question that most dam owners hope they will never have to answer. However it is a question you, as a responsible
SITE-SPECIFIC BEST MANAGEMENT PRACTICES (BMP) PLAN REVIEW CHECKLIST
 PLAN REVIEW CHECKLIST") This checklist may be used by applicants for encroachment permits, and contractors in development of Site- Specific BMP Plans for projects. plan reviewers will use this checklist to review the Site-Specific
This checklist may be used by applicants for encroachment permits, and contractors in development of Site- Specific BMP Plans for projects. plan reviewers will use this checklist to review the Site-Specific
Lecture 4: Streamflow and Stream Gauging
 Lecture 4: Streamflow and Stream Gauging Key Questions 1. What is stream discharge and what controls its magnitude? 2. What is a hydrograph? 3. Where is the velocity highest in a stream? 4. Where is the
The Hydrologic Engineering Center Training Course on
 The Hydrologic Engineering Center Training Course on SEDIMENT TRANSPORT ANALYSIS WITH HEC-RAS Davis, California Course Objectives This course is intended to prepare engineers to perform studies using various
Methods for Determination of Safe Yield and Compensation Water from Storage Reservoirs
 US Army Corps of Engineers Hydrologic Engineering Center Methods for Determination of Safe Yield and Compensation Water from Storage Reservoirs October 1966 Approved for Public Release. Distribution Unlimited.
Integrated Water and Sediment Management of Yellow River
 Keeping Health Life of Yellow River: Integrated Water and Sediment Management of Yellow River Shang Hongqi Yellow River Conservancy Commission 18 March 2009 Istanbul, Turkey Outline: I. Yellow River Characteristic
Quality Assurance Reviews of Hydraulic Models Developed for the Central Valley Floodplain Evaluation and Delineation Program
 Quality Assurance Reviews of Hydraulic Models Developed for the Central Valley Floodplain Evaluation and Delineation Program Techniques Applied and Lessons Learned Seth Ahrens, P.E., CFM Selena Forman,
Flooding Hazards, Prediction & Human Intervention
 Page 1 of 10 EENS 3050 Tulane University Natural Disasters Prof. Stephen A. Nelson Flooding Hazards, Prediction & Human Intervention This page last updated on 19-Oct-2015 Hazards Associated with Flooding
Plan Groundwater Procurement, Implementation and Costs, prepared for the Brazos River Authority, July 2005.
 6 Conjunctive Use 6.1 Lake Granger Augmentation 6.1.1 Description of Option Rapid population growth and development in Williamson County require additional water supplies throughout the planning period.
HUDSON RIVER-BLACK RIVER REGULATING DISTRICT BOARD MEETING JUNE 10, 2014
 HUDSON RIVER-BLACK RIVER REGULATING DISTRICT BOARD MEETING JUNE 10, 2014 PRESENTATION TOPICS Analysis Objectives Analysis Dam Removal Plan Dam Remediation Plan Effects Analysis Permit Requirements Decision
APPENDIX B DESIGN GUIDELINES FOR APPROVED TREATMENT METHODS
 APPENDIX B DESIGN GUIDELINES FOR APPROVED TREATMENT METHODS PLANTER BOXES 1. Determine the impervious area contributing flow to the planter box (see Chapter 4.2). 2. Assumption: Typical soil infiltration
Development of Technical Data For Long Term Flood Solutions For the Red River Basin
 IDENTIFYING WHAT WE DIDN T KNOW Development of Technical Data For Long Term Flood Solutions For the Red River Basin LTFS Study Area U.S. Portion of Red River Basin (MN, ND & SD) Main Stem Red River Tributaries
Consultation on integrating flood defence consents into the Environmental Permitting regime in England and Wales
 www.gov.uk/defra www.wales.gov.uk Consultation on integrating flood defence consents into the Environmental Permitting regime in England and Wales Annex 2; Proposed exclusions Emergencies and licensable
Instructions and Helpful Hints. for Preparation of. Emergency Action Plans
 Instructions and Helpful Hints for Preparation of Emergency Action Plans using the fillable form electronic template for the NRCS sample EAP June 25, 2007 Introduction Emergency Action Plans (EAPs) are
General Permit for Activities Promoting Waterway - Floodplain Connectivity [working title]
![General Permit for Activities Promoting Waterway - Floodplain Connectivity [working title]](/thumbs/39/18645965.jpg "General Permit for Activities Promoting Waterway - Floodplain Connectivity [working title]") General Permit for Activities Promoting Waterway - Floodplain Connectivity [working title] Purpose These rules set forth the conditions under which a person may, without an individual removal-fill permit
General Permit for Activities Promoting Waterway - Floodplain Connectivity [working title] Purpose These rules set forth the conditions under which a person may, without an individual removal-fill permit
DESCRIPTION OF STORMWATER STRUCTURAL CONTROLS IN MS4 PERMITS
 DESCRIPTION OF STORMWATER STRUCTURAL CONTROLS IN MS4 PERMITS Phase I MS4 permits require continuous updating of the stormwater system inventory owned and operated by the MS4. They also include inspection
CHAPTER 19 CONSTRUCTION
 CHAPTER 19 CONSTRUCTION UDOT Manual of Instruction Roadway Drainage (US Customary Units), Construction 19-1 CHAPTER 19 TABLE OF CONTENTS 19.1 OVERVIEW...2 19.1.1 Introduction...2 19.1.2 Construction Considerations...2
Sediment Supply and the Upland-Stream Connection. Brian Bledsoe Department of Civil and Environmental Engineering Colorado State University
 Sediment Supply and the Upland-Stream Connection Brian Bledsoe Department of Civil and Environmental Engineering Colorado State University Overview The sediment system (with an eye towards hillslope processes
Flood Hazard Area Technical Manual Section 8 Bank Stabilization and Stream Restoration
 Flood Hazard Area Technical Manual Section 8 Bank Stabilization and Stream Restoration Prepared by: New Jersey Section American Water Resources Association Stream Restoration Committee FHA Subcommittee
HCP Team Meeting. November 18, 2015. icfi.com
 HCP Team Meeting November 18, 2015 icfi.com 1 Welcome and Introductions Where are we in the HCP process Hydrology modeling update Native fish survey Fish translocation Finalize covered activities Next
Outlet stabilization structure
 Overview of Sedimentation and Erosion Control Practices Practice no. 6.41 Outlet stabilization structure Erosion at the outlet of channels, culverts, and other structures is common, and can cause structural
The Alternatives of Flood Mitigation in The Downstream Area of Mun River Basin
 The Alternatives of Flood Mitigation in The Downstream Area of Mun River Basin Dr.Phattaporn Mekpruksawong 1, Thana Suwattana 2 and Narong Meepayoong 3 1 Senior Civil Engineer, Office of Project Management,
CHAPTER 3 STORM DRAINAGE SYSTEMS
 CHAPTER 3 STORM DRAINAGE SYSTEMS 3.7 Storm Drains 3.7.1 Introduction After the tentative locations of inlets, drain pipes, and outfalls with tail-waters have been determined and the inlets sized, the next
GLOSSARY OF TERMS CHAPTER 11 WORD DEFINITION SOURCE. Leopold
 CHAPTER 11 GLOSSARY OF TERMS Active Channel The channel that contains the discharge Leopold where channel maintenance is most effective, sediment are actively transported and deposited, and that are capable
US Army Corps of Engineers BUILDING STRONG
 Fort Worth District Public Meeting 20 August 2013 US Army Corps of Engineers Lewisville Dam - Authorization Authorized by the River and Harbor Act, approved 2 March 1945 (Public Law 14, 79th Congress,
The checklist utilized by the Authority will be similar to that which is shown below. Project Name: Location: Consulting Engineering Firm:
 Page 1 of 6 Section 1. PURPOSE This policy is an Engineering checklist of the Local Review Program for sanitary sewer improvement projects by the Bedford Regional Water Authority ( Authority ). Section
LEAGUE NOTES ON APPROVED COMMUNITY WATER SUPPLY PLAN
 1 AUGUST 2011 LEAGUE NOTES ON APPROVED COMMUNITY WATER SUPPLY PLAN KEY ELEMENTS OF THE PLAN: 1. Replace the existing unsafe Ragged Mountain dam with a new dam and raise the reservoir pool level initially
Re: Preliminary Permit Application for the Rose Creek Pumped Storage Project
 September 12, 2013 Kimberly D. Bose, Secretary Federal Energy Regulatory Commission 888 First Street, N.E. Washington, D.C. 20426 Re: Preliminary Permit Application for the Dear Ms. Bose, Please find attached
STRUCTURES. 1.1. Excavation and backfill for structures should conform to the topic EXCAVATION AND BACKFILL.
 STRUCTURES 1. General. Critical structures may impact the integrity of a flood control project in several manners such as the excavation for construction of the structure, the type of foundation, backfill
Evaluation of Open Channel Flow Equations. Introduction :
 Evaluation of Open Channel Flow Equations Introduction : Most common hydraulic equations for open channels relate the section averaged mean velocity (V) to hydraulic radius (R) and hydraulic gradient (S).
Flood Risk Management
 Flood Risk Management Value of Flood Risk Management Every year floods sweep through communities across the United States taking lives, destroying property, shutting down businesses, harming the environment
Flood Risk Management
 Flood Risk Management Value of Flood Risk Management Value to Individuals and Communities Every year floods sweep through communities across the United States taking lives, destroying property, shutting
WETLAND RESTORATION PROGRAM WATER ACT APPROVAL ADMINISTRATIVE GUIDE
 WETLAND RESTORATION PROGRAM WATER ACT APPROVAL ADMINISTRATIVE GUIDE May 24, 2005 Table of Contents Introduction...3 Definitions...3 Types of Wetland Restorations...4 Re-Contouring...4 Engineered...4 Water
CLEARWATER DAM BLACK RIVER, MISSOURI MAJOR REHABILITATION STUDY
 US Army Corps of Engineers Little Rock District CLEARWATER DAM BLACK RIVER, MISSOURI MAJOR REHABILITATION STUDY HYDROLOGIC AND HYDRAULIC ANALYSES NOTES: 1) All elevations listed in this report are referenced
BRIDGE SCOUR INVESTIGATION: DEVELOPING A SCREENING AND HYDRAULIC VULNERABILITY RATING SYSTEM FOR BRIDGES B.HERON 1 & C.BOWE 2
 BRIDGE SCOUR INVESTIGATION: DEVELOPING A SCREENING AND HYDRAULIC VULNERABILITY RATING SYSTEM FOR BRIDGES B.HERON 1 & C.BOWE 2 1 O Connor Sutton Cronin Consulting Engineers, Dublin, Ireland 2 Iarnród Éireann,
Managing Our Water Retention Systems
 Managing Our Water Retention Systems 29th Annual USSD Conference Nashville, Tennessee, April 20-24, 2009 Hosted by Corps of Engineers On the Cover Wolf Creek Dam is on the Cumberland River in South Central
Charles R. Gamble TENNESSEE DEPARTMENT OF TRANSPORTATION CANE CREEK FLOOD-FLOW CHARACTERISTICS AT STATE ROUTE 30 NEAR SPENCER, TENNESSEE
 CANE CREEK FLOOD-FLOW CHARACTERISTICS AT STATE ROUTE 30 NEAR SPENCER, TENNESSEE Charles R. Gamble U.S. GEOLOGICAL SURVEY Open-File Report 83-267 Prepared in cooperation with the TENNESSEE DEPARTMENT OF
Stream-Network Navigation in the U.S. Geological Survey StreamStats Web Application
 2009 International Conference on Advanced Geographic Information Systems & Web Services Stream-Network Navigation in the U.S. Geological Survey StreamStats Web Application Kernell G. Ries III, Peter A.
Assessing Rivers for Restoration Purposes. Ann L. Riley Waterways Restoration Institute
 Assessing Rivers for Restoration Purposes Ann L. Riley Waterways Restoration Institute Assessing Rivers for Restoration Purposes Ann L. Riley Waterways Restoration Institute Assessing Rivers for Restoration
Index. protection. excavated drop inlet protection (Temporary) 6.50.1 6.51.1. Block and gravel inlet Protection (Temporary) 6.52.1
 6.50.1 6.51.1. Block and gravel inlet Protection (Temporary) 6.52.1") 6 Index inlet protection excavated drop inlet protection (Temporary) 6.50.1 HARDWARE CLOTH AND GRAVEL INLET PROTECTION Block and gravel inlet Protection (Temporary) sod drop inlet protection ROCK DOUGHNUT
6 Index inlet protection excavated drop inlet protection (Temporary) 6.50.1 HARDWARE CLOTH AND GRAVEL INLET PROTECTION Block and gravel inlet Protection (Temporary) sod drop inlet protection ROCK DOUGHNUT
Adopted 9/23/98 CHATTAHOOCHEE CORRIDOR PLAN. The goals of the Chattahoochee Corridor Plan (hereinafter also referred to as the Plan ) are:
 are:") CHATTAHOOCHEE CORRIDOR PLAN Adopted 9/23/98 PART 1: GOALS. POLICY. COVERAGE. A. Goals The goals of the Chattahoochee Corridor Plan (hereinafter also referred to as the Plan ) are: 1. Preservation and protection
CHATTAHOOCHEE CORRIDOR PLAN Adopted 9/23/98 PART 1: GOALS. POLICY. COVERAGE. A. Goals The goals of the Chattahoochee Corridor Plan (hereinafter also referred to as the Plan ) are: 1. Preservation and protection
A Flood Warning System for City of Findlay, Ohio
 A Flood Warning System for City of Findlay, Ohio Matt Whitehead US Geological Survey, Ohio Water Science Center 6480 Doubletree Avenue Columbus, Ohio 43229 Abstract The U.S. Geological Survey (USGS) and
Town of Elkton & Cecil Soil Conservation District Checklist for Joint Agency Review Stormwater Management / Erosion and Sediment Control
 Town of Elkton & Cecil Soil Conservation District Checklist for Joint Agency Review Stormwater Management / Erosion and Sediment Control Project Name: Tax Map Parcel: Acreage: Plat: ADC Map & Grid Engineering
Henry Van Offelen Natural Resource Scientist MN Center for Environmental Advocacy hvanoffelen@mncenter.org
 Henry Van Offelen Natural Resource Scientist MN Center for Environmental Advocacy hvanoffelen@mncenter.org Wetland study slide Water Quality NRE goals in watershed plans Protect habitat that remains.