Jensen, J. R Introductory Digital Image Processing (3 rd edition). Prentice Hall.
|
|
|
- Scot Jones
- 9 years ago
- Views:
Transcription

1 Jensen, J. R Introductory Digital Image Processing (3 rd edition). Prentice Hall.
2 General Questions Where and when has change taken place in the landscape? How much change, and what type of change has occurred? What are the cycles and trends in the change?
3 Types of Change Detection Between-class changes Based on classification imagery Answers the question, Has a pixel changed and what has it changed to? e.g. forest to agriculture conversion Within-class changes Based on continuous spectral or transformed spectral information Answers the question, How much and in what direction has a pixel changed? e.g. change in % vegetation cover
4 Types of Change Detection Use of time as an implicit variable The actual time differences are not used in the analysis, just the fact that two images are from different times. Use of time as an explicit variable If we are interested in the amount of change/unit time, we need to include time explicitly in our analyses.
5 Change Detection Process Data Acquisition and Preprocessing Radiometric/Geometric Correction Data Normalization Change Detection Analysis Accuracy Assessment Final Product Generation
6 Change Detection Analysis Landscape is dynamic Allows for the monitoring of change over time -Rates e.g., x % per year deforestation - Amounts e.g., x km 2 loss of wetlands General steps to perform digital change detection are shown next
7
8 Why do change analysis? To map patterns of forest change, specifically deforestation, To analyze the rates of such changes in the tropics and elsewhere Monitoring of change is frequently perceived as one of the most important contributions of remote sensing technology to the study of global ecological and environmental change. Land cover changes can occur in two forms: - conversion of land cover from one category to a completely different category (via agriculture, urbanization, etc.), - modification of the condition of the land cover type within the same category (thinning of trees, selective cutting, etc.)

9

10 Change detection land use change 29,860 acres/year land use change 56,640 acres/year % total non-federal land developed 1982 = 27.7% 1985 = 32.7% 1992 = 34.4% 1997 = 40.8%
11 Products of Change Detection Change area and rate assessing the spatial pattern of the change Change trajectories; identifying the nature of the change Accuracy assessment of change detection results
12 Change-Detection Considerations Precise geometric registration Radiometric normalization/calibration Phenology, soil moisture, sun angles (select images of similar solar days) Image complexity of the study area and mixel effects (use images of similar spatial resolutions) Compatibility of images from different sensors Classification and change detection schemes (application oriented change/non-change vs change directions) Change detection methods Ground truth data Analyst s skill and experience Time and cost restrictions
13 Before implementing change detection analysis, the following conditions must be satisfied: (1) precise registration of multi-temporal images; (2) Precise radiometric and atmospheric calibration or normalization between multi-temporal images; (3) similar phenological states between multi-temporal images; and (4) selection of the same spatial and spectral resolution images if possible.
14 Temporal Resolution When performing change detection using RS data from multiple dates, two temporal resolutions must be held constant for optimal results: 1. Data should be acquired the same time of day (e.g., Landsat TM is before 9:45 am in U.S.) 2. Data should be collected on anniversary dates (removes sun angle & plant phenological differences)
15 Spatial Resolution & Look Angle Accurate spatial registration of at least two images is essential for optimal digital change detection. Ideally the following should be held constant: Data collected with the same Instantaneous- Field-Of-View (IFOV) i.e., same pixel size Rectification Root Mean Square Error (RMSE) of < 0.5 of a pixel i.e., reduce misregistration Data collected from the same look angle i.e.reduce reflectance differences
16 Spectral Resolution Data should be collected from the same sensor in the same bands This achieves the best results but when this is not possible, bands which most closely approximate one another should be used.
17 Radiometric Resolution Data should be collected at the same radiometric precision on both dates When the radiometric resolution of data acquired by one system are compared with data acquired by a higher radiometric resolution instrument (e.g., Landsat TM with 8-bit data) then the lower resolution (e.g., 6-bit data) should be decompressed to 8-bits for change detection purposes. Note: precision of decompressed brightness values is not as good as original, uncompressed data.
18 Environmental Considerations When performing change detection it is also desirable to hold environmental variables such as: Atmospheric Soil Vegetative conditions as constant as possible
19 Atmospheric Conditions Ideal atmospheric conditions for the collection of remotely sensed data include no clouds, haze, or extreme humidity. Cloud cover > 20% is usually considered unacceptable. If dramatic differences exist in atmospheric conditions across the imagery to be used then atmospheric attenuation in the imagery must be corrected for e.g., using in situ data and atmospheric transmission models or alternate empirical methods.
20 Soil Moisture Conditions Under ideal conditions, soils moisture should be identical across dates. This means the dates for imagery must be reviewed before purchase to compare precipitation records in the days and weeks prior to the image date.
21 Vegetative Conditions Similar times of year and moisture conditions usually result in similar phenological stages in vegetation. Hence if the other conditions are met in terms of environmental and resolution considerations, usually vegetative conditions are also. Ground data should be available to confirm changes in vegetation, which is usually what we are studying with change detection.
22 Calibration Procedures Images must undergo a number of restoration steps that involve radiometric calibration, atmospheric correction, and radiometric rectification to ensure we are obtaining real image differences in our change detection These processes remove differences between the images related to: - sensor differences (intra-instrument differences, instrument drift, or inter-instrument differences), - illumination differences (earth-sun distances, solar incidence angle), - atmospheric differences (aerosol content, water droplet concentration)
23 Radiometric Calibration/Normalization 1. Absolute correction/calibration: Converting from DN to ground reflectance (or radiance) using atmospheric models 2. Relative normalization: Based on regression or histogram matching techniques to register the radiometric signals of one image to another. Noise reduction Haze reduction
24 Pixel Count Change Detection: Radiometric Calibration Histogram matching Band 4
25 Band 4, 1988 Change Detection: Radiometic Regression Approach Calibration Light Objects Dark Objects Band 4, 1999
26 Change Detection Atmospheric correction Model atmospheric effects using radiative transfer models Aerosols, water vapor, absorptive gases
27 Atmospheric Correction Necessary / Not Necessary NECESSARY: Required when individual date images used in change detection algorithm are based on linear transformation of data, a normalized difference of vegetation index image is produced NECESSARY: Imagery should be atmospherically corrected if the change detection is based on multiple-date red/near-infrared ratio images (landsat tm 4 / landsat tm 3) UNNECESSARY: It is unnecessary to correct for atmospheric effects prior to image classification if the spectral signatures characterizing the desired classes are derived from the image to be classified images from a single date. It is not necessary to atmospherically correct Landsat TM data obtained on Date 1 if it is going to be subjected to a maximum likelihood classification algorithm and all the training data are derived from the Date 1 imagery. The same hold true when a Date 2 image is classified using training data extracted from the Date 2 image. Change between the Date 1 and Date 2 classification maps derived from the individual dates of imagery (corrected or uncorrected can easily be compared in post-classification comparison. UNNECESSARY: It is also unnecessary when change detection is based on classification of multiple date composite imagery in which the multiple dates of remotely sensed imaged are rectified and placed in a single dataset and then classified as if it were a single image (e.g. multiple date principle components change detection). NECESSARY: Only when Training data from one time and/or place are applied in another time and/or place is atmospheric correction necessary for image classification and many change detection algorithms.
28 Some examples of Change Detection and Analysis Classification Algorithms (after Jensen 2005) 1. Direct Comparison Blinking 2. Write Function Memory Insertion 3. Multi-Date Composite Image 4. Image Algebra Change Detection 5. Post-classification Comparison 6. Multi-date Change with Binary Mask 7. Multi-date Change with Ancillary Data 8. Manual, On-screen Digitizing 9. Spectral Change Vectors 10. Knowledge-Based Vision Systems Index Algorithms - Thresholding
29 Change Detection: Methods Basic model: Inputs: Landsat TM image from Date 1 Landsat TM image from Date 2 Potential output: Map of change vs. no-change Map describing the types of change
30 Change Detection: Methods Display bands from Dates 1 and 2 in different color guns of display No-change is greyish Change appears as non-grey Limited use On-screen delineation Masking

31 Direct: Blinking Link two composites, blink back and forth. Advantages: Simple and Immediate. Disadvantages: No change class labels, to-from analysis,
32

33 Write- Function Memory Insertion (RGB Control) R = Band G = Band B = Band
34

35 Multi-date Composite Image Change Detection in Imagine PC 1 PC 2 PCA PC 3 Composite
36

37 Image Algebra Change Detection in Imagine

38 Image Algebra Change Detection in Imagine Based on non-corrected Digital Numbers Difference Image, mean -26 Red = > 20% decrease; Green = > 20% increase in Band 4

 / 0.")
39 Thresholding Standard Normal Deviates Z = ( x x ) / s.d. Z = (x ) / Threshold = + 2 s.d.

40
41 Change Detection: Methods Image differencing Date 1 - Date 2 No-change = 0 Positive and negative values interpretable Pick a threshold for change Often uses vegetation index as start point, but not necessary
42 Image Differencing Image Date 1 Image Date Difference Image = Image 1 - Image 2
43 Change Detection: Methods Image differencing: Pros Simple (some say it s the most commonly used method) Easy to interpret Robust Cons: Difference value is absolute, so same value may have different meaning depending on the starting class Requires atmospheric calibration for expectation of nochange = zero

44 Image Differencing Roads Shadow Fraction, 1986 Shadow Fraction, 2002
 is related to clearings, gain of shadow (brighter pixels) is related to forest")
45 Image Differencing Roads Shadow difference image = Shadow image (2002) - Shadow image (1986) Loss of shadow (darker pixels) is related to clearings, gain of shadow (brighter pixels) is related to forest recovery.
46 Image Differencing
47 Image Differencing Helipads Roads If we use a change threshold of 1 stdev, we can classify the image into gain, no-change or loss. Red signifies loss of shadow (loss of forest), green gain of shadow (forest recovery), black no-change.
48 Change Detection: Methods Image Ratioing Date 1 / Date 2 No-change = 1 Values less than and greater than 1 are interpretable Pick a threshold for change
49 Change Detection: Methods Image Ratioing: Pros Simple May mitigate problems with viewing conditions, esp. sun angle Cons Scales change according to a single date, so same change on the ground may have different score depending on direction of change; I.e. 50/100 =.5, 100/50 = 2.0
 Image Ratio (TM99 /")
50 Change Detection Image Difference (TM99 TM88) Image Ratio (TM99 / TM88)

51 Multi-date Change Detection Using A Binary Mask Applied to Date 2 - very effective method - Date1 base image - Date 2- earlier image or later image - spectral change image is then recorded in to binary mask file
 the direction of change between the two (spectral) input images for each date.")
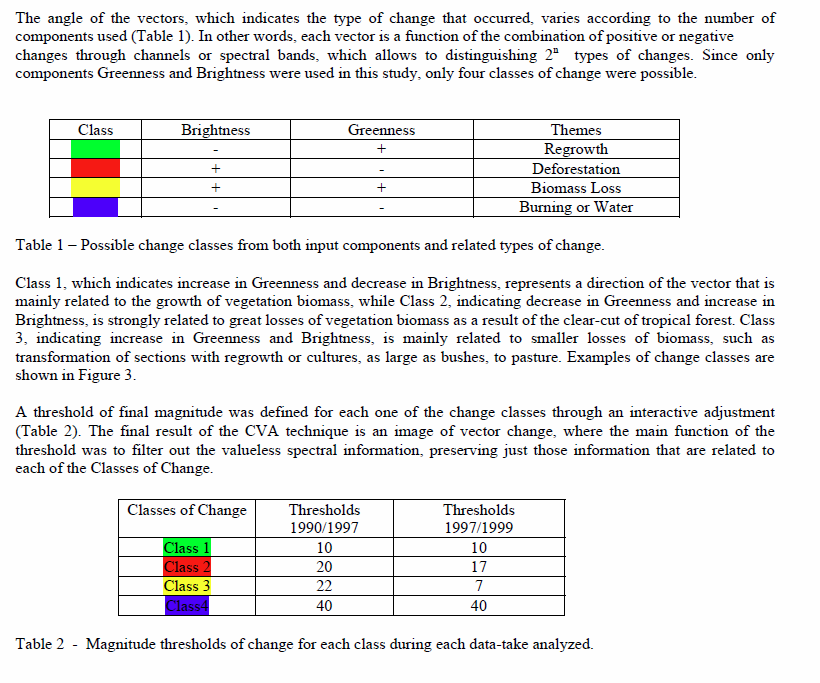
52 Change Vector Analysis (CVA) Change Vector Analysis (CVA) uses two spectral channels to map both the: 1) magnitude of change and, 2) the direction of change between the two (spectral) input images for each date.

53 Band 4 Change Detection: Methods Change vector analysis In n-dimensional spectral space, determine length and direction of vector between Date 1 and Date 2 Date 1 Date 2 Band 3
54 Change Detection: Methods No-change = 0 length Change direction may be interpretable Pick a threshold for change
55 Change Vector Analysis Band Math followed by change vector 3-D change vector 2-D change vector

56
57 EXAMPLE CVA: The first step of the example CVA method was to apply a Tasseled Cap transform which generates the components Greenness and Brightness, in order to reduce the amount of redundant information of orbital images to be analyzed. This transform can be understood as defining a new coordinate system, where data from different bands occupy a new system of coordinates, where data from the different bands occupy new axes associated with biophysical properties of targets. In this case, such axes are Greenness, associated with the amount and vigor of vegetation, and Brightness, associated with variations of soil reflectance. The position variation of the same pixel during different data-takes within the space formed by these two axes, determines the magnitude and direction of the spectral change vectors. The next step in the band transformation process into new coordinates axes was to calculate the magnitude of variation among spectral change vectors between the images pairs. The magnitude of vectors was calculated from the Euclidean Distance between the difference in positions of the same pixel from different data-takes within the space generated by the axes Greenness and Brightness, as follows:
58
59 Change Detection: CVA Methods Change detection: Pros Conceptually appealing Allows designation of the type of change occurring Cons Requires very accurate radiometric calibration Change value is not referenced to a baseline, so different types of change may have same change vector
60 Example of Change Vector Analysis: Tugend 2001: Lake Kissimmee Littoral Zone Enhancement Decreases in brightness of bands 1, 2, 3 due to increases of vegetation. Increases in brightness due either to decrease of vegetation, or increases of turbidity.
61 Vegetation Indices in Change Detection A useful vegetation or greenness index can be created from a ratio of the visible and near-infrared data, known as the normalized difference vegetation index (NDVI) (Campbell, 1996). This index can be used to show the amount of vegetation present at a given time, and can be used in change analyses to indicate how a landscape changes in terms of vegetation amount across a set time period. Quite simply we can subtract one image from a second image e.g., 1990 NDVI 1980 NDVI = A number > 0.0 means an increase in vegetation since 1980
62 Frequency of pixels Frequency of NDVI change values across the La Campa & Gracias study area Figure 4: Frequency of NDVI change values across the La Campa-Gracias image region 0.0 (no change in vegetation) Decreasing vegetation amount Increasing vegetation amount NDVI pixel value NDVI pixel value (above 0.0 means increasing vegetation)
63 Change Detection: Methods Post-classification (delta classification) Classify Date 1 and Date 2 separately, compare class values on pixel by pixel basis between dates
64

65 Post-Classification Change Comparison Use confusion matrix as a to-from change matrix. Legend Class 1 = Blue Class 2 = Green Class 3 = Red Class 4 = Yellow Class 5 = Cyan 1997 Classified 1994 Ground Truth
66 Change Detection: Methods Post-classification: Pros Avoids need for strict radiometric calibration Favors classification scheme of user Designates type of change occurring Cons Error is multiplicative from two parent maps Changes within classes may be interesting
67
68 Change Detection: Methods Composite Analysis Stack Date 1 and Date 2 and run unsupervised classification on the whole stack
69 Composite Analysis Steps 1. Geometrically correct images. 2. Merge the images into a single image. The number of bands in the composite image typically = the number of bands in a single image x the number of images used. e.g. if we use 2 MSS images, the composite images will have 4 bands x 2 image = 8 bands. 3. We use the composite image to perform classification. Change categories should be statistically different from no change categories.
70 Composite Analysis Benefits Only a single classification is needed. May extract maximum change variation Includes reference for change, so change is anchored at starting value, unlike change vector analysis and image differencing Drawbacks Class choices and interpretation can be complex. This is more of a classification technique that takes change into consideration, than a true change-detection technique.
71 Principle Components Analysis Steps 1. Geometrically correct images. 2. Perform PCA transformation. 3. Interpret PCA images (each image will contain a single axis).

72 Principle Components Analysis PCA Axis 1 PCA Axis 2 PCA Axis 3 PCA Axis 4
73 Principle Components Analysis Benefits Relatively easy to do, can reduce a large dataset into a much smaller dataset. Drawbacks Interpretation can be difficult.
 and each scene in the temporal sequence (Time 2).")
74 Cross-Correlation Analysis (CCA) Cross-Correlation Analysis (CCA) uses a land cover map to delineate spectral cluster statistics between the baseline image year (Time 1) and each scene in the temporal sequence (Time 2). Calculating the Z-statistic deviations from the cluster mean identifies change pixels within each land cover cluster.
75 Z n i i 1 Std. Dev. i Observed Expected i 2 Z is the distance measure Observed is the pixel value for each band Expected is the mean value of all extracted pixels for each band Std. Dev. Is the standard deviation of all extracted pixels for each band

76 1989 Deciduous Category September 23, 1999

77 1989 Deciduous Category Probable unchanged Probable changed Z-values range from 1 to 5,794

78 Turf & Grass Agriculture & Barren Deciduous Coniferous
79 Dense Urban Residential Turf & Grass Agriculture Deciduous Coniferous Water Wetland Barren
80 Dense Urban Residential Turf & Grass Agriculture Deciduous Coniferous Water Wetland Barren

81 Site 1
82 Site 2
83 Theil-Sen Regression Analysis (TSA) Much like typical image regression change, we use Theil-Sen as it is more robust to sample outliers than ordinary least-squares regression. Medians are outlier resistant measures of central tendency and the method uses the median of all pairwise slopes to calculate the slope of the regression line. The median value of the sample offsets represents the intercept.

84 TSA con t Generate mask to sample pixels in each land cover Samples are used to build a regression equation for each cover type using the baseline data as the regressor and each scene in the temporal sequence as the response. A change mask is created by mapping pixels characterizing large residuals away from the regression line
85
86
87
88
89
90
91
92
93
94
95
96
97
98
99 Change Detection: Summary Radiometric, geometric calibration critical Minimize unwanted sources of change (phenology, sun angle, etc.) Differencing is simple and often effective Post-classification may have multiplicative error Better to have a reference image than not
Digital image processing
 746A27 Remote Sensing and GIS Lecture 4 Digital image processing Chandan Roy Guest Lecturer Department of Computer and Information Science Linköping University Digital Image Processing Most of the common
SAMPLE MIDTERM QUESTIONS
 Geography 309 Sample MidTerm Questions Page 1 SAMPLE MIDTERM QUESTIONS Textbook Questions Chapter 1 Questions 4, 5, 6, Chapter 2 Questions 4, 7, 10 Chapter 4 Questions 8, 9 Chapter 10 Questions 1, 4, 7
2.3 Spatial Resolution, Pixel Size, and Scale
 Section 2.3 Spatial Resolution, Pixel Size, and Scale Page 39 2.3 Spatial Resolution, Pixel Size, and Scale For some remote sensing instruments, the distance between the target being imaged and the platform,
Review for Introduction to Remote Sensing: Science Concepts and Technology
 Review for Introduction to Remote Sensing: Science Concepts and Technology Ann Johnson Associate Director [email protected] Funded by National Science Foundation Advanced Technological Education program [DUE
Digital Remote Sensing Data Processing Digital Remote Sensing Data Processing and Analysis: An Introduction and Analysis: An Introduction
 Digital Remote Sensing Data Processing Digital Remote Sensing Data Processing and Analysis: An Introduction and Analysis: An Introduction Content Remote sensing data Spatial, spectral, radiometric and
Environmental Remote Sensing GEOG 2021
 Environmental Remote Sensing GEOG 2021 Lecture 4 Image classification 2 Purpose categorising data data abstraction / simplification data interpretation mapping for land cover mapping use land cover class
Land Use/Land Cover Map of the Central Facility of ARM in the Southern Great Plains Site Using DOE s Multi-Spectral Thermal Imager Satellite Images
 Land Use/Land Cover Map of the Central Facility of ARM in the Southern Great Plains Site Using DOE s Multi-Spectral Thermal Imager Satellite Images S. E. Báez Cazull Pre-Service Teacher Program University
Some elements of photo. interpretation
 Some elements of photo Shape Size Pattern Color (tone, hue) Texture Shadows Site Association interpretation Olson, C. E., Jr. 1960. Elements of photographic interpretation common to several sensors. Photogrammetric
WATER BODY EXTRACTION FROM MULTI SPECTRAL IMAGE BY SPECTRAL PATTERN ANALYSIS
 WATER BODY EXTRACTION FROM MULTI SPECTRAL IMAGE BY SPECTRAL PATTERN ANALYSIS Nguyen Dinh Duong Department of Environmental Information Study and Analysis, Institute of Geography, 18 Hoang Quoc Viet Rd.,
Remote Sensing and Land Use Classification: Supervised vs. Unsupervised Classification Glen Busch
 Remote Sensing and Land Use Classification: Supervised vs. Unsupervised Classification Glen Busch Introduction In this time of large-scale planning and land management on public lands, managers are increasingly
A KNOWLEDGE-BASED APPROACH FOR REDUCING CLOUD AND SHADOW ABSTRACT
 A KNOWLEDGE-BASED APPROACH FOR REDUCING CLOUD AND SHADOW Mingjun Song, Graduate Research Assistant Daniel L. Civco, Director Laboratory for Earth Resources Information Systems Department of Natural Resources
TerraColor White Paper
 TerraColor White Paper TerraColor is a simulated true color digital earth imagery product developed by Earthstar Geographics LLC. This product was built from imagery captured by the US Landsat 7 (ETM+)
MODIS IMAGES RESTORATION FOR VNIR BANDS ON FIRE SMOKE AFFECTED AREA
 MODIS IMAGES RESTORATION FOR VNIR BANDS ON FIRE SMOKE AFFECTED AREA Li-Yu Chang and Chi-Farn Chen Center for Space and Remote Sensing Research, National Central University, No. 300, Zhongda Rd., Zhongli
VCS REDD Methodology Module. Methods for monitoring forest cover changes in REDD project activities
 1 VCS REDD Methodology Module Methods for monitoring forest cover changes in REDD project activities Version 1.0 May 2009 I. SCOPE, APPLICABILITY, DATA REQUIREMENT AND OUTPUT PARAMETERS Scope This module
Data Processing Flow Chart
 Legend Start V1 V2 V3 Completed Version 2 Completion date Data Processing Flow Chart Data: Download a) AVHRR: 1981-1999 b) MODIS:2000-2010 c) SPOT : 1998-2002 No Progressing Started Did not start 03/12/12
ANALYSIS OF FOREST CHANGE IN FIRE DAMAGE AREA USING SATELLITE IMAGES
 ANALYSIS OF FOREST CHANGE IN FIRE DAMAGE AREA USING SATELLITE IMAGES Joon Mook Kang, Professor Joon Kyu Park, Ph.D Min Gyu Kim, Ph.D._Candidate Dept of Civil Engineering, Chungnam National University 220
Methods for Monitoring Forest and Land Cover Changes and Unchanged Areas from Long Time Series
 Methods for Monitoring Forest and Land Cover Changes and Unchanged Areas from Long Time Series Project using historical satellite data from SACCESS (Swedish National Satellite Data Archive) for developing
Resolutions of Remote Sensing
 Resolutions of Remote Sensing 1. Spatial (what area and how detailed) 2. Spectral (what colors bands) 3. Temporal (time of day/season/year) 4. Radiometric (color depth) Spatial Resolution describes how
Analysis of Landsat ETM+ Image Enhancement for Lithological Classification Improvement in Eagle Plain Area, Northern Yukon
 Analysis of Landsat ETM+ Image Enhancement for Lithological Classification Improvement in Eagle Plain Area, Northern Yukon Shihua Zhao, Department of Geology, University of Calgary, [email protected],
Using Remote Sensing Imagery to Evaluate Post-Wildfire Damage in Southern California
 Graham Emde GEOG 3230 Advanced Remote Sensing February 22, 2013 Lab #1 Using Remote Sensing Imagery to Evaluate Post-Wildfire Damage in Southern California Introduction Wildfires are a common disturbance
RESOLUTION MERGE OF 1:35.000 SCALE AERIAL PHOTOGRAPHS WITH LANDSAT 7 ETM IMAGERY
 RESOLUTION MERGE OF 1:35.000 SCALE AERIAL PHOTOGRAPHS WITH LANDSAT 7 ETM IMAGERY M. Erdogan, H.H. Maras, A. Yilmaz, Ö.T. Özerbil General Command of Mapping 06100 Dikimevi, Ankara, TURKEY - (mustafa.erdogan;
Supervised Classification workflow in ENVI 4.8 using WorldView-2 imagery
 Supervised Classification workflow in ENVI 4.8 using WorldView-2 imagery WorldView-2 is the first commercial high-resolution satellite to provide eight spectral sensors in the visible to near-infrared
Remote Sensing Method in Implementing REDD+
 Remote Sensing Method in Implementing REDD+ FRIM-FFPRI Research on Development of Carbon Monitoring Methodology for REDD+ in Malaysia Remote Sensing Component Mohd Azahari Faidi, Hamdan Omar, Khali Aziz
Calculation of Minimum Distances. Minimum Distance to Means. Σi i = 1
 Minimum Distance to Means Similar to Parallelepiped classifier, but instead of bounding areas, the user supplies spectral class means in n-dimensional space and the algorithm calculates the distance between
Generation of Cloud-free Imagery Using Landsat-8
 Generation of Cloud-free Imagery Using Landsat-8 Byeonghee Kim 1, Youkyung Han 2, Yonghyun Kim 3, Yongil Kim 4 Department of Civil and Environmental Engineering, Seoul National University (SNU), Seoul,
Overview. What is EMR? Electromagnetic Radiation (EMR) LA502 Special Studies Remote Sensing
 LA502 Special Studies Remote Sensing") LA502 Special Studies Remote Sensing Electromagnetic Radiation (EMR) Dr. Ragab Khalil Department of Landscape Architecture Faculty of Environmental Design King AbdulAziz University Room 103 Overview What
LA502 Special Studies Remote Sensing Electromagnetic Radiation (EMR) Dr. Ragab Khalil Department of Landscape Architecture Faculty of Environmental Design King AbdulAziz University Room 103 Overview What
Adaptive HSI Data Processing for Near-Real-time Analysis and Spectral Recovery *
 Adaptive HSI Data Processing for Near-Real-time Analysis and Spectral Recovery * Su May Hsu, 1 Hsiao-hua Burke and Michael Griffin MIT Lincoln Laboratory, Lexington, Massachusetts 1. INTRODUCTION Hyperspectral
Virtual constellations, time series, and cloud screening opportunities for Sentinel 2 and Landsat
 Virtual constellations, time series, and cloud screening opportunities for Sentinel 2 and Landsat Sentinel 2 for Science Workshop 20 22 May 2014 ESA ESRIN, Frascati (Rome), Italy 1 Part 1: Title: Towards
How Landsat Images are Made
 How Landsat Images are Made Presentation by: NASA s Landsat Education and Public Outreach team June 2006 1 More than just a pretty picture Landsat makes pretty weird looking maps, and it isn t always easy
Landsat Monitoring our Earth s Condition for over 40 years
 Landsat Monitoring our Earth s Condition for over 40 years Thomas Cecere Land Remote Sensing Program USGS ISPRS:Earth Observing Data and Tools for Health Studies Arlington, VA August 28, 2013 U.S. Department
The USGS Landsat Big Data Challenge
 The USGS Landsat Big Data Challenge Brian Sauer Engineering and Development USGS EROS [email protected] U.S. Department of the Interior U.S. Geological Survey USGS EROS and Landsat 2 Data Utility and Exploitation
Spectral Response for DigitalGlobe Earth Imaging Instruments
 Spectral Response for DigitalGlobe Earth Imaging Instruments IKONOS The IKONOS satellite carries a high resolution panchromatic band covering most of the silicon response and four lower resolution spectral
Lectures Remote Sensing
 Lectures Remote Sensing ATMOSPHERIC CORRECTION dr.ir. Jan Clevers Centre of Geo-Information Environmental Sciences Wageningen UR Atmospheric Correction of Optical RS Data Background When needed? Model
ENVI Classic Tutorial: Classification Methods
 ENVI Classic Tutorial: Classification Methods Classification Methods 2 Files Used in this Tutorial 2 Examining a Landsat TM Color Image 3 Reviewing Image Colors 3 Using the Cursor Location/Value 4 Examining
Selecting the appropriate band combination for an RGB image using Landsat imagery
 Selecting the appropriate band combination for an RGB image using Landsat imagery Ned Horning Version: 1.0 Creation Date: 2004-01-01 Revision Date: 2004-01-01 License: This document is licensed under a
A remote sensing instrument collects information about an object or phenomenon within the
 Satellite Remote Sensing GE 4150- Natural Hazards Some slides taken from Ann Maclean: Introduction to Digital Image Processing Remote Sensing the art, science, and technology of obtaining reliable information
PIXEL-LEVEL IMAGE FUSION USING BROVEY TRANSFORME AND WAVELET TRANSFORM
 PIXEL-LEVEL IMAGE FUSION USING BROVEY TRANSFORME AND WAVELET TRANSFORM Rohan Ashok Mandhare 1, Pragati Upadhyay 2,Sudha Gupta 3 ME Student, K.J.SOMIYA College of Engineering, Vidyavihar, Mumbai, Maharashtra,
COMPARISON OF OBJECT BASED AND PIXEL BASED CLASSIFICATION OF HIGH RESOLUTION SATELLITE IMAGES USING ARTIFICIAL NEURAL NETWORKS
 COMPARISON OF OBJECT BASED AND PIXEL BASED CLASSIFICATION OF HIGH RESOLUTION SATELLITE IMAGES USING ARTIFICIAL NEURAL NETWORKS B.K. Mohan and S. N. Ladha Centre for Studies in Resources Engineering IIT
SLC-off Gap-Filled Products Gap-Fill Algorithm Methodology
 SLC-off Gap-illed roducts Gap-ill Algorithm Methodology Background The U.S. Geological Survey (USGS) Earth Resources Observation Systems (EROS) Data Center (EDC) has developed multi-scene (same path/row)
APPLICATION OF MULTITEMPORAL LANDSAT DATA TO MAP AND MONITOR LAND COVER AND LAND USE CHANGE IN THE CHESAPEAKE BAY WATERSHED
 APPLICATION OF MULTITEMPORAL LANDSAT DATA TO MAP AND MONITOR LAND COVER AND LAND USE CHANGE IN THE CHESAPEAKE BAY WATERSHED S. J. GOETZ Woods Hole Research Center Woods Hole, Massachusetts 054-096 USA
LANDSAT 8 Level 1 Product Performance
 Réf: IDEAS-TN-10-QualityReport LANDSAT 8 Level 1 Product Performance Quality Report Month/Year: January 2016 Date: 26/01/2016 Issue/Rev:1/9 1. Scope of this document On May 30, 2013, data from the Landsat
ENVI Classic Tutorial: Atmospherically Correcting Multispectral Data Using FLAASH 2
 ENVI Classic Tutorial: Atmospherically Correcting Multispectral Data Using FLAASH Atmospherically Correcting Multispectral Data Using FLAASH 2 Files Used in this Tutorial 2 Opening the Raw Landsat Image
Pixel-based and object-oriented change detection analysis using high-resolution imagery
 Pixel-based and object-oriented change detection analysis using high-resolution imagery Institute for Mine-Surveying and Geodesy TU Bergakademie Freiberg D-09599 Freiberg, Germany [email protected]
ENVIRONMENTAL MONITORING Vol. I - Remote Sensing (Satellite) System Technologies - Michael A. Okoye and Greg T. Koeln
 System Technologies - Michael A. Okoye and Greg T. Koeln") REMOTE SENSING (SATELLITE) SYSTEM TECHNOLOGIES Michael A. Okoye and Greg T. Earth Satellite Corporation, Rockville Maryland, USA Keywords: active microwave, advantages of satellite remote sensing, atmospheric
REMOTE SENSING (SATELLITE) SYSTEM TECHNOLOGIES Michael A. Okoye and Greg T. Earth Satellite Corporation, Rockville Maryland, USA Keywords: active microwave, advantages of satellite remote sensing, atmospheric
Preface. Ko Ko Lwin Division of Spatial Information Science University of Tsukuba 2008
 1 Preface Remote Sensing data is one of the primary data sources in GIS analysis. The objective of this material is to provide fundamentals of Remote Sensing technology and its applications in Geographical
SEMI-AUTOMATED CLOUD/SHADOW REMOVAL AND LAND COVER CHANGE DETECTION USING SATELLITE IMAGERY
 SEMI-AUTOMATED CLOUD/SHADOW REMOVAL AND LAND COVER CHANGE DETECTION USING SATELLITE IMAGERY A. K. Sah a, *, B. P. Sah a, K. Honji a, N. Kubo a, S. Senthil a a PASCO Corporation, 1-1-2 Higashiyama, Meguro-ku,
CROP CLASSIFICATION WITH HYPERSPECTRAL DATA OF THE HYMAP SENSOR USING DIFFERENT FEATURE EXTRACTION TECHNIQUES
 Proceedings of the 2 nd Workshop of the EARSeL SIG on Land Use and Land Cover CROP CLASSIFICATION WITH HYPERSPECTRAL DATA OF THE HYMAP SENSOR USING DIFFERENT FEATURE EXTRACTION TECHNIQUES Sebastian Mader
The Role of SPOT Satellite Images in Mapping Air Pollution Caused by Cement Factories
 The Role of SPOT Satellite Images in Mapping Air Pollution Caused by Cement Factories Dr. Farrag Ali FARRAG Assistant Prof. at Civil Engineering Dept. Faculty of Engineering Assiut University Assiut, Egypt.
Land Use/ Land Cover Mapping Initiative for Kansas and the Kansas River Watershed
 Land Use/ Land Cover Mapping Initiative for Kansas and the Kansas River Watershed Kansas Biological Survey Kansas Applied Remote Sensing Program April 2008 Previous Kansas LULC Projects Kansas LULC Map
Multiscale Object-Based Classification of Satellite Images Merging Multispectral Information with Panchromatic Textural Features
 Remote Sensing and Geoinformation Lena Halounová, Editor not only for Scientific Cooperation EARSeL, 2011 Multiscale Object-Based Classification of Satellite Images Merging Multispectral Information with
ASSESSMENT OF FOREST RECOVERY AFTER FIRE USING LANDSAT TM IMAGES AND GIS TECHNIQUES: A CASE STUDY OF MAE WONG NATIONAL PARK, THAILAND
 ASSESSMENT OF FOREST RECOVERY AFTER FIRE USING LANDSAT TM IMAGES AND GIS TECHNIQUES: A CASE STUDY OF MAE WONG NATIONAL PARK, THAILAND Sunee Sriboonpong 1 Yousif Ali Hussin 2 Alfred de Gier 2 1 Forest Resource
Objectives. Raster Data Discrete Classes. Spatial Information in Natural Resources FANR 3800. Review the raster data model
 Spatial Information in Natural Resources FANR 3800 Raster Analysis Objectives Review the raster data model Understand how raster analysis fundamentally differs from vector analysis Become familiar with
Assessing Hurricane Katrina Damage to the Mississippi Gulf Coast Using IKONOS Imagery
 Assessing Hurricane Katrina Damage to the Mississippi Gulf Coast Using IKONOS Imagery Joseph P. Spruce Science Systems and Applications, Inc. John C., MS 39529 Rodney McKellip NASA Project Integration
APPLICATION OF TERRA/ASTER DATA ON AGRICULTURE LAND MAPPING. Genya SAITO*, Naoki ISHITSUKA*, Yoneharu MATANO**, and Masatane KATO***
 APPLICATION OF TERRA/ASTER DATA ON AGRICULTURE LAND MAPPING Genya SAITO*, Naoki ISHITSUKA*, Yoneharu MATANO**, and Masatane KATO*** *National Institute for Agro-Environmental Sciences 3-1-3 Kannondai Tsukuba
Cloud Detection for Sentinel 2. Curtis Woodcock, Zhe Zhu, Shixiong Wang and Chris Holden
 Cloud Detection for Sentinel 2 Curtis Woodcock, Zhe Zhu, Shixiong Wang and Chris Holden Background 3 primary spectral regions useful for cloud detection Optical Thermal Cirrus bands Legacy Landsats have
Myths and misconceptions about remote sensing
 Myths and misconceptions about remote sensing Ned Horning (graphics support - Nicholas DuBroff) Version: 1.0 Creation Date: 2004-01-01 Revision Date: 2004-01-01 License: This document is licensed under
How to calculate reflectance and temperature using ASTER data
 How to calculate reflectance and temperature using ASTER data Prepared by Abduwasit Ghulam Center for Environmental Sciences at Saint Louis University September, 2009 This instructions walk you through
Assessment. Presenter: Yupu Zhang, Guoliang Jin, Tuo Wang Computer Vision 2008 Fall
 Automatic Photo Quality Assessment Presenter: Yupu Zhang, Guoliang Jin, Tuo Wang Computer Vision 2008 Fall Estimating i the photorealism of images: Distinguishing i i paintings from photographs h Florin
16 th IOCCG Committee annual meeting. Plymouth, UK 15 17 February 2011. mission: Present status and near future
 16 th IOCCG Committee annual meeting Plymouth, UK 15 17 February 2011 The Meteor 3M Mt satellite mission: Present status and near future plans MISSION AIMS Satellites of the series METEOR M M are purposed
DETECTING LANDUSE/LANDCOVER CHANGES ALONG THE RING ROAD IN PESHAWAR CITY USING SATELLITE REMOTE SENSING AND GIS TECHNIQUES
 ------------------------------------------------------------------------------------------------------------------------------- Full length Research Paper -------------------------------------------------------------------------------------------------------------------------------
The Idiots Guide to GIS and Remote Sensing
 The Idiots Guide to GIS and Remote Sensing 1. Picking the right imagery 1 2. Accessing imagery 1 3. Processing steps 1 a. Geocorrection 2 b. Processing Landsat images layerstacking 4 4. Landcover classification
Topographic Change Detection Using CloudCompare Version 1.0
 Topographic Change Detection Using CloudCompare Version 1.0 Emily Kleber, Arizona State University Edwin Nissen, Colorado School of Mines J Ramón Arrowsmith, Arizona State University Introduction CloudCompare
Jitter Measurements in Serial Data Signals
 Jitter Measurements in Serial Data Signals Michael Schnecker, Product Manager LeCroy Corporation Introduction The increasing speed of serial data transmission systems places greater importance on measuring
River Flood Damage Assessment using IKONOS images, Segmentation Algorithms & Flood Simulation Models
 River Flood Damage Assessment using IKONOS images, Segmentation Algorithms & Flood Simulation Models Steven M. de Jong & Raymond Sluiter Utrecht University Corné van der Sande Netherlands Earth Observation
MODULATION TRANSFER FUNCTION MEASUREMENT METHOD AND RESULTS FOR THE ORBVIEW-3 HIGH RESOLUTION IMAGING SATELLITE
 MODULATION TRANSFER FUNCTION MEASUREMENT METHOD AND RESULTS FOR THE ORBVIEW-3 HIGH RESOLUTION IMAGING SATELLITE K. Kohm ORBIMAGE, 1835 Lackland Hill Parkway, St. Louis, MO 63146, USA [email protected]
Electromagnetic Radiation (EMR) and Remote Sensing
 and Remote Sensing") Electromagnetic Radiation (EMR) and Remote Sensing 1 Atmosphere Anything missing in between? Electromagnetic Radiation (EMR) is radiated by atomic particles at the source (the Sun), propagates through
Electromagnetic Radiation (EMR) and Remote Sensing 1 Atmosphere Anything missing in between? Electromagnetic Radiation (EMR) is radiated by atomic particles at the source (the Sun), propagates through
AATSR Technical Note. Improvements to the AATSR IPF relating to Land Surface Temperature Retrieval and Cloud Clearing over Land
 AATSR Technical Note Improvements to the AATSR IPF relating to Land Surface Temperature Retrieval and Cloud Clearing over Land Author: Andrew R. Birks RUTHERFORD APPLETON LABORATORY Chilton, Didcot, Oxfordshire
Measurement of the effect of biomass burning aerosol on inhibition of cloud formation over the Amazon
 Supporting Online Material for Koren et al. Measurement of the effect of biomass burning aerosol on inhibition of cloud formation over the Amazon 1. MODIS new cloud detection algorithm The operational
'Developments and benefits of hydrographic surveying using multispectral imagery in the coastal zone
 Abstract With the recent launch of enhanced high-resolution commercial satellites, available imagery has improved from four-bands to eight-band multispectral. Simultaneously developments in remote sensing
STAR Algorithm and Data Products (ADP) Beta Review. Suomi NPP Surface Reflectance IP ARP Product
 Beta Review. Suomi NPP Surface Reflectance IP ARP Product") STAR Algorithm and Data Products (ADP) Beta Review Suomi NPP Surface Reflectance IP ARP Product Alexei Lyapustin Surface Reflectance Cal Val Team 11/26/2012 STAR ADP Surface Reflectance ARP Team Member
STAR Algorithm and Data Products (ADP) Beta Review Suomi NPP Surface Reflectance IP ARP Product Alexei Lyapustin Surface Reflectance Cal Val Team 11/26/2012 STAR ADP Surface Reflectance ARP Team Member
Lake Monitoring in Wisconsin using Satellite Remote Sensing
 Lake Monitoring in Wisconsin using Satellite Remote Sensing D. Gurlin and S. Greb Wisconsin Department of Natural Resources 2015 Wisconsin Lakes Partnership Convention April 23 25, 2105 Holiday Inn Convention
Introduction to Imagery and Raster Data in ArcGIS
 Esri International User Conference San Diego, California Technical Workshops July 25, 2012 Introduction to Imagery and Raster Data in ArcGIS Simon Woo slides Cody Benkelman - demos Overview of Presentation
AERIAL PHOTOGRAPHS. For a map of this information, in paper or digital format, contact the Tompkins County Planning Department.
 AERIAL PHOTOGRAPHS What are Aerial Photographs? Aerial photographs are images of the land taken from an airplane and printed on 9 x9 photographic paper. Why are Aerial Photographs Important? Aerial photographs
The Scientific Data Mining Process
 Chapter 4 The Scientific Data Mining Process When I use a word, Humpty Dumpty said, in rather a scornful tone, it means just what I choose it to mean neither more nor less. Lewis Carroll [87, p. 214] In
Remote Sensing in Natural Resources Mapping
 Remote Sensing in Natural Resources Mapping NRS 516, Spring 2016 Overview of Remote Sensing in Natural Resources Mapping What is remote sensing? Why remote sensing? Examples of remote sensing in natural
Colour Image Segmentation Technique for Screen Printing
 60 R.U. Hewage and D.U.J. Sonnadara Department of Physics, University of Colombo, Sri Lanka ABSTRACT Screen-printing is an industry with a large number of applications ranging from printing mobile phone
ENVI Classic Tutorial: Atmospherically Correcting Hyperspectral Data using FLAASH 2
 ENVI Classic Tutorial: Atmospherically Correcting Hyperspectral Data Using FLAASH Atmospherically Correcting Hyperspectral Data using FLAASH 2 Files Used in This Tutorial 2 Opening the Uncorrected AVIRIS
Remote Sensing and GIS Application In Change Detection Study In Urban Zone Using Multi Temporal Satellite
 Remote Sensing and GIS Application In Change Detection Study In Urban Zone Using Multi Temporal Satellite R.Manonmani, G.Mary Divya Suganya Institute of Remote Sensing, Anna University, Chennai 600 025
Nature Values Screening Using Object-Based Image Analysis of Very High Resolution Remote Sensing Data
 Nature Values Screening Using Object-Based Image Analysis of Very High Resolution Remote Sensing Data Aleksi Räsänen*, Anssi Lensu, Markku Kuitunen Environmental Science and Technology Dept. of Biological
SMEX04 Land Use Classification Data
 Notice to Data Users: The documentation for this data set was provided solely by the Principal Investigator(s) and was not further developed, thoroughly reviewed, or edited by NSIDC. Thus, support for
Scanners and How to Use Them
 Written by Jonathan Sachs Copyright 1996-1999 Digital Light & Color Introduction A scanner is a device that converts images to a digital file you can use with your computer. There are many different types
Modelling, Extraction and Description of Intrinsic Cues of High Resolution Satellite Images: Independent Component Analysis based approaches
 Modelling, Extraction and Description of Intrinsic Cues of High Resolution Satellite Images: Independent Component Analysis based approaches PhD Thesis by Payam Birjandi Director: Prof. Mihai Datcu Problematic
Multinomial Logistics Regression for Digital Image Classification
 Multinomial Logistics Regression for Digital Image Classification Dr. Moe Myint, Chief Scientist, Mapping and Natural Resources Information Integration (MNRII), Switzerland [email protected] KEY
Face detection is a process of localizing and extracting the face region from the
 Chapter 4 FACE NORMALIZATION 4.1 INTRODUCTION Face detection is a process of localizing and extracting the face region from the background. The detected face varies in rotation, brightness, size, etc.
Multispectral stereo acquisition using 2 RGB cameras and color filters: color and disparity accuracy
 Multispectral stereo acquisition using 2 RGB cameras and color filters: color and disparity accuracy (a) and Bernhard Hill (b) (a) Institute of Imaging and Computer Vision (b) Research Group Color and
Object-Oriented Approach of Information Extraction from High Resolution Satellite Imagery
 IOSR Journal of Computer Engineering (IOSR-JCE) e-issn: 2278-0661,p-ISSN: 2278-8727, Volume 17, Issue 3, Ver. IV (May Jun. 2015), PP 47-52 www.iosrjournals.org Object-Oriented Approach of Information Extraction
VIIRS-CrIS mapping. NWP SAF AAPP VIIRS-CrIS Mapping
 NWP SAF AAPP VIIRS-CrIS Mapping This documentation was developed within the context of the EUMETSAT Satellite Application Facility on Numerical Weather Prediction (NWP SAF), under the Cooperation Agreement
Cloud Masking and Cloud Products
 Cloud Masking and Cloud Products MODIS Operational Algorithm MOD35 Paul Menzel, Steve Ackerman, Richard Frey, Kathy Strabala, Chris Moeller, Liam Gumley, Bryan Baum MODIS Cloud Masking Often done with
Vulnerability assessment of ecosystem services for climate change impacts and adaptation (VACCIA)
") Vulnerability assessment of ecosystem services for climate change impacts and adaptation (VACCIA) Action 2: Derivation of GMES-related remote sensing data Deliverable 1: Time-series of Earth Observation
Vulnerability assessment of ecosystem services for climate change impacts and adaptation (VACCIA) Action 2: Derivation of GMES-related remote sensing data Deliverable 1: Time-series of Earth Observation
Social Media Mining. Data Mining Essentials
 Introduction Data production rate has been increased dramatically (Big Data) and we are able store much more data than before E.g., purchase data, social media data, mobile phone data Businesses and customers
Big data and Earth observation New challenges in remote sensing images interpretation
 Big data and Earth observation New challenges in remote sensing images interpretation Pierre Gançarski ICube CNRS - Université de Strasbourg 2014 Pierre Gançarski Big data and Earth observation 1/58 1
Medical Information Management & Mining. You Chen Jan,15, 2013 [email protected]
 Medical Information Management & Mining You Chen Jan,15, 2013 [email protected] 1 Trees Building Materials Trees cannot be used to build a house directly. How can we transform trees to building materials?