SolarWinds. Network Performance Monitor. Getting Started Guide. Version 12. Part 1 of 2: Get Started
|
|
|
- Rafe O’Neal’
- 9 years ago
- Views:
Transcription
1 SolarWinds Network Performance Monitor Version 12 Getting Started Guide Part 1 of 2: Get Started Last Updated: December 2, 2016 Retrieve the latest version from:
2 Network Performance Monitor Getting Started Guide 5 Product terminology 5 Related Guide 6 Production installation 7 Plan your production deployment 7 Virtual machine and server requirements 9 Application ports 9 Deployment checklist 10 Prepare the Orion SQL Server database 11 Install a licensed copy of SolarWinds NPM 12 Configure the Orion server database 13 Before you begin 13 Configure the Orion server and database 13 Multi-module system guidelines 15 Small deployment guidelines 16 Medium deployment guidelines 16 NTA-specific information 17 Large deployment guidelines 18 NTA-specific information 20 Evaluation installation 21 Install an evaluation copy of SolarWinds NPM 21 Discover 23 What should I monitor? 23 Discovery checklist 23 Discover your network 24 Add discovered devices to SolarWinds Orion 29 Add a single node for monitoring 32 Advanced discovery 33 Monitor 36 2
3 Navigate SolarWinds NPM 36 Overview of an element 38 Details of an element 39 Identify and troubleshoot a node that has a problem 39 Step 1: Determine there is a problem 40 Step 2: Get more details about the node 41 Step 3: Get more details about the alert 46 Identify and troubleshoot an interface that has a problem 48 Step 1: Determine there is a problem 48 Top 10 Interfaces by Percent Utilization 49 Top 10 Interfaces by Traffic 49 Top 10 Errors & Discards Today 50 Step 2: Get more details about the interface 50 Step 3: Get more details about the problem 52 Min/Max/Average Response Time & Packet Loss 52 Network Latency & Packet Loss 53 Monitor your network paths 54 Create a NetPath service 55 Troubleshoot with NetPath 57 Plan to scale monitoring 59 Alerts and reports 61 How alerts work 61 Work with preconfigured alerts 62 List preconfigured, enabled alerts 65 Enable and disable alerts 66 Action types 66 Configure the default action 67 How reports work 68 Run a preconfigured report 69 3
4 Schedule a web-based report 71 User accounts 72 How user accounts work 72 Create a user 73 Use Active Directory credentials for Orion Platform users 73 Change account passwords 75 Get connected 76 Access the Customer Portal 76 Create your user profile 76 Explore the Customer Portal 77 Set up additional Customer Portal user accounts 77 Engage with the SolarWinds community 78 Create a THWACK account 78 Explore the THWACK site 78 4
5 Network Performance Monitor Getting Started Guide Welcome to the SolarWinds Network Performance Monitor (NPM) Getting Started Guides. These guides will take you from installation to full implementation, including customization. It is divided into two progressive objectives: 1. Get started. Plan your implementation, install and configure SolarWinds NPM, begin collecting data, and alert and report on your mission-critical environment. Quickly identify performance issues and problems before your customers call the help desk. Depending on your workload, you should be able to get started in five days or less. 2. Customize. Customize views, alerts, and reports. Tailor SolarWinds NPM to your internal processes so you can more effectively respond to performance issues. Depending on your workload, you should be able to customize SolarWinds NPM in five or fewer days. Existing customers: Following the recommendations in this guide will ensure your system capabilities are appropriate and your production environment is sized correctly. Minimum system requirements used during evaluation are not sufficient for a production environment. Access your licensed software from the SolarWinds Customer Portal. If you need any implementation help, contact our Support Geeks. Evaluators: If you are evaluating SolarWinds NPM, concentrate on the Get Started and Customize objectives. As you work through the guide, you will see some topics that provide information for production deployments. That information is included so you can get a sense of what a production environment looks like. Download your free 30-day evaluation here. If you need assistance with your evaluation, contact [email protected]. Product terminology Orion Platform: The common backend platform used by the Solarwinds Orion suite of products, including NPM, SAM, NCM, NTA, and more. The platform provides the backbone for navigation, settings, and common features like alerts and reports. It also provides a consistent look-and-feel across products, giving you a single pane of glass for your Orion monitoring tools. Orion Web Console: The web interface you see when you log on to Orion that is used to view, configure, and manage all of your monitored objects. Check out this video on navigating the Web Console. Orion Application Server: A Windows server that runs the Orion Web console and collects data from monitored objects. Also called the Orion Main Poller. 5
6 Orion Database Server: A Windows SQL server that should be hosted on a dedicated server in a production environment, separately from the Orion Application Server. It stores Orion configuration data and all collected performance and syslog data. Polling Engine (Poller): A Polling Engine controls polling job scheduling, data processing, and queries your monitored devices for performance metrics like CPU, memory, and up/down status. Additional Polling Engines can be licensed to provide additional scalability and capacity. By default, the Orion Server provides one Polling Engine (often referred to as the Main Poller). Related Guide Network Performance Monitor Getting Started Guide: Customize (Part 2 of 2) 6
7 Production installation Complete the following tasks to install a licensed copy of SolarWinds NPM: Plan your production deployment Prepare the Orion SQL Server database Install a licensed copy of SolarWinds NPM Configure the Orion server database Multi-module system guidelines Plan your production deployment Before you install SolarWinds NPM, size your environment. When you properly size your SolarWinds environment, you ensure that the system has enough capability to meet your monitoring needs. Use the following table to size your SolarWinds NPMenvironment. If you are deploying multiple SolarWinds Orion products, refer to the Orion multi-module system guidelines. Server sizing is impacted by: Number of monitored elements: An element is a single, identifiable node, interface, or volume. For example, a router contains two interfaces. The router accounts for three monitored elements: one for the router (a node), and one for each interface. If a switch contains 48 interfaces, then the switch accounts for 49 monitored elements: one for the switch (a node), and one for each of the 48 interfaces. Polling frequency: SolarWinds NPMregularly polls devices to collect data and determine status. If you are collecting statistics every five minutes instead of the default nine minutes, system requirements will increase. Number of simultaneous users: Add 1 GB of RAM for every 25 simultaneous users. SIZE OF DEPLOYMENT PRODUCT APPLICATION SERVER (PHYSICAL OR VIRTUAL) DATABASE SERVER (PHYSICAL RECOMMENDED) Small NPM SL100 - SL500 Quad Core Processor 2.5 GHz or better 8 GB RAM 2 x 146 GB 15K Hard Drives (RAID 1/Mirrored Settings) 1GBE NIC Dual Quad Core Processor 3 GHz or better 8 GB memory Mirrored drives for operating system and 6 disks RAID 1+0 for database data files Hardware RAID Controller Microsoft Windows Server 2016, 2012, 2008 R2 7
8 SIZE OF DEPLOYMENT PRODUCT APPLICATION SERVER (PHYSICAL OR VIRTUAL) DATABASE SERVER (PHYSICAL RECOMMENDED) Windows Server Microsoft SQL Server 2016, 2014, , Windows SP1, 2012, or 2008 R2 Standard Server 2012, Edition Windows Server 2012 R2, Windows Server 2008 R2 SP1 with IIS installed *.NET 4.5; compatible with * Medium NPM SL500 SL2000 Quad Core Processor 2.5 GHz or better 16 GB RAM 2 x 146 GB 15K Hard Drives (RAID 1/Mirrored Settings) 1GBE NIC Windows Server 2016, Windows Server 2012, Windows Server 2012 R2, Windows Server 2008 R2 SP1 with IIS installed *.NET 4.5; compatible with * Dual Quad Core Processor 3 GHz or better 8-16 GB memory Mirrored drives for OS and 6 disks RAID 1+0 for database data files Hardware RAID Controller Windows Server 2016, 2012 or 2008 R2 Microsoft SQL Server 2016, 2014, 2014 SP1, 2012, or 2008 R2 Standard Edition Large NPM SLX Quad Core Dual Quad Core Processor 3 GHz or (with multiple pollers) Processor 3 GHz or better GB RAM 2 x 146 GB 15K Hard Drives (RAID 1/Mirrored Settings) better GB RAM (expandable) Hardware RAID Controller Disk Subsystem 1 Array 1: 2 x 146 GB 15K disks RAID 1 (mirroring) operating system 1 GBE NIC Disk Subsystem 2 Array 2: 2 x 146 GB 15K disks RAID 1 (Pagefile + Extra Storage) 8
9 SIZE OF DEPLOYMENT PRODUCT APPLICATION SERVER (PHYSICAL OR VIRTUAL) DATABASE SERVER (PHYSICAL RECOMMENDED) Windows Server Disk Subsystem 3 Array 3: with 6x 15K 2016, Windows 146 GB or 300 GB Disks configured in Server 2012, a RAID 1+0 arrays to allow for Windows Server maximum write performance. This is 2012 R2, Windows for your SQL MDF AND FILEGROUPS Server 2008 R2 SP1 with IIS installed * Disk Subsystem 4 Array 4: with 4x 15K 146 GB or 300 GB Disks configured in.net 4.5; a RAID 1+0 arrays to allow for compatible with maximum write performance. This is * for your SQL LDF Transaction LOG File 1Gbit LAN port Windows Server 2016, 2012, or 2008 R2 Microsoft SQL Server 2016, 2014, 2014 SP1, 2012, or 2008 R2 Standard Edition * If the server does not have IIS or.net 4.5 installed, the installation automatically installs and configures these components for you. If the server has Internet access, use the online version of the installation. If the server does not have Internet access, use the offline version of the installation. Virtual machine and server requirements Orion application server installations on VMware Virtual Machines and Microsoft Virtual Servers are supported. The virtual machine requirements are identical to the physical server requirements. A dedicated virtual 1GBE NIC is required. Be advised that resource contention could occur in a virtual environment if you have not dedicated physical resources to your Orion Application server virtual machine. Application ports Ports 4369, 25672, and 5672 are opened by default on the main server for RabbitMQ messaging. These ports can be blocked by the firewall. Port 5672 (TCP) is required for RabbitMQ messaging only for NPM 12.0 (Orion Platform version ). 25 (TCP) SMTP port for non-encrypted messages 80 (TCP) default port 161 (UDP) for SolarWinds NPM statistics collection 162 (UDP) for SolarWinds NPM Trap Server listening for incoming messages 9
10 443 (TCP) default port for https binding (also used for bi-directional ESX/ESXi server polling and for Cisco UCS monitoring) 465 (TCP) for SSL-enabled alert actions 514 (UDP) Syslog Service listens for incoming messages 587 ( TCP) for TLS-enabled alert actions 1433 (TCP) for communication between the SolarWinds server and the SQL Server 1434 (UDP) for communication with the SQL Server Browser Service 1801 (TCP) for MSMQ WCF binding 5671 (TCP) for encrypted RabbitMQ messaging (AMQP/TLS) into the main Orion server from all Orion servers (TCP) open for Orion module traffic (HTTPS) open to access the SolarWinds Information Service API and used for agent communication / (HTTP and HTTPS) for the SolarWinds Toolset Integration (TCP) for agent communication on Orion servers running 2008 R2 SP (TCP) required for RabbitMQ messaging (epmd) 5671 (TCP) for RabbitMQ messaging between the primary and additional polling engines 5672 (TCP) for RabbitMQ messaging between the primary and additional polling engines (TCP) required for RabbitMQ messaging (Erlang distribution) Deployment checklist Before installing SolarWinds NPM, complete the pre-installation checklist below. This checklist helps you: Verify that system requirements are met, all required software is installed, and required roles and features are enabled. Gather the information required to complete the installation. Check for antivirus software. Determine if any antivirus software is installed on the server or servers where you plan to install Orion. To ensure the installation goes smoothly, exclude the SolarWinds directory. For example, on Windows Server 2012 R2, exclude C:\ProgramData\SolarWinds\. Do not exclude executable files. SolarWinds assumes that C:\ is the default volume. Check system requirements, and identify system resources on which you install the Orion application server and database. If you are installing SolarWinds NPM into an existing Orion Platform installation, confirm that your environment meets the system requirements in the Multi-module system guidelines. If SolarWinds NPM is the first Orion Platform product that you are installing, ensure that your environment meets the system requirements listed at the top of this page. 10
11 Use the Local Administrator Account for installation. The Local Administrator Account is not the same as a domain account with local admin rights. A domain account is subject to your domain group policies. Ensure you have the correct version of the installation. If your server has access to the Internet, use the online version of the installation. If the server does not have access to the Internet, use the offline version of the installation. Obtain the SQL Server user name and password of a SQL Server database account with sysadmin rights. This may be your SA account. Contact your SQL Database Administrator for this information. Orion uses this account to create its database and to create a new user with read/write access and ownership over its own database. If SolarWinds NPM is the first Orion Platform product that you are installing, ensure that you Prepare the Orion SQL Server database before you install NPM. Determine if your license includes additional polling engines. If it does, refer to install an additional polling engine. Install the additional polling engine after installing SolarWinds NPM on the main polling engine. Determine if your license includes an additional web server. If it does, refer to install an additional web server. Install the additional web server after installing SolarWinds NPM on the main polling engine. Prepare the Orion SQL Server database The SolarWinds Orion database stores all monitoring data. Use these guidelines to configure the database before you install and configure SolarWinds NPM. If you need assistance installing the SQL Server database, refer to the guidelines provided by Microsoft. Ensure that you install the Orion database and the Orion Server on the same domain. The selected SQL Server instance must support mixed-mode or SQL authentication with strong passwords. A strong password must meet at least three of the following four criteria: Contains at least one uppercase letter Contains at least one lowercase letter Contains at least one number Contains at least one non-alphanumeric character, for example, #, %, or ^ For a new database, the user account must be a member of the dbcreator server role. The sysadmin role and the security administrator (SA) user account are always members of dbcreator. For an existing database, the user account needs only to be in the db_owner database role for the existing database. 11
12 For a new SQL account, the user account must be a member of the securityadmin server role. The sysadmin role and the security administrator user account are always members of securityadmin. Set the recovery model of the database to Simple. SolarWinds does not support other methods. Select the authentication method used by the SolarWinds Orion user to access the SolarWinds Orion database. SolarWinds recommends using SQL Server Authentication to ensure the SolarWinds Orion server can always access the SolarWinds Orion database, even when hosted remotely on a separate server. Install a licensed copy of SolarWinds NPM Before you install SolarWinds NPM, ensure that you: Plan your production deployment. Prepare the Orion SQL Server database. Do not install SolarWinds NPM on a domain controller or use the same database server as a Research in Motion (RIM) Blackberry server. 1. Obtain a copy of the software and your activation key from the SolarWinds Customer Portal. See Access the Customer Portal for instructions. The activation key limits your use based on the highest number of monitored network elements. 2. Log in as an administrator to the server on which you are installing SolarWinds NPM. 3. Extract the contents of the downloaded installation.zip file. 4. Run SolarWinds-NPM-<version>-Full.exe. 5. Click Next on the Welcome window. The system scans the environment to ensure that the system requirements are met. If your system is not compatible, the installer provides a link to a knowledge base article with the resolution. When resolved, run the installation again. 6. Accept the terms of the license agreement. 7. Accept the default directory, or click Browse and select a directory. 8. Optionally, enable Quality of Experience (QoE) traffic monitoring. Enabling QoE installs an agent on the Orion Main Polling Engine. This agent collects packet-level traffic statistics, like network response time and application response time, for any application traffic it sees going to or from Orion. SolarWinds recommends that you enable QoE. 9. To begin copying the files, click Next. Downloading and installing Microsoft.NET Framework 4.5 can take more than 20 minutes. If your system reboots, run the installation again. If you are using Microsoft Internet Explorer, SolarWinds recommends you add the URL of your Orion website ( the URL of SolarWinds support ( and about:blank to the list of trusted sites. 12
13 10. When the installation is complete, click Finish. The system prompts you to activate the product. 11. If prompted, install Internet Information Services (IIS). 12. On the activation dialog box, select an Internet option and enter the activation key. If your license includes additional polling engines, refer to install an additional polling engine. Install the additional polling engine after installing SolarWinds NPM on the main polling engine. If your license includes an additional web server, refer to install an additional web server. Install the additional web server after installing SolarWinds NPM on the main polling engine. Configure the Orion server database In the final step of the installation process, the system establishes a connection between the Orion application server and the Orion database, configures the database, and configures the application. If you are installing a SolarWinds product into an existing Orion Platform deployment, configuring the Orion server database is not required. Before you begin Prepare the Orion SQL Server database Install a licensed copy of SolarWinds NPM Confirm that the IIS Manager is not open while the Configuration Wizard is running. Close all web browsers. Configure the Orion server and database 1. If the Configuration Wizard does not load automatically, start the Configuration Wizard in the SolarWinds Orion > Configuration and Auto-Discovery program folder. 2. On the Welcome dialog box, click Next. 3. If prompted to stop services, click Yes. 13

14 4. On the Database Settings dialog box, select an SQL Server and authentication method, and click Next. Use SQL Server Authentication to ensure the SolarWinds Orion server can always access SQL Server, even when hosted remotely on a separate server. 5. On the Database Settings dialog box, click Create a new database or select an existing database, and click Next. Only use alphanumeric characters in database names. 6. On the Database Account dialog box, create a new account or use an existing account that the polling engine and Web Console use to access the database, and click Next. 14

15 7. On the Website Settings dialog box: a. Select All Unassigned unless your environment requires a specific IP address for the Orion Web Console. b. Specify the Port and the Website Root Directory where the system will install the web console files. If you specify any port other than 80, include that port in the URL used to access the Web Console. c. To use this function, click Yes - Enable automatic login using Windows Authentication. 8. If prompted to create a new directory or website, click Yes. 9. Review the list of services to install, and click Next. 10. Click Yes if prompted to disable the SNMP Trap Service and enable the SolarWinds Trap Service. 11. On the Completing the Orion Configuration Wizard dialog box, click Next. 12. When completed, click Finish to launch the Orion Web Console. 13. Log in with user name admin and leave the password field blank. The Orion Web Console opens. For security purposes, SolarWinds recommends that you change the password to your admin account. Multi-module system guidelines If you have more than one Orion Platform product, use these recommended guidelines for hardware and software deployment. The information here should be considered guidelines only. You can choose to use more or less hardware but your performance may vary depending on your deployment scenario. 15
16 If you have only one Orion module, refer to the system requirements listed in the administrator s guide for that module. Small deployment guidelines Modules You can install NTA as part of a small deployment, but it is not included in this configuration. Use the Medium Deployment guidelines for NTA. Choose up to 3 modules: NPM SL100 - SL500 (including up to 10 remote agents for DPI) SAM AL150 - AL300 WPM 5 - WPM 20 VNQM IPSLA 5 - IPSLA 25 (up to 5,000 operations) NCM DL50 - DL200 IPAM IP IP4000 UDT UT Orion Application Server Specifications Physical server or virtual machine Quad core processor or better 8-16 GB RAM 150 GB, 15,000 RPM 1 x 1 Gb dedicated NIC Windows Server 2016, 2012 R2, 2012, or 2008 R2 SP1 The Orion installer installs IIS (32-bit mode) and.net 4.5 if they are not already on your server. SQL Database Server Specifications Physical server recommended Quad core processor or better 16 GB RAM 100 GB 1 (or more) storage in RAID 1+0 configuration (RAID 5 not supported) Windows Server 2016, 2012 R2, 2012, or 2008 R2 SP1 Microsoft SQL Server 2016, 2014, 2012, or 2008 R2 Standard Edition 1 More or less space may be needed depending on your data retention policies, number of elements measured, and polling frequency. Medium deployment guidelines Modules NPM SL500 - SL2000 NTA for NPM SL ,000 FPS received sustained on the main poller 16
17 2-4 additional modules: SAM AL700 - AL1100 WPM 50 - WPM 200 VNQM IPSLA 25 - IPSLA 50 (up to 10,000 operations) NCM DL500 - DL1000 IPAM IP16,000 UDT UT10,000-25,000 Orion Application Server Specifications Physical server or virtual machine Quad core processor or better 16 GB RAM 150 GB, 15,000 RPM 1 x 1 Gb dedicated NIC Windows Server 2016, 2012 R2, 2012, or 2008 R2 SP1 The Orion installer installs IIS (32-bit mode) and.net 4.5 if they are not already on your server. SQL Database Server Specifications NTA Flow Storage Database Server Specifications Physical server recommended Dual quad core processor or better 64 GB RAM 250 GB 2 (or more) storage in RAID 1+0 configuration (RAID 5 not supported) Hardware RAID Controller (software RAID not supported) Windows Server 2016, 2012 R2, 2012, or 2008 R2 SP1 Microsoft SQL Server 2016, 2014, 2012, or 2008 R2 Standard Edition Physical server or virtual machine Quad core processor or better 16 GB 3 RAM 100 GB - 1 TB 4 of storage capacity on local NTFS disk 1 x 1 Gb dedicated NIC Windows Server 2012 R2, 2012, or 2008 R2 SP1 NTA-specific information NTA If the server is running a 32-bit operating system, NTA 4.0 stores flow data in the SQL Database (NTA Flow Storage Database is not installed). For more information, see Requirements for the Orion Database Server and NTA 4.0 Installation: Frequently Asked Questions. NTA NTA 4.1 only works with a 64-bit operating system. SolarWinds recommends a separate NTA Flow Storage Database. 17
18 2 More or less space may be needed depending on your data retention policies, number of elements measured, and polling frequency. 3 RAM for the NTA Flow Storage Database should be increased as the database size increases. 4 More or less space may be needed depending on your data retention policies and the number of flows stored. You need approximately 8 GB of additional storage for every 1000 flows that are retained for 30 days. For example, if you want 50,000 flows stored for 30 days, you need a base of 100 GB plus an additional 400 GB of storage. Large deployment guidelines Modules NPM SLX (with multiple pollers) NTA for NPM SLX 50,000 FPS received sustained on the main poller Up to 6 pollers (5 in addition to the main poller) for 300,000 FPS received sustained Any combination of these modules: SAM ALX 1 APE for every 10,000 component monitors Maximum of 50,000 component monitors per primary Orion SAM server + 4 APEs VNQM IPX ~5,000 IP SLA operations per polling engine NCM DLX 1 APE for every 10,000 devices, for NCM 7.1 and later Maximum of 30,000 devices per NCM instance (that is, NCM server + 2 NCM APEs) IPAM IPX 750,000 IP UDT UTX 150,000 ports per polling engine Orion Application Server Specifications Physical server or virtual machine Quad core processor or better 32 GB RAM 150 GB, 15,000 RPM 1 x 1 Gb dedicated NIC Windows Server 2016, 2012 R2, 2012, or 2008 R2 SP1 The Orion installer installs IIS (32-bit mode) and.net 4.5 if they are not already on your server. 18
19 SQL Database Server Specifications NTA Flow Storage Database Server Specifications Additional Polling Engine Server Specifications Physical server recommended Dual quad core processor or better 128 GB RAM Hardware RAID Controller (software RAID not supported) Disk Subsystem 1 Array 1: 2 x 146 GB 15,000 disks RAID 1 (mirroring) operating system Disk Subsystem 2 Array 2: 2 x 146 GB 15,000 disks RAID 1 (Pagefile + extra storage) Disk Subsystem 3 Array 3: with 6x 15, GB or 300 GB disks configured in a RAID 1+0 arrays to allow for maximum write performance. This is for your SQL MDF AND FILEGROUPS Disk Subsystem 4 Array 4: with 4x 15, GB or 300 GB disks configured in a RAID 1+0 arrays to allow for maximum write performance. This is for your SQL LDF Transaction LOG file Disk Subsystem 5 Array 5: with 4x 15k 146 GB or 300 GB disks configured in a RAID 1+0 array for your tempdb data file Disk Subsystem 6 Array 6: with 4x 15k 146 GB or 300 GB disks configured in a RAID 0 array for your tempdb log file 1 Gb LAN port Windows Server 2016, 2012 R2, 2012, or 2008 R2 SP1 Microsoft SQL Server 2016, 2014, 2012, or 2008 R2 Standard Edition Physical server or virtual machine Quad core processor or better 16 GB 3 RAM 100 GB - 1 TB 4 of storage capacity on local NTFS disk 1 x 1 Gb dedicated NIC Windows Server 2012 R2, 2012, or 2008 R2 Virtual machine recommended Quad core processor or better 32 GB RAM 150 GB, 15,000 RPM 1 x 1 Gb dedicated NIC Windows Server 2016, 2012 R2, 2012, or 2008 R2 The Orion installer installs IIS (32-bit mode) and.net 4.5 if they are not already on your server. 19
20 NTA-specific information NTA If the server is running a 32-bit operating system, NTA 4.0 stores flow data in the SQL Database (NTA Flow Storage Database is not installed). For more information, see Requirements for the Orion Database Server and NTA 4.0 Installation: Frequently Asked Questions. NTA NTA 4.1 only works with a 64-bit operating system. SolarWinds recommends a separate NTA Flow Storage Database. 20
21 Evaluation installation Complete the following task to install an evaluation copy of SolarWinds NPM: Install an evaluation copy of SolarWinds NPM Install an evaluation copy of SolarWinds NPM The evaluation version of SolarWinds NPM is a full version of the product, functional for 30 days. After the evaluation period, you can easily convert your evaluation license to a production license by obtaining and applying a license key. For evaluation installations only, you can install the Orion server and the Microsoft SQL Server database on the same machine. The installer automatically installs SQL Server You can use that database, or configure the server to use another MS SQL database. Do not use MS SQL Server Express in a production deployment. Before you start installing SQL Express 2014 on the same computer as the Orion server, ensure.net 3.5 is installed. To use a separate Microsoft SQL Server database, or if you are installing SolarWinds NPM into the production deployment of another module, see Plan your production deployment. For evaluation installations only, installation on a desktop operating system is possible, but not supported. SolarWinds NPM is intended for use in a production environment that meets the NPM system requirements. Do not install SolarWinds NPM on a domain controller or use the same database server as a Research in Motion (RIM) Blackberry server. EVALUATION AND PRODUCTION ENVIRONMENTS Windows Server 2008 R2 SP1 Windows Server 2012 Windows Server 2012 R2 Windows Server 2016 EVALUATION ENVIRONMENTS ONLY Windows 7 SP1 Windows 8 (except for Standard Edition) Windows 8.1 (except for Standard Edition) Windows 8.1 Update 1 (except for Standard Edition) Windows 8.1 Pro, and Windows 8.1 Enterprise (Pro or Enterprise version recommended) Windows 10 To install an evaluation copy of SolarWinds NPM: 21
22 1. Download an evaluation version of SolarWinds NPM from This installation is functional for 30 days and for evaluation purposes only. No activation key is required. 2. Log in to the server as an administrator. 3. Run SolarWinds-NPM-<version>-Eval.exe. 4. If prompted, register your address. 5. Click Next on the Welcome window. The system scans the environment to ensure that the system requirements are met. If your system is not compatible, the installer provides a link to a knowledge base article with the resolution. When resolved, run the installation again. 6. Accept the terms of the license agreement. 7. To use the Microsoft SQL Server Express database that installs with the product, click Express Install. To use your own Microsoft SQL Server database, click Advanced Install. 8. Select your preferred settings. 9. Enable quality of experience traffic monitoring. Enabling QoE installs an agent on the Orion Main Polling Engine. This agent collects packet-level traffic statistics, like network response time and application response time, for any application traffic it sees going to or from Orion. SolarWinds recommends that you enable QoE. 10. Review the list of software the system installs. Downloading and installing Microsoft.NET Framework 4.5 can take more than 20 minutes. If your system reboots, run the installation again. If you are using Microsoft Internet Explorer, SolarWinds recommends you add the URL of your Orion website ( the URL of SolarWinds support ( and about:blank to the list of trusted sites. 11. When the installation is complete, the system configures the product. Click Finish to open the Orion Web Console Login page. If the login page does not open automatically, launch the Orion Web Console in your SolarWinds Orion program folder. 12. Log in with user name admin and leave the password field blank. The Orion Web Console opens. For security purposes, SolarWinds recommends that you change the password to your admin account. 22
23 Discover This section contains the following network discovery topics: What should I monitor? Discover your network Add discovered devices to SolarWinds Orion Add a single node for monitoring Advanced discovery What should I monitor? Discovery is the term used to describe the process SolarWinds Orion uses to identify network elements. During discovery, SolarWinds Orion scans the network for nodes, and when a node and associated elements are found, you can you can add them to the SolarWinds Orion database for monitoring. The first time you discover your network, SolarWinds recommends adding a limited number of edge routers or switches, firewalls and load balancers (if you have them), and critical physical or virtual servers and hosts. After you have the monitoring, alerts, and reports set up, SolarWinds recommends adding more nodes. Discovery checklist When you run the Discovery Wizard, you will be asked to provide IP addresses and credentials for the devices you want to monitor. SolarWinds recommends that you gather this information before running the Discovery Wizard. Determine the devices to monitor. Determine the protocol used to monitor your devices. If you are monitoring devices using SNMP, you must enable SNMP on those devices because it is not enabled by default. SNMP is primarily used to monitor network devices, for example, routers, firewalls, and switches. To enable SNMP, consult the device vendor documentation. If you are monitoring Windows servers, use WMI. WMI is usually enabled on Windows devices by default. Agentless monitoring using WMI is not recommended when the poller and the device are separated by a firewall. To overcome this limitation, SolarWinds provides an optional agent that allows you to securely monitor Windows servers and applications by WMI. The following table outlines the pros and cons of using SNMP and WMI. For Windows servers, SolarWinds recommends using WMI polling. For a non-windows server, SolarWinds recommends using SNMP. 23
24 SNMP WMI Bandwidth, CPU, memory usage on the host/poller Monitoring across firewall/nat-ed WAN connection Uses more bandwidth, CPU, and memory than SNMP per poll. Requires an agent for secure monitoring over one port. Windows mount points and application metrics Cannot collect Windows mount point statistics or application level metrics. For additional information, see WMI vs. SNMP polling on the SolarWinds Customer Success Center. When configuring your SNMP-enabled network devices for monitoring: For correct device identification, monitored devices must allow access to the SysObjectID. Unix-based devices should use the version of Net-SNMP (5.5 or later) that is specific to the Unix-based operating system in use. SolarWinds NPM can monitor VMware ESX and ESXi Servers versions 4.0 and later with VMware Tools installed. If SNMPv2c is enabled on a device you want to monitor, by default, SolarWinds NPM attempts to use SNMPv2c to poll the device for performance information. To poll using only SNMPv1, you must disable SNMPv2c on the polled device. IP ranges or individual IP addresses you want the system to scan as it discovers your network. SNMP v1/2c community strings and SNMP v3 community strings and credentials of the devices you want to monitor. Log in credentials for each monitored device. VMware host credentials. The system requires read-only permissions. Windows credentials: domain or local admin. Discover your network Check out this video on discovering your network. Discovery is a term used to describe the process SolarWinds Orion uses to identify network elements. Before you discover your network: 24
25 Ensure that you determine what to monitor Enable the networking devices you want to monitor for SNMP Enable Windows devices for WMI The first time you discover your network, SolarWinds recommends adding a limited number of edge routers or switches, firewalls, load balancers (if you have them), and critical physical or virtual servers and hosts. 1. If the Discovery Wizard does not start automatically after configuration, click Settings > Network Discovery. 2. Click Add New Discovery, and then click Start. 25
26 3. On the Network panel, if this is your first discovery, add a limited number of IP addresses. As you scale your implementation, you can use the following scanning options. Option IP Ranges Subnets IP Addresses Active Directory Description Use this option when you want Orion to scan one or more IP ranges. If you have many IP ranges to scan, consider adding multiple discovery jobs rather than including all ranges in a single job. Use this option to scan every IP address in a subnet. SolarWinds recommends scanning at most a /23 subnet (512 addresses max). Scanning a subnet returns everything that responds to ping, so we recommend only scanning subnets where the majority of devices are objects you want to monitor. Use this option for a limited number of IP addresses that do not fall in a range. Since a network discovery job can take a long time to complete, SolarWinds recommends using this option when you are first starting out. Use this option to scan an Active Directory Domain Controller. Using Active Directory for discovery is particularly useful for adding large subnets because Orion can use the devices specified in Active Directory instead of scanning every IP address. 4. If the Agents panel appears, you enabled the Quality of Experience (QoE) agent during installation. The QoE agent monitors packet-level traffic. If there are any nodes using agents, select the Check all existing nodes check box. This setting ensures that any agents you deploy, including the one on your Orion server, are up-todate. If there are no nodes using agents, you can leave this option unchecked. 26
 on the host.")
27 5. On the Virtualization panel, to discover VMware vcenter or ESX hosts on your network: a. Check Poll for VMware, and click Add vcenter or ESX Credential. b. Select <New credential> and provide required information. If you do not add the host credentials, Orion still discovers the virtual machines (VMs) on the host. However, you will not be able to see the relationships mapped between the VMs and hosts. 6. On the SNMP panel: a. If all devices on your network require only the default SNMPv1 and SNMPv2 public and private community stings, click Next. b. If any device on your network uses a community string other than public or private, or if you want to use an SNMPv3 credential, click Add Credential and provide the required information. 27

28 7. On the Windows panel, to discover WMI or RPC-enabled Windows devices, click Add New Credential and provide the required information. SolarWinds recommends that you monitor Windows devices with WMI instead of SNMP. 8. On the Monitoring Settings panel, SolarWinds recommends manually setting up monitoring the first time you run discovery. This allows you to review the list of discovered objects and select the ones you want to monitor. When you scale monitoring, you can configure discovery to automatically start monitoring objects it finds. 28

29 9. On the Discovery Settings panel, click Next. 10. Accept the default frequency and run the discovery immediately. Discovery can take anywhere from a few minutes to a few hours, depending on the number of network elements the system discovers. Add discovered devices to SolarWinds Orion Check out this video on adding devices to SolarWinds NPM. After the Network Sonar Wizard discovers your network, the Network Sonar Results Wizard opens, allowing you to import network elements into the SolarWinds Orion database. Discovered elements do not count against your license count; only elements that you import into the Orion database count against your license. When you manually run discovery, by default, the system automatically selects all network elements to be monitored. You must clear the check boxes for elements you do not want monitored. Before you begin, ensure that you Discover your network. If you are discovering your network for the first time, SolarWinds recommends that you monitor a small number of devices. 29

30 1. Ensure that only the device types you want to monitor are selected, and click Next. If a device appears as unknown vendor, it means that SolarWinds NPM could not validate the credentials. As a result, SolarWinds NPM can only detect if the device is up or down, and cannot collect any other data. To resolve this issue, verify the SNMP configuration on the device. If the credentials still cannot be validated, and you have an active SolarWinds contract, contact technical support. 2. Ensure the interfaces you want monitor are selected, and click Next. SolarWinds recommends that you do not monitor VoIP interfaces or NULL interfaces. By default, SolarWinds Orion imports interfaces that are discovered in an Operationally Up state. However, because interfaces may cycle off and on, you can also select Operationally Down or Administratively Shutdown states for import. 30

31 3. Ensure the volume types you want to monitor are selected, and click Next. SolarWinds recommends that you do not monitor compact disks or removable disks. 4. Review the list of elements to be imported, and click Import. 5. When the import completes, click Finish. 6. Click the Home tab to begin exploring your network. 31

32 Add a single node for monitoring As an alternative to using the Network Sonar Discovery wizard, you can add individual nodes for monitoring. Adding a single node offers more detail in monitoring and is the recommended approach when you have a node with high latency. Do not include nodes with high latency in a discovery job. As you add a single node for monitoring, you can: Select the statistics and resources to monitor. Add Universal Device Pollers. Identify how often the node status, monitored statistics, or topology details are updated. Add custom properties. Edit alert thresholds. To add a single node for monitoring: 1. Log in to the Orion Web Console as an administrator. 2. Click Settings > Manage Nodes, and then click Add a Node. 3. Specify the node, and click Next. a. Provide the host name or IP address. b. Select the polling method, and provide credentials. 32

33 4. Select the statistics and resources to monitor on the node, and click Next. 5. If you want to monitor a special metric on the node and have defined the metric using a custom poller, select the poller on the Add Pollers pane, and click Next. 6. Review and adjust the device properties. a. To edit the SNMP settings, change the values, and click Test. b. To edit how often the node status, monitored statistics, or topology details are updated, change the values in the Polling area. For critical nodes, you may need to poll status information or collect statistics more frequently than the default polling intervals. Change the polling intervals if polling the nodes takes too long. c. Enter values for custom properties for the node. The Custom Properties area will be empty if you have not defined any custom properties for the monitored nodes. See "Add custom properties to nodes" in the SolarWinds Getting Started Guide - Customize. d. To adjust when the status of the node changes to Warning or Critical, edit alerting thresholds for the metric. Select the Override box and set thresholds specific for the node. 7. Click OK, Add Node. The node will be monitored according to the options you set. Advanced discovery Check out this video on managing discovery jobs and performance. At this point you have completed an initial discovery. Now you can add discoveries to include other segments of your IT environment. Discovery jobs do not impact polling. Polling is prioritized first. 33

34 Multiple jobs. SolarWinds recommends building as many discovery jobs as needed to scan your network. Initially, run the jobs immediately so you can see everything on your network, and then schedule the jobs to run periodically. Dividing the discovery into multiple jobs makes it easier to be selective about what to monitor, and decreases the amount of time each job runs. When you have a large environment, consider dividing discovery jobs by: Credentials - the more credentials you have, the longer it takes for the discovery job to complete. Place the most common credentials at the top of the list. IP address range - use a range that consists of fewer than 2,000 IP addresses. In a range, unresponsive IP addresses slow down discovery. Latency - run discoveries for remote offices separately so that you can adjust the timeout threshold. Polling engine - if you have multiple polling engines, configure a discovery for a specific polling engine. Discovery ranges. Although you can discover specific nodes, SolarWinds recommends using a range of IP addresses or subnets for a more complete picture of your network. None of the discovered elements count toward your license total or affect system performance until you begin monitoring. You can add multiple IP ranges or subnets to the same scan, but you cannot include IP ranges and subnets in the same scan. Discovery thresholds. If you run a discovery and nodes you expect to see are not found, you may need to adjust the timeout and retry thresholds. In an environment with high latency, the default values may not be high enough. Only adjust these values after an initial scan. The higher the threshold value, the longer the discovery job takes to complete. 34

35 Polling engine. If you have multiple polling engines, you will see an option to select a polling engine. The polling engine you select runs the discovery job and monitors your network. SolarWinds recommends that you limit a poller to 12,000 elements, so be careful not to overload one polling engine. If you have a large environment with significant differences in latency, position the polling engine close to the monitored objects. Schedule intervals. Schedule your discovery jobs to run periodically to identify new devices that were added to your network. Unless you work in a dynamic environment where new devices are frequently added to your network, SolarWinds recommends scheduling discovery daily. You can also select Advanced from the Frequency drop-down menu to create a custom frequency. The schedule interval you choose depends on how often you want to scan for changes to the network and the size and performance of your deployment. Scheduled results. A manual, scheduled discovery only finds network elements, but does not automatically start monitoring. You must select what you want the system to monitor. If the scheduled job locates nodes that you do not want to monitor, select those nodes and click Add to Ignore List. Ignoring hides elements from the results list the next time the discovery job runs. Scheduled discovery profiles should not use IP address ranges that include nodes using DHCP. 35
36 Monitor This section includes instructions on how to explore and troubleshoot network problems: Navigate SolarWinds NPM Identify and troubleshoot a node that has a problem Identify and troubleshoot an interface that has a problem Monitor your network paths Plan to scale monitoring Navigate SolarWinds NPM Check out this video on navigating the Web Console. After you have installed and configured SolarWinds NPM, you can log in to the Web Console. The following terms will help as you explore SolarWinds NPM: Orion Platform: The common backend platform used by the Solarwinds Orion suite of products, including NPM, SAM, NCM, NTA, and more. The platform provides the backbone for navigation, settings, and common features like alerts and reports. It also provides a consistent look-and-feel across products, giving you a single pane of glass for your Orion monitoring tools. Orion Web Console: The web interface you see when you log on to Orion that is used to view, configure, and manage all of your monitored objects. You can access the Orion Web Console from any computer connected to the internet. View: An individual page in the web console. Resource: The widgets or informational blocks that make up a view. Element: Anything that can be monitored by Orion. 36

37 When you first log in, tabs appear at the top of the web console. Other than Home, each application tab corresponds to an Orion module. If you have installed only SolarWinds NPM, then you will see a Home tab and a Network tab. Tabs contain views, which are pages within the Orion Web Console. The Home tab contains views that are common among all Orion modules. The Network tab contains views specific to SolarWinds NPM, for example, Network Top

38 Views contain resources, which show you the details and statistics of whatever you are monitoring. Views can be customized to include any resources you want. You have hundreds of resources from which to choose. Overview of an element Within a view, elements that appear in green are up and running, and working as expected. Elements that appear red or partially red need attention. In this example, all nodes are up, but node Cur-Nor5520 has an issue as indicated by the red square that appears next to the node name. The red square indicates that the system is monitoring a child of that node, for example, an interface. You can explore a node by placing your cursor over a monitored element to see its details. In this example, one or more interfaces are down. Check out this video on viewing your devices. 38

39 Details of an element Elements within a view are dynamically linked so you can drill down and view the details of the element. In this example, the Cur-Nor5520 node was selected on the NPM Summary view, and the Node Details page opens. The Current Percent Utilization of Each Interface resource provides more information about interfaces. Identify and troubleshoot a node that has a problem Before you begin: Add discovered devices to SolarWinds Orion Allow SolarWinds NPM to monitor the devices long enough to collect data. 39

40 By default, devices monitored by NPM are polled for data every nine minutes. It might take some time before all the nodes you added have data you can review. Step 1: Determine there is a problem The easiest way to identify a problem is to have an alert notify you. Some alerts are enabled by default. You can enable additional alerts described later in this guide. The Node down alert is enabled by default. Therefore, if a node goes down (that is, it does not respond to a ping), you will see it immediately in the Active Alerts resource on the Home page. Down nodes appear in resources as red (down) or yellow (warning). If you have configured your alerts to send , you will get an when a node goes down. If you do not see any alerts, click My Dashboards > Network > Network Top

41 The resources on this page help identify nodes that respond to a ping but have other health problems. Step 2: Get more details about the node When you find a node with a problem, click the node name in any resource to open the Node Details page. If a node is down (red), this means it does not respond to a ping. To resolve an issue of this severity: 41

42 1. Check the power. Is it plugged in? 2. Check the LAN link light. Is it connected to the network? 3. Log in to the device and begin troubleshooting it. If a node responds to a ping but shows signs of health or performance issues, use the information on the Node Details page to help troubleshoot. Check the Response Time, Packet Loss, CPU load, and Memory Utilization. Usually, those statistics are the first indicators of a problem. In our example, the CPU load on this node is high. 42

43 Use the Network Latency & Packet Loss, as well as the Min/Max/Average Response Time resources to see if this is a momentary problem or a continuing issue. Min/Max/Average Response Time & Packet Loss 43
44 44

45 Depending on what type of node you are monitoring, you may see additional resources specific to that type of device. For example: Hardware health: Reports on physical elements of the hardware for Cisco, Dell, F5, HP, and Juniper. Routing table information: For routers and switches, multiple resources show a variety of route-related information. Look under the Network subview for these resources. Routing Neighbors Routing Table 45

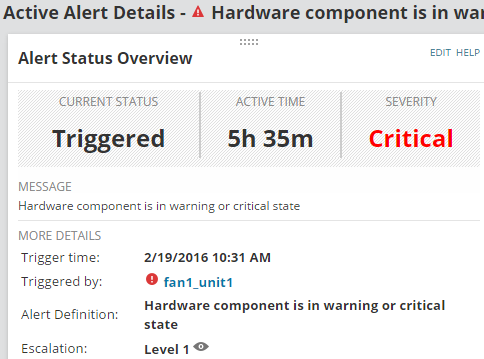
46 Default Route Changes Step 3: Get more details about the alert When a problem causes an alert to be issued, that alert appears on the Node Details page in the Alerts for this Node resource. Click the alert name to go to the Alert Details page. Use the resources on this page to investigate the cause of the alert. 46

47 Alert Status Overview: Tells you when the alert happened, its importance, and whether or not it was acknowledged. History: If the same alert is triggered repeatedly, there may be a systemic problem. For example, if a device frequently goes up and down, it may be a sign of a flapping route. Other Objects: Sometimes the same alerts occur on multiple nodes because of a single trigger. For example, if an edge device is having problems, any devices that are dependent on the edge device might also report problems. Acknowledge: Acknowledging an alert indicates that you are aware of the issue and the problem is being investigated. Alert Notes: Each person troubleshooting an issue can enter notes about their activities and any discoveries. The Acknowledge and Notes features are helpful when multiple people are troubleshooting a problem. 47

48 Identify and troubleshoot an interface that has a problem Before you begin: Add discovered devices to SolarWinds Orion Monitor one or more interfaces on at least one device. Allow SolarWinds NPM to monitor the devices long enough to collect data. By default, devices monitored by NPM are polled for data every nine minutes. It might take some time before all the nodes you added have data you can review. Step 1: Determine there is a problem In the topic Identify and troubleshoot a node that has a problem, alerts are triggered when a node goes down. Alerts can also be triggered when an interface has a problem, such as high utilization or the interface going down. The Nodes with Problems resource provides information about the interfaces associated with each node. A square in the bottom-right corner of the node icon indicates that the node has an interface with a problem: - In this example, a red square indicates that one or more interfaces are down. - In this example, a gray square indicates that the status of one or more interfaces is unknown. 48

49 In your environment, you might not have any down interfaces. To find an interface with issues that need to be investigated, click My Dashboards > Network > Network Top 10 to open the Network Top 10 view. Review the following resources on this page. Top 10 Interfaces by Percent Utilization This resource shows the interface s transmit and receive utilization as a percent of total interface speed. By default, utilization rates from 70-90% are yellow (warning), and utilization over 90% is red (danger). These thresholds are configurable. Any interface with high utilization deserves more investigation. Top 10 Interfaces by Traffic This resource shows how much actual traffic is on an interface. Usually, WAN interfaces will be on this list because of the volume of traffic they process. 49

50 Top 10 Errors & Discards Today This resource shows: Errors: A packet that was received but could not be processed because there was a problem with the packet. Discards: A packet that was received without errors but was dropped, usually because interface utilization is near 100%. Step 2: Get more details about the interface If an interface is down (red), that generally means there is no connection: 1. Check the parent device to ensure it is operating. 2. Check the cable for physical connectivity problems. Once you have found an interface with a problem (or, if all your interfaces are healthy, an interface with high utilization, errors, or discards), click the interface name in any resource. The Interface Details page opens. 50
51 Check the Percent Utilization resource for the last-polled value of transmit and receive utilization. If those values are high, you can also check the Percent Utilization Line Chart to see the duration of the problem. 51

52 The Interface Downtime resource displays the interface status for the last 24 hours. If the interface status changed, you can see it in this resource. In the following example, the resource shows that the interface had one period when its status was unknown during the last 24 hours, but it is currently up. The Interface Errors & Discards resource can also indicate problems. Since this device has high discards, and high discards are generally caused by a full buffer, check the Node Details for this device and determine if the buffer is full. Step 3: Get more details about the problem The Node Details page can help you diagnose an interface problem. Click the node name at the top of the Interface Details page to open the Node Details page. Examine the following resources on this page. Min/Max/Average Response Time & Packet Loss This resource shows the average load on the CPU for this node. In this case, the load spiked dramatically around 1:30 PM, which warrants further investigation. 52
, implying correlation")
53 Network Latency & Packet Loss This resource shows the latency (response time) and packet loss for the entire node. A spike in response time occurred at the same time as the spike in the average CPU load (shown above), implying correlation between the events. 53
54 These resources indicate an unknown increase in traffic that occurred at approximately 1:30 PM, leading to higher interface utilization, CPU load, and dropped packets. Since values are not yet critical and no alerts have been triggered, it might not be a concern, but if you wanted to continue troubleshooting, you could perform the following actions: Determine if there were any configuration changes around that time. If you have Network Configuration Manager, you can use it to look up configuration changes. If you are monitoring traffic (for example, with Network Traffic Analyzer), explore the cause of the traffic spike. Monitor your network paths Check out this video on using NetPath. Use NetPath to discover and troubleshoot network paths hop-by-hop not only the part of the network that you manage, but also nodes and links of your providers. NetPath : Creates a detailed (potentially multi-path) map between a Windows node and a destination you specify. Overlays the path with performance metrics and device details of the nodes, interfaces, and connectors it finds. 54
55 Quickly identifies problem areas. Hover over objects to see more details using the Object Inspector, or drill down on managed nodes. Notes: You must open certain ports on your firewall for network connectivity used by NetPath. For more information, see the "NetPath Requirements" section in the SolarWinds Network Performance Monitor 12.0 Administrator Guide. NTA 4.2 and NCM are the minimum required versions to use the Orion integration features with NetPath. Create a NetPath service In this scenario, Salesforce has been slow, and you want to analyze the path to find out where the problem is. 1. Click My Dashboards > Network > NetPath Services. 2. If this is your first time using NetPath, you ll see an introductory wizard that shows how NetPath works. Otherwise, click Create New Service. 3. In the Hostname field, enter login.salesforce.com, and in the Port field, enter Enter Salesforce as the alias. 55
56 5. Set the Probing Interval to 10 minutes, and click Next. Probing frequency determines how often Orion discovers the path and measures the path's performance. 6. Assign a probe to the path. The Orion main poller includes a probe you can use, or you can add a probe to a Windows device. 56
57 7. Click Create. It takes the system at least the time specified as the probing interval to map the path. For more information on NetPath, or if you are unable to get NetPath working, see the "Discover your network paths" chapter in the SolarWinds Network Performance Monitor 12.0 Administrator Guide. Troubleshoot with NetPath After NetPath maps the path, you can see your internal network, traversed segments of ISP networks, and the destination network, plus the details and statuses of the objects on the route. You can use the controls in the top left of the page to zoom in and out, and to control the level of detail shown. The path between SolarWinds Austin HQ and Salesforce shows the maximum level of detail. 57

58 NetPath monitors paths at regular intervals (the probing interval) and keeps historical data, which is shown in the Path History section at the bottom of the page. You can see in this example that the path is fine now, but was red a few intervals ago. Click the red bar to see the path at that time. Notice that the path is different during this time period than the current time. That s normal. Paths can and do change over time. If you look closely at the red object, you can see that it s actually two objects. Double-click the object to expand it. 58

59 If you single-click the individual device that s causing the problem, the Object Inspector opens. It looks like this device had high packet loss during this 10 minute time period, but the problem seems to be resolved. If you had caught this while it was happening, you could use the information in the Object Inspector to contact the device s owner and report the problem. And because NetPath keeps a history of each path, you can identify trends over time, and troubleshoot intermittent problems. Plan to scale monitoring You installed and configured your Orion product, discovered part of your IT environment, and have monitoring statistics displayed in Orion Web Console views. As you continue the deployment, consider the following questions: 59
60 Are there any gaps in your monitoring coverage? Is there an essential device whose failure could affect your environment? Are there less important devices or applications that you want to monitor? Are there other groups or locations that you might want to monitor? As you deploy monitoring across your environment, you can: Add discoveries to include other segments of your IT environment. Add individual nodes for monitoring. This is the recommended approach when you have a node with high latency. 60

61 Alerts and reports This section includes information on working with preconfigured alerts and reports: How alerts work Work with preconfigured alerts How reports work Run a preconfigured report How alerts work An alert is notification that there is a problem with a monitored element. Orion comes with hundreds of predefined alerts for common problems such as a node or application going down, high interface utilization or packet loss, and many other problems. Many predefined alerts are enabled by default, so if there are problems, you are alerted as soon as you Discover your network and Add discovered devices to SolarWinds Orion. SolarWinds recommends that you identify who will receive warning or critical alerts. By default, alerts appear in the Active Alerts resource on the Orion Home page. To see all alerts, you can click the All Active Alerts button in the Active Alerts resource, or you can go to Home > Alerts. On this page, you can: Acknowledge an alert that you are working on Click on any alert to go to the Alert Details page for more information Click Manage Alerts to enable/disable, add or edit any alert 61

62 You can create your own alerts, either by modifying a predefined alert, or by creating a custom alert. Alerting is very powerful and can be complex, with multiple trigger conditions, reset conditions, and actions. The trigger condition defines the event that must occur to activate an alert. Trigger conditions are built using child conditions, which are evaluated in order. Work with preconfigured alerts Check out this video on managing existing alerts. When an alert triggers, any associated alert actions also trigger, and the alert appears on the All Active Alerts page. In the all Active Alerts page you can view the details of alert, view the details of the monitored element that triggered the alert, and acknowledge the alert. 1. To view the alert details, click the alert. The Active Alert Details page appears. 62
63 63
64 2. To view the details of the network object that triggered the alert, click an object. The details page of the selected object appears. 64

65 3. To acknowledge an alert: a. Click Acknowledge. b. Enter a note and click Acknowledge. When acknowledged, the alert will not trigger again. List preconfigured, enabled alerts SolarWinds NPM ships with preconfigured, enabled alerts, and a number of disabled alerts that you can enable and make operational. To see the list of preconfigured, enabled alerts: 1. Click Alerts & Activity > Alerts. 2. Click Manage Alerts. 3. In the Group by field, select Enabled. 65

66 4. In the Type field, sort by Out-of-the-box. 5. Review the list of preconfigured, enabled alerts. Enable and disable alerts To enable or disable alerts, on the Manage Alerts page, click On or Off in the Enabled column. Action types You can configure an alert to trigger one or more actions, such as: Send an Send a page Manage a virtual machine (for example, power on/off) Log the alert to send a file A complete list of alert actions is available on the Add Action dialog box that you see when you configure an alert. 66
67 Configure the default action A common alert action is for SolarWinds Orion to send an to one or more responsible parties who can open the Web Console directly from the , and begin troubleshooting. SolarWinds Orion requires that you configure a designated SMTP server. When you configure a default action, you can reuse the action for all alerts, which means that you do not need to enter parameters for each alert. 1. Click Settings > All Settings > Configure Default Send Action. 2. In the Default Recipients section, provide the addresses of default recipients, separated by a semicolon. 3. Under the Default Sender Details heading, provide the default Name of Sender and the default Reply Address. 67
68 4. Under the Default SMTP Server section: a. Provide the Host name or IP Address of the SMTP Server and the designated SMTP Port Number. For example, , port 25. b. If you want to use SSL encryption for your alert s, select Use SSL. Selecting SSL automatically changes the SMTP port number to 465. c. If your SMTP server requires authentication, select This SMTP Server requires Authentication, and then provide the credentials. d. Click Use as Default. How reports work Reports provide a bridge between detailed views (which provide point-in-time information) and alerts (which tell you there is a problem). Reports can contain detailed, current state information, or they can contain historical data. You can run an ad-hoc report, or schedule reports to be sent to you automatically, as a PDF, a web page, or . For example, use a schedule when you want to receive the bandwidth usage from the last 7 days report every Monday morning. SolarWinds recommends that you identify who needs to receive performance or status reports, and how often they should receive them. Reports populate when: You Discover your network and Add discovered devices to SolarWinds Orion There is enough data to include in the report. Depending on the polling interval and data type, some reports do not populate immediately. For example, it takes two weeks for baseline reports to populate. 68

69 SolarWinds provides predefined reports for each Orion module. Click Home > Reports to see the available predefined reports. On the All Reports page, you can select any report and click View Report to run it immediately. You can create your own custom reports by either editing an existing report or creating a report from scratch. Reports can combine any number or type of Orion resources, including charts, tables, and gauges. You can customize the size of the report, the layout, and add a logo and a footer. Run a preconfigured report The following steps show you how to run and schedule the 95th Percentile Traffic Rate report. This report populates with data when: 69

70 You Discover your network and Add discovered devices to SolarWinds Orion At least seven days has past since you deployed SolarWinds NPM 1. Click Reports > All Reports. 2. On the All Reports panel, locate the 95th Percentile Traffic Rate - Last 7 Days report. 3. Click the report title. 4. On the report panel, click Schedule Report > Create New Schedule. 5. On the Schedule Properties panel, type a name and description and click Next. 6. On the Schedule Frequency panel, click Add Frequency. 7. On the Add Frequency dialog box, type a name and select a time interval. 8. Select the days when you want to execute the report. 70
71 9. Enter a time and click Add Frequency. 10. On the Schedule Frequency panel, click Next. 11. On the Actions to Execute panel, click Next. 12. On the Schedule Configuration Summary panel, review the schedule and click Create Schedule. Schedule a web-based report 1. Click Settings > All Settings > Manage Reports. 2. Select a web-based report, and click Schedule Report > Create New Schedule. 3. Continue with the previous procedure, starting with Step 5. 71
72 User accounts This section provides information on working with user accounts: How user accounts work Create a user Use Active Directory credentials for Orion Platform users Change account passwords How user accounts work Check out this video on account permissions and limitations. User accounts consist of three types of permissions: Basic account permissions View assignments Application specific settings Before you begin, consider what tasks the user must perform, and what views and menu bars are most suitable. Users created using default settings can log in to the Orion Web Console and see information available in views, resources, and reports. For administration and customization tasks, users need extra rights. TASK Add and edit user accounts and reset passwords. ACCESS (SELECT YES FOR THIS OPTION OR DO AS INSTRUCTED) Allow Administrator Rights SolarWinds recommends that you do not allow users to change their own Orion Web Console account passwords. Add, edit, and delete nodes. Enable/disable monitoring elements. Add, edit, schedule, and delete reports. Add, edit, and delete alerts. Allow Node Management Rights Allow Account to Unmanage Objects Allow Report Management Rights Allow Alert Management Rights To only allow some actions, keep No in Allow Alert Management rights and Allow items in the Alerts section as appropriate. Customize views. Allow Account to Customize Views 72

73 TASK Access only a set of devices (type, location, department, and so on). ACCESS (SELECT YES FOR THIS OPTION OR DO AS INSTRUCTED) Click Add Limitation and define the limitation. Create a user Check out this video on creating users. 1. Log in to the Orion Web Console, and click Settings > All Settings. 2. Click Manage Accounts in the User Accounts grouping, and click Add New Account on the Individual Accounts tab. 3. Select Orion individual account, and click Next. 4. Provide the account credentials, and click Next. 5. On Define Settings, provide rights so that the user can perform assigned tasks, select default views and menu bars, and then click Submit. Use Active Directory credentials for Orion Platform users Users can use their existing Active Directory credentials to log in to the Orion Web Console, so you do not need to manage an extra user account. You must enable Windows Account Login in the Orion Web Console. 1. Click Settings > All Settings, and in Product Specific Settings, click Web Console Settings. 2. In Windows Account Login, select Enable automatic login, and click Submit. 73

74 To maintain administrative privileges, individual and group Windows user accounts must be defined in the same domain as the SolarWinds server they can access. Only Security AD groups are supported. Distribution Groups are not supported. 1. Log in to Orion Web Console, and click Settings > All Settings. 2. Click Manage Accounts in the User Accounts grouping, and click Add New Account. 3. Select Windows individual account or Windows group account, and click Next. 4. Provide the credentials for an account with administrative access to the Active Directory or local domain, and click Next. 5. If a system account is available, you can use it. Select Use [Account Name] account to access Active Directory or Local Domain, and click Test Active Directory. You may need to specify the credentials manually. 6. To specify the credentials manually, select Specify credentials to access the Active Directory or Local Domain, and provide the credentials. 74

75 7. Search for the Active Directory or local domain account. To search for all users or groups in the domain, enter domain name\* and click Search. 8. Select the appropriate users in the Add Users area, and click Next. 9. On Define Settings, provide rights so that the user can perform assigned tasks, select default views and menu bars, and then click Submit. Users can now log in to the Orion Web Console using their local domain or Active Directory credentials. Change account passwords When you log in to the Orion Web Console for the first time, SolarWinds recommends that you change the password for the Admin account. Only users with administrator rights can change the password. 1. Log in to the Orion Web Console, and click Settings > All Settings. 2. Click Manage Accounts in the User Accounts grouping. 3. Select a user, and click Change Password. 4. Enter and confirm the new password, and click Change Password. 75
76 Get connected This section contains information on accessing the SolarWinds Customer Portal and engaging with THWACK, the SolarWinds community of IT pros: Access the Customer Portal Set up additional Customer Portal user accounts Engage with the SolarWinds community Access the Customer Portal The SolarWinds Customer Portal provides access to license and maintenance information, support cases, and product downloads, as well as live and instructor-led virtual classroom training. Create your user profile To create a user profile, you must know the SolarWinds customer ID (SWID) issued to your company. If you are a SolarWinds customer but do not have a SWID, contact SolarWinds Customer Support. Users with multiple SWIDs require only one user profile. Your user profile can be linked to multiple SWIDs. 1. Go to customerportal.solarwinds.com. 2. Click the Register tab. 3. Enter your organization's SWID and your address. If you have multiple SWIDs, enter any SWID to create your profile. Later, use the User Profile menu to link the other SWIDs to your profile. The account administrator will review the request, and you will receive an when it is approved. For more information about creating an account, see this FAQ page. 76
77 Explore the Customer Portal Manage licenses and access license keys. Download purchased products. Open a new support case and monitor existing cases. Download free trials of integrated products. Sign up for training. Set up additional Customer Portal user accounts If you are an account administrator for the SolarWinds Customer Portal, you can add additional user accounts and define each user's access level. Set up additional accounts to allow other users to view information in the portal, create a support case, access information about existing support cases, or sign up for training. 77
78 For more information about user account types and permissions, see this FAQ page. 1. Log in to the SolarWinds Customer Portal using an account with Account Administrator level access. 2. In the user account drop-down menu in the upper-right corner, click Company Account Settings. 3. Click the Add User button. 4. Enter the user's address. 5. Specify the user's access level and click Create. Account Administrator: can access all areas of the Customer Portal. Can also add and remove users, edit user profile information, and assign roles and contact types to users. Standard Access: can access all areas of the Customer Portal. No Access: cannot access the Customer Portal, but is listed as a contact on the account. The system sends a user profile creation to the user. The user account is listed as Pending in the Admin portal until the user activates their account through the user profile creation . Engage with the SolarWinds community Use the SolarWinds THWACK community website to learn more about SolarWinds products, participate in discussions, and get help resolving issues. Create a THWACK account You can read content on THWACK without an account. However, having an account allows you to take full advantage of the site by submitting feature requests, liking or following posts, and contributing content. When you create a THWACK account, SolarWinds will not send you unsolicited s or add you to marketing lists. 1. Go to thwack.solarwinds.com. 2. Click Register in the top right. 3. Enter the required information and accept the license agreement. 4. Click Create Account. After you create a THWACK account, you will be asked if you want to link your THWACK account with your Customer Portal account. If you link the accounts, you will see more relevant content and messages in the Customer Portal. Explore the THWACK site After you create an account, complete the onboarding mission to begin exploring THWACK. Participating in the THWACK community earns points, which you can use to purchase items in the THWACK store. As a member of the THWACK community, you can: 78
79 Participate in community discussions and get answers to your questions. In the product forums, you can post questions and view responses to other users' questions. Advice, resolutions, and troubleshooting tips are provided by community members and by SolarWinds employees. Extend product capabilities with custom templates, reports, and scripts. The THWACK product forums include thousands of downloadable templates, reports, and scripts you can use to customize or extend your SolarWinds products. This content is contributed by SolarWinds employees and by other community members. View product roadmaps, which list the features currently being developed for future product releases. Be notified of User Experience sessions where you can share your experiences, and help make SolarWinds products better. Influence the direction of a product by submitting feature requests and voting for other users' feature requests. Read blogs about SolarWinds products and about general IT topics. 79
SolarWinds. Server & Application Monitor. Onboarding Guide. Version 6.2. Part 1 of 3: Get Started
 SolarWinds Server & Application Monitor Version 6.2 Onboarding Guide Part 1 of 3: Get Started Last Updated: January 14, 2016 Server & Application Monitor Onboarding Guide 5 Product terminology 5 Related
SolarWinds. Server and Application Monitor. Onboarding Guide. Version 6.2
 SolarWinds Server and Application Monitor Onboarding Guide Version 6.2 Last Updated: September 14, 2015 Table of Contents Server and Application Monitor onboarding guide 4 How SAM works 4 Getting started
Using SolarWinds Orion for Cisco Assessments
 Using SolarWinds Orion for Cisco Assessments Cisco Network Assessments Registering Your Assessment... 1 Installing SolarWinds Orion Network Performance Monitor... 1 Discovering Your Network... 1 Polling
The following table lists minimum hardware requirements and recommendations for your Orion system. Hardware SL100, SL250, SL500 SL2000 SLX
 Orion Platform 2016.1 system requirements Important: These system requirements provide the minimums required for Orion systems. Products that run on the Orion Platform may have different requirements,
SolarWinds Network Performance Monitor powerful network fault & availabilty management
 SolarWinds Network Performance Monitor powerful network fault & availabilty management Fully Functional for 30 Days SolarWinds Network Performance Monitor (NPM) is powerful and affordable network monitoring
SolarWinds Network Performance Monitor
 SolarWinds Network Performance Monitor powerful network fault & availabilty management Fully Functional for 30 Days SolarWinds Network Performance Monitor (NPM) makes it easy to quickly detect, diagnose,
Chapter 1: Introduction
 Chapter 1: Introduction SolarWinds Server & Application Monitor (SolarWinds SAM) allows you to create and monitor your own custom collection of monitored components, providing an open field of opportunity
SolarWinds SAM RELEASE CANDIDATE DRAFT - NOT FINAL VERSION MAY 4, 2016. Server & Application Monitor. Getting Started Guide. Version 6.2.
 SolarWinds Server & Application Monitor Version 6.2.4 Getting Started Guide Part 3 of 3: Scale and Manage Last Updated: April 14, 2016 Table of Contents Scale and manage SolarWinds SAM 4 Related Guides
SolarWinds Network Performance Monitor
 SolarWinds Network Performance Monitor powerful network fault & availabilty management Fully Functional for 30 Days SolarWinds Network Performance Monitor (NPM) makes it easy to quickly detect, diagnose,
SOLARWINDS NETWORK PERFORMANCE MONITOR
 DATASHEET SOLARWINDS NETWORK PERFORMANCE MONITOR Fault, Availability, Performance, and Deep Packet Inspection SolarWinds Network Performance Monitor (NPM) is powerful and affordable network monitoring
Copyright 1995-2015 SolarWinds Worldwide, LLC. All rights reserved worldwide. No part of this document may be reproduced by any means nor modified,
 Copyright 1995-2015 SolarWinds Worldwide, LLC. All rights reserved worldwide. No part of this document may be reproduced by any means nor modified, decompiled, disassembled, published or distributed, in
SOLARWINDS ENGINEER S TOOLSET FAST FIXES TO NETWORK ISSUES
 DATASHEET SOLARWINDS ENGINEER S TOOLSET FAST FIXES TO NETWORK ISSUES SolarWinds Engineer s Toolset (ETS) helps you monitor and troubleshoot your network with the most trusted tools in network management.
Quick Start Guide for VMware and Windows 7
 PROPALMS VDI Version 2.1 Quick Start Guide for VMware and Windows 7 Rev. 1.1 Published: JULY-2011 1999-2011 Propalms Ltd. All rights reserved. The information contained in this document represents the
NSi Mobile Installation Guide. Version 6.2
 NSi Mobile Installation Guide Version 6.2 Revision History Version Date 1.0 October 2, 2012 2.0 September 18, 2013 2 CONTENTS TABLE OF CONTENTS PREFACE... 5 Purpose of this Document... 5 Version Compatibility...
Smart Business Architecture for Midsize Networks Network Management Deployment Guide
 Smart Business Architecture for Midsize Networks Network Management Deployment Guide Introduction: Smart Business Architecture for Mid-sized Networks, Network Management Deployment Guide With the Smart
SolarWinds Scalability Engine Guidelines for SolarWinds Products Technical Reference
 SolarWinds Scalability Engine Guidelines for SolarWinds Products Technical Reference Copyright 1995-2015 SolarWinds Worldwide, LLC. All rights reserved worldwide. No part of this document may be reproduced
Installing and Using the vnios Trial
 Installing and Using the vnios Trial The vnios Trial is a software package designed for efficient evaluation of the Infoblox vnios appliance platform. Providing the complete suite of DNS, DHCP and IPAM
Installation & Configuration Guide
 Installation & Configuration Guide Bluebeam Studio Enterprise ( Software ) 2014 Bluebeam Software, Inc. All Rights Reserved. Patents Pending in the U.S. and/or other countries. Bluebeam and Revu are trademarks
WhatsUpGold. v3.0. WhatsConnected User Guide
 WhatsUpGold v3.0 WhatsConnected User Guide Contents CHAPTER 1 Welcome to WhatsConnected Finding more information and updates... 2 Sending feedback... 3 CHAPTER 2 Installing and Configuring WhatsConnected
Avaya Video Conferencing Manager Deployment Guide
 Avaya Video Conferencing Manager Deployment Guide August 2011 Avaya Video Conferencing Manager Deployment Guide 2 Avaya Video Conferencing Manager This guide is for network administrators who use Avaya
WhatsUp Gold v16.3 Installation and Configuration Guide
 WhatsUp Gold v16.3 Installation and Configuration Guide Contents Installing and Configuring WhatsUp Gold using WhatsUp Setup Installation Overview... 1 Overview... 1 Security considerations... 2 Standard
Core Protection for Virtual Machines 1
 Core Protection for Virtual Machines 1 Comprehensive Threat Protection for Virtual Environments. Installation Guide e Endpoint Security Trend Micro Incorporated reserves the right to make changes to this
Server & Application Monitor
 Server & Application Monitor agentless application & server monitoring SolarWinds Server & Application Monitor provides predictive insight to pinpoint app performance issues. This product contains a rich
NETWORK PUBLIC TRAINING CLASS
 CONTACT US 877.591.1110 Introducing Orion 101 NETWORK PUBLIC TRAINING CLASS This public training is offered in a comfortable classroom environment and is ideal for clients who have a small networking team
NMS300 Network Management System
 NMS300 Network Management System User Manual June 2013 202-11289-01 350 East Plumeria Drive San Jose, CA 95134 USA Support Thank you for purchasing this NETGEAR product. After installing your device, locate
Running custom scripts which allow you to remotely and securely run a script you wrote on Windows, Mac, Linux, and Unix devices.
 About Foglight NMS Foglight NMS is a comprehensive device, application, and traffic monitoring and troubleshooting solution. It is capable of securely monitoring single and multi-site networks of all sizes,
Copyright 1995-2015 SolarWinds Worldwide, LLC. All rights reserved worldwide.
 Copyright 1995-2015 SolarWinds Worldwide, LLC. All rights reserved worldwide. No part of this document may be reproduced by any means nor modified, decompiled, disassembled, published or distributed, in
Table of Contents. FleetSoft Installation Guide
 FleetSoft Installation Guide Table of Contents FleetSoft Installation Guide... 1 Minimum System Requirements... 2 Installation Notes... 3 Frequently Asked Questions... 4 Deployment Overview... 6 Automating
SolarWinds Certified Professional. Exam Preparation Guide
 SolarWinds Certified Professional Exam Preparation Guide Introduction The SolarWinds Certified Professional (SCP) exam is designed to test your knowledge of general networking management topics and how
TANDBERG MANAGEMENT SUITE 10.0
 TANDBERG MANAGEMENT SUITE 10.0 Installation Manual Getting Started D12786 Rev.16 This document is not to be reproduced in whole or in part without permission in writing from: Contents INTRODUCTION 3 REQUIREMENTS
SevOne NMS Download Installation and Implementation Guide
 SevOne NMS Download Installation and Implementation Guide 5.3.X 530 V0002 Contents 1. Get Started... 3 2. SevOne Download Installation... 6 3. Appliance Network Configuration... 9 4. Install License and
You can contact SolarWinds in a number of ways, including the following:
 Copyright 2015 SolarWinds Worldwide, LLC. All rights reserved worldwide. No part of this document may be reproduced by any means nor modified, decompiled, disassembled, published or distributed, in whole
Installing and Configuring vcenter Multi-Hypervisor Manager
 Installing and Configuring vcenter Multi-Hypervisor Manager vcenter Server 5.1 vcenter Multi-Hypervisor Manager 1.1 This document supports the version of each product listed and supports all subsequent
SolarWinds Network Performance Monitor NETWORK AVAILABILITY AND PERFORMANCE MANAGEMENT
 SolarWinds Network Performance Monitor NETWORK AVAILABILITY AND PERFORMANCE MANAGEMENT SolarWinds is trusted by Simplify your Network Performance Monitoring SolarWinds NPM Highlights: We know the challenges
Enterprise Manager. Version 6.2. Installation Guide
 Enterprise Manager Version 6.2 Installation Guide Enterprise Manager 6.2 Installation Guide Document Number 680-028-014 Revision Date Description A August 2012 Initial release to support version 6.2.1
Network Monitoring Comparison
 Network Monitoring Comparison vs Network Monitoring is essential for every network administrator. It determines how effective your IT team is at solving problems or even completely eliminating them. Even
WhatsUp Gold v16.2 MSP Edition Deployment Guide This guide provides information about installing and configuring WhatsUp Gold MSP Edition to central
 WhatsUp Gold v16.2 MSP Edition Deployment Guide This guide provides information about installing and configuring WhatsUp Gold MSP Edition to central and remote sites. Contents Table of Contents Using WhatsUp
Copyright 1995-2015 SolarWinds Worldwide, LLC. All rights reserved worldwide.
 Copyright 1995-2015 SolarWinds Worldwide, LLC. All rights reserved worldwide. No part of this document may be reproduced by any means nor modified, decompiled, disassembled, published or distributed, in
8/26/2007. Network Monitor Analysis Preformed for Home National Bank. Paul F Bergetz
 8/26/2007 Network Monitor Analysis Preformed for Home National Bank Paul F Bergetz Network Monitor Analysis Preformed for Home National Bank Scope of Project: Determine proper Network Monitor System (
WhatsUp Gold v11 Features Overview
 WhatsUp Gold v11 Features Overview This guide provides an overview of the core functionality of WhatsUp Gold v11, and introduces interesting features and processes that help users maximize productivity
Dell SupportAssist Version 2.0 for Dell OpenManage Essentials Quick Start Guide
 Dell SupportAssist Version 2.0 for Dell OpenManage Essentials Quick Start Guide Notes, Cautions, and Warnings NOTE: A NOTE indicates important information that helps you make better use of your computer.
HDA Integration Guide. Help Desk Authority 9.0
 HDA Integration Guide Help Desk Authority 9.0 2011ScriptLogic Corporation ALL RIGHTS RESERVED. ScriptLogic, the ScriptLogic logo and Point,Click,Done! are trademarks and registered trademarks of ScriptLogic
DameWare Server. Administrator Guide
 DameWare Server Administrator Guide About DameWare Contact Information Team Contact Information Sales 1.866.270.1449 General Support Technical Support Customer Service User Forums http://www.dameware.com/customers.aspx
Features Overview Guide About new features in WhatsUp Gold v12
 Features Overview Guide About new features in WhatsUp Gold v12 Contents CHAPTER 1 Learning about new features in Ipswitch WhatsUp Gold v12 Welcome to WhatsUp Gold... 1 What's new in WhatsUp Gold v12...
User Manual. Onsight Management Suite Version 5.1. Another Innovation by Librestream
 User Manual Onsight Management Suite Version 5.1 Another Innovation by Librestream Doc #: 400075-06 May 2012 Information in this document is subject to change without notice. Reproduction in any manner
Orion Network Performance Monitor
 Orion Network Performance Monitor availability & performance management for your data center network I have continued to watch this product evolve since version 7.0 and have always found the interface
Kaseya Server Instal ation User Guide June 6, 2008
 Kaseya Server Installation User Guide June 6, 2008 About Kaseya Kaseya is a global provider of IT automation software for IT Solution Providers and Public and Private Sector IT organizations. Kaseya's
Veeam Backup Enterprise Manager. Version 7.0
 Veeam Backup Enterprise Manager Version 7.0 User Guide August, 2013 2013 Veeam Software. All rights reserved. All trademarks are the property of their respective owners. No part of this publication may
HP LeftHand SAN Solutions
 HP LeftHand SAN Solutions Support Document Applications Notes Best Practices for Using SolarWinds' ORION to Monitor SANiQ Performance Legal Notices Warranty The only warranties for HP products and services
Freshservice Discovery Probe User Guide
 Freshservice Discovery Probe User Guide 1. What is Freshservice Discovery Probe? 1.1 What details does Probe fetch? 1.2 How does Probe fetch the information? 2. What are the minimum system requirements
WhatsUp Gold 2016 Getting Started Guide
 WhatsUp Gold 2016 Getting Started Guide Contents CHAPTER 1 Welcome Welcome to WhatsUp Gold... 1 About WhatsUp Gold... 1 WhatsUp Gold Editions... 2 Deploying Deploying WhatsUp Gold... 5 STEP 1: Prepare
OnCommand Performance Manager 1.1
 OnCommand Performance Manager 1.1 Installation and Setup Guide For Red Hat Enterprise Linux NetApp, Inc. 495 East Java Drive Sunnyvale, CA 94089 U.S. Telephone: +1 (408) 822-6000 Fax: +1 (408) 822-4501
SolarWinds Migrating SolarWinds NPM Technical Reference
 SolarWinds Migrating SolarWinds NPM Technical Reference Copyright 1995-2015 SolarWinds Worldwide, LLC. All rights reserved worldwide. No part of this document may be reproduced by any means nor modified,
Using WhatsUp IP Address Manager 1.0
 Using WhatsUp IP Address Manager 1.0 Contents Table of Contents Welcome to WhatsUp IP Address Manager Finding more information and updates... 1 Sending feedback... 2 Installing and Licensing IP Address
Virtual Appliance Setup Guide
 The Barracuda SSL VPN Vx Virtual Appliance includes the same powerful technology and simple Web based user interface found on the Barracuda SSL VPN hardware appliance. It is designed for easy deployment
USER GUIDE. Ethernet Configuration Guide (Lantronix) P/N: 2900-300321 Rev 6
 P/N: 2900-300321 Rev 6") KRAMER ELECTRONICS LTD. USER GUIDE Ethernet Configuration Guide (Lantronix) P/N: 2900-300321 Rev 6 Contents 1 Connecting to the Kramer Device via the Ethernet Port 1 1.1 Connecting the Ethernet Port Directly
KRAMER ELECTRONICS LTD. USER GUIDE Ethernet Configuration Guide (Lantronix) P/N: 2900-300321 Rev 6 Contents 1 Connecting to the Kramer Device via the Ethernet Port 1 1.1 Connecting the Ethernet Port Directly
D-Link Central WiFiManager Configuration Guide
 Table of Contents D-Link Central WiFiManager Configuration Guide Introduction... 3 System Requirements... 3 Access Point Requirement... 3 Latest CWM Modules... 3 Scenario 1 - Basic Setup... 4 1.1. Install
Active Directory Management. Agent Deployment Guide
 Active Directory Management Agent Deployment Guide Document Revision Date: June 12, 2014 Active Directory Management Deployment Guide i Contents System Requirements...1 Hardware Requirements...1 Installation...3
LifeSize Control TM Deployment Guide
 LifeSize Control TM Deployment Guide July 2011 LifeSize Control Deployment Guide 2 LifeSize Control This guide is for network administrators who use LifeSize Control to manage video and voice communications
Hands-On Lab: WSUS. Lab Manual Expediting WSUS Service for XP Embedded OS
 Lab Manual Expediting WSUS Service for XP Embedded OS Summary In this lab, you will learn how to deploy the security update to your XP Pro or XP embedded images. You will also learn how to prepare the
Attix5 Pro Storage Platform
 Attix5 Pro Storage Platform V6.0 User Manual Cover for Microsoft Windows Your guide to configuring the Attix5 Pro Storage Platform. SERVER EDITION V6.0 for MICROSOFT WINDOWS Copyright Notice and Proprietary
ION EEM 3.8 Server Preparation
 PREREQUISITE GUIDE JUNE 21, 2006 ION EEM 3.8 Server Preparation This document details the server configuration required for an ION EEM installation. This document can and should be used by the your company
Quick Start Guide for Parallels Virtuozzo
 PROPALMS VDI Version 2.1 Quick Start Guide for Parallels Virtuozzo Rev. 1.1 Published: JULY-2011 1999-2011 Propalms Ltd. All rights reserved. The information contained in this document represents the current
Features Overview Guide About new features in WhatsUp Gold v14
 Features Overview Guide About new features in WhatsUp Gold v14 Contents New Features in Ipswitch WhatsUp Gold v14 Welcome to WhatsUp Gold v14!... 1 About the Welcome Center About the Quick Setup Assistant...
Citrix EdgeSight for NetScaler Rapid Deployment Guide
 Citrix EdgeSight for NetScaler Rapid Deployment Guide Citrix EdgeSight for NetScaler 2.1 This document provides step by step instructions for preparing the environment for EdgeSight for NetScaler installation,
Installation Guide for Pulse on Windows Server 2012
 MadCap Software Installation Guide for Pulse on Windows Server 2012 Pulse Copyright 2014 MadCap Software. All rights reserved. Information in this document is subject to change without notice. The software
How To Set Up Foglight Nms For A Proof Of Concept
 Page 1 of 5 Foglight NMS Overview Foglight Network Management System (NMS) is a robust and complete network monitoring solution that allows you to thoroughly and efficiently manage your network. It is
LabTech Installation Prerequisites
 LabTech LabTech Installation Prerequisites LABTECH INSTALLATION PREREQUISITES... 1 Overview... 1 Server Requirements... 1 Software Requirements... 3 Internet Requirements... 4 Port Forwarding... 4 Restricted
Application Performance Monitoring for WhatsUp Gold v16.1 User Guide
 Application Performance Monitoring for WhatsUp Gold v16.1 User Guide Contents Table of Contents Introduction APM Overview... 1 Learning about APM terminology... 2 Getting Started with APM... 3 Application
Before deploying SiteAudit it is recommended to review the information below. This will ensure efficient installation and operation of SiteAudit.
 SiteAudit Knowledge Base Deployment Check List June 2012 In This Article: Platform Requirements Windows Settings Discovery Configuration Before deploying SiteAudit it is recommended to review the information
Virtual Appliance Setup Guide
 Virtual Appliance Setup Guide 2015 Bomgar Corporation. All rights reserved worldwide. BOMGAR and the BOMGAR logo are trademarks of Bomgar Corporation; other trademarks shown are the property of their respective
WEBCONNECT INSTALLATION GUIDE. Version 1.96
 WEBCONNECT INSTALLATION GUIDE Version 1.96 Copyright 1981-2015 Netop Business Solutions A/S. All Rights Reserved. Portions used under license from third parties. Please send any comments to: Netop Business
Desktop Surveillance Help
 Desktop Surveillance Help Table of Contents About... 9 What s New... 10 System Requirements... 11 Updating from Desktop Surveillance 2.6 to Desktop Surveillance 3.2... 13 Program Structure... 14 Getting
SolarWinds Log & Event Manager
 Corona Technical Services SolarWinds Log & Event Manager Training Project/Implementation Outline James Kluza 14 Table of Contents Overview... 3 Example Project Schedule... 3 Pre-engagement Checklist...
Smart Cloud Integration Pack. For System Center Operation Manager. v1.1.0. User's Guide
 Smart Cloud Integration Pack For System Center Operation Manager v1.1.0 User's Guide Table of Contents 1. INTRODUCTION... 6 1.1. Overview... 6 1.2. Feature summary... 7 1.3. Supported Microsoft System
Network Monitoring with SNMP
 Network Monitoring with SNMP This document describes how SNMP is used in WhatsUp Gold v11 and provides examples on how to configure performance, active, and passive monitors. Introduction SNMP (Simple
Virtual Appliance Installation Guide
 > In This Chapter Document: : Installing the OpenManage Network Manager Virtual Appliance 2 Virtual Appliance Quick Start 2 Start the Virtual Machine 6 Start the Application 7 The Application is Ready
Application Performance Monitoring for WhatsUp Gold v16.2 User Guide
 Application Performance Monitoring for WhatsUp Gold v16.2 User Guide C o n t e n t s CHAPTER 1 Introduction APM Overview... 1 Learning about APM terminology... 2 Getting Started with APM... 3 Application
WhatsUp Gold v11 Features Overview
 WhatsUp Gold v11 Features Overview This guide provides an overview of the core functionality of WhatsUp Gold v11, and introduces interesting features and processes that help users maximize productivity
Thinspace deskcloud. Quick Start Guide
 Thinspace deskcloud Quick Start Guide Version 1.2 Published: SEP-2014 Updated: 16-SEP-2014 2014 Thinspace Technology Ltd. All rights reserved. The information contained in this document represents the
Using Device Discovery
 2 CHAPTER You can use Active Discovery to scan your network for new monitors (Active Monitors and Performance Monitors) and devices on a regular basis. Newly discovered items are added to the Active Discovery
Installing and Configuring vcloud Connector
 Installing and Configuring vcloud Connector vcloud Connector 2.7.0 This document supports the version of each product listed and supports all subsequent versions until the document is replaced by a new
vcenter Operations Manager for Horizon Supplement
 vcenter Operations Manager for Horizon Supplement vcenter Operations Manager for Horizon 1.6 This document supports the version of each product listed and supports all subsequent versions until the document
Metalogix SharePoint Backup. Advanced Installation Guide. Publication Date: August 24, 2015
 Metalogix SharePoint Backup Publication Date: August 24, 2015 All Rights Reserved. This software is protected by copyright law and international treaties. Unauthorized reproduction or distribution of this
Server Installation Manual 4.4.1
 Server Installation Manual 4.4.1 1. Product Information Product: BackupAgent Server Version: 4.4.1 2. Introduction BackupAgent Server has several features. The application is a web application and offers:
How To Get Started With Whatsup Gold
 WhatsUp Gold v16.2 Getting Started Guide Co Welcome Welcome to WhatsUp Gold... 1 About WhatsUp Gold... 1 WhatsUp Gold Editions... 2 Deploying Deploying WhatsUp Gold... 4 STEP 1: Prepare the network...
Application Discovery Manager User s Guide vcenter Application Discovery Manager 6.2.1
 Application Discovery Manager User s Guide vcenter Application Discovery Manager 6.2.1 This document supports the version of each product listed and supports all subsequent versions until the document
Creating client-server setup with multiple clients
 Creating client-server setup with multiple clients Coffalyser.Net uses a SQL client server database model to store all project/experiment- related data. The client-server model has one main application
STEALTHbits Technologies, Inc. StealthAUDIT v5.1 System Requirements and Installation Notes
 STEALTHbits Technologies, Inc. StealthAUDIT v5.1 System Requirements and Installation Notes June 2011 Table of Contents Overview... 3 Installation Overview... 3 Hosting System Requirements... 4 Recommended
Deployment and Configuration Guide
 vcenter Operations Manager 5 This document supports the version of each product listed and supports all subsequent versions until the document is replaced by a new edition. To check for more recent editions
NMS300 Network Management System Application
 NMS300 Network Management System Application Quick Start Guide December 2014 202-11288-04 350 East Plumeria Drive San Jose, CA 95134 USA Support Thank you for purchasing this NETGEAR product. After installing
Remote PC Guide for Standalone PC Implementation
 Remote PC Guide for Standalone PC Implementation Updated: 2007-01-22 The guide covers features available in NETLAB+ version 3.6.1 and later. IMPORTANT Standalone PC implementation is no longer recommended.
VMware vcenter Log Insight Getting Started Guide
 VMware vcenter Log Insight Getting Started Guide vcenter Log Insight 1.5 This document supports the version of each product listed and supports all subsequent versions until the document is replaced by
Quick Install Guide. Lumension Endpoint Management and Security Suite 7.1
 Quick Install Guide Lumension Endpoint Management and Security Suite 7.1 Lumension Endpoint Management and Security Suite - 2 - Notices Version Information Lumension Endpoint Management and Security Suite
Installation Guide July 2009
 July 2009 About this guide Edition notice This edition applies to Version 4.0 of the Pivot3 RAIGE Operating System and to any subsequent releases until otherwise indicated in new editions. Notification
There are numerous ways to access monitors:
 Remote Monitors REMOTE MONITORS... 1 Overview... 1 Accessing Monitors... 1 Creating Monitors... 2 Monitor Wizard Options... 11 Editing the Monitor Configuration... 14 Status... 15 Location... 17 Alerting...
MANUFACTURER RamSoft Incorporated 243 College St, Suite 100 Toronto, ON M5T 1R5 CANADA
 All Information provided in this document and in the accompanying software is subject to change without notice and does not represent a commitment on the part of RamSoft. RamSoft assumes no responsibility
AVG 8.5 Anti-Virus Network Edition
 AVG 8.5 Anti-Virus Network Edition User Manual Document revision 85.2 (23. 4. 2009) Copyright AVG Technologies CZ, s.r.o. All rights reserved. All other trademarks are the property of their respective
Configuration Guide. Websense Web Security Solutions Version 7.8.1
 Websense Web Security Solutions Version 7.8.1 To help you make the transition to Websense Web Security or Web Security Gateway, this guide covers the basic steps involved in setting up your new solution