EXISTING WASTEWATER TREATMENT FACILITIES
|
|
|
- Joshua Higgins
- 10 years ago
- Views:
Transcription
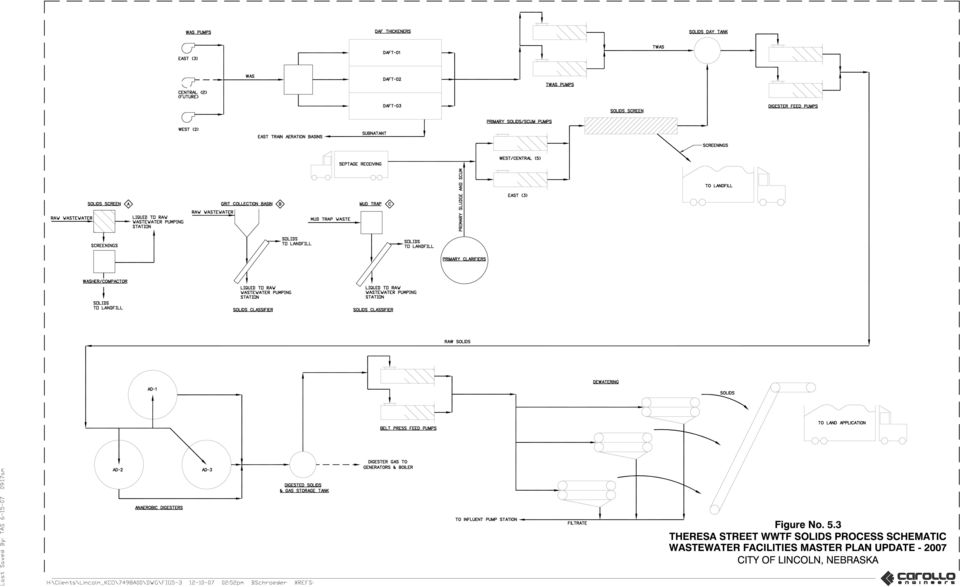
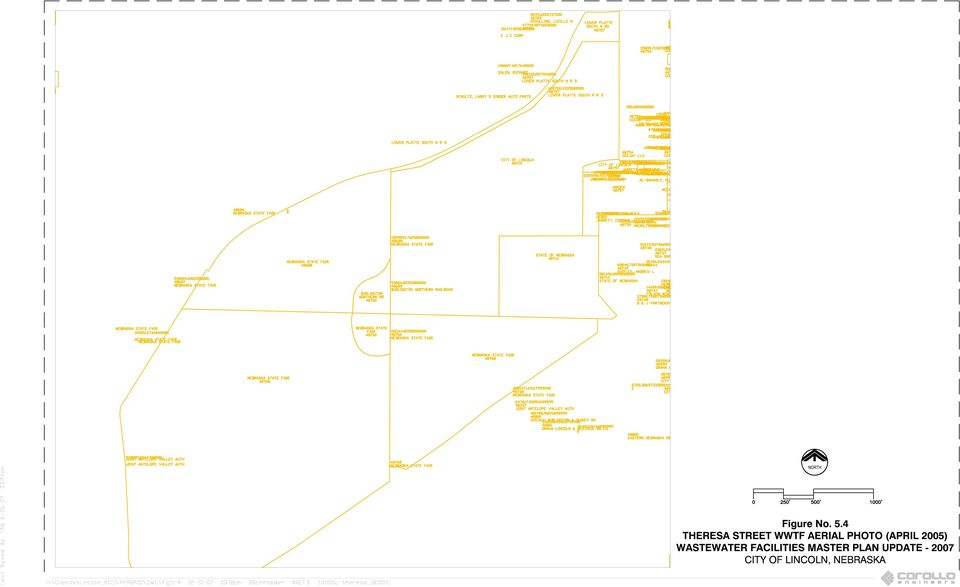
1 Chapter 5 EXISTING WASTEWATER TREATMENT FACILITIES 5.1 THERESA STREET WWTF Overview The Theresa Street WWTF is the larger of the two wastewater treatment facilities owned and operated by the City. This WWTF is located at 2400 Theresa Street. The site is bordered by Salt Creek to the north, Nebraska State Fair property to the west and south, and residential property to the east. The 100-year floodplain elevation around the facility varies from near 1148 to 1149.feet above mean sea level (MSL). Nearly all structures in the treatment process have a top of wall elevation greater than the 100-year flood level to allow treatment during flood conditions at Salt Creek. The original treatment facilities were constructed in 1923 and consisted of influent pumps, imhoff tanks, fixed nozzle trickling filters, secondary clarifiers, and sludge drying beds. A 1940 s upgrade included primary clarifiers and additional trickling filters. Major improvements were made with the construction of a 10 mgd activated sludge process in 1973, and with the recently completed Nitrification Improvements Project which results in the current 27 mgd facility. Since the addition of activated sludge treatment, there have been several other improvements that have increased the capacity of the treatment facility. The current configuration of the Theresa Street WWTF consists of preliminary, primary, and secondary treatment, followed by disinfection. The liquid process schematic for the current configuration is shown in Figure 5.1, and the hydraulic profile is shown in Figure 5.2. The hydraulic modeling calculations and description of the results are located in Appendix M. The solids generated at the facility are anaerobically digested and dewatered. The dewatered biosolids are then trucked to agricultural lands within Lancaster County for disposal. A schematic of the solids handling process is shown in Figure 5.3. Current aerial photographs of the facility are shown in Figures 5.4 and 5.5. An overview of the treatment facility processes is outlined below. The current rated treatment capacity for the Theresa Street WWTF is shown in Table 5.1 below. A more detailed unit process design summary is located in Appendix E. Current staffing for the Theresa Street WWTF and Northeast WWTF includes approximately 41 employees. These positions include administration, maintenance staff, treatment operators, laboratory staff, technicians, and control/instrumentation staff. The Theresa Street WWTF currently has seven fulltime certified Grade IV wastewater treatment operators that operate the facility 24 hours per day, seven days a week. The facility operators rotate on three 8-hour shifts per day. Figure 2.1 in Section 2 shows the organization chart for the Theresa Street WWTF. November

2

3

4

5
6
7 1. Influent Pump Station / Headworks 2. Grit Removal Facilities 3. Primary Clarifiers 4. Recirculation Pump Station 5. Aeration Blower Building Central Train 6. Pre-nitrification Basin 7. Aeration Basins 8. Final Clarifiers 9. Pre-Nitrification Basin 10. Solids Dewatering Building 11. Sludge Pumping Stations 12. Future Aeration Basins 13. Odor Control Facilities 14. Ultraviolet Disinfection Facilities 15. Chlorine Contact Basin 16. Digesters 17. Sludge Storage 18. Aeration/Solids Thickening Building 19. Scum Pump Building 20. Divisional/Administration Building 21. Main Electrical Switchgear Building 22. Collection System Operations and Maintenance Building 23. Electric Co-generation Building 24. Effluent Discharge Structure 25. Laboratory Building 26. Treatment Facility Maintenance Building 27. Liquid Waste / Grit Receiving Station 28. Liquid Waste / Septage Receiving Station N Figure 5.5 Theresa Street WTTF Aerial Photo (Oct. 12, 2006)

8 Table 5.1 Rated Capacity of the Theresa Street WWTF Parameter Units AAD MMAD PHF Flow (1) 24 (5) 27.4 (5) 87.0 Flow (2) mgd 68.2 Flow (3) 65.0 mg/l N/A BOD 5 lbs/day 52,040 (5) 74,080 (5) N/A COD mg/l N/A lbs/day 111, ,275 N/A mg/l N/A NH 3 (4) lbs/day 4,604 6,755 N/A mg/l N/A TKN (4) lbs/day 8,010 (5) 11,260 (5) N/A TSS mg/l N/A lbs/day 54,040 (5) 74,990 (5) N/A Notes: 1. Based on Influent firm pumping capacity. 2. Based on Secondary Clarifier Overflow Rates of 1,000 gpd/ft 2, with all six secondary clarifiers in service. 3. Based on Hydraulic Capacity (See Appendix M) 4. Does not include loadings from DAF subnatant to the East Train. 5. Certification of Wastewater Treatment Facility Capacities, City of Lincoln, Nov. 21, 2006 Many improvements to the Theresa Street WWTF SCADA control system have been completed in the past. The current system uses fiber optic connections between the Theresa Street WWTF and Northeast WWTF to monitor treatment processes and allow for changes to operations as needed. Both treatment facilities are converting the SCADA programming software to Iconics by Genesis. The new SCADA software will provide several improvements to the operations and control of the facilities including trending of process performance, data management, and daily summary printouts. A schematic of the SCADA control system for Theresa Street WWTF is shown in Figure 5.6. In addition to the SCADA system, the City has used a computerized maintenance management system (MMS) database for approximately ten years to track and assign work orders for equipment maintenance at the facilities. November
 4. Does not include loadings from DAF subnatant to the East Train. 5. Certification of Wastewater Treatment Facility Capacities, City of Lincoln, Nov.")
9 NE WWTF PLC Network Theresa Street WWTF PLC Network Notes: NETP = Northeast WWTF TST = Theresa Street WWTF PLC = Programmable Logic Controller *Image is from screenshot of SCADA control system monitoring station. Figure 5.6 Treatment Facilities SCADA System Diagram

10 This includes preventative maintenance scheduling, equipment checklists, and the ability to add additional information for each piece of equipment such as repair/replacement history, maintenance logs, and photographs. The MMS has been effective for efficient scheduling and reporting of equipment maintenance Liquid Treatment Preliminary treatment consists of influent pumping, screening, and grit removal. The removed screenings and grit are hauled to the landfill for disposal. The firm influent pumping capacity is 87 mgd with the largest pump out of service and the total pumping capacity is 109 mgd with all pumps operating. There are three influent pumps rated at 10 mgd, one pump rated at 12 mgd, three pumps rated at 15 mgd, and one pump rated at 22 mgd. The current capacity of the grit handling facilities is 100 mgd. Primary treatment consists of five primary clarifiers, two serving the east secondary treatment train, and three that serve the central and west secondary treatment trains. Each clarifier has sludge and scum equipment. The clarifiers range in size from 100 to 125 feet in diameter. Secondary treatment consists of activated sludge process designed for BOD oxidation and nitrification. The secondary treatment process at this facility consists of three treatment trains. The capacity of each train is outlined in Table 5.2 below. Table 5.2 Train Theresa Street WWTF Secondary Treatment Summary Rated MMAD Capacity Number of Aeration Basins Number of Clarifiers East 10 mgd 2 2 Central 13 mgd 2 2 West 4.4 mgd 2 2 Total MMAD Capacity 27.4 mgd N/A N/A The primary method of disinfection at the Theresa Street WWTF is provided by UV disinfection. The UV disinfection system is designed for a peak flow of 56 mgd. Flows above 56 mgd can be disinfected using the liquid sodium hypochlorite system that is also used for odor control. The chlorine system can also be used to provide redundancy and reliability in the event that the UV system is off line Biosolids Treatment The solids generated at the Theresa Street Wastewater Treatment Facility are from three separate sources in the WWTF. November

11 1. Primary thickening and surface scum from the primary clarifiers. 2. Waste activated sludge, scum, and aeration basin foam and scum from the final clarifiers. 3. Solids from the Septage Receiving Station. The primary sludge and septage is screened using a Parkson Sieve Press prior to being mixed with the thickened waste activated sludge. The waste activated sludge (WAS) is thickened from 0.5 percent to 1.0 percent solids using the dissolved air flotation process to 4 percent to 5 percent solids. The thickened WAS, primary sludge, and septage is then pumped to a 6000-gallon solids equalization tank prior to being pumped to three eggshaped anaerobic digesters that are operating in the mesophilic temperature range in parallel operation. The digester bio-gas generated by the anaerobic digestion process is used for heating of the digesters and to produce electricity. The electricity is produced in two Waukesha internal combustion engines that drive two 450-kilowatt generators. The waste heat from the engines is used to heat the digesters, digester facility building, and co-generation building. The electricity that is produced averages 440,000 kw-hrs/month and supplements the power provided by Lincoln Electric System local electric utility. This electrical generation provides approximately 40 to 60-percent of the Theresa Street facility electrical needs and reduces overall operating costs. Following the 18 to 20 day detention time in the digesters, overflow from the digesters goes to a 500,000-gallon sludge storage tank. The resultant digested biosolids are dewatered by three, two-meter belt filter presses to a solids content ranging from 15 to 22 percent. The belt presses operate approximately 45 to 50 hours per week generating approximately 1,100 cubic yards of dewatered digested sludge or biosolids per week. The dewatered biosolids generated by the belt presses are loaded into 32-yard transport trailers and then transported to agricultural ground located in Lancaster County as part of the Land Application Program. The Land Application Program is a partnership between the City of Lincoln and the University of Nebraska Cooperative Extension in Lancaster County. This partnership began in 1992 just after the egg-shaped anaerobic digesters came into operation. Prior to 1992, raw solids were hauled to the sanitary landfill. County Extension manages the distribution of biosolids to the participants and determines the appropriate cropland loading rates, maps and records applications using GIS software, and educates local farmers on the benefits of biosolids usage. Typically, there are 20 to 25 farmers participating in the program. If weather conditions prevent hauling biosolids to the field, the biosolids are hauled to the Bluff Road Sanitary Landfill to a dedicated holding facility where biosolids can be stored until field conditions improve. At the present time, the Land Application Program only includes the Theresa Street facility. November

12 Table 5.3 shows the annual volumes for biosolids applied on cropland for the Land Application Program. Table 5.3 Theresa Street WWTF Annual Biosolids Land Application Volumes Year Biosolids Volume (cy) , , , , , , ,253 The biosolids program has been very successful. The participants are realizing the benefits of using the biosolids and there have been very few complaints from surrounding neighbors Odor Control The Theresa Street WWTF has recently completed an odor control project for the East Treatment Train. The City s current program is to identify sources of odors, contain and scrub them prior to discharge. To further eliminate odors, the City has recently authorized an Odor Abatement Study by Huber, a copy of which is located in Appendix L. The recommendations of this report are currently being incorporated into the CIP program for future implementation Recently Completed Improvements Since the last Master Plan Update in 2003, the following projects that were identified have been completed at the Theresa Street WWTF. 1. Raw wastewater increased pumping capacity improvements. 2. Replacement of two influent bar screens and screenings dewatering and handling improvements. 3. Vortex grit removal and handling improvements. 4. UV effluent disinfection improvements - UV and liquid sodium hypochlorite system. 5. Odor control improvements for the east treatment train. 6. Replacement of West treatment train aeration blowers. November

13 7. East treatment train process and fine bubble aeration system improvements. 8. Central train nitrification improvements project (currently under construction). 9. Addition of redundant electrical substation improvements and other miscellaneous electrical improvements Historical Influent Flows Historical influent annual average daily (AAD) flows to the Theresa Street WWTF from 1980 through 2006 are shown in Figure 5.7. Table 5.4 and Figure 5.8 show the influent flows to the Theresa Street WWTF from 2000 to The flows shown represent the annual averages for the annual average daily flow (AAD), maximum monthly average day flow (MMAD), and peak daily flow (PDF). Ratios of MMAD:AAD and PDF:AAD are provided to show the changes in average and peak flows on a daily basis and to be used for future capacity evaluation. The maximum annual peak flow and the maximum PDF:AAD ratio is also provided to show the variability in peak flows throughout the year. Table 5.4 Year AAD (mgd) Theresa Street WWTF Historical Influent Flows MMAD (mgd) Avg. year PDF (mgd) Max. Day PDF (mgd) MMAD:AAD Ratio Avg PDF:AAD Ratio Max. PDF:AAD Ratio Avg The average MMAD:AAD ratio at the Theresa Street WWTF for this time frame is AAD has been relatively consistent throughout this period. The average of the daily peak flows indicates the high point in the diurnal curve that the WWTF treats on a daily basis. The average yearly PDF:AAD ratio is The maximum PDF for each year is used to estimate the peak flows that the WWTF has to accommodate. This is an important factor to consider with respect to hydraulic design of structures, pipes, and pumps. The max PDF:AAD ratio is used to estimate the daily peak flows. The PDF:AAD ratio varied from 3.23 to 2.59 with an average of 2.99 over this time period. November

14 Influent AAD Flow, mgd Year Figure 5.7 Theresa Street WWTF Historical Influent Flows

15 40 38 AAD MMAD PDF Influent Flow, mgd Year Figure 5.8 Theresa Street WWTF Influent Flow Comparison

16 Oak Creek, Lynn Creek, Salt Creek system, Little Salt, and East Campus basins discharge to the Theresa Street WWTF. Computer modeling of these basins was used to determine peak hour flows (PHF) at the treatment facility. The current modeled PHF at the treatment facility is 93.7-mgd (144.9-cfs). This results in a PHF:MMAD ratio of 4.46 and a PHF:AAD ratio of 4.90 for the current flows at the treatment facility. The PHF:AAD ratio of 4.90 matches well with the peak to average flow ratio of 5 used in the City s flow equation Historical Influent Quality Influent loading to the Theresa Street WWTF is shown in Table 5.5 and Figure 5.9. The AAD and MMAD concentration values for the influent BOD 5, COD, and TSS are shown for years 2000 to 2006 and CBOD values are provided for years 2004 to It should be noted that these values compare extremely well with the design criteria outlined in Table 5.1 above. In addition to the concentrations, the influent mass loadings are shown in Table 5.6 and shown graphically in Figure Table 5.5 Year Theresa Street WWTF Average Influent Loading Concentrations BOD (mg/l) CBOD (mg/l) COD (mg/l) TSS (mg/l) TKN (mg/l) AAD MMAD AAD MMAD AAD MMAD AAD MMAD AAD MMAD AAD/MMMAD Notes: 1. AAD = Annual average day from City daily records. 2. MMAD = Maximum month average day from City daily records. November

17 Table 5.6 Year Theresa Street WWTF Average Influent Mass Loading BOD (lbs/day) CBOD (lbs/day) COD (lbs/day) TSS (lbs/day) TKN (lbs/day) AAD MMAD AAD MMAD AAD MMAD AAD MMAD AAD MMAD ,926 42, ,182 51, ,036 60, , ,189 46,037 61,336 7,172 9, ,843 57, , ,970 47,665 61,352 7,369 9, ,699 60,528 39,682 53,056 93, ,683 48,626 62,770 7,806 10, ,831 59,723 42,039 56,284 87, ,912 42,659 60,990 7,911 10, ,779 49,683 35,523 44,202 82,355 99,543 36,956 45,263 8,124 9,548 AAD/MMMAD 41,614 60,528 39,081 56,284 90, ,970 44,389 62,770 7,677 10,316 Notes: 1. AAD = Annual average day from City daily records. 2. MMAD = Maximum month average day from City daily records Treatment Facility Performance The average effluent concentrations of BOD 5, CBOD, COD, TSS, and ammonia (NH 3 -N) are shown in Table 5.7 and Figure 5.11 and reflect the level of treatment being provided by the Theresa Street WWTF for the years 2000 to Table 5.8 reflects the pollutant removal being accomplished by the WWTF for the same period. November

18 Influent Loading Concentrations, mg/l Year BOD5 (AAD) COD (AAD) TSS (AAD) TKN (AAD) BOD5 (MMAD) COD (MMAD) TSS (MMAD) TKN (MMAD) Figure 5.9 Theresa Street WWTF Influent Loading
 COD (MMAD) TSS (MMAD) TKN (MMAD) Figure 5.")
19 Influent Mass Loading, lbs/day BOD5 (AAD) BOD5 (MMAD) COD (AAD) COD (MMAD) 130,000 TSS (AAD) TSS (MMAD) TKN (AAD) TKN (MMAD) 125, , , , , ,000 95,000 90,000 85,000 80,000 75,000 70,000 65,000 60,000 55,000 50,000 45,000 40,000 35,000 30,000 25,000 20,000 15,000 10,000 5, Year Figure 5.10 Theresa Street WWTF Influent Mass Loading

20 5.1.9 Discharge Permit The National Pollutant Discharge Elimination System (NPDES) effluent discharge permit for the Theresa Street WWTF is located in Appendix F. The permit limits require the Theresa Street WWTF to meet a monthly average CBOD of 25 mg/l and a monthly average TSS of 30 mg/l throughout the year. The current WWTF is meeting the permit requirements for CBOD and TSS. The discharge limitations for NH 3 vary based on the time of the year and are divided into three separate seasonal requirements (spring, summer, and winter). The current permit limits from March 1 to May 31 require the monthly average NH 3 -N to be 8.1 mg/l or less. For the period from June 1 to October 31, the monthly average NH 3 -N limit is 2.9 mg/l. For the period from November 1 to February 28 (29), the monthly average NH 3 -N limit is 8.1 mg/l. Currently, the Theresa Street WWTF is undergoing an expansion to provide full nitrification. The WWTF implemented nitrification treatment in the east and west trains in This is indicated by decrease in effluent NH 3 -N values compared to the previous years as shown in Table 5.7. When the current expansion project is completed in 2007, it is envisioned that the Theresa Street WWTF will provide complete nitrification and meet the discharge limits. The NPDES permit requires a seasonal limit of fecal coliform in the effluent from May 1 to September 30. The permit limits the monthly geometric mean of fecal coliform in the effluent sample to a maximum of 200 CFU per 100 ml with no more than 10-percent of monthly samples to exceed 400 CFU per 100 ml. Table 5.9 presents the effluent fecal coliform concentrations for years 2005 and 2006 at the Theresa Street WWTF. The current WWTF is meeting the fecal coliform requirements Future Capacity The Theresa Street WWTF is designed for expansion from a MMAD treated flow of 27 mgd to a MMAD treated flow of 45 mgd. This is planned to be accomplished with a 13 mgd Central Train expansion and a 5 mgd East Train expansion. Future treatment facility expansion requirements and timing are discussed in more detail in Chapter 24. November
.")
21 Table 5.7 Year Theresa Street WWTF Average Effluent Concentrations BOD 5 (mg/l) CBOD (mg/l) COD (mg/l) TSS (mg/l) NH 3 -N (mg/l) Average Notes: 1. AAD = Annual average day from City daily records. 2. MMAD = Maximum month average day from City daily records. Table 5.8 Theresa Street WWTF Average Influent Removal (1) Year BOD (%) CBOD (%) COD (%) TSS (%) Average Notes: 1. The percent removal is based on annual average influent and effluent values. November
22 Table 5.9 Theresa Street WWTF Effluent Fecal Coliform Concentrations (1) Month Monthly Geometric Mean Percent of Monthly Samples (CFU/100ml) > 400 CFU/100ml May % Jun % Jul % Aug % Sep % May % Jun % Jul % Aug % Sep % Average % Notes: 1. Data provided by City for NPDES monitoring from May through September of 2005 and November
23 70 BOD5 CBOD COD TSS NH Effluent Concentrations, mg/l Year Figure 5.11 Theresa Street WWTF Effluent Concentrations
24 5.2 NORTHEAST WWTF Overview The Northeast WWTF is the smaller of the two wastewater treatment facilities owned and operated by the City. The treatment facility is located at 7000 North 70th Street. The site is bordered by Salt Creek to the north, City of Lincoln property to the west and east, and private property y to the south. Generally, the site is undeveloped and is readily usable for future expansion. The 100-year floodplain elevation is feet above mean sea level (MSL). Nearly all structures in the treatment process have a top of wall elevation greater than the 100-year flood level to allow treatment during flood conditions at Salt Creek. The original treatment facilities were constructed in 1980 with a capacity of 8 mgd and included two treatment trains consisting of influent screening and pumping, aerated grit removal, primary clarification, trickling filters, aeration basins, final clarifiers, and chlorine disinfection. Effluent disinfection improvements consisting of ultraviolet light (UV) and liquid sodium hypochlorite disinfection facilities were completed in 2003 and are used to disinfect flows up to 16 mgd. Flows in excess of 16 mgd are disinfected by the liquid sodium hypochlorite system. A treatment facility expansion in 2004 increased the maximum month treatment facility nitrification capacity to 10 mgd with the construction of a new treatment train, process upgrades, and modifications to the existing treatment system. The 2004 expansion included construction of two new aeration basins, new aeration blowers and building, and one new final clarifier. The original trickling filter towers were demolished at this time as well. The liquid process schematic for the current configuration is shown in Figure 5.12, and the hydraulic profile is shown in Figure The solids generated at the facility are thickened, anaerobically digested, and transferred to a biosolids storage lagoon prior to subsurface injection. The City has approximately 440- acres for biosolids injection on property about 2 miles north of the Northeast WWTF. The locations of injection sites are shown in Figure Excess liquid biosolids can be trucked to the Theresa Street WWTF for dewatering. A schematic of the solids handling process is shown in Figure Current aerial photographs of the facility are shown in Figure 5.16 and An overview of the treatment facility processes is presented below. The current rated capacity for the Northeast WWTF is shown in Table 5.10, Appendix E provides detailed unit process capacities. Current staffing for the Theresa Street WWTF and Northeast WWTF includes approximately 41 employees. These positions include administration, maintenance staff, treatment operators, laboratory staff, technicians, and control/instrumentation staff. The Northeast WWTF currently has one fulltime certified Grade IV wastewater treatment November
25
26 Datum USGS NAVD 1988 Figure 5.13 Northeast WTTF Hydraulic Profile From Northeast Wastewater Treatment Facility Nitrification Improvements, 2004 Black & Veatch Corporation and Olsson Associates
27 Figure 5.14 Northeast WWTF Biosolids Injection Sites
28
29
30 1. Raw Water Pump Station / Headworks 2. Grit Basins 3. Primary Clarifiers 4. Recirculation Pump Station 5. Aeration Blower Building 6. Aeration Basins 7. Final Clarifiers 8. UV/Liquid Sodium Hypochlorite Disinfection Facilities 9. Chlorine Contact Basins 10. Solids Handling Building 11. WAS Storage 12. TWAS Storage 13. Primary Digester 14. Digester Control House 15. Secondary Digester 16. Gas Storage 17. Liquid Sodium Hypochlorite Building 18. Site Maintenance Building 19. Lincoln Electric System Treated Effluent Pumping Station 20. Control Building N Figure 5.17 Northeast WTTF Aerial Photo (Oct. 12, 2006)
31 operator at the site each day. The treatment facility is staffed nine hours a day and is unstaffed and monitored with SCADA from the Theresa Street WWTF from 4:00PM to 7:00AM. Figure 2.1 in Section 2 shows the organization chart for the Northeast Street WWTF Liquid Treatment Preliminary treatment consists of influent pumping, screening, and aerated grit removal. The removed screenings and grit are hauled by truck to the landfill for disposal. The firm influent pumping capacity is 34 mgd with the largest pump out of service and the total pumping capacity is 44 mgd with all pumps operating. There are three influent pumps rated at 8 mgd and two pumps rated at 10 mgd. The current average daily flow capacity of the grit handling facilities is 8 mgd. Primary treatment consists of two primary clarifiers serving the two secondary treatment trains. Each clarifier has sludge and scum equipment. The clarifiers range in size from 100 to 125 feet in diameter. Secondary treatment consists of activated sludge process designed for BOD oxidation and nitrification. The secondary treatment process at this facility consists of three treatment trains. The capacity of each train is outlined in Table 5.11 below. UV disinfection facilities are used for most flows. The rated capacity of the UV disinfection facilities is 16 mgd. If flow through the treatment facility exceeds 16 mgd, the excess flow is disinfected with the liquid sodium hypochlorite system Odor Control The NE WWTF is somewhat remote and there are no houses or businesses adjacent to the site. This is expected to change in the future, due in part to the recently constructed Stevens Creek Trunk Sewer Phase I project. Currently there is very odor control in place at this facility. The City is planning for future ongoing odor control projects as growth dictates. November
32 Table 5.10 Rated Capacity of the Northeast WWTF Parameter Units AAD MMAD PHF Flow (1) 9.0 (4) 10.0 (4) 20.0 Flow (2) mgd 19.0 Flow (3) 20.0 (4) mg/l N/A BOD 5 lbs/day 13,740 (4) 16,680 (4) N/A COD mg/l N/A lbs/day 41,658 57,880 N/A mg/l N/A NH 3 lbs/day 1,725 2,502 N/A TKN TSS mg/l N/A lbs/day 2,180 (4) 2,670 (4) N/A mg/l N/A lbs/day 14,490 (4) 17,514 (4) N/A Notes: 1. Based on Influent pumping capacity. 2. Based on Secondary Clarifier Overflow Rates of 1,000 gpd/ft 2, with all three secondary clarifiers in service. 3. Based on Hydraulic Capacity 4. Certification of Wastewater Treatment Facility Capacities, City of Lincoln, Nov. 21, 2006 Table 5.11 Train Northeast WWTF Secondary Treatment Summary Capacity Number of Aeration Basins Number of Clarifiers 1 A&B 3.34 mgd mgd mgd 1 1 MMAD Capacity mgd N/A N/A November
33 5.2.4 Biosolids Treatment Solids at the Northeast WWTF are generated from three separate sources in the WWTF. 1. Primary thickening and surface scum from the primary clarifiers. 2. Waste activated sludge, scum, and aeration basin foam and scum from the final clarifiers. The primary sludge at this facility is screened using a Parkson strain press prior to being pumped to anaerobic digesters. The waste activated sludge (WAS) solids are thickened using rotary drum thickeners (RDT s). The WAS thickening facilities include WAS pumps to pump from the clarifiers to storage, aerated WAS storage tanks, thickener feed pumps, two RDT s, thickened waste activated sludge (TWAS) pumps, polymer feed equipment, and a TWAS solids storage tank. WAS is typically thickened to 5-percent to 6-percent solids. Primary solids and TWAS are pumped separately to the anaerobic digesters. The anaerobic digestion facilities include two anaerobic digesters, a membrane type gas holder, pumping equipment, piping, and heat exchangers. Digested solids are pumped to an 8- million gallon onsite biosolids storage lagoon. Liquid biosolids are hauled from the lagoon by truck and injected in City owned land north of the treatment facility. The historical biosolids and constituent loading for this site is summarized in Appendix K. Excess liquid biosolids are hauled by truck to the Theresa Street WWTF for dewatering Recently Completed Improvements Since the last Master Plan Update in 2003, the following projects have been completed at the Northeast WWTF. 1. Replacement of influent mechanical screens and new screening compaction and handling improvements. 2. Solids thickening digestion and handling improvements including converting original aerobic digesters to WAS and TWAS storage basins, adding two new rotary drum thickeners, adding one new strain press, and improvements to existing primary and secondary digesters. 3. Effluent UV disinfection capacity improvements consisting of UV and liquid sodium hypochlorite system. 4. Improvements to treatment processes including: demolition of trickling filters, removal of recirculation pumps, RAS pumping improvements, modification to original aeration basins and construction of new aeration basins with anoxic selector zones, construction of new blower building and modifications to existing blower building, and construction of new final clarifier and modifications to existing final clarifiers to match new clarifier design. 5. Influent bar screening replacement and screenings compaction and handling improvements. 6. Electrical and SCADA instrumentation control improvements. 7. Miscellaneous site work including piping, access roads, and site grading for floodplain protection. November
34 5.2.6 Historical Influent Flows Historical influent annual average daily (AAD) flows to the Northeast WWTF from 1981 through 2006 are shown in Figure Table 5.12 and Figure 5.19 show the influent flows to the Northeast WWTF from 2000 to The flows represent the annual averages for the annual average daily flow (AAD) and maximum monthly average daily flow (MMAD). Peak daily flow measurements for the Northeast WWTF were not available for this report. Ratios of MMAD:AAD are provided to show the changes in average and maximum monthly flows to be used for future capacity evaluation. Table 5.12 Northeast WWTF Annual Average Flows Year AAD (mgd) (1) MMAD (mgd) MMAD:AAD Ratio * * Average Notes: 1. Previous studies influent flow data used for 2000 and City daily records for effluent flow used for 2002 and 2003 since influent data was not available for this period. City daily records for influent flow used for 2004 to Dead Mans Run, Havelock, and Steven s Creek Basins discharge to the Northeast Street WWTF. Computer modeling of these basins was used to determine peak hour flows (PHF) at the treatment facility. The current PHF calculated at the treatment facility is 24.1 mgd (37.3 cfs). This results in a PHF:MMAD ratio of 4.90 and a PHF:AAD ratio of 5.24 for the current flows at the treatment facility. The PHF:AAD ratio of 5.24 matches well with the peak to average flow ratio of 5 used in the City s flow. November
35 Influent AAD Flow, mgd Year Figure 5.18 Northeast WWTF Historical Influent Flows
36 9 AAD MMAD Influent Flow, mgd Year Figure 5.19 Northeast WWTF Influent Flow Comparison
37 5.2.7 Historical Influent Quality Influent loading to the Northeast Street WWTF is shown in Table 5.13 and Figure The values for the AAD and MMAD for BOD 5, COD, and TSS are provided for years 2000 to 2006 and CBOD values are provided for years 2004 to In addition to the concentrations, the influent mass loadings are shown in Table 5.14 and shown graphically in Figure Influent average BOD 5 appears to show a slight increase over in the last seven years ranging from a low of 192-mg/l in 2000 to a high of 269-mg/l in 2006 with an average of 232-mg/l. As indicated by the relatively close values of CBOD to BOD 5 for each year, most of the influent BOD 5 is in the carbonaceous form as expected. Table 5.13 Year Northeast WWTF Average Influent Loading Concentrations BOD (mg/l) CBOD (mg/l) COD (mg/l) TSS (mg/l) TKN (mg/l) AAD MMAD AAD MMAD AAD MMAD AAD MMAD AAD MMAD Average/Max Notes: 1. AAD = Annual average day from City daily records. 2. MMAD = Maximum month average day from City daily records. November
38 Table 5.14 Year Northeast WWTF Average Influent Mass Loading BOD (lbs/day) CBOD (lbs/day) COD (lbs/day) TSS (lbs/day) TKN (lbs/day) AAD MMAD AAD MMAD AAD MMAD AAD MMAD AAD MMAD ,002 15, ,335 34,543 11,569 14,181 1,871 2, ,167 11, ,799 29,202 9,400 12,820 1,446 2, ,656 14, ,954 35,495 8,767 21,998 1,081 2, ,407 15, ,540 34,327 8,407 15,663 1,389 2, ,859 11,272 7,565 10,343 18,933 24,267 8,349 10,653 1,529 2, ,396 12,096 8,714 11,075 18,505 24,724 8,392 10,257 1,363 1, ,320 11,688 8,747 10,257 21,330 23,825 9,629 11,361 1,458 1,676 Average/Max 9,115 15,873 8,342 11,075 20,485 35,495 9,216 21,998 1,448 2,667 Notes: 1. AAD = Annual average day from City daily records. 2. MMAD = Maximum month average day from City daily records. November
39 Influent Loading Concentrations, mg/l BOD5 (AAD) BOD5 (MMAD) COD (AAD) TSS (AAD) COD (MMAD) TSS (MMAD) 750 TKN (AAD) TKN (MMAD) Year Figure 5.20 Northeast WWTF Influent Loading Concentrations
40 40,000 37,500 BOD5 (AAD) COD (AAD) TSS (AAD) TKN (AAD) BOD5 (MMAD) COD (MMAD) TSS (MMAD) TKN (MMAD) 35,000 32,500 30,000 Influent Mass Loading, lbs/day 27,500 25,000 22,500 20,000 17,500 15,000 12,500 10,000 7,500 5,000 2, Year Figure 5.21 Northeast WWTF Influent Mass Loading
41 5.2.8 Treatment Facility Performance Effluent concentrations of BOD, CBOD, COD, TSS, and ammonia (NH 3 -N) show the level of treatment provided by the Northeast Street WWTF. Tables 5.15, 5.16, and Figure 5.22 present effluent discharge concentrations and percent removal values for years 2000 to Effluent CBOD data is shown for years 2003 to Previous years CBOD data were not available for this report. The Northeast WWTF implemented an advanced treatment project and improvements using nitrification process in 2006 to reduce levels of ammonia in the effluent. Prior to implementation of these treatment improvements, the effluent ammonia averaged from 3.5- mg/l to 19.4-mg/l from 2000 to After the new nitrification treatment system began operating in 2006, effluent ammonia values decreased to an average of 0.3-mg/l. Table 5.15 Year Northeast WWTF Average Effluent Concentrations BOD (mg/l) CBOD (mg/l) COD (mg/l) TSS (mg/l) NH 3 -N (mg/l) AAD MMAD AAD MMAD AAD MMAD AAD MMAD AAD MMAD Average Notes: 1. AAD = Annual average day from City daily records. 2. MMAD = Maximum month average day from City daily records. November
42 Table 5.16 Northeast WWTF Average Influent Removal (1) Year BOD (%) CBOD (%) COD (%) TSS (%) Average Notes: 1. The percent removal is based on annual average influent and effluent values Discharge Permit The National Pollutant Discharge Elimination System (NPDES) effluent discharge permit for the Northeast WWTF is located in Appendix F. The permit limits require the WWTF to meet a monthly average CBOD of 25 mg/l and a monthly average TSS of 30 mg/l. As indicated in Table 5.15 the Northeast WWTF is meeting these requirements. The discharge limitations for NH 3 vary based on the time of the year and are divided into three separate seasonal requirements (spring, summer, and winter). The current permit limits from March 1 to May 31 require the monthly average NH 3 -N to be 15.6 mg/l or less. For the period from June 1 to October 31, the monthly average NH 3 -N limit is 10.1 mg/l. For the period from November 1 to February 28 (29), the monthly average NH 3 -N limit is 14.8 mg/l. The Northeast WWTF implemented full nitrification treatment in As a result, the effluent ammonia-nitrogen concentrations have been reduced significantly and are well below the discharge permit limits. The NPDES permit requires a seasonal limit of fecal coliform in the effluent from May 1 to September 30. The permit limits the monthly geometric mean of fecal coliform in the effluent sample to a maximum of 200 CFU per 100 ml with no more than 10-percent of monthly samples to exceed 400 CFU per 100 ml. Table 5.17 presents the effluent fecal coliform concentrations from years 2005 and 2006 at the Northeast WWTF. The current WWTF is consistently meeting the fecal coliform requirements with one exception over this time period of 12-percent of samples exceeding 400 CFU/100ml in May November
43 Table 5.17 Northeast WWTF Effluent Fecal Coliform Concentrations (1) Month Monthly Geometric Mean Percent of Monthly Samples (CFU/100ml) > 400 CFU/100ml May % Jun % Jul % Aug % Sep % May % Jun % Jul % Aug % Sep % Average % Notes: 1. Data provided by City for NPDES monitoring from May through September of 2005 and Future Capacity The Northeast WWTF has is rated for a MMAD flow of 10.0 mgd. Future expansion and improvements will require construction of new facilities on land adjacent to the existing facilities. Future treatment facility expansion requirements and timing are discussed in more detail in Section 24. November
44 80 BOD5 CBOD COD TSS NH Effluent Concentrations, mg/l Year Figure 5.22 Northeast WWTF Effluent Concentrations
45 5.3 COMPARISON OF WATER USAGE TO WASTEWATER FLOW Data provided by the City was used to compare the wastewater flows as recorded at the two wastewater treatment facilities to the water consumption for the City. Table 5.16 shows the average annual influent flows at both wastewater treatment facilities as well as the water use for each year from the City drinking water system. The winter months of December, January, and February were used to compare the values since water loss from irrigation, lawn watering, and other outdoor uses and the influence of rain events are minimal during the winter months. The winter season wastewater flows when compared to the water consumption for the same period provides an indication of the water tightness of the collection system. Additionally, this data should correlate and be relatively constant over time, with the wastewater flows being slightly less than the water consumption values. As shown in Table 5.18, the City s collection system has averaged approximately 85-percent of the water consumption over the last five years, which is a good correlation. Table 5.18 Year (1) Comparison of Water Usage and Wastewater Treatment Facility Flows Theresa St WWTF Flow (MGD) Northeast WWTF Flow (MGD) Total WW Flow (MGD) Total Water Usage (2) (MGD) Percent (%) Period Average 84.9 Notes: 1. Winter months only - December of year indicated through February of the following year. 2. Total flow from drinking water system. Source: City of Lincoln metered water records. November
46 5.4 HISTORICAL PER CAPITA WASTEWATER FLOW Figure 5.23 shows the average historical per capita wastewater flow for the City treatment facilities. The total annual average flow from both Theresa Street WWTF and Northeast WTTF was divided by the City of Lincoln population for a given year to determine the average per capita wastewater flow. As shown in Figure 5.23, the average per capita wastewater flow has been declining over the last 25 years. This decline is a result of improved sewer construction practices, replacement of older sewers, increased water conservation practices by industry and consumers, and possibly by the recent lower than normal precipitation accumulations. The 2005 per capita contribution is approximately 95 gpcd. As shown in the figure, the yearly values vary. To compensate for this variation a linear trend line was included to provide a means for determining per capita flows. 5.5 INDUSTRIAL CONTRIBUTIONS The City of Lincoln currently has 44 dischargers that are classified as industrial. Thirty-four of these dischargers are tributary to the Theresa Street WWTF, and the remaining 10 are tributary to the Northeast WWTF as identified in the Industrial Audit located in Appendix G. The combined flow for Fiscal Year 05/06 (September 2005 to August 2006) averaged about 2.2 mgd or 9.4 percent of the combined wastewater flow. A summary of the industrial dischargers contributions to flows and loadings at both the Theresa Street and Northeast WWTF s is presented in Table 5.20 below. Additional information is located in Appendix G. Table 5.20 Industrial Flow and Loading Contributions Parameter Theresa St Northeast Combined Flow (mgd) 7.6 % 18.7 % 9.6 % TSS (lbs/day) 6.7 % 24.4 % 10.0 % BOD 5 (lbs/day) 27.3 % 43.3 % 30.2 % COD(lbs/day) 23.2 % 46.3 % 27.5 % TKN (lbs/day) 7.3 % 16.2 % 8.5 % November
47 gal/capita/day Average gal/capita/day Linear Trend (Average gal/capita/day) Year Figure 5.23 Historical Per Capita Wastewater Flow
EXISTING WASTEWATER TREATMENT FACILITIES
 Chapter 5 EXISTING WASTEWATER TREATMENT FACILITIES 5.1 THERESA STREET WWTF 5.1.1 Overview The Theresa Street WWTF is the larger of the two wastewater treatment facilities owned and operated by the City
Description of the Water Conserv II Facility
 Description of the Water Conserv II Facility Introduction The Water Conserv II (WCII) Water Reclamation Facility provides service to a majority of the southwest section of Orlando. The WCII facility has
Cambridge Wastewater Treatment Facility
 Cambridge Wastewater Treatment Facility Emergency Situations If you have a water or sewer emergency that relates to the City s utility system call the Public Works office at 763-689-1800 on normal working
The City of Boulder 75 th Street Wastewater Treatment Facility
 The City of Boulder 75 th Street Wastewater Treatment Facility Wastewater Collection and Treatment The Foundation of Public Health Wastewater Collection Boulder s wastewater collection system, also known
Bay Park Sewage Treatment Plant Super Storm Sandy Recovery
 County of Nassau Department of Public Works Bay Park Sewage Treatment Plant Super Storm Sandy Recovery Edward P. Mangano County Executive Shila Shah-Gavnoudias, P.E. Commissioner of Public Works Bay Park
Minnesota. BMI Project No. M21.037315
 Wastewater Treatment Facility Plan City of Paynesville Minnesota BMI Project No. M21.037315 March 2009 TABLE OF CONTENTS EXECUTIVE SUMMARY... 1 A. GENERAL... 1 B. DESIGN PARAMETERS... 1 C. COST ESTIMATES...
Pursuant to Department of Environmental Protection Rules Chapter 555, effective March 9, 2009
 APPLICATION FOR ADDITION OF TRANSPORTED WASTES IN WASTEWATER TREATMENT FACILITIES Pursuant to Department of Environmental Protection Rules Chapter 555, effective March 9, 2009 This application is to be
Facility Classification Standards
 Facility Classification Standards Approval Date: April 3, 2009 Effective Date: April 3, 2009 Approved By: Nancy Vanstone, Deputy Minister Version Control: Replaces Facility Classification Standards dated
Facilities Plan. Wastewater Treatment Facility. Detroit Lakes, Minnesota. January 23, 2015. SEH No. DLPUC 127205
 Facilities Plan Wastewater Treatment Facility Detroit Lakes, Minnesota SEH No. DLPUC 127205 January 23, 2015 Table of Contents 1.0 Introduction... 1 2.0 Regulatory Requirements... 1 3.0 Facility Planning...
5. TREATMENT FACILITIES
 5. TREATMENT FACILITIES 5.1. Background... 1 5.2. Nine Springs Wastewater Treatment Plant... 1 5.2.1. Liquid Treatment Facilities... 3 5.2.2. Biosolids Disposal Facilities... 6 5.2.3. Operation and Maintenance
City of Charlottetown Wastewater Treatment Expansion & Upgrading
 City of Charlottetown Wastewater Treatment Expansion & Upgrading Background As Canada s smallest provincial capital, the City of the Charlottetown has a population of approximately 34,000 residents and
THE MARSHALL STREET ADVANCED POLLUTION CONTROL FACILITY (CLEARWATER, FLORIDA) CONVERSION TO 4-STAGE BARDENPHO TO IMPROVE BIOLOGICAL NITROGEN REMOVAL
 CONVERSION TO 4-STAGE BARDENPHO TO IMPROVE BIOLOGICAL NITROGEN REMOVAL") THE MARSHALL STREET ADVANCED POLLUTION CONTROL FACILITY (CLEARWATER, FLORIDA) CONVERSION TO 4-STAGE BARDENPHO TO IMPROVE BIOLOGICAL NITROGEN REMOVAL ABSTRACT Timur Deniz, Ph.D., Thomas W. Friedrich, P.E.
THE MARSHALL STREET ADVANCED POLLUTION CONTROL FACILITY (CLEARWATER, FLORIDA) CONVERSION TO 4-STAGE BARDENPHO TO IMPROVE BIOLOGICAL NITROGEN REMOVAL ABSTRACT Timur Deniz, Ph.D., Thomas W. Friedrich, P.E.
Advanced Wastewater Treatment and Disposal Systems. Water and Wastewater Utility Operation and
 Advanced Wastewater Treatment and Disposal Systems Water and Wastewater Utility Operation and Management for Tribes Preliminary Treatment Primary Treatment Secondary Treatment Tertiary Treatment Disinfection
William E. Dunn Water Reclamation Facility. Facility Overview & Information
 William E. Dunn Water Reclamation Facility Facility Overview & Information General Area Served: Plant History Facility Highlights Northern Pinellas County St. Joseph Sound to East Lake Road (E/W) Tampa
NEVADA CITY WASTEWATER TREATMENT INQUIRY
 NEVADA CITY WASTEWATER TREATMENT INQUIRY REASON FOR INVESTIGATION The 2003-2004 Grand Jury investigated the status of wastewater treatment in unincorporated Nevada County. This year, the Grand Jury investigated
NPDES Permit No. IL0052639. Notice No. IL0052639-12.TTL. Public Notice Beginning Date: June 15, 2012. Public Notice Ending Date: July 16, 2012
 NPDES Permit No. IL0052639 Notice No. IL0052639-12.TTL Public Notice/Fact Sheet Issued By: Public Notice Beginning Date: June 15, 2012 Public Notice Ending Date: July 16, 2012 National Pollutant Discharge
Alberta Environment Standards for Advanced Waste Systems
 Alberta Environment Standards for Advanced Waste Systems + Alberta Rural Organic Waste to Resources Network + George Neurohr Regional Municipal Engineer Grande Prairie, Alberta May 1, 2012 Contents: Introduction
CHAPTER 10-2. Section 1 Inventory of Existing Sanitary Sewer Collection and Treatment Facilities
 CHAPTER 10-2 SEWAGE COLLECTION AND TREATMENT FACILITIES Section 1 Inventory of Existing Sanitary Sewer Collection and Treatment Facilities 1.1 SANITARY SEWER COLLECTION SYSTEM The City of Washougal operates
MUNICIPAL WASTEWATER TREATMENT PLANT ENERGY EVALUATION FOR ITHACA AREA WASTEWATER TREATMENT FACILITY
 MUNICIPAL WASTEWATER TREATMENT PLANT ENERGY EVALUATION FOR ITHACA AREA WASTEWATER TREATMENT FACILITY Agreement No. 7185 Prepared for THE NEW YORK STATE ENERGY RESEARCH AND DEVELOPMENT AUTHORITY Albany,
During the past decade, the city of
 An Advanced Pollution Control Facility s Conversion to Four-Stage Bardenpho to Improve Biological Nitrogen Removal Timur Deniz, Thomas W. Friedrich, and John Milligan During the past decade, the city of
TABLE OF CONTENTS EXECUTIVE SUMMARY...1 1.0 DESCRIPTION OF EXISTING CONDITIONS... 1-1. 1.1 Population... 1-1. 1.2 Wastewater Flows...
 TABLE OF CONTENTS EXECUTIVE SUMMARY...1 1.0 DESCRIPTION OF EXISTING CONDITIONS... 1-1 1.1 Population... 1-1 1.2 Wastewater Flows... 1-1 1.3 Existing Wastewater Facilities... 1-2 1.3.1 City of Celina...
Aeration Efficiency Guide
 Aeration Efficiency Guide Environmental Dynamics InTernational EDI specializes in the research, development, and application of advanced technology aeration and biological treatment solutions for municipal
SMALL COMMUNITY TREATMENT PLANT EXPANSION WHILE IN OPERATION USING ADVANCED TECHNOLOGY
 SMALL COMMUNITY TREATMENT PLANT EXPANSION WHILE IN OPERATION USING ADVANCED TECHNOLOGY Adel Bassyouni, HDR Engineering, Guillermo Garcia, HDR Engineering, Don Mc Dermott, Viejas Public Works Department
Iowa DNR Wastewater Treatment Technology Assessment No. 09-01
 Iowa DNR Wastewater Treatment Technology Assessment No. 09-01 Evaluation of Full-Scale LemTec Biological Treatment Facilities for Wastewater Design Review Considerations by the Iowa Department of Natural
ADVANCED LAGOON TREATMENT TECHNOLOGIES FOR WASTEWATER TREATMENT
 ADVANCED LAGOON TREATMENT TECHNOLOGIES FOR WASTEWATER TREATMENT ABSTRACT by Vikram M Pattarkine*, Randall C Chann**, Charles E Tharp** *Brinjac Engineering Inc, 114 North 2 nd Street, Harrisburg, PA 1711
Provided below is a description of the processes generating wastewater in a poultry plant and a typical pretreatment and full treatment system.
 II. PROCESS OVERVIEW Provided below is a description of the processes generating wastewater in a poultry plant and a typical pretreatment and full treatment system. II.1. Wastewater Generation A typical
Texas Commission on Environmental Quality Page 1 Chapter 217 - Design Criteria for Domestic Wastewater Systems
 Texas Commission on Environmental Quality Page 1 217.31. Applicability. SUBCHAPTER B: TREATMENT FACILITY DESIGN REQUIREMENTS 217.31-217.39 Effective August 28, 2008 This subchapter details the design values
6.2 ADVANCED WASTEWATER TREATMENT PROCESS PERFORMANCE
 6.1 INTRODUCTION Wastewater treatment process considerations must be updated from the 2002 Wastewater Facilities Plan and the 2003 Wastewater Facilities Plan Amendment to account for the extremely low
NPDES Permit No. IL0020737. Notice No. SKT:13120601.bah. Public Notice Beginning Date: April 9, 2014. Public Notice Ending Date: May 9, 2014
 Public Notice/Fact Sheet Issued By: Notice No. SKT:13120601.bah Public Notice Beginning Date: April 9, 2014 Public Notice Ending Date: May 9, 2014 National Pollutant Discharge Elimination System (NPDES)
26th Ward Wastewater Treatment Plant Wet Weather Operating Plan
 26th Ward Wastewater Treatment Plant Prepared by: New York City Department of Environmental Protection Bureau of Wastewater Treatment July 2010 TABLE OF CONTENTS Page 1.0 INTRODUCTION... 1-1 1.1 BACKGROUND...
Small Wastewater Treatment Systems
 Small Wastewater Treatment Systems By Michael Albanese, P.Eng. H2FLOW EQUIPMENT INC. www.h2flow.com Why do you need one? Typical Reasons Enviromental Regulations New Development Failing Septic Systems
WASTEWATER TREATMENT OBJECTIVES
 WASTEWATER TREATMENT OBJECTIVES The student will do the following: 1. Define wastewater and list components of wastewater. 2. Describe the function of a wastewater treatment plant. 3. Create a wastewater
COURSE # 343 UNIT # 1: ADVANTEX WASTEWATER TREATMENT SYSTEM. What you will learn in this lesson. Introduction to the listing
 What you will learn in this lesson IN THIS LESSON, YOU WILL LEARN... About the Orenco AdvanTex alternate technology listing The components that make up the AdvanTex Treatment System How the AdvanTex Treatment
Asset Management Answering the 5 Core Questions
 Asset Management Answering the 5 Core Questions by Timothy Taber, PE Barton & Loguidice Page 1 Drivers Asset Management Case Study 1. What is the current state of my assets? 2. What is my required sustainable
-O^ DEQ. National Pollutant Discharge Elimination System PERMIT EVALUATION AND FACT SHEET November 12,2003
 \ I -O^ DEQ State of Oregon Department of Environmental Quality National Pollutant Discharge Elimination System PERMIT EVALUATION AND FACT SHEET November 12,2003 Oregon Department of Environmental Quality
City of Rutland Wastewater Treatment Facility Phosphorus Removal Planning Study
 City of Rutland Wastewater Treatment Facility Phosphorus Removal Planning Study October 2014 Table of Contents 1. EXECUTIVE SUMMARY... 1 1.1. Regulatory Update... 1 1.2. Operating Data... 1 1.3. WWTF
Winnipeg Sewage Treatment Program Integrated Management System
 Winnipeg Sewage Treatment Program Integrated Management System SEWPCC Facility s. DOCUMENT NUMBER: CD-RC-RF-02 Rev Prepared by Reviewed by Date Approved by Date 2014/04/02 Philippe Biesse Bruno Valla 2014/04/02
Case Study of an Advanced On-Site Wastewater Treatment System Connected to a Single-Family Residence
 Case Study of an Advanced On-Site Wastewater Treatment System Connected to a Single-Family Residence Christina M. Edvardsson and David R. Spears, MicroSepTec, Inc., 2661 Cabot Road, Laguna Hills, CA 92653
St. John s Harbour Clean-Up Phase 2. Project Description
 St. John s Harbour Clean-Up Phase 2 Project Description February 2003 NEWFOUNDLAND DESIGN ASSOCIATES LIMITED 1 Introduction The City of St. John s, the adjoining City of Mount Pearl and the Town of Paradise
Wastewater Nutrient Removal
 Wastewater Nutrient Removal An overview of phosphorus and nitrogen removal strategies Presented by: William E. Brown, P.E. Peter C. Atherton, P.E. Why are nutrients an issue in the environment? Stimulates
CHAPTER 1 - EXECUTIVE SUMMARY
 Chapter Page CHAPTER 1 - EXECUTIVE SUMMARY 1.1 Background 1-1 1.2 Purpose/ Objectives 1-1 1.3 Flow, Condition and Operation Assessment 1-3 1.4 Class A Biosolids 1-4 1.5 Summary of Recommendations 1-4 CHAPTER
CHAPTER 8 UPGRADING EXISTING TREATMENT FACILITIES
 CHAPTER 8 UPGRADING EXISTING TREATMENT FACILITIES 8-1. General. Upgrading of wastewater treatment plants may be required to handle increased hydraulic and organic loadings to meet existing effluent quality
City of East Lansing CSO Control Facility Evaluation Demonstrative Approach to Meet WQS
 City of East Lansing CSO Control Facility Evaluation Demonstrative Approach to Meet WQS Jeff Johnston, East Lansing WWTP Superintendent & Tom Maxwell, P.E., Hubbell, Roth & Clark, Inc. East Lansing CSO
Technical Feasibility of a Wet Weather Flow Treatment Facility
 Wastewater Master Plan DWSD Project No. CS-1314 Technical Feasibility of a Wet Weather Flow Treatment Facility Technical Memorandum Original Date: August 9, 2001 Revision Date: September 2003 Author: Tetra
5. Environmental Analysis
 5.11 The potential for adverse impacts on utilities and service systems was evaluated based on information concerning current service levels and the ability of the service providers to accommodate the
ENVIRONMENTAL ISSUES IN THE RENDERING INDUSTRY. Gregory L. Sindt, P.E. Environmental Engineer Bolton and Menk, Inc.
 Summary ENVIRONMENTAL ISSUES IN THE RENDERING INDUSTRY Gregory L. Sindt, P.E. Environmental Engineer Bolton and Menk, Inc. The rendering industry has a significant positive impact on environmental quality.
Wastewater Treatment System Rehabilitation Project
 Wastewater Treatment System Rehabilitation Project An overview The City of Shelton, WA / January 2010 Before After SHELTON WASTEWATER TREATMENT IMPROVMENTS PROJECT Enabled by extensive grant-funding, loans
TOWN OF LAKESHORE CLASS ENVIRONMENTAL ASSESSMENT ENVIRONMENTAL STUDY REPORT FOR LAKESHORE EASTERN COMMUNITIES SEWAGE WORKS
 TOWN OF LAKESHORE CLASS ENVIRONMENTAL ASSESSMENT ENVIRONMENTAL STUDY REPORT FOR LAKESHORE EASTERN COMMUNITIES SEWAGE WORKS Prepared for The Town of Lakeshore 419 Notre Dame Street, Belle River Ontario
Northport/Leelanau Township Wastewater Treatment Facility
 21 st Century Biofilm Reactors High Quality Yet Simple Operations Northport/Leelanau Township Wastewater Treatment Facility Presented by: Rich Grant, PE Carey Bond, PE Date Presented by: Rich Grant, PE
NPDES Permit No. IL0021695. Notice No. JCH:12012302.bah. Public Notice Beginning Date: November 27, 2012. Public Notice Ending Date: December 27, 2012
 Notice No. JCH:12012302.bah Public Notice/Fact Sheet Issued By: Public Notice Beginning Date: November 27, 2012 Public Notice Ending Date: December 27, 2012 National Pollutant Discharge Elimination System
 Bio-P Removal- Principles and examples in MI and elsewhere S. Joh Kang, Ph.D., P.E. Tetra Tech, Inc. Ann Arbor, MI 2010 Presentation Outline Optimization of Chemicals and Energy Bio-P Removal - Review
Maricopa Association of Governments. Technical Memorandum No. 1 INFRASTRUCTURE DEVELOPMENT COSTS. August 2001
 Maricopa Association of Governments Technical Memorandum No. 1 INFRASTRUCTURE DEVELOPMENT COSTS August 2001 3033 NORTH 44TH STREET, SUITE 101 PHOENIX, ARIZONA 85018 (602) 263-9500 FAX (602) 265-1422 Technical
Town of New Castle Utility Department Introduction
 Town of New Castle Utility Department Introduction Town of New Castle Utility Department Mission Statement Our commitment is to ensure that our customers receive high quality water and wastewater treatment
Process and Energy Audits at Water and Wastewater Facilities. Thomas Devine, CAP, CEM, LEED AP April 25 2012
 Process and Energy Audits at Water and Wastewater Facilities Thomas Devine, CAP, CEM, LEED AP April 25 2012 Presentation Outline Types of Audits Benchmarking Submetering Data Collection/Information Gathering
Ann Arbor Wastewater Treatment Plant Facilities Renovations Project September 2015
 Ann Arbor Wastewater Treatment Plant Facilities Renovations Project September 2015 The Facilities Master Plan was completed in 2004 and identified the need for improvements to the City of Ann Arbor s Wastewater
City of Riverside WASTEWATER COLLECTION AND TREATMENT FACILITIES INTEGRATED MASTER PLAN
 WASTEWATER COLLECTION AND TREATMENT FACILITIES INTEGRATED MASTER PLAN VOLUME 10: CAPITAL IMPROVEMENT PLAN AND OVERALL IMPLEMENTATION SCHEDULE CHAPTER 1: CAPITAL COSTS AND IMPLEMENTATION SCHEDULE FINAL
FAYETTEVILLE PUBLIC UTILITIES WATER AND SEWER DEPARTMENT SANITARY SEWER OVERFLOW CORRECTIVE ACTION PLAN
 FAYETTEVILLE PUBLIC UTILITIES WATER AND SEWER DEPARTMENT SANITARY SEWER OVERFLOW CORRECTIVE ACTION PLAN ENGINEERING REPORT 408 College Street, West Fayetteville, TN 37334 (931)433-1522 CONSOLIDATED TECHNOLOGIES,
Engineers Edge, LLC PDH & Professional Training
 510 N. Crosslane Rd. Monroe, Georgia 30656 (770) 266-6915 fax (678) 643-1758 Engineers Edge, LLC PDH & Professional Training Copyright, All Rights Reserved Engineers Edge, LLC An Introduction to Advanced
On-site Treatmentt for Domestic Wastewater in Thailand Suwanna. K. Boontanon Mahidol Univ. 2
 WEPA International Workshop 2013 Cambodia On-site Treatment for Domestic Wastewater in Thailand Suwanna Kitpati Boontanon Assistant Professor, Faculty of Engineering Mahidol University February 18, 2013
Energy Efficiency Strategies for Municipal Wastewater Treatment Facilities
 Energy Efficiency Strategies for Municipal Wastewater Treatment Facilities J. Daw and K. Hallett National Renewable Energy Laboratory J. DeWolfe and I. Venner Malcolm Pirnie, the Water Division of ARCADIS
Nutrient Removal at Wastewater Treatment Facilities. Nitrogen and Phosphorus. Gary M. Grey HydroQual, Inc. [email protected] 201 529 5151 X 7167
 Nutrient Removal at Wastewater Treatment Facilities Nitrogen and Phosphorus Gary M. Grey HydroQual, Inc. [email protected] 201 529 5151 X 7167 1 Agenda Nitrification and Denitrification Fundamentals
Membrane Bioreactor Performance Compared to Conventional Wastewater Treatment
 Technical Paper Membrane Bioreactor Performance Compared to Conventional Wastewater Treatment Authors: Thomas C. Schwartz and Brent R. Herring, Woodard and Curran Incorporated Ricardo Bernal and Janet
Energy Audits Waste Water Treatment Plants
 Energy Audits Waste Water Treatment Plants Ohio Water Environment Association Conference June 20, 2012 Presented by: Samuel J. Morgan, P.E., LEED AP CT Consultants, Inc. World Energy Trend US Total Energy
PERMITTEE/FACILITY NAME: City of Detroit Water and Sewerage Department / Detroit Wastewater Treatment Plant
 Permit No. MI0022802 FACT SHEET PERMITTEE/FACILITY NAME: City of Detroit / Detroit Wastewater Treatment Plant COUNTY: Wayne DESCRIPTION OF EXISTING WASTEWATER TREATMENT FACILITIES: The Detroit (DWSD) owns
WISCONSIN WASTEWATER OPERATORS ASSOCIATION
 Integrity. People. Knowledge. WISCONSIN WASTEWATER OPERATORS ASSOCIATION ANNUAL CONFERENCE GREEN BAY Resources. MEETING LOW LEVEL PHOSPHORUS LIMITS BY CHEMICAL ADDITION WHAT IS PHOSPHORUS Atomic # 15 Electron
BLUE PLAINS - WASHINGTON DC NUTRIENT & ENERGY RECOVERY FACILITY
 BLUE PLAINS - WASHINGTON DC NUTRIENT & ENERGY RECOVERY FACILITY DCWater - Mark Ramirez [email protected] 1 District of Columbia Water and Sewer Authority George S. Hawkins, General Manager Introduction
Experts Review of Aerobic Treatment Unit Operation and Maintenance. Bruce Lesikar Texas AgriLife Extension Service
 Experts Review of Aerobic Treatment Unit Operation and Maintenance Bruce Lesikar Texas AgriLife Extension Service Overview Overview of Aerobic Treatment Units Installing for accessibility to system components
Phosphorus Removal. Wastewater Treatment
 Phosphorus Removal In Wastewater Treatment by Derek Shires (512) 940-2393 [email protected] Why do we care? Eutrophication of surface water - Especially reservoirs Maximum agronomic uptake - Limiting
POTW PHOSPHORUS REMOVAL PROCESSES
 POTW PHOSPHORUS REMOVAL PROCESSES Ohio Lake Erie Phosphorus Task Force - December 20, 2007 ROBERT M. BONNETT, PE Northeast Ohio Regional Sewer District OUTLINE SOURCES AND FORMS IN WASTEWATER TYPICAL POTW
City of Richmond Department of Public Utilities
 City of Richmond Department of Public Utilities Wastewater Treatment Plant EMS Case Study Profile City of Richmond (COR), home to the James River, is in the heart of Virginia and known for its pleasant
Saudi Aramco Project Development
 Saudi Aramco Project Development Wastewater Treatment Facilities Jeddah Refinery And Marine Area December 2007 Facilities Planning Dept. OBJECTIVE: Provide an overview of the complexities of developing
Wastewater Treatment Facilities Plan City of Wenatchee, Washington
 Wastewater Treatment Facilities Plan City of Wenatchee, Washington 210 North Worthen Street Wenatchee, WA 98801 Contact: Steve Brewer (509) 664-3382 Prepared for City of Wenatchee November 2008 Prepared
Upper Occoquan Service Authority Centreville, Virginia A Case Study
 Upper Occoquan Service Authority Centreville, Virginia A Case Study Dennis Clough, Managing Director Energy Systems Group Upper Occoquan Service Authority About the Upper Occoquan Service Authority 54
Operation and Maintenance of Onsite Waster Systems in Maryland. A growing challenge for the industry and regulators
 Operation and Maintenance of Onsite Waster Systems in Maryland A growing challenge for the industry and regulators Operation and Maintenance of Onsite Waster Systems in Maryland New law and regulations
An Algae Based Treatment System Provides A Truly Sustainable Treatment Solution For Small & Seasonal Wastewater Treatment Plants
 An Algae Based Treatment System Provides A Truly Sustainable Treatment Solution For Small & Seasonal Wastewater Treatment Plants Agenda Small and Seasonal Plant Issues Algae and Bacteria in Symbiosis Cincinnati
Expanded Treatment Facilities within the City of Detroit
 Wastewater Master Plan DWSD Project No. CS-1314 Expanded Treatment Facilities within the City of Detroit Technical Memorandum Original Date: August 9, 2001 Revision Date: September 2003 Author: Tetra Tech
 IMPACT OF CHEMICALS ADDITION IN WATER/WASTEWATER TREATMENT ON TDS CONCENTRATION AND SLUDGE GENERATION Jurek Patoczka, PhD, PE Hatch Mott MacDonald 27 Bleeker Str., Millburn, NJ 07041 (973) 912 2541 [email protected]
Residuals Management Somersworth Drinking Water Treatment Facility. Ian Rohrbacher, Treatment Operator IV
 Residuals Management Somersworth Drinking Water Treatment Facility A HISTORICAL OVERVIEW OF SURFACE WATER TREATMENT RESIDUALS HANDLING Ian Rohrbacher, Treatment Operator IV Background We are a Grade III
Equipment and Instrument Tagging Requirements
 Sanitary Sewer Overflow (SSO) Control and Wastewater Facilities Program Equipment and Instrument Tagging Requirements City of Baton Rouge/Parish of East Baton Rouge Department of Public Works Submitted
OPTIMIZING BIOLOGICAL PHOSPHORUS REMOVAL FROM AN SBR SYSTEM MIDDLEBURY, VT. Paul Klebs, Senior Applications Engineer Aqua-Aerobic Systems, Inc.
 OPTIMIZING BIOLOGICAL PHOSPHORUS REMOVAL FROM AN SBR SYSTEM ABSTRACT MIDDLEBURY, VT Paul Klebs, Senior Applications Engineer Aqua-Aerobic Systems, Inc. The Middlebury Wastwater Treatment Plant, located
St. Petersburg, FL: Vehicle Use of Recycled Natural Gas Derived from Wastewater Biosolids
 U.S Department of Energy - Biomass 2014 St. Petersburg, FL: Vehicle Use of Recycled Natural Gas Derived from Wastewater Biosolids William Eleazer, PE Project Design Manager John Willis, PE, BCEE Project
Rehabilitation of Wastewater Treatment Plant of Sakhnin City in Israel by Using Advanced Technologies
 Rehabilitation of Wastewater Treatment Plant of Sakhnin City in Israel by Using Advanced Technologies Yasar Avsar 1, Hussein Tarabeah 2, Shlomo Kimchie 3, Izzet Ozturk 4, Hadi Naamneh 2 1 Yildiz Technical
This example of a completed sampling plan worksheet has been included to illustrate the information
 APPENDIX B EXAMPLE OF A COMPLETED SAMPLING PLAN WORKSHEET This example of a completed sampling plan worksheet has been included to illustrate the information necessary to document a sampling program for
BASIC MATH FORMULAS - CLASS I. A. Rectangle [clarifiers, ponds] I = length; w = width; A = area; area in square ft [sq ft]
![BASIC MATH FORMULAS - CLASS I. A. Rectangle [clarifiers, ponds] I = length; w = width; A = area; area in square ft [sq ft]](/thumbs/33/16418852.jpg "BASIC MATH FORMULAS - CLASS I. A. Rectangle [clarifiers, ponds] I = length; w = width; A = area; area in square ft [sq ft]") WASTEWATER MATH CONVERSION FACTORS 1. 1 acre =43,560 sq ft 2. 1 acre =2.47 hectares 3. 1 cu ft [of water] = 7.48 gallons 4. 1 cu ft [of water] = 62.4 Ibs/ft 3 5. Diameter =radius plus radius, D =r + r
WASTEWATER MATH CONVERSION FACTORS 1. 1 acre =43,560 sq ft 2. 1 acre =2.47 hectares 3. 1 cu ft [of water] = 7.48 gallons 4. 1 cu ft [of water] = 62.4 Ibs/ft 3 5. Diameter =radius plus radius, D =r + r
GUIDELINES FOR LEACHATE CONTROL
 GUIDELINES FOR LEACHATE CONTROL The term leachate refers to liquids that migrate from the waste carrying dissolved or suspended contaminants. Leachate results from precipitation entering the landfill and
DID YOU KNOW... THE IMPACT OF ON-SITE SEWAGE SYSTEMS AND ILLICIT DISCHARGES ON THE ROUGE RIVER
 DID YOU KNOW... THE IMPAT OF ON-SITE SEWAGE SYSTEMS AND ILLIIT DISHARGES ON THE ROUGE RIVER by Barry Johnson, P.E., M.S., amp Dresser & McKee and Dean Tuomari, Wayne ounty Department of Environment The
PRELIMINARY ENGINEERING REPORT AND UTILITY PLAN NEW WASTEWATER TREATMENT FACILITY TOWN OF MEAD FOR A FOR THE
 PRELIMINARY ENGINEERING REPORT AND UTILITY PLAN FOR A NEW WASTEWATER TREATMENT FACILITY FOR THE TOWN OF MEAD REVISED NOVEMBER 6, 2006 PRELIMINARY ENGINEERING REPORT AND UTILITY PLAN FOR A NEW WASTEWATER
Holistic Aeration and Chemical Optimization Saves Big Money from 1 MGD to 600 MGD. Trevor Ghylin, PE PhD
 Holistic Aeration and Chemical Optimization Saves Big Money from 1 MGD to 600 MGD Trevor Ghylin, PE PhD Outline Background Case Study: Sterno, Sweden (~1.8 MGD) 65% Aeration Energy Reduction Case Study:
CHAPTER 5 - WASTEWATER TREATMENT FACILITIES
 CHAPTER 5 - WASTEWATER TREATMENT FACILITIES 5.1 Introduction The purpose of this chapter is to summarize the evaluation of the existing wastewater facilities infrastructure and performance. The results
OPERATIONS & MAINTENANCE FY 2012-2013 Adopted Budget
 SERVICE DESCRIPTION To maintain all of the transferred and accepted infrastructure within the district including water, wastewater, and stormwater systems, streetlights, traffic signals, and landscaping
Example Calculations Evaluation for Fine Bubble Aeration System. Red Valve Company, Inc. 700 NORTH BELL AVENUE CARNEGIE, PA 15106-0548
 Revision Date 6/10/02 9:52 Red Valve Company, Inc. 700 NORTH BELL AVENUE CARNEGIE, PA 15106-0548 PHONE (412) 279-0044 FAX (412) 279-5410 Red Valve Representative Sample Air Diffuser Calcs.xls Input Data
SECTION 6 EXISTING WASTEWATER MANAGEMENT SYSTEMS
 SECTION 6 EXISTING WASTEWATER MANAGEMENT SYSTEMS This section will describe the Town s existing wastewater management systems. This includes on-site disposal systems and private collection systems. The
Raptor Septage Acceptance Plant. For Municipal Wastewater, Septage and Grease Trap Applications
 Raptor Septage Acceptance Plant For Municipal Wastewater, Septage and Grease Trap Applications The Lakeside Raptor Septage Acceptance Plant Many wastewater treatment plants process municipal, industrial,