Fingerprint Cards Q Results
|
|
|
- Emery West
- 10 years ago
- Views:
Transcription
1 Fingerprint Cards Q Results May 21, 2015

2 Q1 Summary

3 Key numbers from Q results Revenues Margins & profitability Market development Revenue of SEK 140 million, an increase of 33% q o q and an increase of 660% y o y Adjusted Gross Profit: SEK 50 million (SEK 9 million) Gross profit: SEK 37 million (SEK 4 million) EBITDA: SEK 7 million (SEK 22 million) EPS: loss of SEK 0.32 (loss of SEK 0.46) Accelerated growth in adoption of touch fingerprint sensors amongst OEMs LeTV announced LeTV Max using FPC1025 Newman announced Newman Button using FPC1020 Yulong launched Coolpad Tiptop Pro using FPC1025 Oppo launched R7 Plus with FPC1025
 Accelerated growth in adoption of touch fingerprint sensors amongst OEMs LeTV announced LeTV Max using FPC1025 Newman announced Newman Button")
4 Q Results vs. guidance Revenue Q1 15 Guidance (1) Approximately same as Q (105 million SEK) Q1 15 Results SEK 140 million 1. Guidance as of 26/2/2015 Orders received during the last part of Q resulted in higher revenues than the guidance provided in the year end report for 2014 Cash flow from operating activities positive during first quarter, thanks to sharp increase in revenues, prepayments from customers regarding deliveries to be made during second quarter, and lower increase in operating expenditure

5 Financial outlook

6 Q Guidance Q Outlook Revenue Q Operating result Q Revenues to amount to at least SEK 340 million Positive result expected Large share of orders backlog of SEK 364 million expected to generate revenues during Q2

7 2015 guidance Previous 2015 Guidance Current 2015 Guidance Revenue Exceed 1000 (1) Exceed 1500 million (2) Operating result Positive result expected 1. Guidance as of 24/10/ Guidance as of 18/5/2015 Based on our leading technology and broad portfolio our assessment is that we will capture a major part of the fast market growth we are now witnessing, and we therefore raise our revenue guidance for 2015 from will exceed MSEK to will exceed MSEK Positive operating result expected during 2015 No need for further capital injection foreseen

8 Business update

9 Recent market development Surge in interest from major OEMs to integrate touch fingerprint sensors in devices during 2015 Demand driven by compelling use cases, especially mobile payments

10 Fast adoption of FPC touch fingerprint sensors OEMs with FPC touch fingerprint sensors to date HTC, Huawei, Oppo, Newman, LeTV, Yulong/Coolpad Orders received for volume deliveries of entire FPC touch fingerprint sensor portfolio FPC1020, FPC1025, FPC1145, FPC1155, FPC1035

11 Product announcements FPC1140, FPC1145, FPC1022 and FPC1035 introduced Smallest touch fingerprint sensors introduced to date Major breakthrough in biometric performance for small touch fingerprint sensors Mass production in Q2 2015

12 Financial results
13 Quarterly financial development 2015 Q1 Revenue (SEK M) Adj. gross margin (%) % 47.0% 46.0% 44.2% 36.1% Q1'14 Q2'14 Q3'14 Q4'14 Q1'15 Cash and cash equivalents (SEK M) Q1'14 Q2'14 Q3'14 Q4'14 Q1'15 EPS after dilution(sek) Q1'14 Q2'14 Q3'14 Q4'14 Q1' Q1'14 Q2'14 Q3'14 Q4'14 Q1'
 Q1'14 Q2'14 Q3'14 Q4'14 Q1'15 307 238 191-0.32 102 121-0.")
14 Highlights Mar 31, 2014 Jun 3o, 2014 Sep 30, 2014 Dec 31, 2015 Mar 31, 2015 Change in cash and cash Equivalents (SEK Millions) Average number of employees Average number of employees + consultants Orders booked (SEK M) Q1'14 Q2'14 Q3'14 Q4'14 Q1'15
 364 41 63 50 71 Q1'14 Q2'14")
15 Financial statements

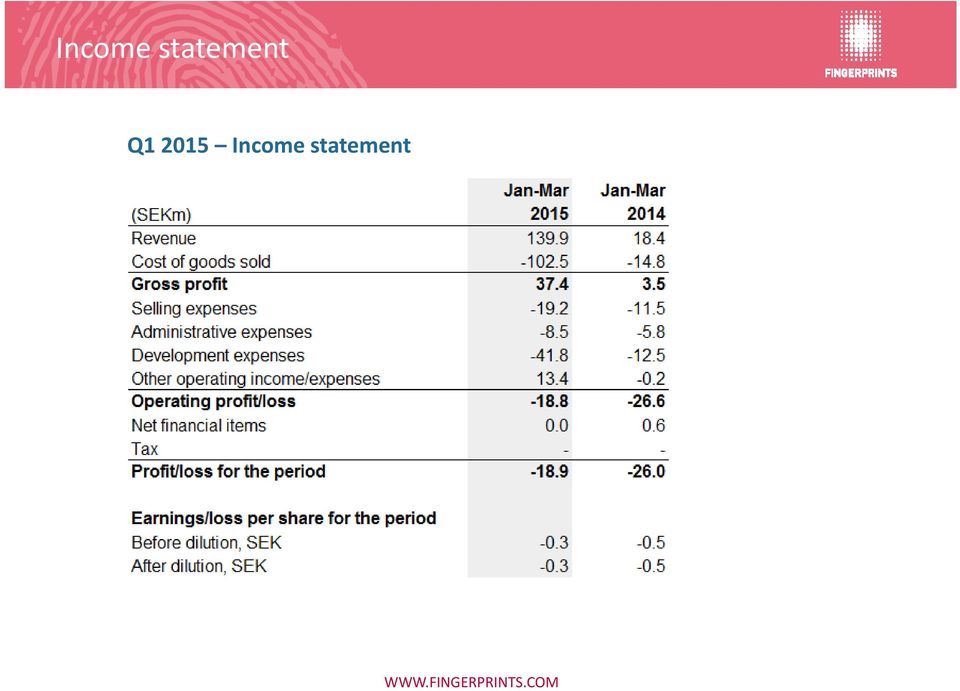
16 Income statement Q Income statement
17 Balance sheet Q Balance sheet (SEKm) 31 Mar 31 Mar 31 Dec Assets Intangible fixed assets Tangible fixed assets Financial fixed assets Total fixed assets Inventories Accounts receivables Other receivables Prepaid expenses and accrued income Cash and cash equivalents Total current assets Total assets Shareholders'equity and liabilities Shareholders' equity Non-current liabilities Accounts payable Other liabiltiies Accrued expenses and deferred income Total shareholders' equity and liabilities Pledged assets Contingent liabilities None None None

18 Cash flow statement Q Cash flow statement

19 Q&A

AGM 2015. Welcome! WWW.FINGERPRINTS.COM
 AGM 2015 Welcome! WWW.FINGERPRINTS.COM Business Concept FPC develops and sells leading biometric products and solutions to companies that develop systems for security and convenience. WWW.FINGERPRINTS.COM
Fingerprint Cards Company presentation. September, 2015
 Fingerprint Cards Company presentation September, 2015 1 Company Overview, Fingerprint Cards (FPC) Swedish biometry company established 1997 Offices in Sweden, Copenhagen, Tokyo, Seoul, Shanghai, Taipei,
2014 FIRST QUARTER RESULTS CONFERENCE CALL. May 15th, 2014
 2014 FIRST QUARTER RESULTS CONFERENCE CALL May 15th, 2014 DISCLAIMER This presentation has been prepared by Eurotech S.p.A.(or Eurotech ) and has to be read in conjunction with its oral presentation. The
Interim report January - March 2015
 Interim report January - March 2015 April 22 th 2015 Lars Wollung, CEO Erik Forsberg, CFO Q1 Key highlights Strong financial performance EBIT excluding revaluations and fx-impact +12% Investment grade
2015 FIRST HALF RESULTS CONFERENCE CALL. August 31st, 2015
 2015 FIRST HALF RESULTS CONFERENCE CALL August 31st, 2015 DISCLAIMER This presentation has been prepared by Eurotech S.p.A.(or Eurotech ) and has to be read in conjunction with its oral presentation. The
HTC CORPORATION 2Q15 BUSINESS REVIEW. CHIALIN CHANG, CFO & PRESIDENT OF GLOBAL SALES EDWARD WANG, VP OF FINANCE AUGUST 6 th, 2015
 HTC CORPORATION 2Q15 BUSINESS REVIEW CHIALIN CHANG, CFO & PRESIDENT OF GLOBAL SALES EDWARD WANG, VP OF FINANCE AUGUST 6 th, 2015 DISCLAIMER STATEMENT This presentation and release contain forward-looking
Pfeiffer Vacuum announces results for FY 2014
 PRESS RELEASE Pfeiffer Vacuum announces results for FY 2014 Total sales of 406,6 million EBIT margin at 11,0 percent Dividend proposal of 2.65 euros Asslar, Germany, March 26, 2015. Total sales for FY
PRECISE BIOMETRICS CORPORATE PRESENTATION
 VERIFIED BY YOU PRECISE BIOMETRICS CORPORATE PRESENTATION Håkan Persson CEO November 19, 2015 COMPANY OVERVIEW CONVENIENT AND SECURE IDENTITY AUTHENTICATION, FOR EVERYONE, EVERYWHERE. Founded in 1997 Nasdaq
As of December 31, 2014. As of December 31, 2015. Assets Current assets:
 Assets Current assets: Alphabet Inc. CONSOLIDATED BALANCE SHEETS (In millions, except share and par value amounts which are reflected in thousands, and par value per share amounts) As of December 31, 2014
NORWEGIAN CRUISE LINE HOLDINGS LTD. CONSOLIDATED STATEMENTS OF OPERATIONS (unaudited, in thousands, except share and per share data)
") CONSOLIDATED STATEMENTS OF OPERATIONS (unaudited, in thousands, except share and per share data) Revenue Passenger ticket $ 583,923 $ 490,322 $ 1,400,470 $ 1,257,871 Onboard and other 213,962 184,089 569,479
CONSOLIDATED STATEMENTS OF OPERATIONS (unaudited, in thousands, except share and per share data) Revenue Passenger ticket $ 583,923 $ 490,322 $ 1,400,470 $ 1,257,871 Onboard and other 213,962 184,089 569,479
HTC CORPORATION 4Q15 BUSINESS REVIEW. CHIALIN CHANG, CFO & PRESIDENT OF GLOBAL SALES EDWARD WANG, VP OF FINANCE February 3, 2016
 HTC CORPORATION 4Q15 BUSINESS REVIEW CHIALIN CHANG, CFO & PRESIDENT OF GLOBAL SALES EDWARD WANG, VP OF FINANCE February 3, 2016 DISCLAIMER STATEMENT This presentation and release contain forward-looking
SHARPENING STRATEGIC FOCUS
 SHARPENING STRATEGIC FOCUS RESULTS FIRST HALF-YEAR 2014 August 1, 2014 Disclaimer This document contains certain statements and expectations that are forward looking, and which are based on information
Un-audited Consolidated Financials Results for the Quarter ended 30th September 2015.
 8K MILES SOFTWARE SERVICES LTD Un-audited Consolidated Financials Results for the Quarter ended 30th September 2015. I For the Quarter Ended Rupees in Lakhs Year ended 30-Sep-15 30-Jun-15 30-Sep-14 31-Mar-15
FINGERPRINT CARDS. Moderator: Jens Reckman August 20, 2015 14:00 GMT
 Page 1 FINGERPRINT CARDS August 20, 2015 14:00 GMT OPERATOR: This is Conference #: 15047931 Thank you for standing by and welcome to the Q2 Report 2015 Conference Call. At this time, all participants are
ASML - Summary IFRS Consolidated Statement of Profit or Loss 1,2
 ASML - Summary IFRS Consolidated Statement of Profit or Loss 1,2 Three months ended, Nine months ended, Sep 28, Sep 27, Sep 28, Sep 27, 2014 2015 2014 2015 Net system sales 884.5 975.3 3,157.5 3,356.3
ASML - Summary IFRS Consolidated Statement of Profit or Loss 1,2
 ASML - Summary IFRS Consolidated Statement of Profit or Loss 1,2 Three months ended, Mar 30, Mar 29, 2014 2015 Net system sales 1,030.0 1,246.5 Net service and field option sales 366.5 403.4 Total net
TomTom Q4 2012 results. Harold Goddijn CEO Marina Wyatt CFO 12 February 2013
 TomTom Q4 2012 results Harold Goddijn CEO Marina Wyatt CFO 12 February 2013 Summary of results Revenue of 1,057 million and adjusted EPS of 0.40 PND market performed as expected Automotive affected by
Total comprehensive income/loss N/A N/A N/A -46 69 23 67 28 95-2 -15-17 -639-85 -724
 Effects of amendments to IAS 19 Employee Benefits Up until 31 December, Nobia applied the corridor method when recognising the Group's pension liabilities. The updated standard, IAS 19 Employee Benefits,
ASML - Summary IFRS Consolidated Statement of Profit or Loss 1,2
 ASML - Summary IFRS Consolidated Statement of Profit or Loss 1,2 Three months ended, Six months ended, Jun 29, Jun 28, Jun 29, Jun 28, 2014 2015 2014 2015 Net system sales 1,243.0 1,134.5 2,273.0 2,381.0
TRANSACTIONS ANALYSIS EXAMPLE. Maxwell Partners Medical Diagnostic Services report the following information for 2011, their first year of operations:
 TRANSACTIONS ANALYSIS EXAMPLE Maxwell Partners Medical Diagnostic Services report the following information for 2011, their first year of operations: 1. Billings to clients for services provided: $350,000
ASML - Summary US GAAP Consolidated Statements of Operations 1,2
 ASML - Summary US GAAP Consolidated Statements of Operations 1,2 (in millions EUR, except per share data) Six months ended, Jun 29, Jun 28, Jun 29, Jun 28, 2014 2015 2014 2015 Net system sales 1,243.0
Conference call on 2014 half year results 13 August 2014
 Conference call on 2014 half year results 13 August 2014 IMCD IMCD Group N.V. Disclaimer Forward looking statements This half year report contains forward looking statements. These statements are based
TomTom reports first quarter 2012 results
 De Ruyterkade 154 1011 AC Amsterdam, The Netherlands corporate.tomtom.com [email protected] 25 April 2012 TomTom reports first quarter 2012 results Financial headlines - Group revenue of 233 million - Content
Second Quarter Results of Operations
 PRESS RELEASE Besi Posts Strong Q2 and H1-15 Results. Significant Expansion of Net Cash Position vs. 14 Duiven, the Netherlands, July 23, - BE Semiconductor Industries N.V. (the Company" or "Besi") (Euronext
BUY. KELLTON TECH SOLUTIONS LTD Result Update (CONSOLIDATED): Q1 FY16. CMP 226.50 Target Price 260.00. JANUARY 9 th 2015 SYNOPSIS ISIN: INE164B01022
: Q1 FY16. CMP 226.50 Target Price 260.00. JANUARY 9 th 2015 SYNOPSIS ISIN: INE164B01022") BUY CMP 226.50 Target Price 260.00 KELLTON TECH SOLUTIONS LTD Result Update (CONSOLIDATED): Q1 FY16 JANUARY 9 th 2015 ISIN: INE164B01022 Index Details Stock Data Sector IT Software Products BSE Code 519602
BUY CMP 226.50 Target Price 260.00 KELLTON TECH SOLUTIONS LTD Result Update (CONSOLIDATED): Q1 FY16 JANUARY 9 th 2015 ISIN: INE164B01022 Index Details Stock Data Sector IT Software Products BSE Code 519602
The Nature of Accounting Systems
 Basic Accounting & Budgeting February 4, 2009 The Nature of Accounting Systems Accounting is the process of recording, classifying, summarizing, reporting and interpreting information about the economic
Management forecasts sales and earnings improvements of between 6% and 8% for 2013 as a whole
 Press Release HUGO BOSS Nine Months Results 203 HUGO BOSS increases sales and profitability Accelerating growth momentum in Group s own retail business supports sales expansion in third quarter Rise in
For Immediate Release Toronto Stock Exchange Symbol: RC
 For Immediate Release Toronto Stock Exchange Symbol: RC RDM Corporation Reports Third Quarter Financial Results Payment Processing Services Revenue grows 15% year over year WATERLOO, ON, July 26, 2012
PEER GROUPS CMP MARKET CAP EPS P/E (X) P/BV(X) DIVIDEND Company Name (Rs.) Rs. in mn. (Rs.) Ratio Ratio (%)
 P/BV(X) DIVIDEND Company Name (Rs.) Rs. in mn. (Rs.) Ratio Ratio (%)") BUY CMP 170.30 Target Price 196.00 GEOMETRIC LTD Result Update (CONSOLIDATED): Q2 FY16 DECEMBER 17 th 2015 ISIN: INE797A01021 12 th h, 2013 Index Details Stock Data Sector IT Consulting & Software BSE
BUY CMP 170.30 Target Price 196.00 GEOMETRIC LTD Result Update (CONSOLIDATED): Q2 FY16 DECEMBER 17 th 2015 ISIN: INE797A01021 12 th h, 2013 Index Details Stock Data Sector IT Consulting & Software BSE
2015 FULL YEAR RESULTS CONFERENCE CALL. March 14th, 2016
 2015 FULL YEAR RESULTS CONFERENCE CALL March 14th, 2016 DISCLAIMER This presentation has been prepared by Eurotech S.p.A.(or Eurotech ) and has to be read in conjunction with its oral presentation. The
CONSOLIDATED STATEMENT OF INCOME
 CONSOLIDATED STATEMENT OF INCOME 4 th quarter (a) 3 rd quarter 4 th quarter 2009 Sales 40,157 40,180 36,228 Excise taxes (4,397) (4,952) (4,933) Revenues from sales 35,760 35,228 31,295 Purchases, net
Financial Results. siemens.com
 s Financial Results Fourth Quarter and Fiscal 2015 siemens.com Key figures (in millions of, except where otherwise stated) Volume Q4 % Change Fiscal Year % Change FY 2015 FY 2014 Actual Comp. 1 2015 2014
For the three months ended March 31, 2001 2000. Net sales $ 1,921 $ 1,351 Cost of sales 1,112 788. Gross margin 809 563
 Pro Forma Consolidated Statements of Income Excluding Amortization of Purchased Intangibles and Goodwill, Purchased In-Process Research and Development, Acquisition-Related Costs and Non-Recurring Items
Definitions of Terms
 Definitions of Terms Operating and financial measures are utilized by T-Mobile's management to evaluate its operating performance and, in certain cases, its ability to meet liquidity requirements. Although
Third quarter results as of December 31, 2014. Investor presentation
 Third quarter results as of December 31, 2014 Investor presentation February, 26 th 2015 Disclaimer Certain statements included or incorporated by reference within this presentation may constitute forwardlooking
Audited (Restated) (*)
 (*)") 31 December 2015 31 December 2014 31 December 2013 ASSETS Current assets 459.875.342 251.625.938 233.029.758 Cash and cash equivalents 5 123.908.125 123.909.277 101.043.123 Financial investments 6 -- 15.126.664
31 December 2015 31 December 2014 31 December 2013 ASSETS Current assets 459.875.342 251.625.938 233.029.758 Cash and cash equivalents 5 123.908.125 123.909.277 101.043.123 Financial investments 6 -- 15.126.664
CREDEMHOLDING: THE BOARD APPROVED FY14 AND 1Q15 RESULTS. DIVIDEND AT 1.75 EURO PER SHARE (+17% YoY)
") CREDEMHOLDING: THE BOARD APPROVED FY14 AND 1Q15 RESULTS. DIVIDEND AT 1.75 EURO PER SHARE (+17% YoY) FY14 Resuls The Board of Directors of Credemholding, the holding company owning a stake of 76.9% in Credito
CREDEMHOLDING: THE BOARD APPROVED FY14 AND 1Q15 RESULTS. DIVIDEND AT 1.75 EURO PER SHARE (+17% YoY) FY14 Resuls The Board of Directors of Credemholding, the holding company owning a stake of 76.9% in Credito
Luxottica s net income from continuing operations for fiscal year 2006 rises by 100 million or by 30% Cash dividend for FY 2006 to increase by 45%
 Luxottica s net income from continuing operations for fiscal year 2006 rises by 100 million or by 30% Cash dividend for FY 2006 to increase by 45% Milan, Italy March 5, 2007 - Luxottica Group S.p.A. (NYSE:
FURTHER PROFIT GROWTH IN FIRST-HALF 2015
 FURTHER PROFIT GROWTH IN FIRST-HALF 2015 Net sales of 37.7bn, up +5.2% (+2.9% on an organic basis) Growth in Recurring Operating Income: 726m, +2.6% at constant rates Strong growth in adjusted net income,
Consolidated balance sheet
 83 Consolidated balance sheet December 31 Non-current assets Goodwill 14 675.1 978.4 Other intangible assets 14 317.4 303.8 Property, plant, and equipment 15 530.7 492.0 Investment in associates 16 2.5
Q2 2015 Financial Results and Key Metrics
 Q2 2015 Financial Results and Key Metrics August 13, 2015 Non-GAAP financial measures King Digital Entertainment plc (the Company ) uses International Financial Reporting Standards ( IFRS ). In addition
JOHN WILEY & SONS, INC. UNAUDITED SUMMARY OF OPERATIONS FOR THE FIRST QUARTER ENDED JULY 31, 2011 AND 2010 (in thousands, except per share amounts)
") UNAUDITED SUMMARY OF OPERATIONS FOR THE FIRST QUARTER ENDED JULY 31, 2011 AND 2010 (in thousands, except per share amounts) US GAAP First Quarter Ended Revenue $ 430,069 407,938 5% Costs and Expenses Cost
UNAUDITED SUMMARY OF OPERATIONS FOR THE FIRST QUARTER ENDED JULY 31, 2011 AND 2010 (in thousands, except per share amounts) US GAAP First Quarter Ended Revenue $ 430,069 407,938 5% Costs and Expenses Cost
ACORN ENERGY ANNOUNCES FISCAL YEAR 2014 RESULTS
 ACORN ENERGY ANNOUNCES FISCAL YEAR 2014 RESULTS Wilmington, DE March 31, 2015 Acorn Energy, Inc. (NASDAQ: ACFN), an energy technology holding company, today announced its results for the fiscal year ended
Software AG Results 1 st Quarter 2015 (IFRS, unaudited)
") Software AG Results 1 st Quarter (IFRS, unaudited) April 29, 1 Safe Harbor This presentation includes forward-looking statements based on the beliefs of Software AG management. Such statements reflect
Software AG Results 1 st Quarter (IFRS, unaudited) April 29, 1 Safe Harbor This presentation includes forward-looking statements based on the beliefs of Software AG management. Such statements reflect
Third quarter results FY2015. August 17, 2015
 Third quarter results FY2015 August 17, 2015 Disclaimer Stabilus S.A. (the Company, later Stabilus ) has prepared this presentation solely for your information. It should not be treated as giving investment
FINANCIAL RESULTS Q1 2012. 16 May 2012
 FINANCIAL RESULTS Q1 2012 16 May 2012 Highlights Q1 2012 Satisfactory Q1 financials underlying EBITDA and profit before tax on a par with Q1 2011 - Lower power prices partly offset by increased power generation
BUSINESS PLAN TEMPLATE
 iplanner.net Small Business Plans Online BUSINESS PLAN TEMPLATE For a start-up company 18/01/2012 12:33:19(GMT) Executive Summary... 3 Business Overview... 3 Products and Services... 3 Sales Forecast...
Operating Working Capital Drills
 Operating Working Capital Drills Operating Working Capital Drills 1. Use IBM s balance sheet below to calculate 2010 and 2011 working capital and operating working capital. Your VP has told you to consider
MAGAL SECURITY SYSTEMS REPORTS FOURTH QUARTER 2008 AND YEAR-END 2008 FINANCIAL RESULTS
 FOR IMMEDIATE RELEASE MAGAL SECURITY SYSTEMS REPORTS FOURTH QUARTER 2008 AND YEAR-END 2008 FINANCIAL RESULTS YAHUD, ISRAEL, July 13, 2009 -- Magal Security Systems Ltd. (NASDAQ GMS: MAGS, TASE: MAGS) today
(2)Adoptions of simplified accounting methods and accounting methods particular to the presentation of quarterly financial statements: None
Adoptions of simplified accounting methods and accounting methods particular to the presentation of quarterly financial statements: None") Financial Statement for the Six Months Ended September 30, 2015 Name of listed company: Mipox Corporation Stock Code: 5381 (URL http://www.mipox.co.jp) Name and Title of Representative: Jun Watanabe, President
Financial Statement for the Six Months Ended September 30, 2015 Name of listed company: Mipox Corporation Stock Code: 5381 (URL http://www.mipox.co.jp) Name and Title of Representative: Jun Watanabe, President
HOPKINTON, Mass., April 24, 2013 - HIGHLIGHTS:
 HOPKINTON, Mass., April 24, 2013 - HIGHLIGHTS: Record first-quarter revenue, non-gaap net income, non-gaap EPS, operating cash flow and free cash flow Year-over-year revenue growth across U.S. and major
CASH FLOW CALCULATION: THE IMPORTANCE OF WORKING CAPITAL
 CASH FLOW CALCULATION: THE IMPORTANCE OF WORKING CAPITAL Lesson 5 Castellanza, 15 th October 2014 SUMMARY Financial statements a brief review Financial statements and cash flows The cash source / cash
OPTION REPORTS SECOND HALF YEAR AND FULL YEAR 2011 RESULTS
 OPTION REPORTS SECOND HALF YEAR AND FULL YEAR 2011 RESULTS Leuven, Belgium March 1, 2012 Option N.V. (EURONEXT Brussels: OPTI; OTC: OPNVY), a global leader in wireless connectivity, security and experience,
! "#$ %&!& "& ' - 3+4 &*!&-.,,5///2!(.//+ & $!- )!* & % +, -).//0)& 7+00///2 *&&.4 &*!&- 7.00///2 )!*.//+ 8 -!% %& "#$ ) &!&.
!* & % +, -).//0)& 7+00///2 *&&.4 &*!&- 7.00///2 )!*.//+ 8 -!% %& #$ ) &!&.") ! "#!""#$%$#$#$"& $'"()*+,$-).,/ 012! "#$ %&!& "& '!(&)!*&%+,-).//0 -#$#3-4' &,'1$1# $!-!(.//0)& +01+///2 *&& - 3+4 &*!&-.,,5///2!(.//+ &!(!-6%(!(.//.$(!(.//0)& 01,///2 //+2% &*!&- 5,0///2 //32%!(.//+
! "#!""#$%$#$#$"& $'"()*+,$-).,/ 012! "#$ %&!& "& '!(&)!*&%+,-).//0 -#$#3-4' &,'1$1# $!-!(.//0)& +01+///2 *&& - 3+4 &*!&-.,,5///2!(.//+ &!(!-6%(!(.//.$(!(.//0)& 01,///2 //+2% &*!&- 5,0///2 //32%!(.//+
Consolidated Balance Sheets
 Consolidated Balance Sheets March 31 2015 2014 2015 Assets: Current assets Cash and cash equivalents 726,888 604,571 $ 6,057,400 Marketable securities 19,033 16,635 158,608 Notes and accounts receivable:
China Cord Blood Corporation Reports Financial Results for the Fourth Quarter and Full Year Fiscal 2010
 China Cord Blood Corporation Reports Financial Results for the Fourth Quarter and Full Year Fiscal 2010 Annual Revenue up 34.4% to RMB 261.5 Million Fiscal 2010 New Subscribers grew 30.5% Conference Call
Q1 2014 Earnings Call. April 30 th, 2014
 Q1 2014 Earnings Call April 30 th, 2014 Agenda Executive summary Financial data Outlook 2014 Appendix 2 Summary Q1 2014 (1) Revenue growth factors Positive start in FY 2014 with Q1 revenue increase of
Quarterly Financial Results for the Fiscal Year Ending September 30, 2016 (J-GAAP)
") February 10, 2016 Quarterly Financial Results for the Fiscal Year Ending September 30, 2016 (J-GAAP) (1st Quarter / October 1, 2015 December 31, 2015) Company Name Hosokawa Micron Corporation Stock Exchange
February 10, 2016 Quarterly Financial Results for the Fiscal Year Ending September 30, 2016 (J-GAAP) (1st Quarter / October 1, 2015 December 31, 2015) Company Name Hosokawa Micron Corporation Stock Exchange
Alphabet Announces Fourth Quarter and Fiscal Year 2015 Results
 Exhibit 99.1 Alphabet Announces Fourth Quarter and Fiscal Year 2015 Results MOUNTAIN VIEW, Calif. February 1, 2016 Alphabet Inc. (NASDAQ: GOOG, GOOGL) today announced financial results for the quarter
Income Statement (1) First Quarter 2002
 First Quarter 2002") Income Statement (1) (in millions of EUR) 1 st Q 2002 1 st Q 2001 2002/2001 Sales 5,402.2 4,993.6 +8.2% (2) EBITDA (FIFO) 408.7 366.1 +11.6% EBITDA margin 7.6% 7.3% - Depreciation (145.5) (134.6) +8.1%
Income Statement (1) (in millions of EUR) 1 st Q 2002 1 st Q 2001 2002/2001 Sales 5,402.2 4,993.6 +8.2% (2) EBITDA (FIFO) 408.7 366.1 +11.6% EBITDA margin 7.6% 7.3% - Depreciation (145.5) (134.6) +8.1%
3. CONSOLIDATED QUARTERLY FINANCIAL STATEMENTS
 3. CONSOLIDATED QUARTERLY FINANCIAL STATEMENTS (1) Consolidated Quarterly Balance Sheets September 30, 2014 and March 31, 2014 Supplementary Information 2Q FY March 2015 March 31, 2014 September 30, 2014
Kuehne + Nagel International AG Analyst Conference Call Q1 results 2015. April 14, 2015 (CET 14.00) Schindellegi, Switzerland
 Schindellegi, Switzerland") Kuehne + Nagel International AG Analyst Conference Call Q1 results 2015 (CET 14.00) Schindellegi, Switzerland Forward-looking statements This presentation contains forward-looking statements. Such statements
Kuehne + Nagel International AG Analyst Conference Call Q1 results 2015 (CET 14.00) Schindellegi, Switzerland Forward-looking statements This presentation contains forward-looking statements. Such statements
1 CONSOLIDATED FINANCIAL STATEMENTS (1) Consolidated Balance Sheets
 Consolidated Balance Sheets") 1 CONSOLIDATED FINANCIAL STATEMENTS (1) Consolidated Balance Sheets As of March 31,2014 As of March 31,2015 Assets Cash and due from banks 478,425 339,266 Call loans and bills bought 23,088 58,740 Monetary
1 CONSOLIDATED FINANCIAL STATEMENTS (1) Consolidated Balance Sheets As of March 31,2014 As of March 31,2015 Assets Cash and due from banks 478,425 339,266 Call loans and bills bought 23,088 58,740 Monetary
Interim report 1st quarter 2016
 Interim report 1st quarter 2016 About Komplett Bank ASA Komplett Bank ASA started banking operations on 21 March 2014 when the company received its banking licence from the Norwegian authorities. Komplett
Consolidated balance sheet
 Consolidated balance sheet Non current assets 31/12/2009 31/12/2008 (*) 01/01/2008 (*) Property, plant and equipment 1,352 1,350 1,144 Investment property 7 11 11 Fixed assets held under concessions 13,089
Operating Revenues Service revenues and other $ 28,217 $ 28,611 (1.4) Wireless equipment revenues 3,954 3,373 17.2 Total Operating Revenues
 Wireless equipment revenues 3,954 3,373 17.2 Total Operating Revenues") Condensed Consolidated Statements of Income (dollars in millions, except per share amounts) Operating Revenues Service revenues and other $ 28,217 $ 28,611 (1.4) Wireless equipment revenues 3,954 3,373
Condensed Consolidated Statements of Income (dollars in millions, except per share amounts) Operating Revenues Service revenues and other $ 28,217 $ 28,611 (1.4) Wireless equipment revenues 3,954 3,373
MILLICOM INTERNATIONAL CELLULAR S.A.
 MILLICOM INTERNATIONAL CELLULAR S.A. FOR IMMEDIATE RELEASE April 20, 2004 MILLICOM INTERNATIONAL CELLULAR S.A. ANNOUNCES RESULTS FOR THE QUARTER ENDED MARCH 31, 2004 54% increase in revenues for Q1 04
ASMPT ANNOUNCES 2013 INTERIM RESULTS * * * Net Profits Surged 28 Times Over The First Quarter
 [For Immediate Release] ASMPT ANNOUNCES 2013 INTERIM RESULTS * * * Net Profits Surged 28 Times Over The First Quarter Highlights Second Quarter of 2013 Group turnover of US$367.1 million, a significant
EMERSON AND SUBSIDIARIES CONSOLIDATED OPERATING RESULTS (AMOUNTS IN MILLIONS EXCEPT PER SHARE, UNAUDITED)
") CONSOLIDATED OPERATING RESULTS (AMOUNTS IN MILLIONS EXCEPT PER SHARE, UNAUDITED) TABLE 1 Quarter Ended March 31, Percent Change Net Sales $ 5,854 $ 5,919 1% Costs and expenses: Cost of sales 3,548 3,583
CONSOLIDATED OPERATING RESULTS (AMOUNTS IN MILLIONS EXCEPT PER SHARE, UNAUDITED) TABLE 1 Quarter Ended March 31, Percent Change Net Sales $ 5,854 $ 5,919 1% Costs and expenses: Cost of sales 3,548 3,583
Full Year Results 2014
 Full Year Results 2014 18 March 2015 Conference call on FY Results 2014 Corporate Finance & Investor Relations AGENDA FY 2014 results presentation Highlights 2014 Financials 2014 Outlook 2015 Appendix
Tower International Reports Solid Third Quarter And Raises Full Year Outlook
 FOR IMMEDIATE RELEASE Tower International Reports Solid Third Quarter And Raises Full Year Outlook LIVONIA, Mich., November 3, 2011 Tower International, Inc. [NYSE: TOWR], a leading integrated global manufacturer
NETFLIX REPORTS PRO-FORMA NET INCOME ON RECORD 4 th QUARTER 2002 REVENUE
 FOR RELEASE AT 1:02 PM PDT IR CONTACT: Barry McCarthy Wednesday, January 15, 2003 CFO 408 399-3740 PR CONTACT: Lynn Brinton Director of Corporate Communications 408 399-3726 NETFLIX REPORTS PRO-FORMA NET
OPAP S.A. Interim Consolidated Financial Results for the Three Months ended March 31st, 2010
 OPAP S.A. Interim Consolidated Financial Results for the Three Months ended March 31st, 2010 Revenue down 6.2% to 1,372.4m (Q1 2009: 1,462.7m) EBITDA down 11.8% to 261.8m (Q1 2009: 296.9m) Net profit down
People & Print Conference Call Q1 Results 2015 12 May 2015
 People & Print Conference Call Q1 Results 2015 12 May 2015 Claus Bolza-Schünemann, CEO Mathias Dähn, CFO Agenda Highlights Q1 2015 Business performance Q1 2015 Outlook and strategy KBA Conference Call
2013 Second Quarter Review July 26, 2013 1
 213 Second Quarter Review July 26, 213 1 Panalpina Group Basel, July 26, 213 213 Second Quarter Review 213 Second Quarter Review July 26, 213 2 Highlights and key figures Operating and financial review
Full-year results 2014. December 02, 2014
 Full-year results 2014 December 02, 2014 Disclaimer Stabilus S.A. (the Company, later Stabilus ) has prepared this presentation solely for your information. It should not be treated as giving investment
Quarterly Report Q1 Financial Year 2014 / 2015 NEW HORIZONS OPPORTUNITIES
 Quarterly Report Q1 Financial Year 2014 / 2015 150 NEW HORIZONS OPPORTUNITIES ISRA VISION Quarterly Report Q1 Financial Year 2014 / 2015 2 ISRA VISION AG: 1st Quarter 2014/2015 revenues rise by 9%, EBT
FREIGHTWAYS LIMITED $241,760 11% $26,307 21% $26,307 21% Interim Dividend Gross amount per share Imputed amount per share 16.6667 cents 4.
 FREIGHTWAYS LIMITED Results for announcement to the market Reporting Period 6 months to 31 December 2014 Previous Reporting Period 6 months to 31 December 2013 Revenue from ordinary activities Profit (loss)
Summary of Financial Report for the FY ending March 2015 (Non-Consolidated)
") Summary of Financial Report for the FY ending March 2015 (Non-Consolidated) April 30, 2015 Listed Company Name: Japan Tissue Engineering Co., Ltd. Listed Securities Exchange: JQ Stock Code: 7774 URL http://www.jpte.co.jp
Summary of Financial Report for the FY ending March 2015 (Non-Consolidated) April 30, 2015 Listed Company Name: Japan Tissue Engineering Co., Ltd. Listed Securities Exchange: JQ Stock Code: 7774 URL http://www.jpte.co.jp
MGC Diagnostics Corporation Reports Fiscal Year 2015 Financial Results
 MGC Diagnostics Corporation 350 Oak Grove Parkway Saint Paul, MN 55127 Telephone: (651) 484-4874 Facsimile: (651) 484-4826 FOR IMMEDIATE RELEASE MGC Diagnostics Corporation Reports Fiscal Year 2015 Financial
INTERIM REPORT Q2 2013
 INTERIM REPORT Q2 2013 April June 2013 Betting turnover: 127,865 KEUR (170,589) Net turnover after trading fees: 502 KEUR (842) Gross margin: 0.39% (0.49) 1 Operating income: -255 KEUR (3) Operating margin:
GERRY WEBER International AG Report on the first three months of 2005/2006 Report on the three-month period ended January 31, 2006 ISIN: DE0003304101
 GERRY WEBER International AG Report on the first three months of 2005/2006 Report on the three-month period ended January 31, 2006 ISIN: DE0003304101 The GERRY WEBER share Building on its excellent price
APPENDIX 1 The Statement of Financial Position
 APPENDIX 1 The Statement of Financial Position 1. Assets: the resources of the organization which are used to provide service and generate value 2. Current assets: assets which can be converted to cash
NET TURİZM TİCARET VE SANAYİ ANONİM ŞİRKETİ AND ITS SUBSIDIARIES CONSOLIDATED FINANCIAL STATEMENTS FOR THE PERIOD ENDED AT 31 MARCH 2014
 NET TURİZM TİCARET VE SANAYİ ANONİM ŞİRKETİ AND ITS SUBSIDIARIES CONSOLIDATED FINANCIAL STATEMENTS FOR THE PERIOD ENDED AT 31 MARCH 2014 CONTENTS CONSOLIDATED BALANCE SHEETS CONSOLIDATED STATEMENTS OF
Consolidated revenue for the period is 21 822 (18 694) KSEK, up 17% compared to the same period last year.
 KSEK, up 17% compared to the same period last year.") Financial and operational highlights April June 2013 Consolidated revenue for the period is 21 822 (18 694) KSEK, up 17% compared to the same period last year. Operating result for the period is 4 524
Financial and operational highlights April June 2013 Consolidated revenue for the period is 21 822 (18 694) KSEK, up 17% compared to the same period last year. Operating result for the period is 4 524
Preliminary Results. 3 March 2015
 Preliminary Results 3 March 2015 Matthew Price Chief Financial Officer Trading strongly & investing in technology Revenue EBITDA (adjusted) EPS (adjusted) 248M 95M 12.3p 10% 13% 14% Capital Investment
SETTING UP YOUR BUSINESS ACCOUNTING SYSTEM
 100 Arbor Drive, Suite 108 Christiansburg, VA 24073 Voice: 540-381-9333 FAX: 540-381-8319 www.becpas.com Providing Professional Business Advisory & Consulting Services Douglas L. Johnston, II [email protected]
Growth in the business area Fingerprint Technology
 LUND, MAY 12 th, 2015 Growth in the business area Fingerprint Technology PRECISE BIOMETRICS AB (PUBL), CORPORATE IDENTIYTY NR 556545-6596 INTERIM REPORT JANUARY-MARCH 2015 The group s net sales for the
UNAUDITED PRO FORMA STATEMENT OF FINANCIAL POSITION AND STATEMENT OF COMPREHENSIVE INCOME OF HOLDSPORT
 Holdsport Limited (incorporated in the Republic of South Africa) (Registration number 2006/022562/06) JSE share code: HSP ISIN: ZAE000157046 ("Holdsport" or the "Company") UNAUDITED PRO FORMA STATEMENT
First Quarter Fiscal 2010 Results Presentation
 First Quarter Fiscal 2010 Results Presentation March 2, 2010 Safe Harbor Statement This announcement contains forward-looking statements. These statements are made under the safe harbor provisions of the